
Chemistry and Photochemistry of Anthocyanins and Related Compounds: A Thermodynamic and Kinetic Approach


Abstract
:1. Introduction
1.1. The Flavylium-Based Multistate—A Brief History
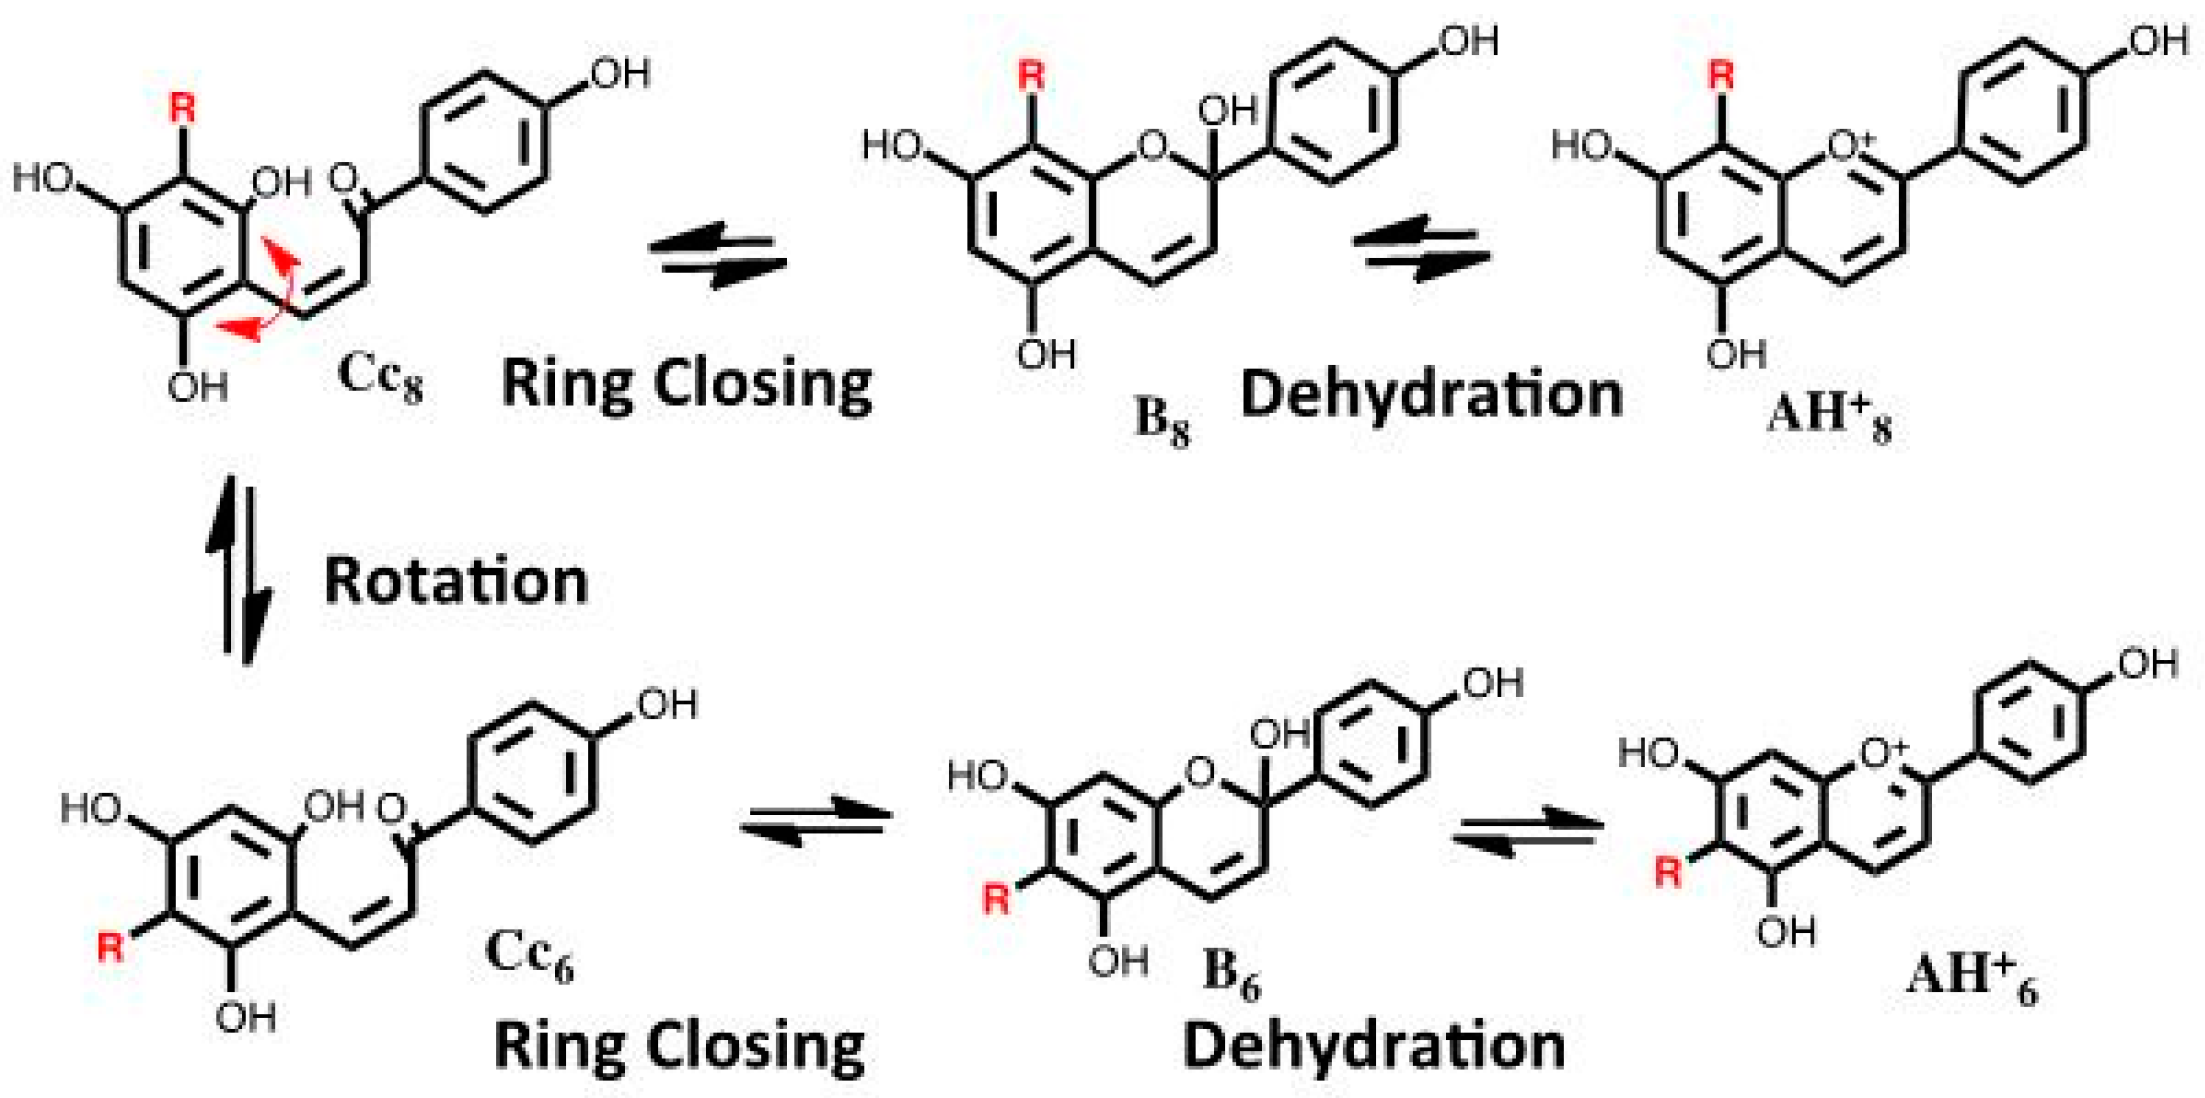
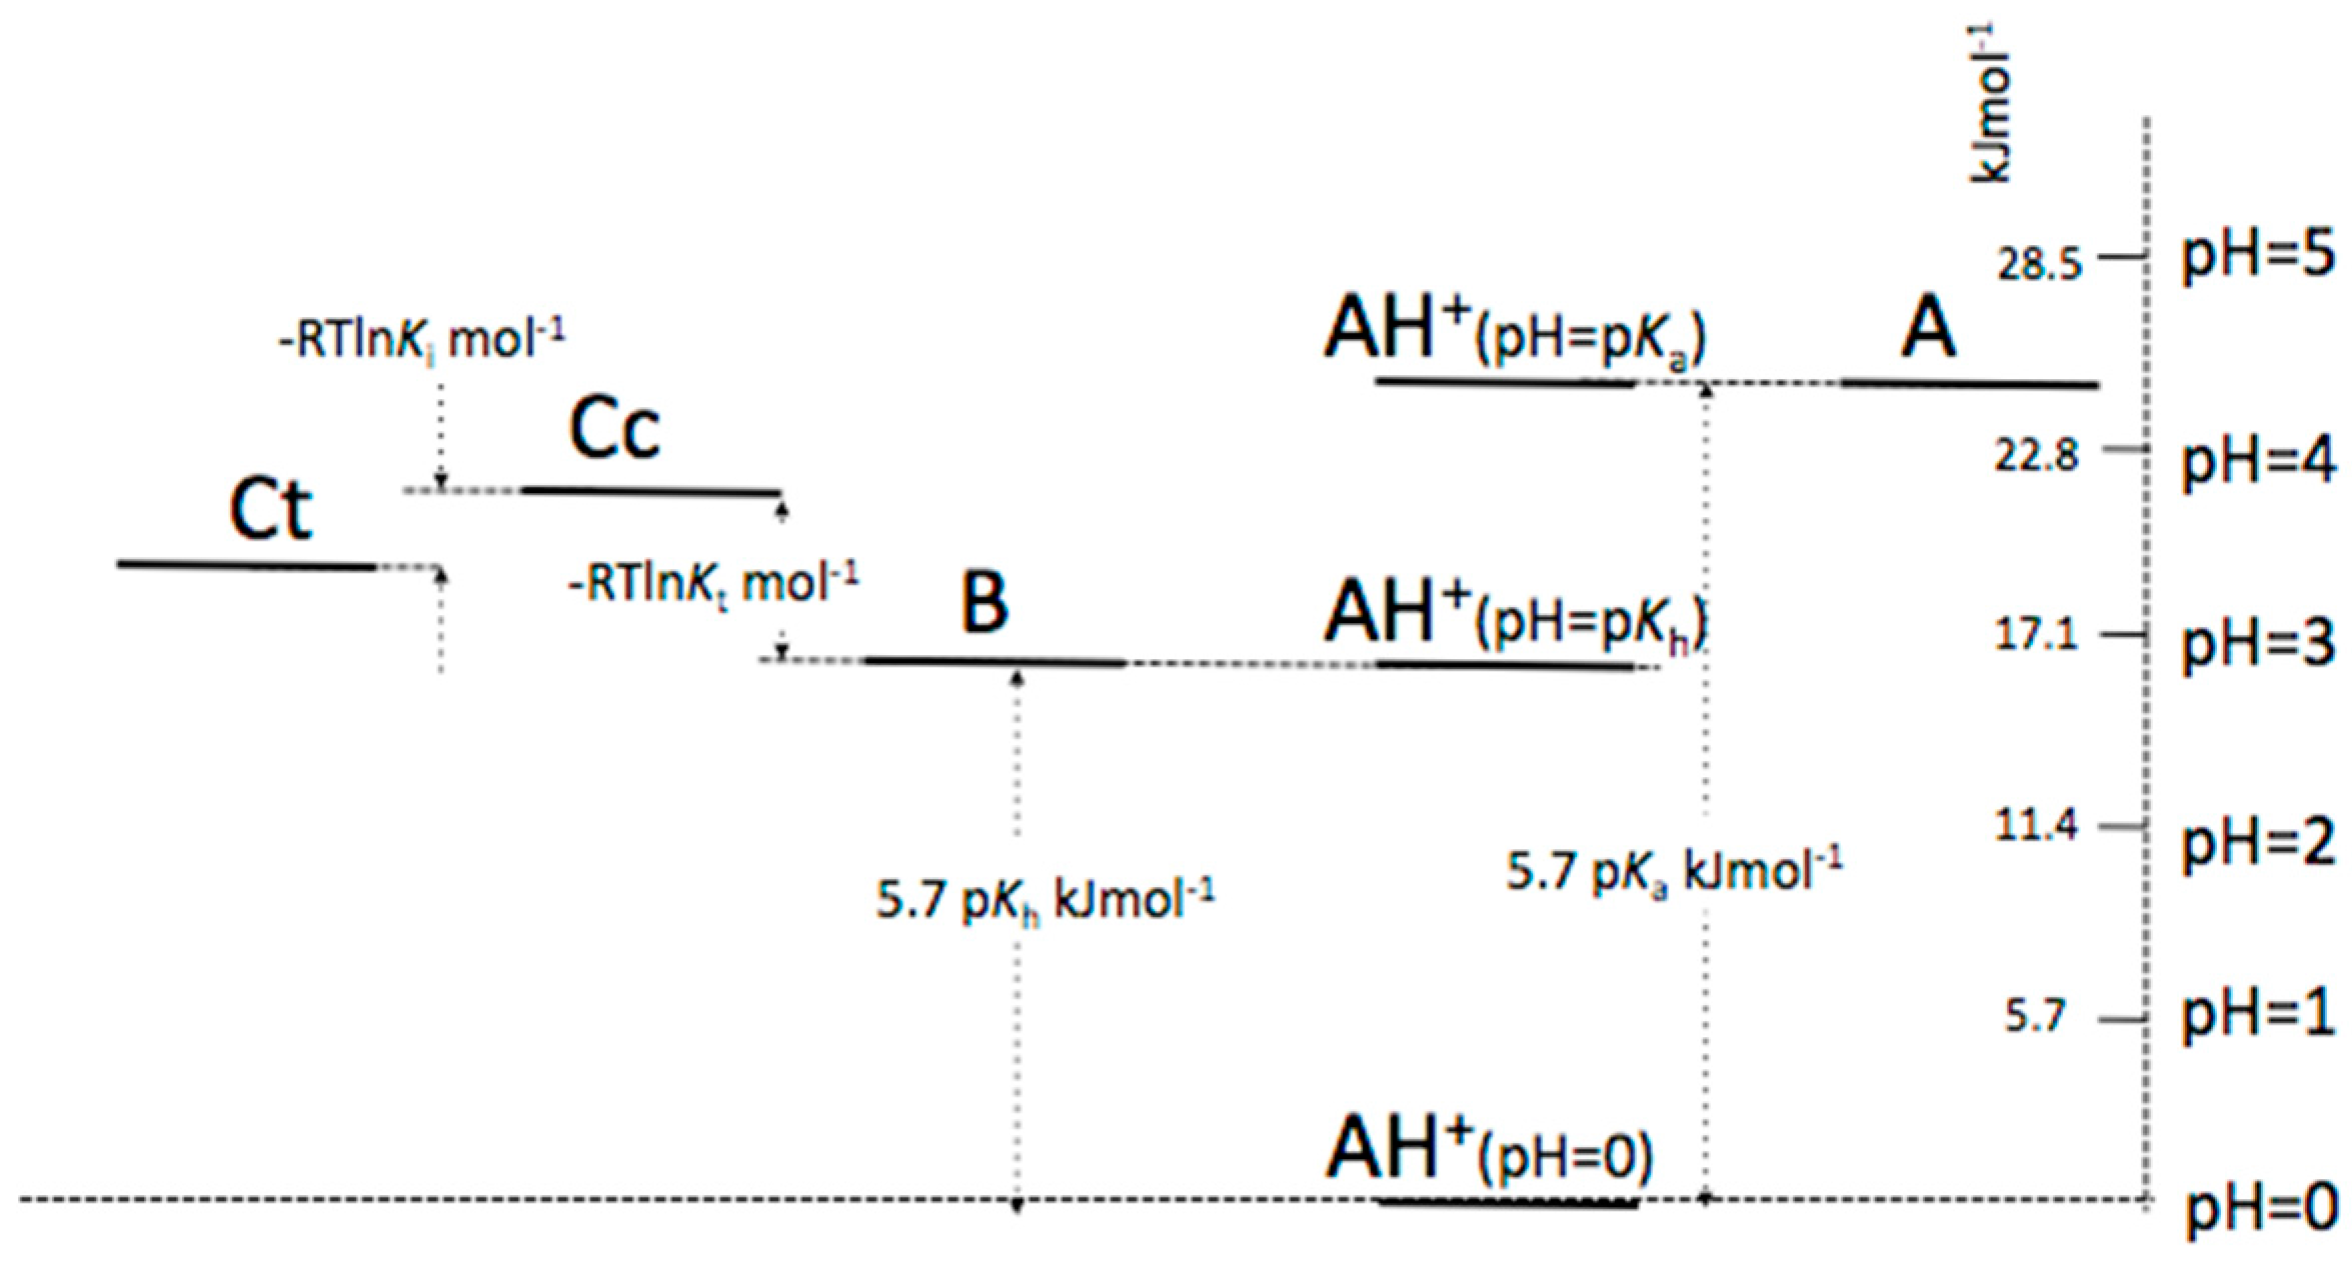
1.2. The Flavylium-Based Multistate
2. Results and Discussion
2.1. Low cis-trans Isomerization Barrier
2.2. A Little Help from Photochemistry
2.3. Flash Photolysis in Flavylium Systems
2.4. High cis-trans Isomerization Barrier
2.5. Reverse pH Jumps
2.6. Applications
2.6.1. Host–Guest Interaction with a Flavylium Based Multistate
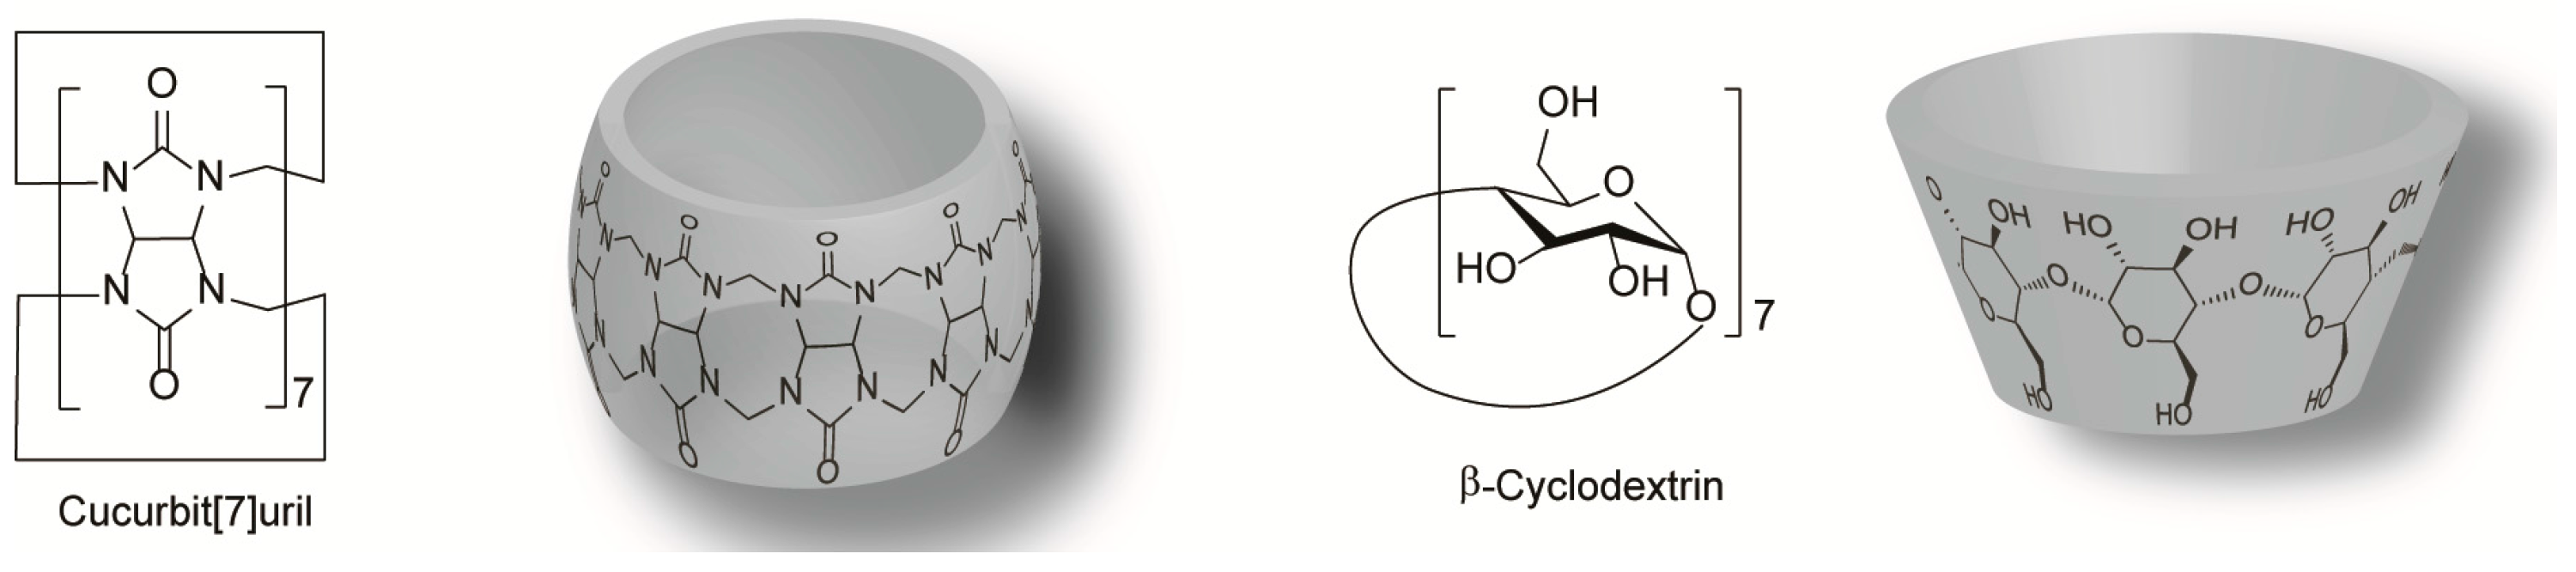
2.6.2. Cucurbit[7]uril
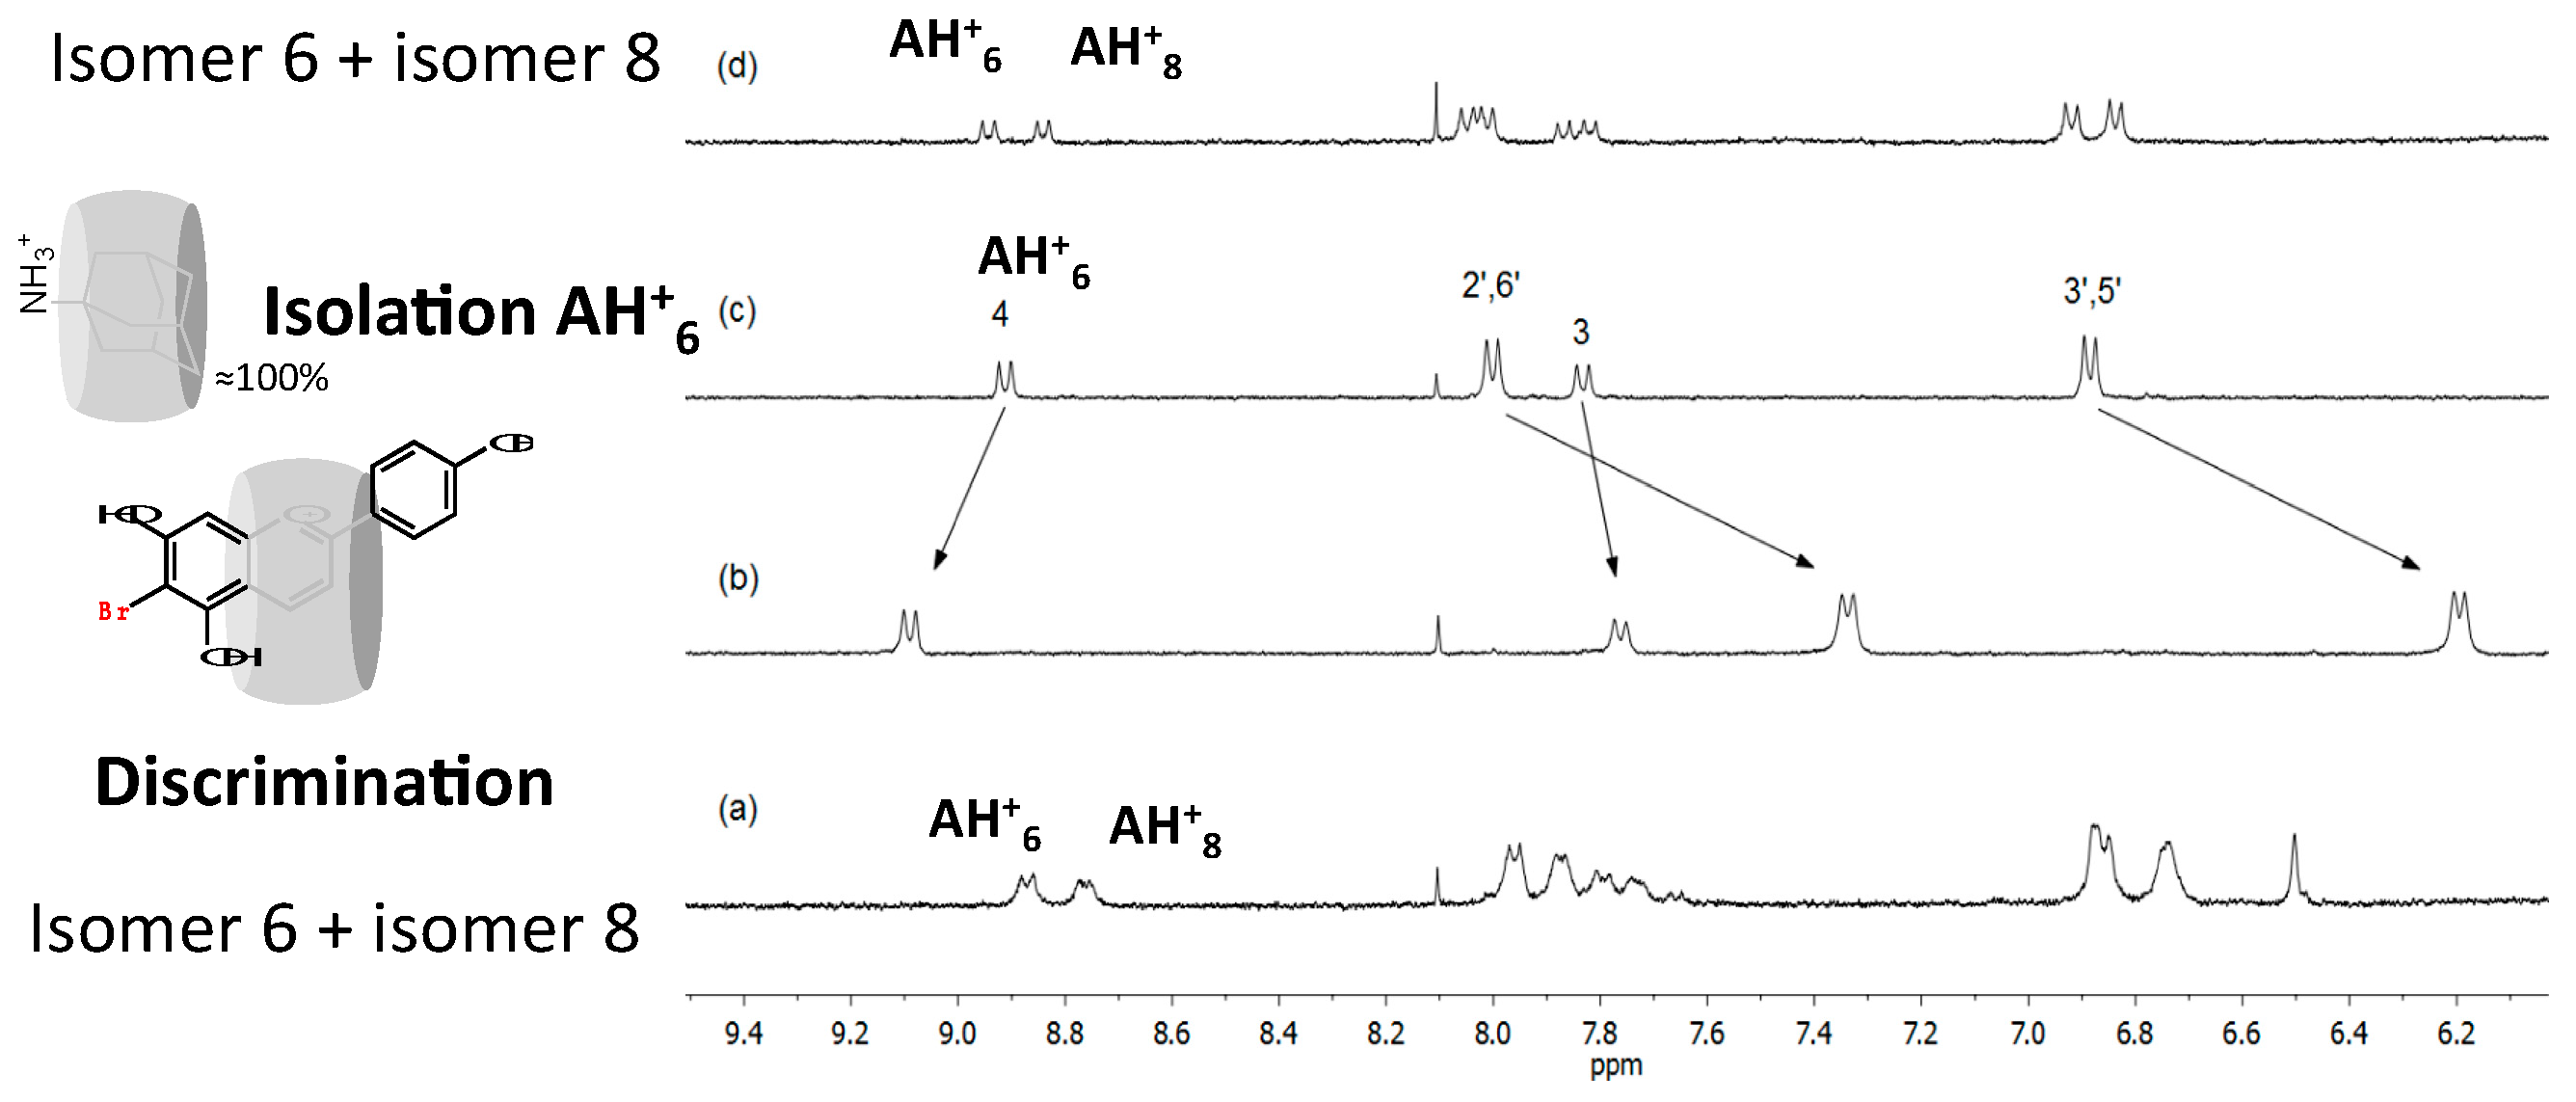
2.6.3. 6,8 Rearrangement
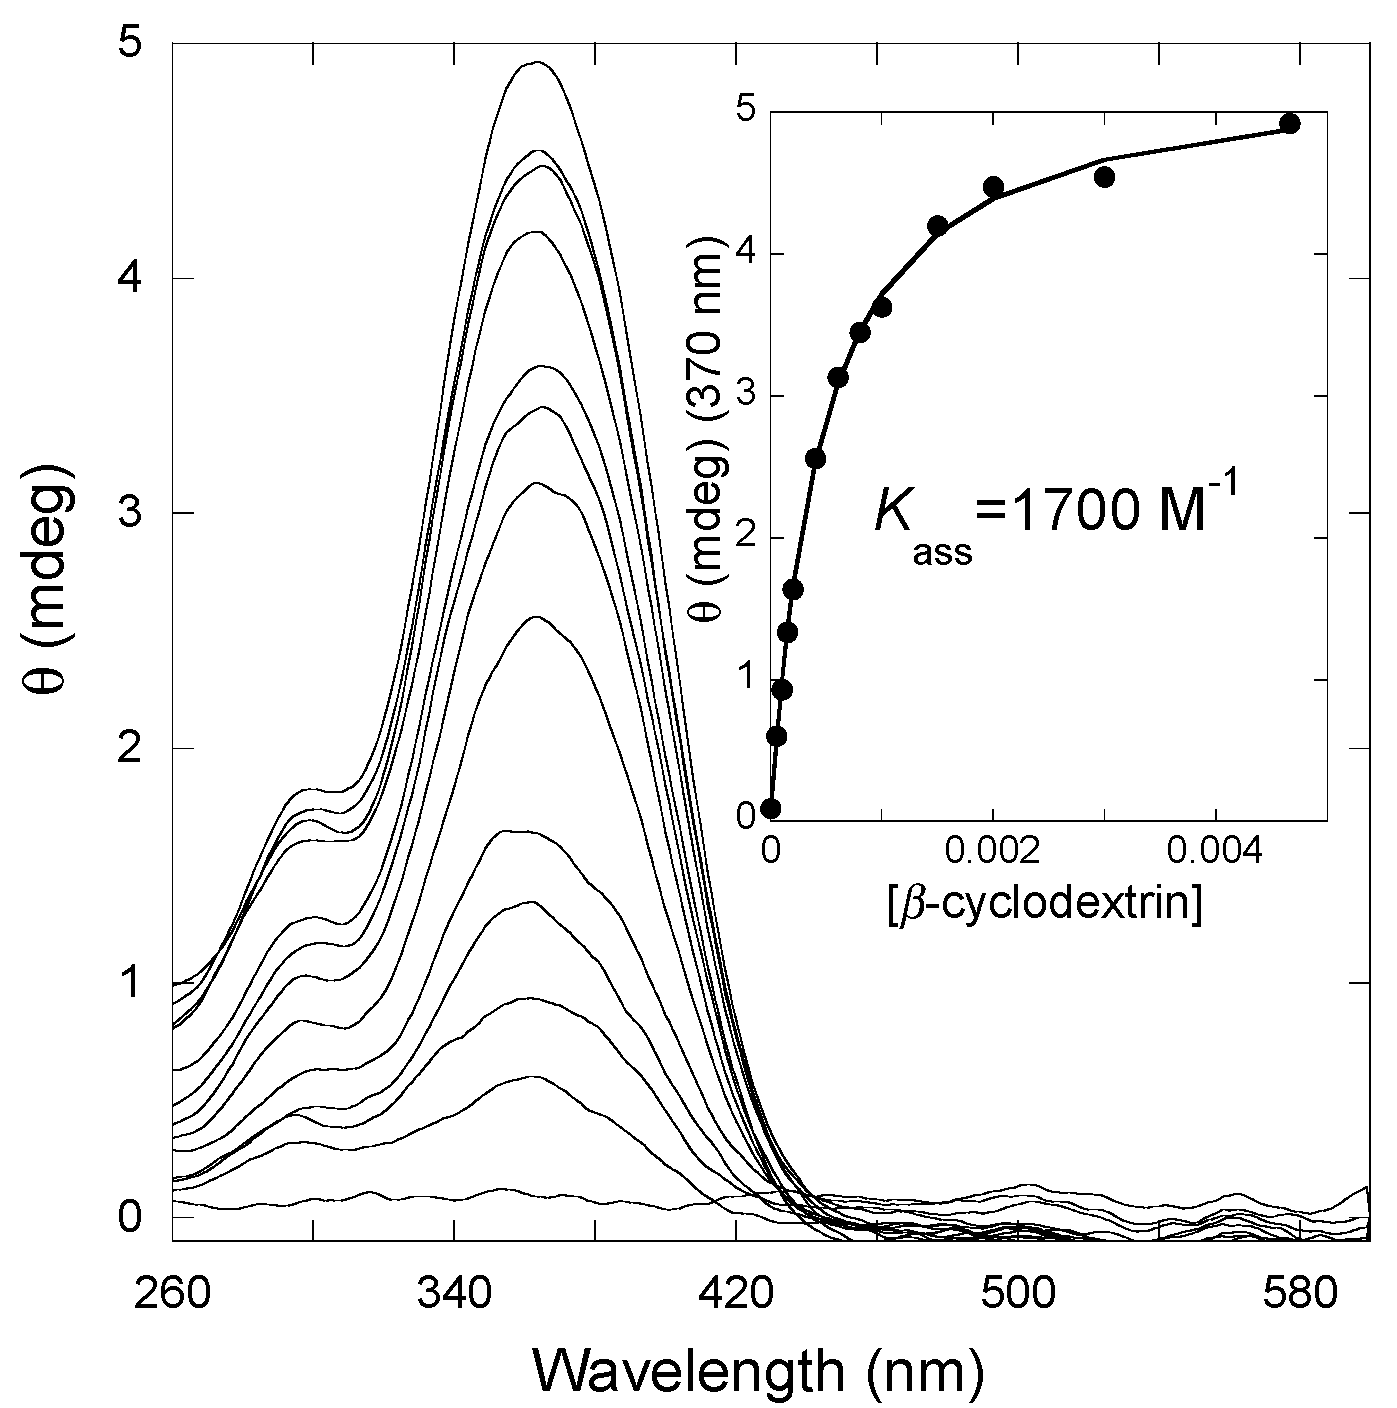
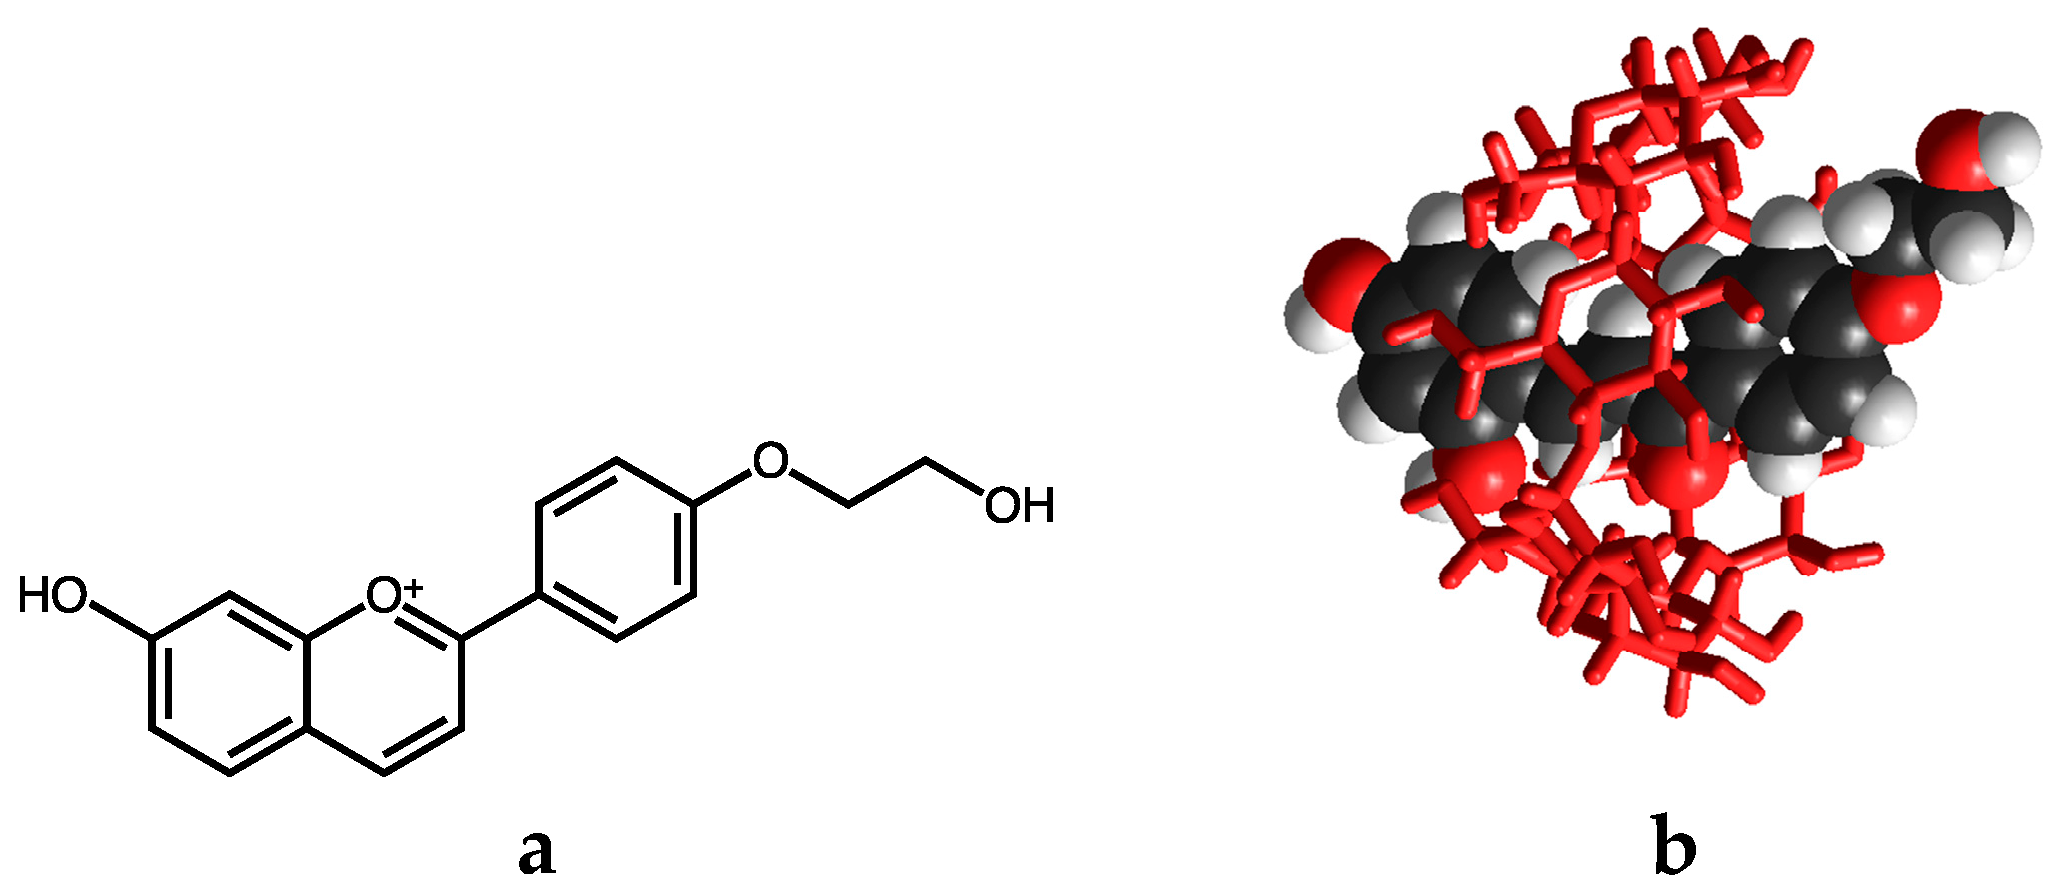
2.6.4. β-Cyclodextrin Interaction
3. Experimental Section
3.1. General
3.2. Flash Photolysis
3.3. Synthesis
4. Conclusions
Acknowledgments
Author Contributions
Conflicts of Interest
Appendix A

Appendix B
References and Notes
- Büllow, C.; Wagner, H. Derivatives of 1,4-benzopyranol, the mother substance of a new class of pigments. II. Ber. Dtsch. Chem. Ges. 1901, 34, 1782–1804. [Google Scholar]
- Brouillard, R.; Dubois, J. Mechanism of the structural transformations of anthocyanins in acidic media. J. Am. Chem. Soc. 1977, 99, 1359–1364. [Google Scholar] [CrossRef]
- McClelland, R.A.; Gedge, S. Hydration of the flavylium ion. J. Am. Chem. Soc. 1980, 102, 5838–5848. [Google Scholar] [CrossRef]
- Willstätter, R. Nobel Lecture. 1915. Available online: http://www.nobelprize.org/nobel_prizes/chemistry/laureates/1915/willstatter-lecture.html (accessed on 6 November 2016).
- Robinson, R. Nobel Lecture. 1947. Available online: http://www.nobelprize.org/nobel_prizes/chemistry/laureates/1947/robinson-lecture.html (accessed on 6 November 2016).
- Leydet, Y.; Gavara, R.; Petrov, V.; Diniz, A.M.; Jorge Parola, A.; Lima, J.C.; Pina, F. The effect of self-aggregation on the determination of the kinetic and thermodynamic constants of the network of chemical reactions in 3-glucoside anthocyanins. Phytochemistry 2012, 83, 125–135. [Google Scholar] [CrossRef] [PubMed]
- Brouillard, R.; Delaporte, B. Chemistry of anthocyanin pigments. 2. Kinetic and thermodynamic study of proton transfer, hydration, and tautomeric reactions of malvidin 3-glucoside. J. Am. Chem. Soc. 1977, 99, 8461–8468. [Google Scholar] [CrossRef]
- Maçanita, A.L.; Moreira, P.F.; Lima, J.C.; Quina, F.H.; Yihwa, C.; Vautier-Giongo, C. Proton transfer in anthocyanins and related flavylium salts. Determination of ground-state rate constants with nanosecond laser flash photolysis. J. Phys. Chem. A 2002, 106, 1248–1255. [Google Scholar] [CrossRef]
- Pina, F. Thermodynamic and Kinetic Processes of Anthocyanins and Related Compounds and Their Bio-Inspired Applications Recent Advanced in Polyphenols Research; Wiley-Blackwell: Chichester, West Sussex, UK, 2014; Volume 4. [Google Scholar]
- Pina, F. Chemical applications of anthocyanins and related compounds. A source of bioinspiration. J. Agric. Food Chem. 2014, 62, 6885–6897. [Google Scholar] [CrossRef] [PubMed]
- Pina, F.; Melo, M.J.; Laia, C.A.T.; Parola, A.J.; Lima, J.C. Chemistry and applications of flavylium compounds: A handful of colours. Chem. Soc. Rev. 2012, 41, 869–908. [Google Scholar] [CrossRef] [PubMed]
- Basílio, N.; Fernandes, A.; de Freitas, V.; Gago, S.; Pina, F. Effect of β-cyclodextrin on the chemistry of 3′,4′,7-trihydroxyflavylium. New J. Chem. 2013, 37. [Google Scholar] [CrossRef]
- Maestri, M.; Ballardini, R.; Pina, F.J.S.; Melo, M.J. An easy and cheap flash spectroscopy experiment. J. Chem. Educ. 1997, 74. [Google Scholar] [CrossRef]
- Pina, F. Anthocyanins and related compounds. Detecting the change of regime between rate control by hydration or by tautomerization. Dyes Pigment. 2014, 102, 308–314. [Google Scholar] [CrossRef]
- Gago, S.; Basílio, N.; Moro, A.J.; Pina, F. Flavylium based dual photochromism: Addressing cis-trans isomerization and ring opening-closure by different light inputs. Chem. Commun. 2015, 51, 7349–7351. [Google Scholar] [CrossRef] [PubMed]
- McClelland, R.A.; McGall, G.H. Hydration of the flavylium ion. 2. The 4′-hydroxyflavylium ion. J. Org. Chem. 1982, 47, 3730–3736. [Google Scholar] [CrossRef]
- Devine, D.B.; McClelland, R.A. Hydration of the flavylium ion. 3. The effect of 3-alkyl substitution. J. Org. Chem. 1985, 50, 5656–5660. [Google Scholar] [CrossRef]
- Trouillas, P.; Sancho-García, J.C.; de Freitas, V.; Gierschner, J.; Otyepka, M.; Dangles, O. Stabilizing and modulating color by copigmentation: Insights from theory and experiment. Chem. Rev. 2016, 116, 4937–4982. [Google Scholar] [CrossRef] [PubMed] [Green Version]
- Basílio, N.; Petrov, V.; Pina, F. Host-guest complexes of flavylium cations and cucurbit[7]uril: The influence of flavylium substituents on the structure and stability of the complex. ChemPlusChem 2015, 80, 1779–1785. [Google Scholar] [CrossRef]
- Mecozzi, S.; Rebek, J., Jr. The 55% solution: A formula for molecular recognition in the liquid state. Chem. Eur. J. 1998, 4, 1016–1022. [Google Scholar] [CrossRef]
- Basílio, N.; Pina, F. Flavylium network of chemical reactions in confined media: Modulation of 3′,4′,7-trihydroxyflavilium reactions by host-guest interactions with cucurbit[7]uril. ChemPhysChem 2014, 15, 2295–2302. [Google Scholar] [CrossRef] [PubMed]
- Basílio, N.; Cabrita, L.; Pina, F. Mimicking positive and negative copigmentation fffects in anthocyanin analogues by host–guest interaction with cucurbit[7]uril and β-cyclodextrins. J. Agric. Food Chem. 2015, 63, 7624–7629. [Google Scholar] [CrossRef] [PubMed]
- Held, B.; Tang, H.; Natarajan, P.; da Silva, C.P.; de Oliveira Silva, V.; Bohne, C.; Quina, F.H. Cucurbit[7]uril inclusion complexation as a supramolecular strategy for color stabilization of anthocyanin model compounds. Photochem. Photobiol. Sci. 2016, 15, 752–757. [Google Scholar] [CrossRef] [PubMed]
- Jurd, L. Anthocyanins and related compounds. I. structural transformations of flavylium salts in acidic solutions. J. Org. Chem. 1963, 28, 987–991. [Google Scholar] [CrossRef]
- Bjorøy, Ø.; Rayyan, S.; Fossen, T.; Andersen, Ø.M. Structural properties of anthocyanins: Rearrangement of C-glycosyl-3-deoxyanthocyanidins in acidic aqueous solutions. J. Agric. Food Chem. 2009, 57, 6668–6677. [Google Scholar] [CrossRef] [PubMed]
- Cruz, L.M.; Basílio, N.M.; de Freitas, V.A.; Lima, J.C.; Pina, F.J. Extending the study of the 6,8 rearrangement in flavylium compounds to higher pH values: Interconversion between 6-bromo and 8-bromo-apigeninidin. Chem. Open 2016, 5, 236–246. [Google Scholar] [CrossRef]
- Basílio, N.; Cruz, L.; de Freitas, V.; Pina, F. A multistate molecular switch based on the 6,8-rearrangement in bromo-apigeninidin operated with pH and host–guest inputs. J. Phys. Chem. B 2016, 120, 7053–7061. [Google Scholar] [CrossRef] [PubMed]
- Barrow, S.J.; Kasera, S.; Rowland, M.J.; del Barrio, J.; Scherman, O.A. Cucurbituril-based molecular recognition. Chem. Rev. 2015, 115, 12320–12406. [Google Scholar] [CrossRef] [PubMed]
- Petrov, V.; Stanimirov, S.; Petrov, I.K.; Fernandes, A.; de Freitas, V.; Pina, F. Emptying the β-cyclodextrin cavity by light: Photochemical removal of the trans-chalcone of 4′,7-dihydroxyflavylium. J. Phys. Chem. A 2013. [Google Scholar] [CrossRef] [PubMed]
- Lopes-Costa, T.; Basílio, N.; Pedrosa, J.M.; Pina, F. Photochromism of the natural dye 7,4′-dihydroxy-5-methoxyflavylium (dracoflavylium) in the presence of (2-hydroxypropyl)-β-cyclodextrin. Photochem. Photobiol. Sci. 2014, 13, 1420–1426. [Google Scholar] [CrossRef] [PubMed]
- Gago, S.; Basílio, N.; Fernandes, A.; Freitas, V.; Quintas, A.; Pina, F. Photochromism of the complex between 4′-(2-hydroxyethoxy)-7-hydroxyflavylium and β-cyclodextrin, studied by 1H-NMR, UV-Vis, continuous irradiation and circular dichroism. Dyes Pigment. 2014, 110, 106–112. [Google Scholar] [CrossRef]
- Allenmark, S. Induced circular dichroism by chiral molecular interaction. Chirality 2003, 15, 409–422. [Google Scholar] [CrossRef] [PubMed]
- Zhang, X.; Gramlich, G.; Wang, X.; Nau, W.M. A Joint Structural, Kinetic, and Thermodynamic Investigation of Substituent Effects on Host–Guest Complexation of Bicyclic Azoalkanes by β-Cyclodextrin. J. Am. Chem. Soc. 2002, 124, 254–263. [Google Scholar] [CrossRef] [PubMed]
- Küster, F.W.; Thiel, A. Tabelle per le Analisi Chimiche e Chimico-Fisiche, 12th ed.; Hoepli: Milano, Italy, 1982; pp. 157–160. [Google Scholar]
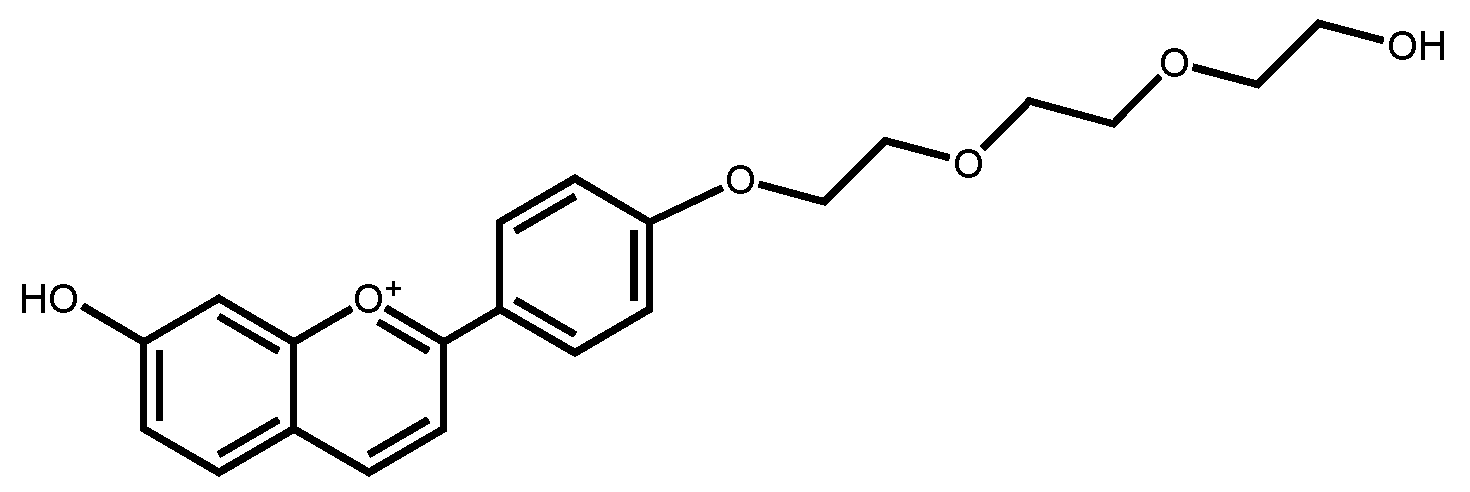
- Sample Availability: Samples of the compounds 1 and 2 are available from the authors.


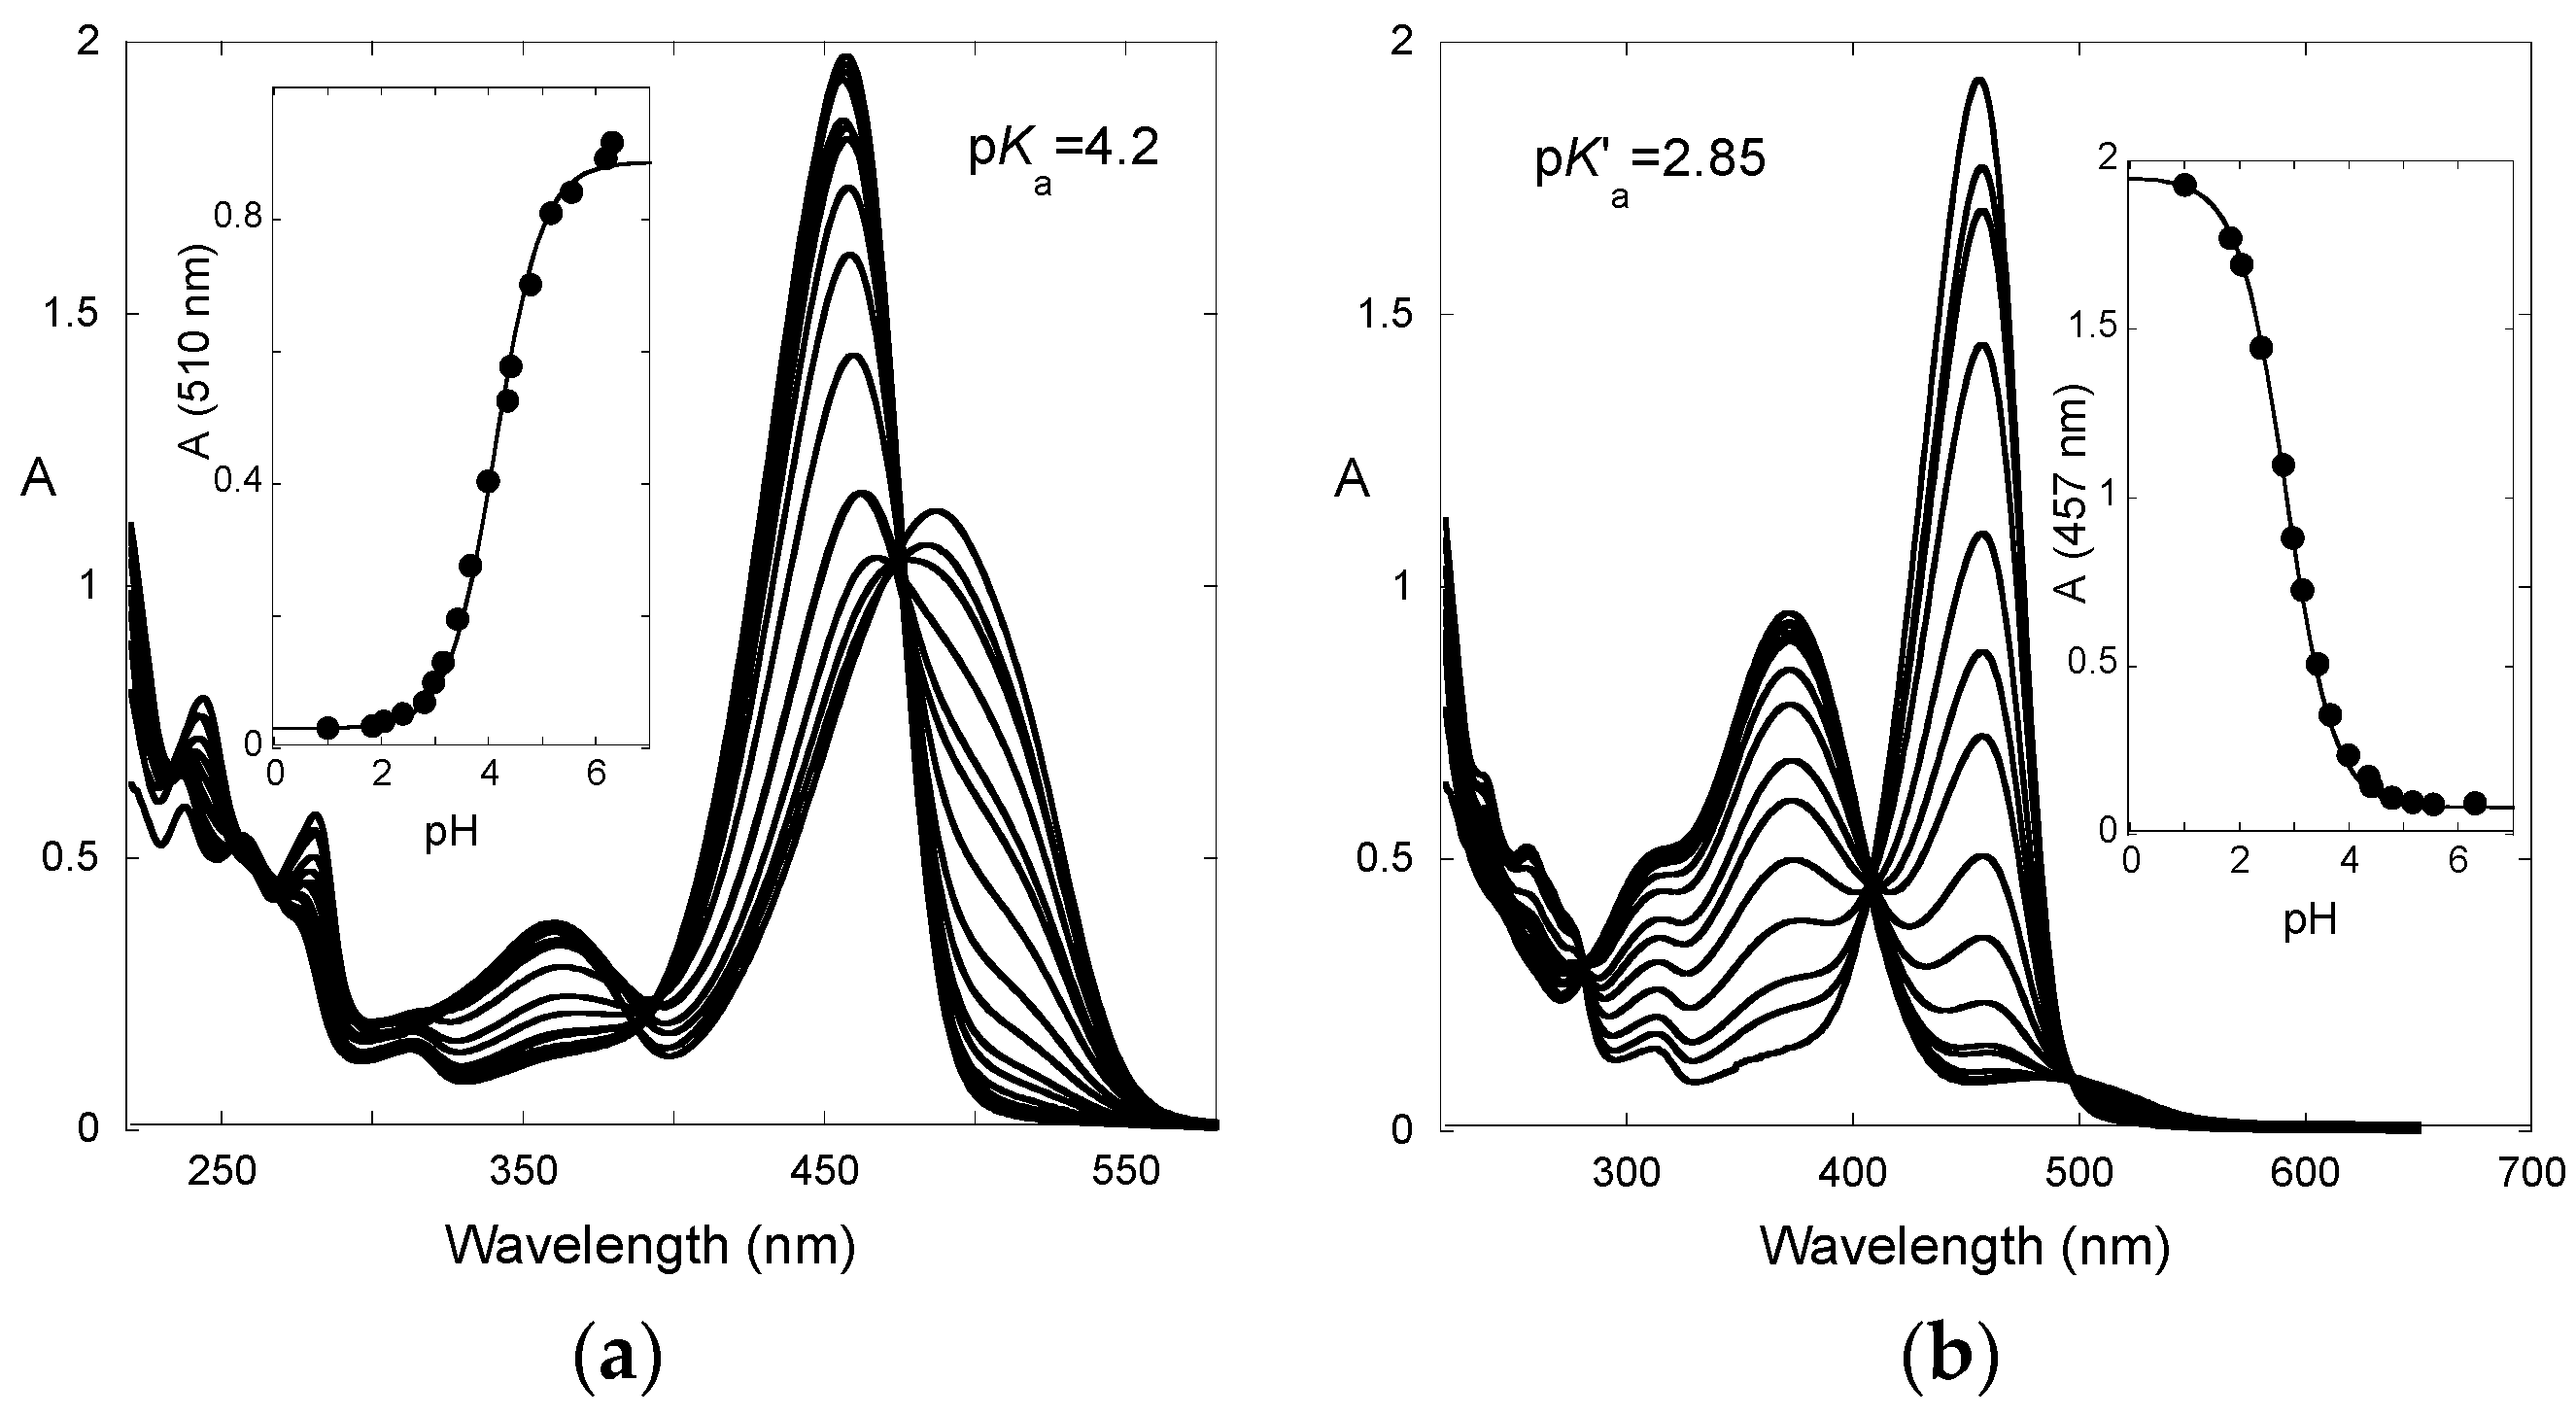
| pK′a | pKa | KhKtki (M·s−1) | Ktki/k−h(M) | k−i (s−1) | kh (s−1) |
|---|---|---|---|---|---|
| 2.85 | 4.2 | 3.6 × 10⁻⁷ | 2 × 10⁻⁵ | 2.7 × 10⁻⁴ | 0.018 |
| pK′a | pKa | Kh (M−1) | Kt | Ki |
|---|---|---|---|---|
| 2.85 | 4.2 | 5.6 × 10⁻⁷ | 1.3 | 1.9 × 10³ |
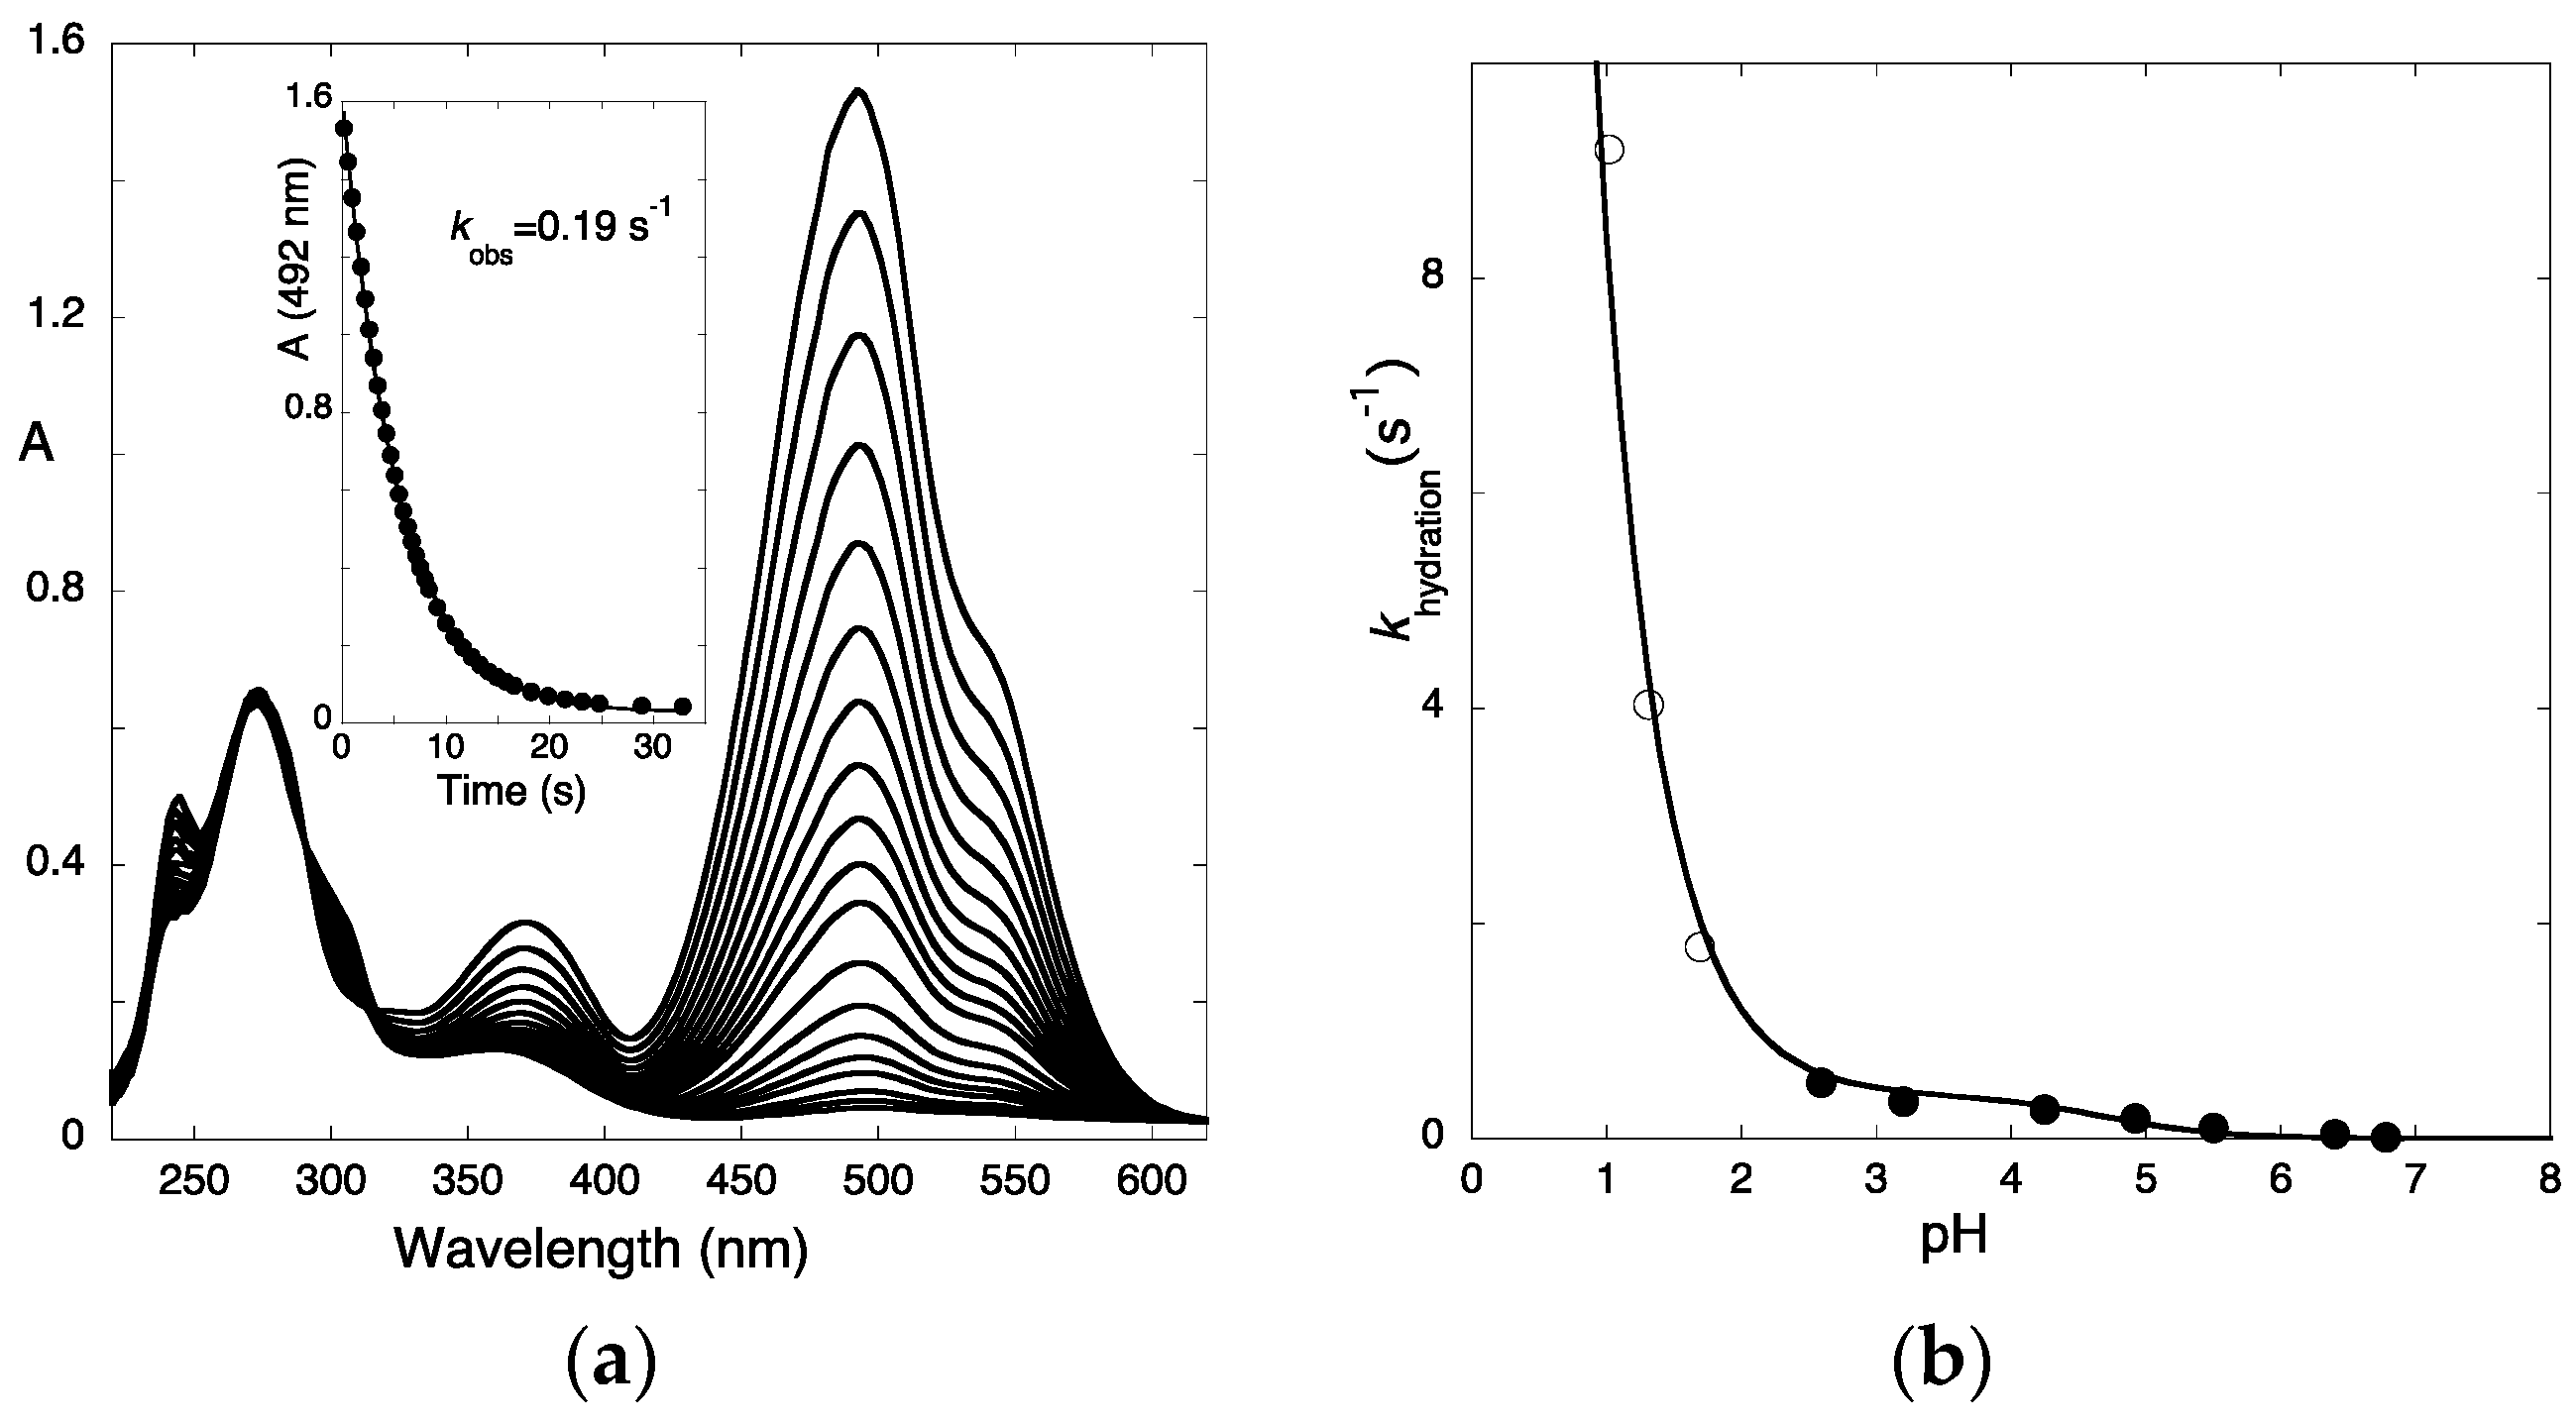
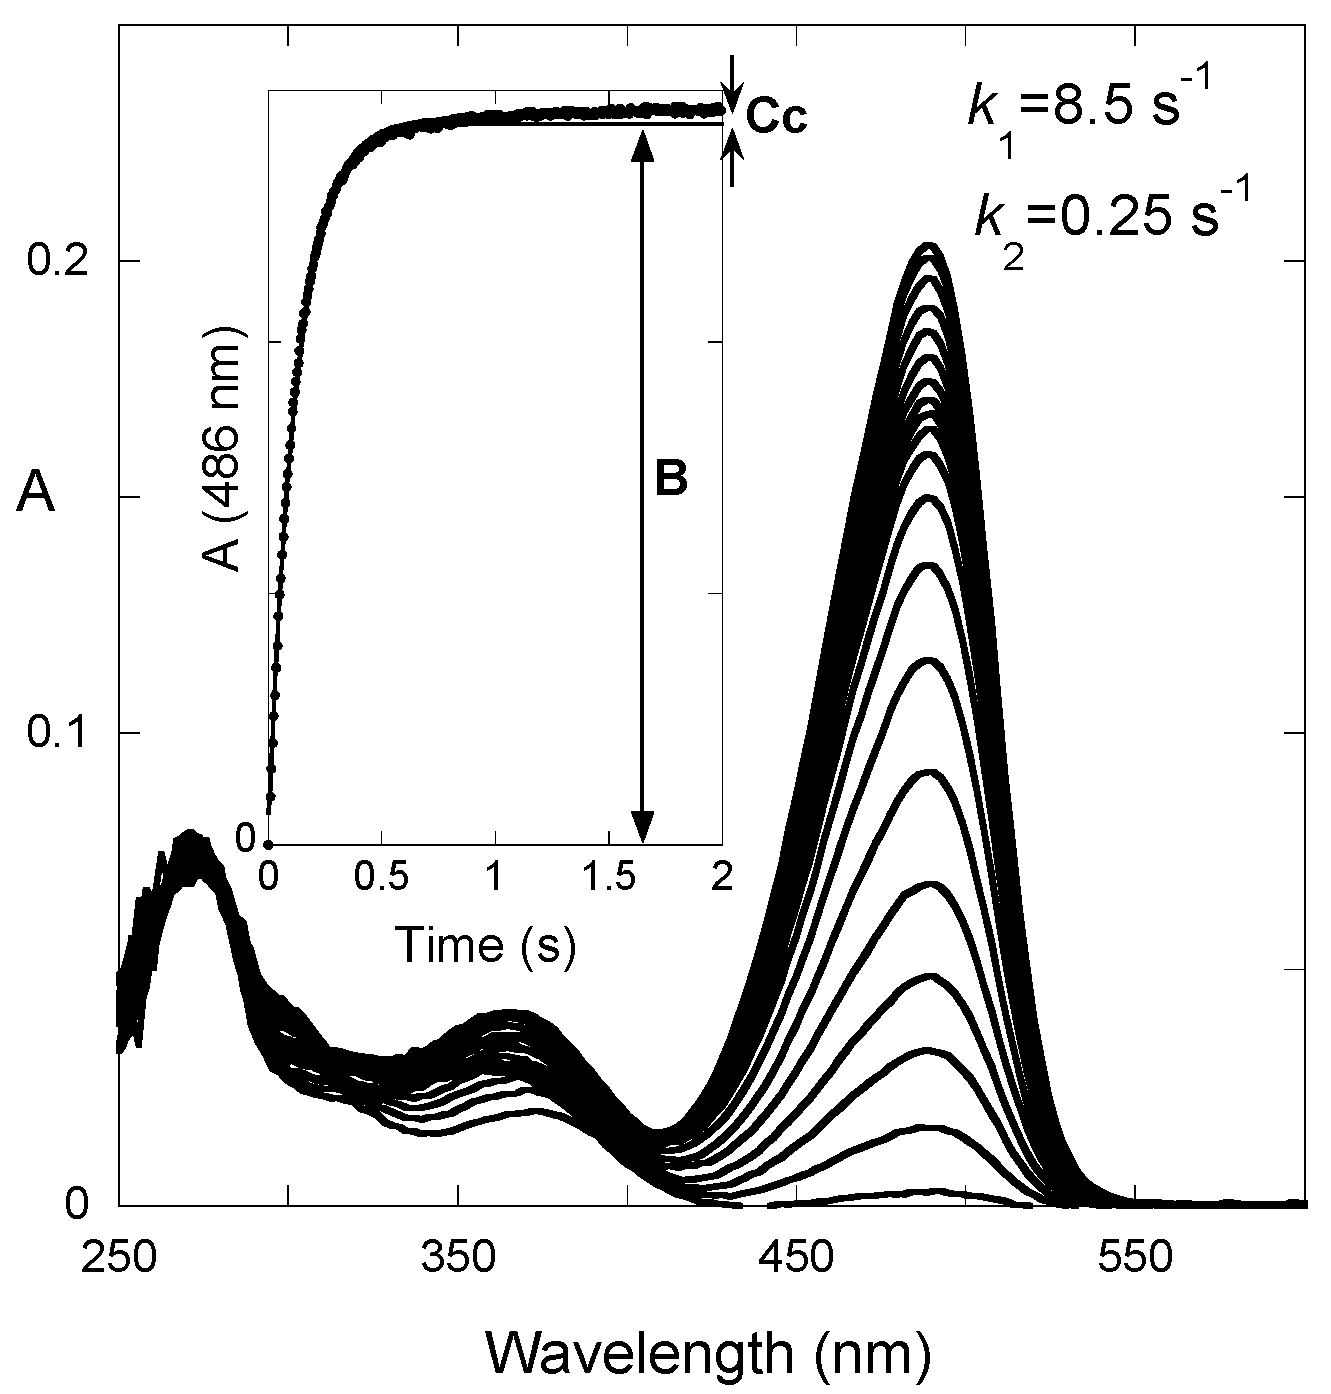
| kh (s−1) | k−h (M·s−1) | kt (s−1) | k−t (s−1) | ki (s−1) | k−i (s−1) |
|---|---|---|---|---|---|
| 0.018 | 3.2 × 10⁴ | 0.57 | 0.45 | 0.5 | 2.7 × 10⁻⁴ |
| pKa′ | pK^a | pKa | Kh/M−1 | Kt | Ki |
|---|---|---|---|---|---|
| 2.2 | 2.37 | 4.6 | 4 × 10⁻³ | 0.05 | 10.4 |
| kh s−1 | k−h M−1·s−1 | kt s−1 | k−t s−1 | ki s−1 | k−i s−1 |
|---|---|---|---|---|---|
| 0.3 | 75 | 1.25 × 10⁻² | 0.25 | 2.3 × 10⁻⁴ | 2.2 × 10⁻⁵ |
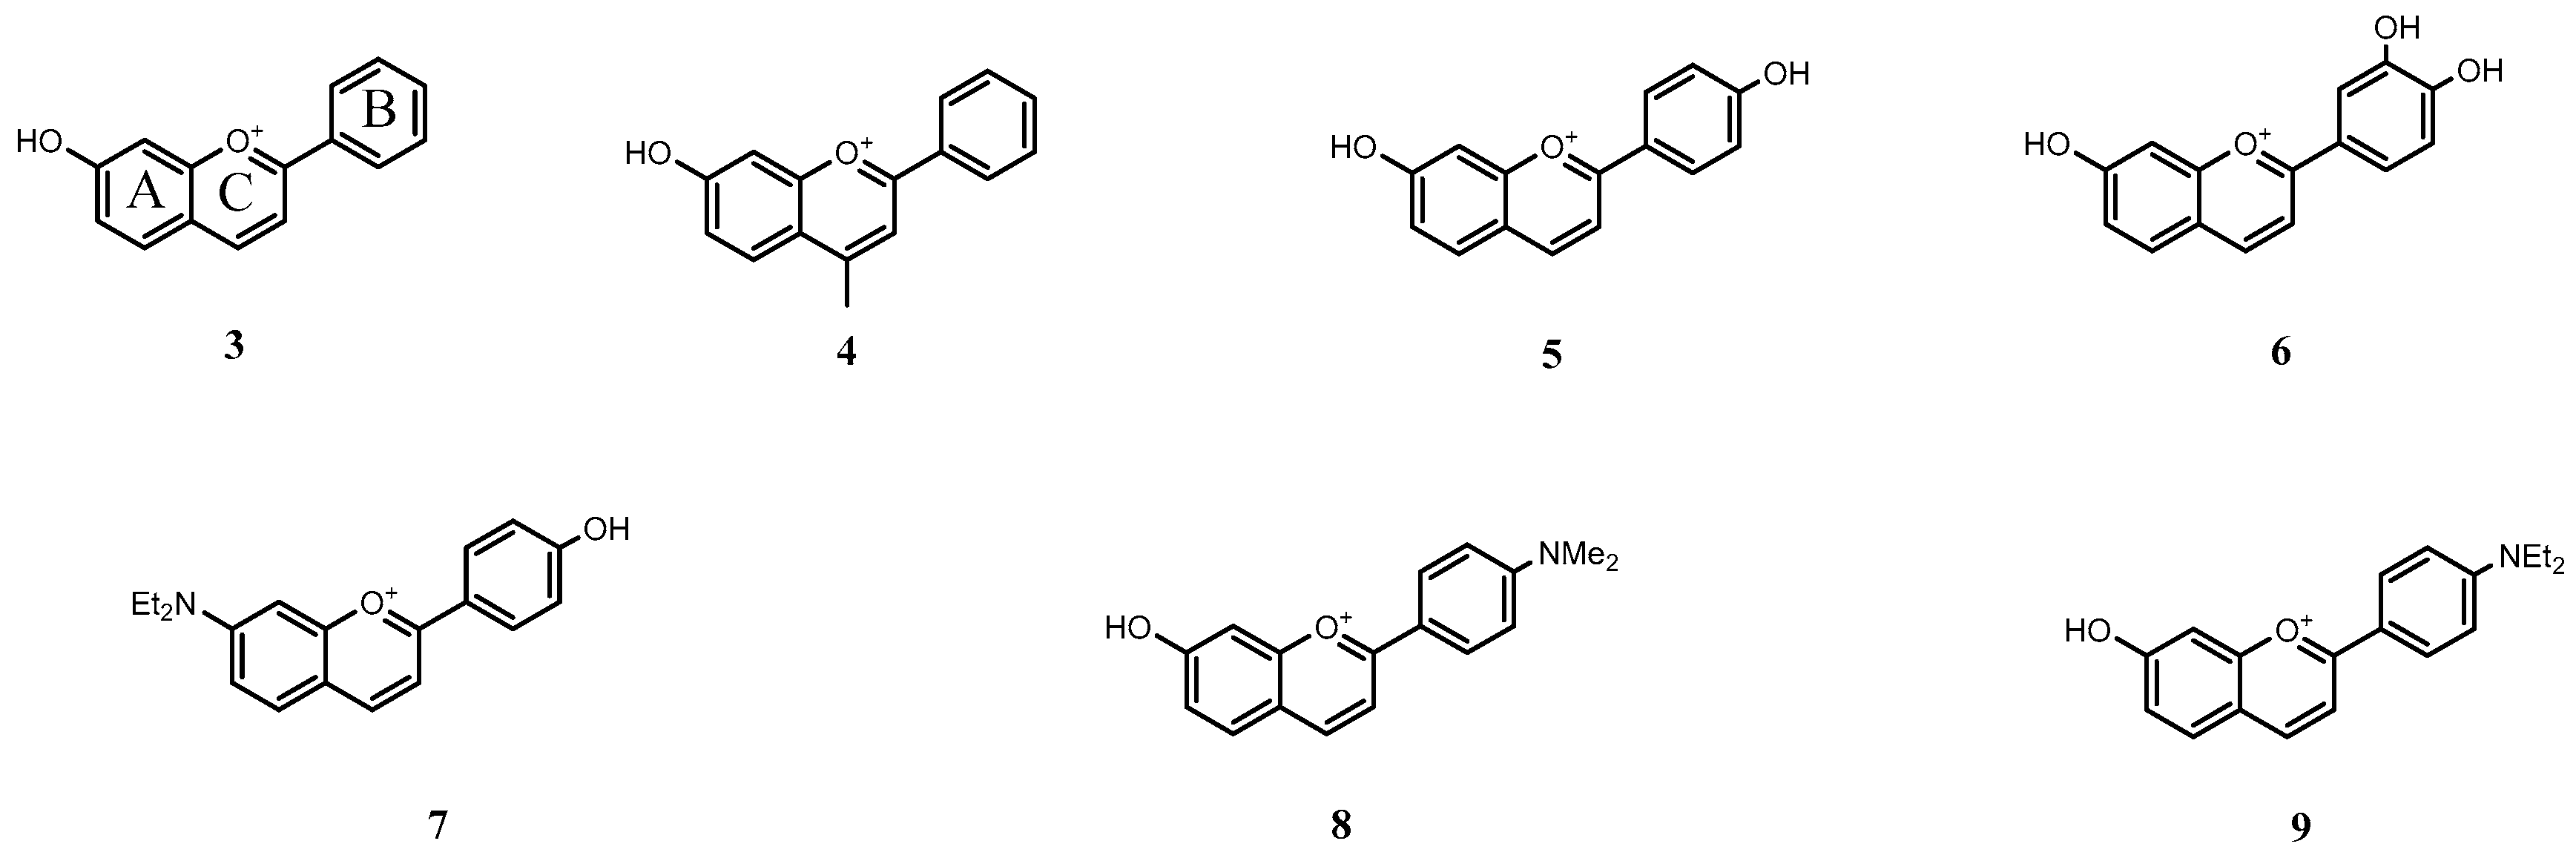
| Flavylium | K/M−1 |
|---|---|
| Compound 3 | 2.1 × 10⁶ |
| Compound 4 | 5.1 × 10⁵ |
| Compound 5 | 5.5 × 10⁵ |
| Compound 6 | 2.7 × 10⁵ |
| Compound 7 | 5.1 × 10⁶ |
| Compound 8 | 8.0 × 10⁶ |
| Compound 9 | 5.0 × 10⁶ |
© 2016 by the authors. Licensee MDPI, Basel, Switzerland. This article is an open access article distributed under the terms and conditions of the Creative Commons Attribution (CC-BY) license ( http://creativecommons.org/licenses/by/4.0/).
Share and Cite
Basílio, N.; Pina, F. Chemistry and Photochemistry of Anthocyanins and Related Compounds: A Thermodynamic and Kinetic Approach. Molecules 2016, 21, 1502. https://doi.org/10.3390/molecules21111502
Basílio N, Pina F. Chemistry and Photochemistry of Anthocyanins and Related Compounds: A Thermodynamic and Kinetic Approach. Molecules. 2016; 21(11):1502. https://doi.org/10.3390/molecules21111502
Chicago/Turabian StyleBasílio, Nuno, and Fernando Pina. 2016. "Chemistry and Photochemistry of Anthocyanins and Related Compounds: A Thermodynamic and Kinetic Approach" Molecules 21, no. 11: 1502. https://doi.org/10.3390/molecules21111502