In this section, we review 3D compound description and comparison methods. We start with reviewing atomic distance-based methods.
2.1. Atomic Distance-Based Methods
One of the simplest ways to describe molecular 3D information is by computing the distribution of atomic distances in compounds. Compared to other classes of 3D methods, atomic distance-based methods are simple and fast since they only calculate the distance between atom pairs for an input coordinate file of a compound.
USR (Ultrafast Shape Recognition) [
11] uses statistics of distances between heavy atoms using four key positions of a molecule: the molecule center (ctd), the closest atom from ctd (cst), the farthest atom from ctd (fct), and the farthest atom from fct (ftf). After defining the four points, the method calculates all atom distances from them. Then, it calculates three moments from the four distance distributions: (1) the mean distance; (2) the variance of the distribution; and (3) the skewness of distribution. Therefore, a molecule has 12 values (four distribution times three moments) to describe a 3D shape. The similarity of two molecules, A and B, is given as an inverse of the Manhattan distance of the 12 values (Equation (1)):
Another method, ESHAPE3D [
17], also uses pair-wise heavy atom distances. These distances are stored in a single matrix, where rows and columns denote each atom. Then, the molecular shape is characterized by eigenvalues computed after diagonalizing the matrix. The similarity score between two compounds, each of which is represented by a fingerprint that uses eigenvalues, is calculated as the inverse of the distance between their fingerprints.
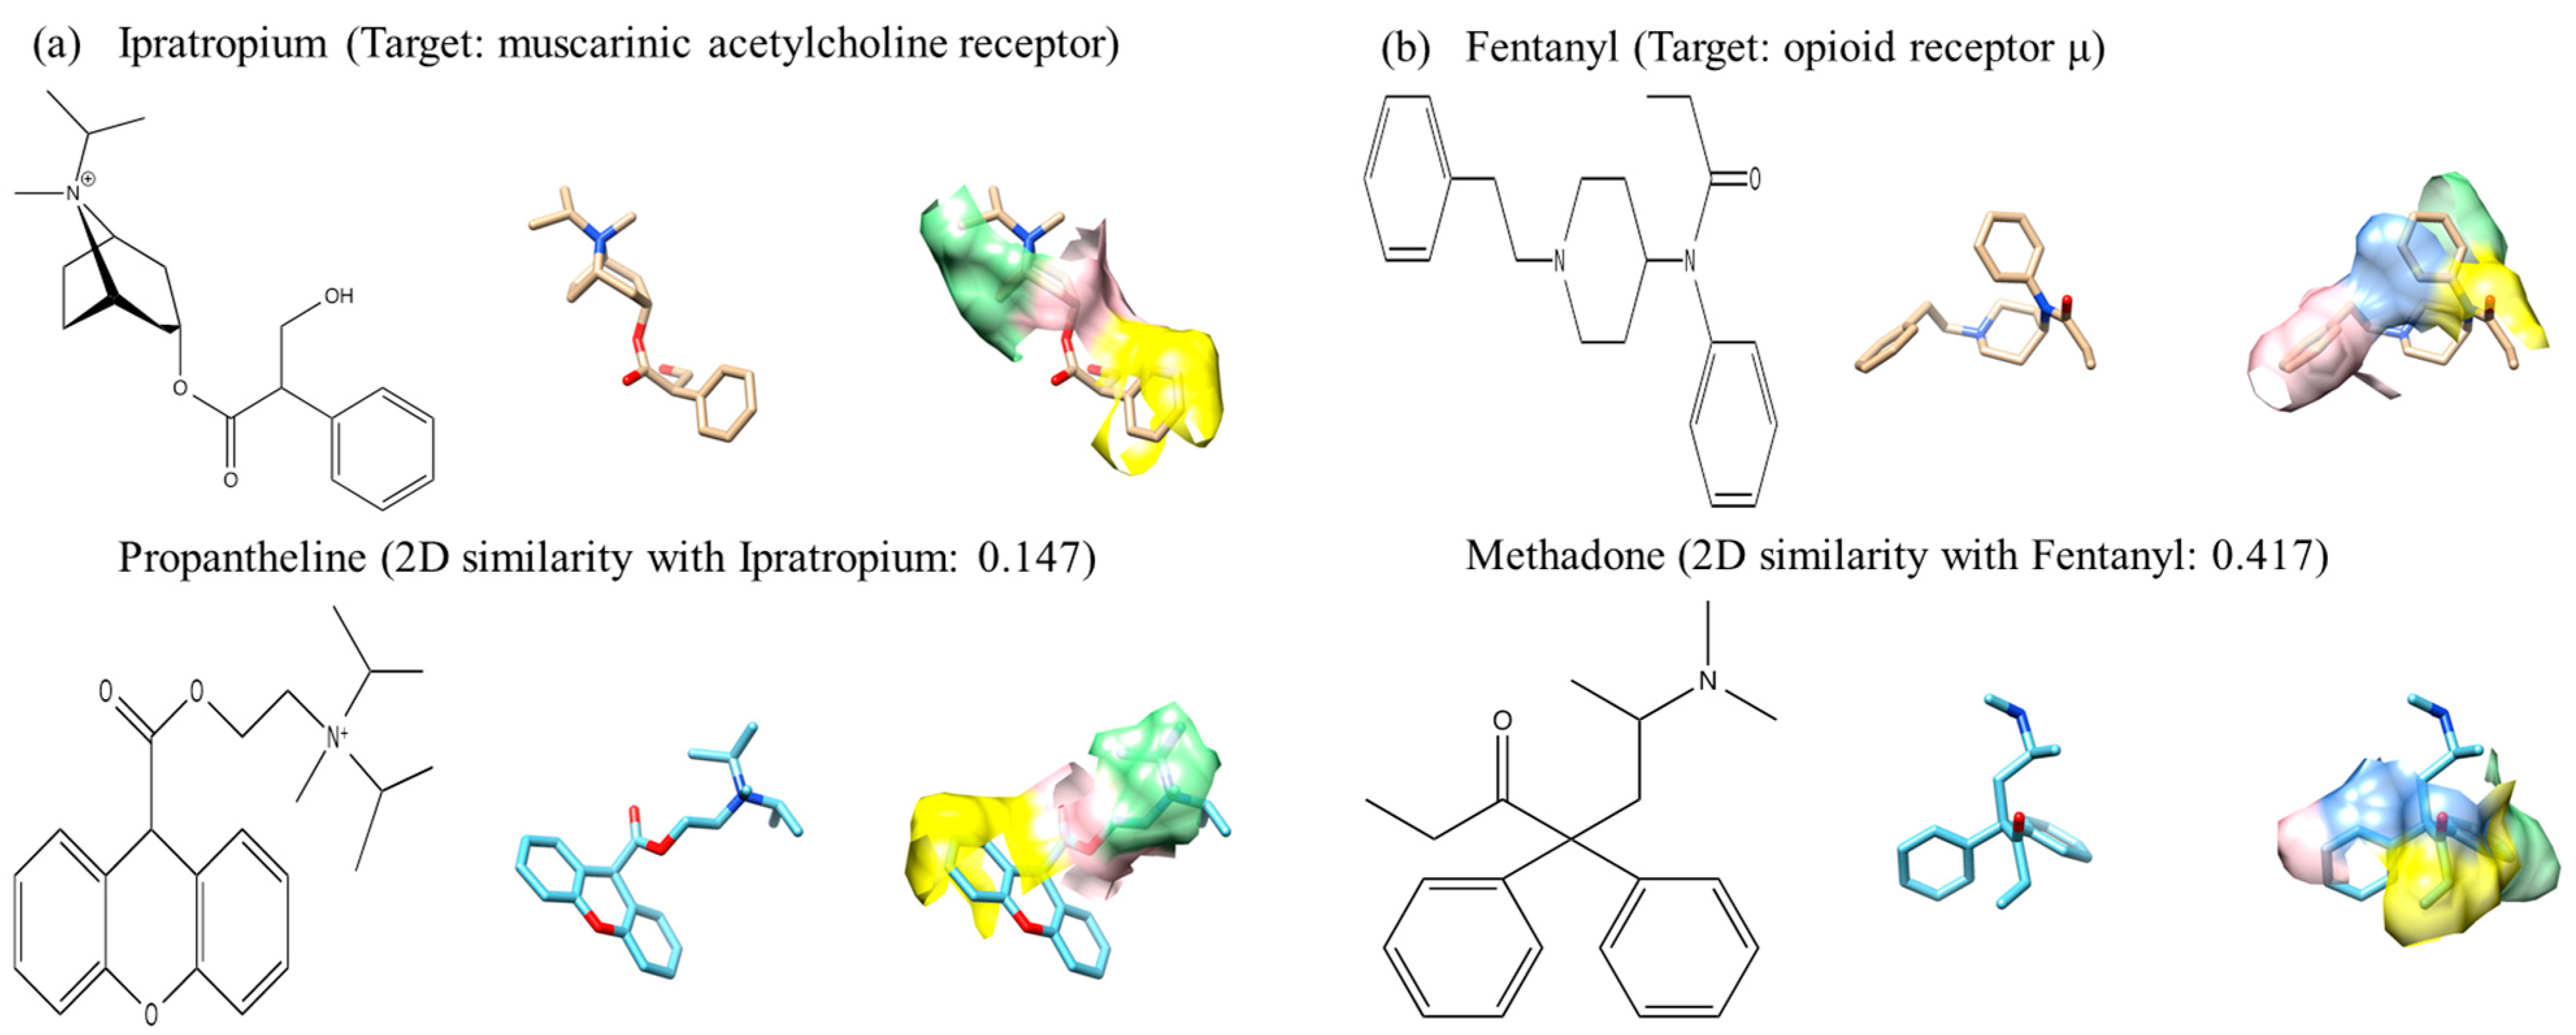
The disadvantage of distance-based methods is that it can be difficult to encode physicochemical features of a molecule. All atom pairs are treated in the same way when comparing molecules. Therefore, this methodology cannot discriminate between structures with a similar shape but with differences in functional groups [
18]. To resolve this problem, atom types or pharamacophoric constraints are introduced in USR variants. USRCAT (Ultrafast Shape Recognition with CREDO Atom Types) detects five pharmacophore features, hydrophobic, aromatic, hydrogen bond donor, and hydrogen bond acceptor, and calculates 12 components for all atoms and for every feature [
18]. Therefore, one molecule contains 60 values (five times 12 components). Intrinsic limitations of distance-based methods are that 3D information of molecules is not fully captured, for example, special positions of atoms and relative positions among them are not described and enantiomers cannot be distinguished.
2.2. Gaussian Function-Based Molecular Shape Description Methods
This class of methods computes the similarity of molecules as volume overlap of molecules after superimposition. The Gaussian function (Equation (2)) is widely used to represent molecular volume and shape. The advantages of Gaussian function are that its derivative and integral can be analytically computed and that the product of two Gaussian functions becomes also a Gaussian function. The atomic density of a molecule is given as a spherical Gaussian function [
19]:
where
r and
Ri are a coordinate of a surface point and the atomic coordinate i in the Euclidean space, respectively. σ
i is a van der Waals radius of the atom i and p
i is the scaling factor of the Gaussian function. In most applications of the Gaussian function to calculate molecular volume,
pi is set to 2√2. The volume of an atom
i can be calculated as an integral of ρ
i for over the space.
The volume overlap between two molecules after superposition, A and B, is calculated with Equation (3). The summation is computed over all the atoms in each molecule.
Two molecules need to be superimposed before the volume overlap is computed. This is a disadvantage of this type of methods since superimposition of molecule takes time and also the similarity score severely depends on superimposition, which is not always trivial particularly for molecules of spherical shape.
The most widely used program that uses Gaussian function is ROCS (Rapid Overlay of Chemical Structures) developed by OpenEye [
10]. ROCS tries to find a superimposition of a query to a template molecule that maximizes volume overlap between them. Then, it defines a similarity between the two molecules as a volume Tanimoto coefficient:
where V
query, V
template, and V
query,template are the volumes of query molecule, template molecule, and the overlapped region after superimposition, respectively. If the molecules share more similar structure, higher Tanimoto coefficients can be obtained.
In addition to shape similarity, ROCS can calculate chemical similarity between molecules after superimposition. The chemical type of an atom is assigned by Implicit/Explicit Mills Dean color force field [
20]. The atoms types considered are hydrogen bond donor, hydrogen bond acceptor, anion, cation, hydrophobic, and rings. The chemical similarity between two molecules is also quantified with a Tanimoto coefficient.
Since ROCS only uses shape to overlay molecules, this can lead to issues when the ligand database contains many similar molecules [
11]. Moreover, the alignment algorithm ROCS uses, a SIMPLEX algorithm, cannot guarantee finding the optimal overlap. Therefore, ROCS does not guarantee the best superposition between two molecules. To accommodate this problem, physicochemical properties such as electrostatic field are introduced in other programs in the superimposition stage of molecules.
MolShaCS [
21] introduced an empirical charge distribution function. The base function is also Gaussian, but the van der Waals radius, σ
i in Equation (2), is replaced to the atomic charge. The overlap between two molecules, A and B is calculated as Equation (5).
MolShaCS separates the charge distribution function into positive (φ
pos) and the negative part (φ
neg). The similarity between two molecules is calculated as the Hogkin’s index:
The two methods introduced so far superpose two molecules to maximizing volume (and electrostatic potential for MolShaCS) overlap between them. Alternatively, there are methods that use a transformation matrix which is obtained from aligning molecular feature frames. ShaEP (reminiscent of Shape and Electrostatic Potential) [
22] represents a molecule with a so-called molecular 3D field-graph. In the graph, vertices are defined for heavy atoms of a molecule following directions of hybridized orbitals in atoms that are not used for forming a covalent bond. These vertices are located at a distance of σ + h Å from the origin atom where σ is van der Waals radius of the atom and h is an adjustable parameter. Additional vertices considered are normal to planar rings that have more than four atoms. Every vertex has charge and shape density information. The charge density of a vertex is calculated as
where q
i is a charge of an atom,
di is a distance from the atom and the vertex, ε
r is the relative permittivity, which can be given by a user, and (4πε
0)
−1 is the Coulomb constant. The shape density of vertex is a summation over all atoms of the Gaussian density function, (Equation (2)). The graph for a molecule is constructed by fully connecting vertices.
A transformation matrix is obtained for matching graphs of two molecules. For matching nodes, electrostatic potential difference should not be larger than a user-defined threshold and the dot product of the shape density vertex should be no less than a threshold given by the user. In addition, compatible edges should have similar length with a length difference less than 1 Angstrom. After obtaining candidate transformation matrices, the similarity scores are given as a sum of Hogkin’s similarity index (Equation (6)) of shape and the electrostatic potential. Shape overlap is calculated following Equation (3). Overlap of electrostatic potential is obtained as
where
k,
l are vertex of molecule A and B,
rk and
rl are the coordinate of them. β is set to one by default. After scoring all transformation matrices, the highest score will be assigned to the query molecule pair.
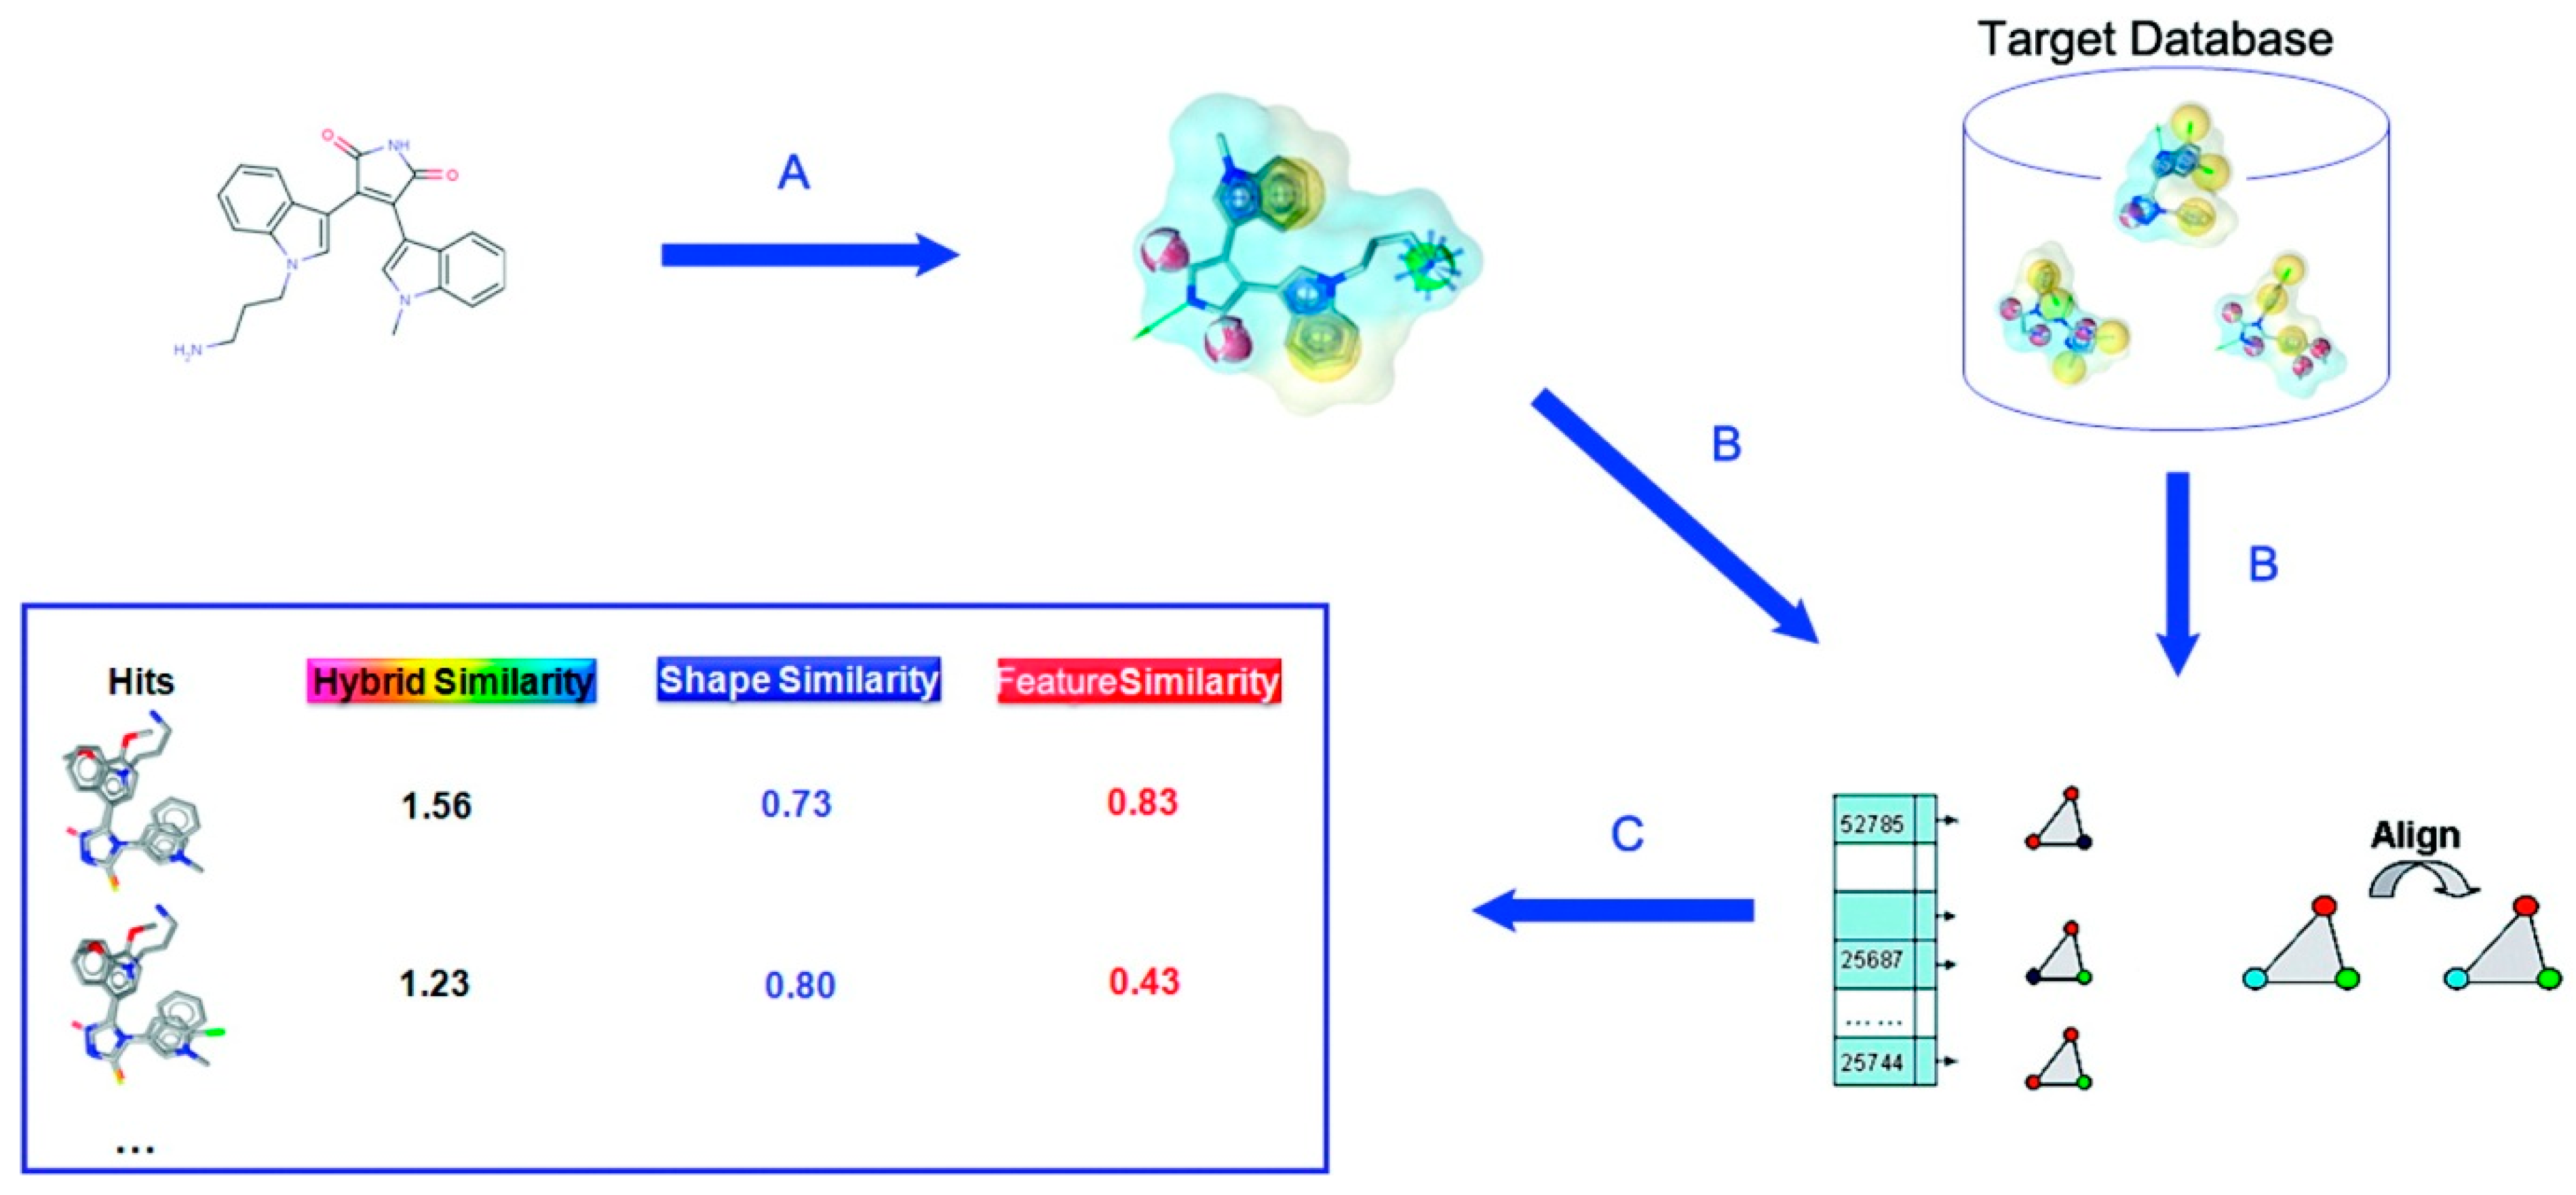
SHAFTS (SHApe-FeaTure Similarity) [
23] is another method that uses a transformation matrix after aligning feature frameworks of two molecules. First, it detects pharmacophores of a given molecule conformation. The pharmacophores are hydrophobic centers, positive charge centers, negative charge centers, hydrogen bond acceptors and donors, and aromatic rings. Then, the program connects all combinations of three points to make triangles and store geometric information of them in a hashing table. The transformation matrix is constructed by least square fitting of triangles from query and template molecules. After overlaying the molecules, volume overlap is calculated following Equation (3). Feature overlap is obtained as below.
f is a pharmacophore feature,
i and
j are feature points.
dij is a distance between feature points
i and
j after superimposition, and
Rf is a tolerance. The similarity of two molecules is given as Equation (10). Procedure of SHAFTS is illustrated in
Figure 1.
Figure 1.
Schematic illustration of SHAFTS procedure. (
A) Generate pharmacophore feature points of selected active molecule; (
B) Search a database by superimposing feature triplet; (
C) Rank compounds by the similarity score. Reprinted with permission from [
23]. Copyright (2015) American Chemical Society.
2.3. Surface-Based Molecular Shape Description
An alternative for molecular shape description is to consider the surface of molecules. Using surface representation, ligand binding can be considered as a matching complementary surface of protein binding site and a ligand surface [
24]. Since 3D structures of proteins and ligands are primarily described by coordinates of atom positions, a surface needs to be constructed from coordinate files. Surface-based LBVS methods are characterized by two factors, how a surface is constructed and the features used to describe molecular surface.
MSMS [
25] is one of the most popular programs for constructing molecular surface. MSMS generates molecular surface by triangularization. Triangular representation is composed of a set of vertices and a group of triangular patches that connect vertices. MOLPRINT3D [
26] is an example of programs that uses MSMS for computing surface of compounds. Points on compound surface are characterized by interaction energies using GRID [
27],
i.e., Lennard-Jones, hydrogen bonds, and electrostatic potential, against probe atoms such as methyl CH
3 carbon, sp
3 NH cation, amide NH
2 group, carbonyl oxygen atom, and anionic phenolate oxygen atom, respectively. These energy values on the surface are binned and then each surface point is assigned with a vector that consists of energies of the position and its neighboring points. Similarity of two molecules is quantified by comparing the vectors of surface points.
Similar to MOLPRINT3D, LASSO [
28] characterizes a molecular surface with the interacting surface point type (ISPT). ISPT is composed of 23 chemical types, such as hydrogen bond donor, lone pair electron, π electron on sp
2 carbon, and halogen. On the surface of a molecule, surface points are generated following the definition of each ISTP. By counting numbers of each ISPT on the surface, a molecule has a feature vector with 23 components. Each number at each component represents how many interaction points of the type are generated on the ligand surface. A similarity between two ligands is predicted by neural network, which is trained by a subset of the DUD compound dataset [
29].
An alternative surface representation is computed from a Voronoi diagram [
30]. A Voronoi diagram partitions a given space with points so that a partition between a pair of points is placed at the same distance from them. Wilson and coworkers presented a molecule comparison method using α-shape [
31]. The computational step of α-shape uses a probe sphere, also called an eraser, of a certain radius. Two atoms are connected by an edge if the eraser probe cannot go through the atom pair indicating that they are close to each other. This concept is expanded to a triplet of atoms; if the eraser can contact all the atoms at the same time, a triangular face is created with three vertices connecting the three atoms. Computation of α-shape is faster than conventional surface generation methods that use space-filling with spheres centered at atomic coordinates. After the surface of a molecule is obtained, similarity of two molecular surfaces can be quantified by computing the similarity of two distribution of distances and angles of normal vectors of all the pairs of facet centers [
32].
BetaDock [
33] uses another surface representation called the β-shape that is generated also from a Voronoi diagram. β-shape uses similar procedure as α-shape but their differences include that β-shape is able to robustly construct surface for a set of spheres of different radii, e.g., a compound with different heavy atoms, which α-shape cannot handle properly [
34]. The BetaDock program represents pocket with β-shape and docks a ligand at the surface of the pocket. Thus, BetaDock is a SBVS method but mentioned here because it uses a different surface representation which can be readily applicable for LBVS methods.
Lastly, we introduce moment-based molecule surface representation. Moment-based methods use a mathematical series expansion and allow compact representation of molecular surface because essentially a surface shape can be specified by coefficient values of the expansion. PARAFIT [
14] describes molecular surface with spherical harmonics. Setting the center of mass of a molecule at the origin of the coordinate system, the surface of the molecule is characterized as radial expansion:
where (θ, φ) are spherical coordinates and y
lm is a spherical harmonic function. a
lm and L are an expansion coefficient and order of expansion, respectively. The a
lms, are considered as molecular fingerprints to describe molecular shape. The distance between two molecules, A and B, is calculated as below.
where
, and
. Because a
lm are expansion coefficients for spherical harmonics, the distance D in Equation (12) are rotationally invariant.
Our group proposed 3D Zernike moment-based molecular surface description method [
35,
36]. The 3D Zernike function is defined as follows:
where
Yml is the spherical harmonics and
Rnl(
r) is the radial function.
m and
l are integers that have ranges −1 < m < 1 and 0 ≤ 1 ≤ n. After generating Connolly surface of a molecule [
37], the surface is mapped on the 3D grid and voxelized, which is considered as the 3D function
f(
x) to be expanded. Then, 3D Zernike moments of surface shape,
f(
x), are computed as Equation (14).
To obtain rotational-invariant descriptors, a norm, is computed. This vector, Fnl is called 3D Zernike Descriptor (3DZD). 3DZD is mathematically superior to spherical harmonics because it has the radial function, which can incorporate distance information of each surface point from the molecular center. Thus, complicated, non-star-like structures can be also properly represented. To compare the similarity between molecules, correlation coefficients or Euclidean distance of two Fnl is calculated.
3DZD can be directly applied to represent overall (global) shape and physicochemical properties of a molecule [
38]. 3DZD can be also used to describe local properties of a molecule by first segmenting surface into patches as introduced in Patch-Surfer [
39] and Patch-Surfer2.0 [
40]. Unlike methods that describe global properties of a molecule as a whole, which we call later global property-based methods or global methods, Patch-Surfer and Patch-Surfer2.0 try to find similar localized regions between molecules. Thus, later we called Patch-Surfer a local property-based method or local method because it explicitly compares local regions of molecules. The motivation of using patches is to be able to recognize local similarity of molecules, including molecules in different conformations. Segmented surface patches are described with several features, including surface shape, hydrophobicity, the electrostatic potential, and visibility (concavity). All these features can be expressed by 3DZD. To represent a physicochemical property of a molecule, its values are mapped on the surface, which are considered as the 3D function and 3DZD are computed in the same way as Equation (14). In Patch-Surfer2.0, a new feature that describes relative position of each patch in the surface was added. The feature similarity between patches is calculated as the Euclidean distance of 3DZDs. Then, the overall similarity between patches from two molecules is the weighted sum of all feature similarities. Finally, based on the similarity of each patch pair, similarity of two molecules is computed by optimizing corresponding patches in the two molecules so that similarity is maximized (or the distance is minimized) [
41].
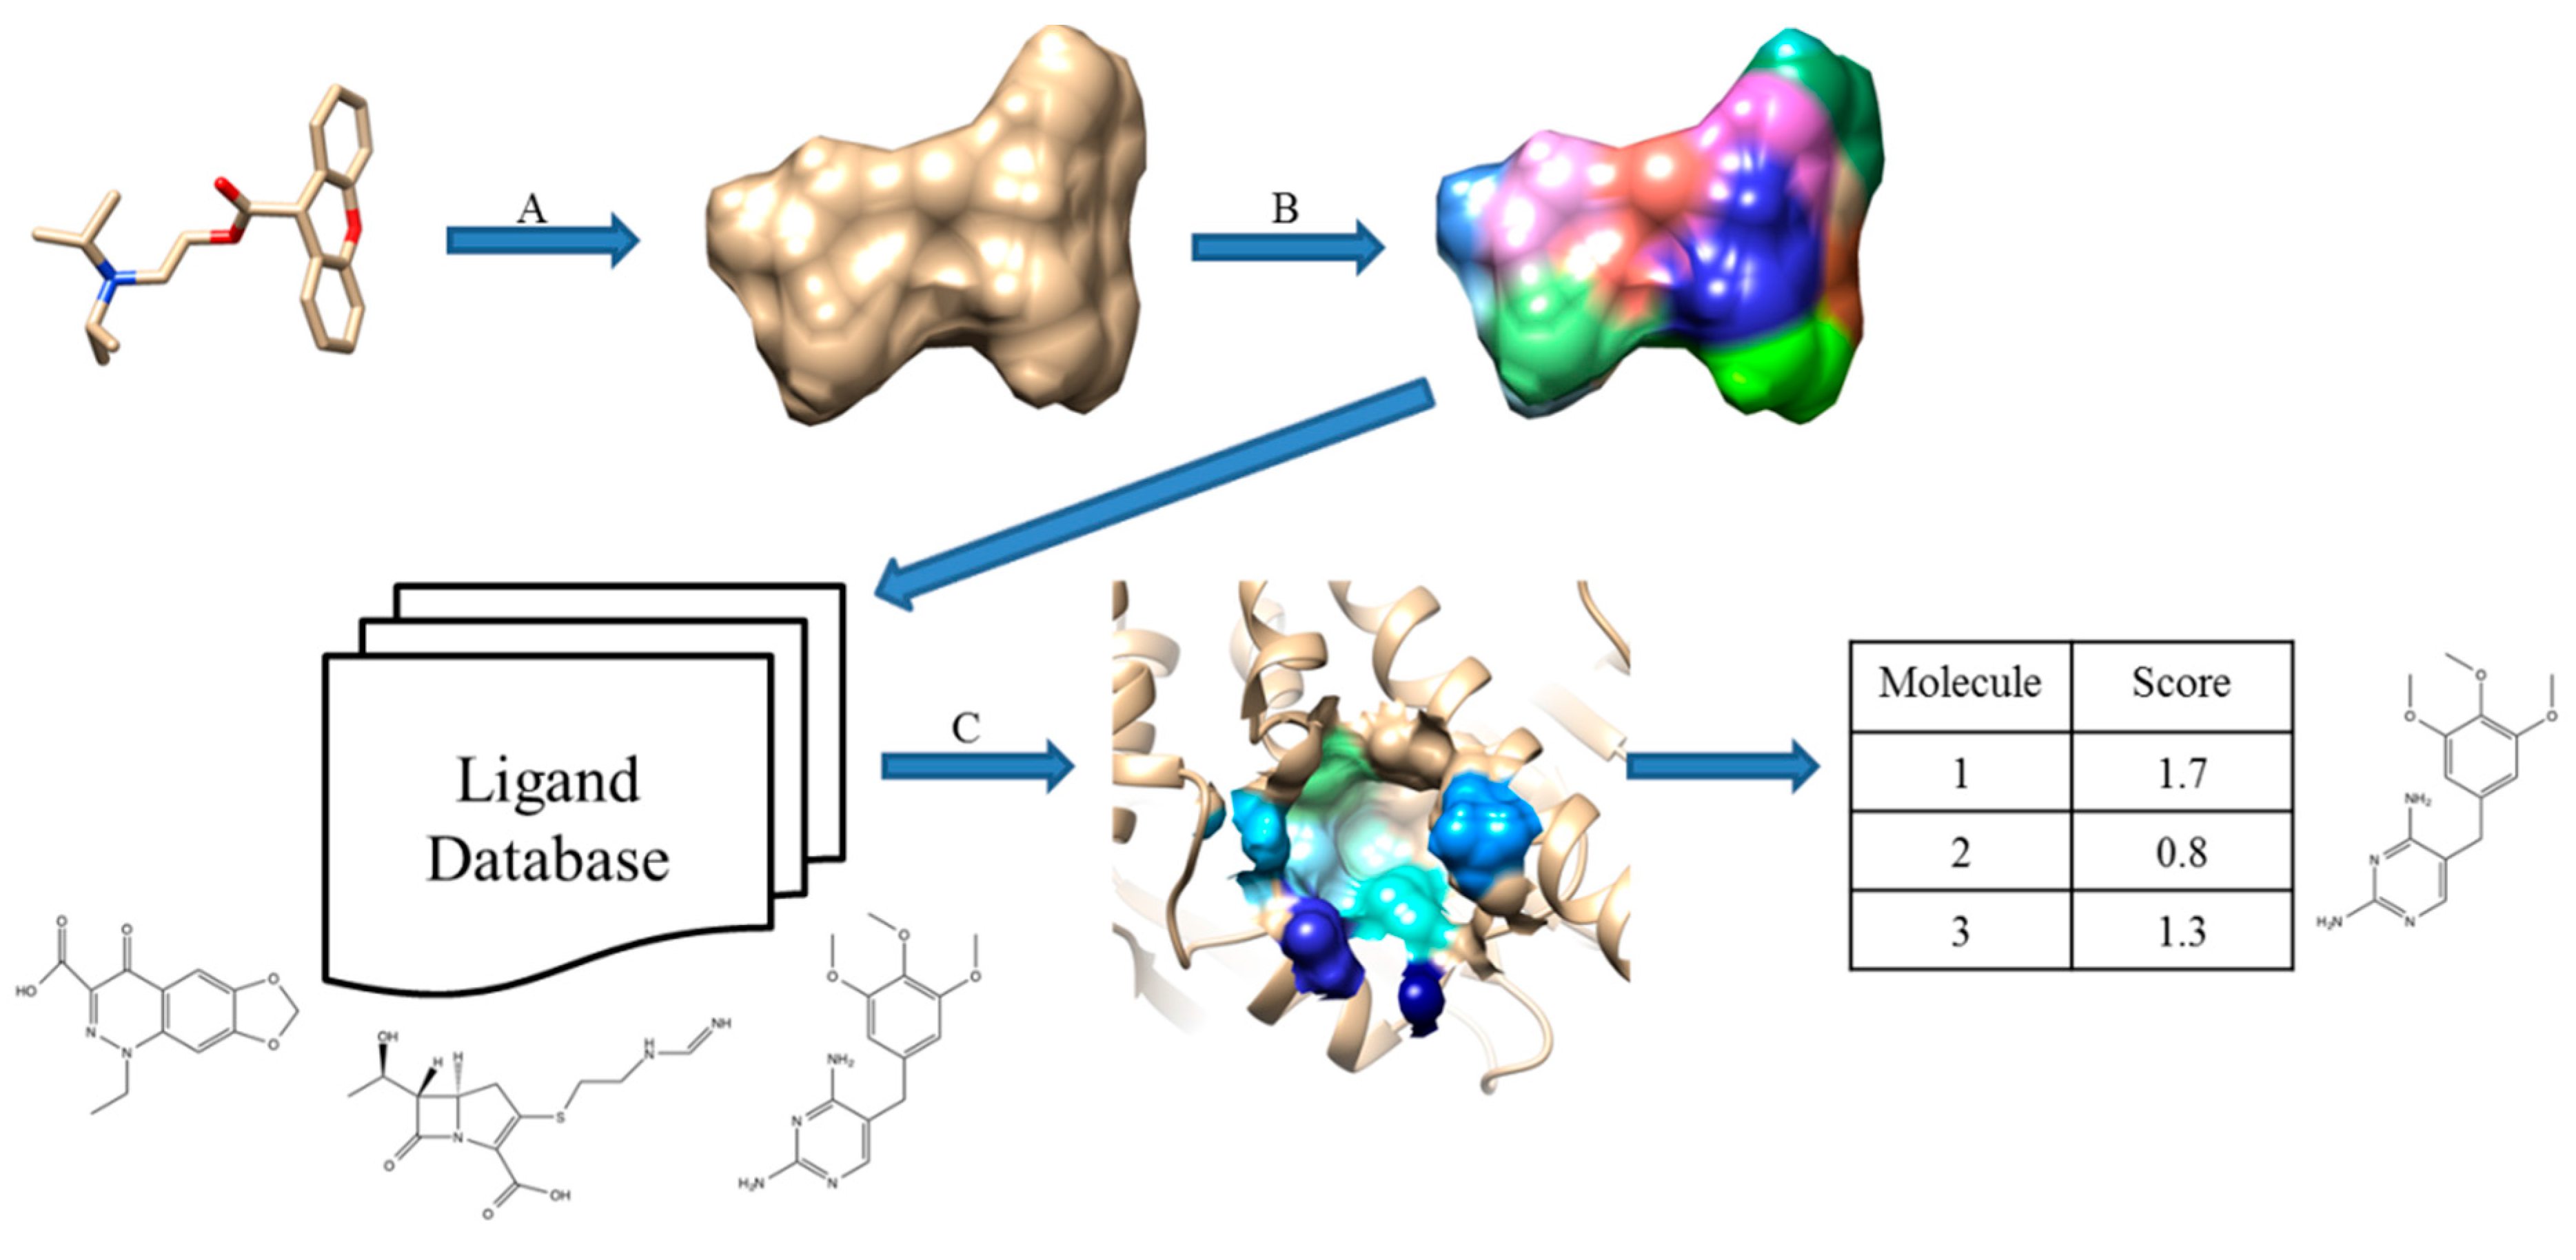
Patch-Surfer and Patch-Surfer2.0 were originally developed for comparing query pockets in protein surface against known binding pockets in a database to predict ligands for the query pocket. This approach was further extended in PL-PatchSurfer [
12], which compares a query protein pocket against known ligands. The pocket and ligand surfaces are segmented into patches and matched in the same way as performed in Patch-Surfer and Patch-Surfer2.0 except that patches with complementary electrostatic potential are matched and additional features, hydrogen-bonding acceptors and donors, are also considered. Schematic illustration of PL-PatchSurfer is shown in
Figure 2.
Figure 2.
Schematic illustration of PL-PatchSurfer. (A) Generated molecular surface of a ligand; (B) Patch generation and 3DZD of physicochemical feature calculation; (C) Searching binding ligands from a ligand database by finding complementary patch pairs with the query receptor pocket.
Figure 2.
Schematic illustration of PL-PatchSurfer. (A) Generated molecular surface of a ligand; (B) Patch generation and 3DZD of physicochemical feature calculation; (C) Searching binding ligands from a ligand database by finding complementary patch pairs with the query receptor pocket.
To summarize, the main advantage of surface-based methods is that molecular global and local similarity can be identified that are independent from atomic details of molecules. Also, representing physicochemical properties on molecular surface is intuitive and technically easy to implement.
2.4. Field-Based Methods
The fourth category we introduce is field-based methods. As we have seen so far, molecular properties such as electrostatic potential are assigned to atoms or surface points in volume-based and surface-based methods. In contrast, field-based methods compare the molecular field itself.
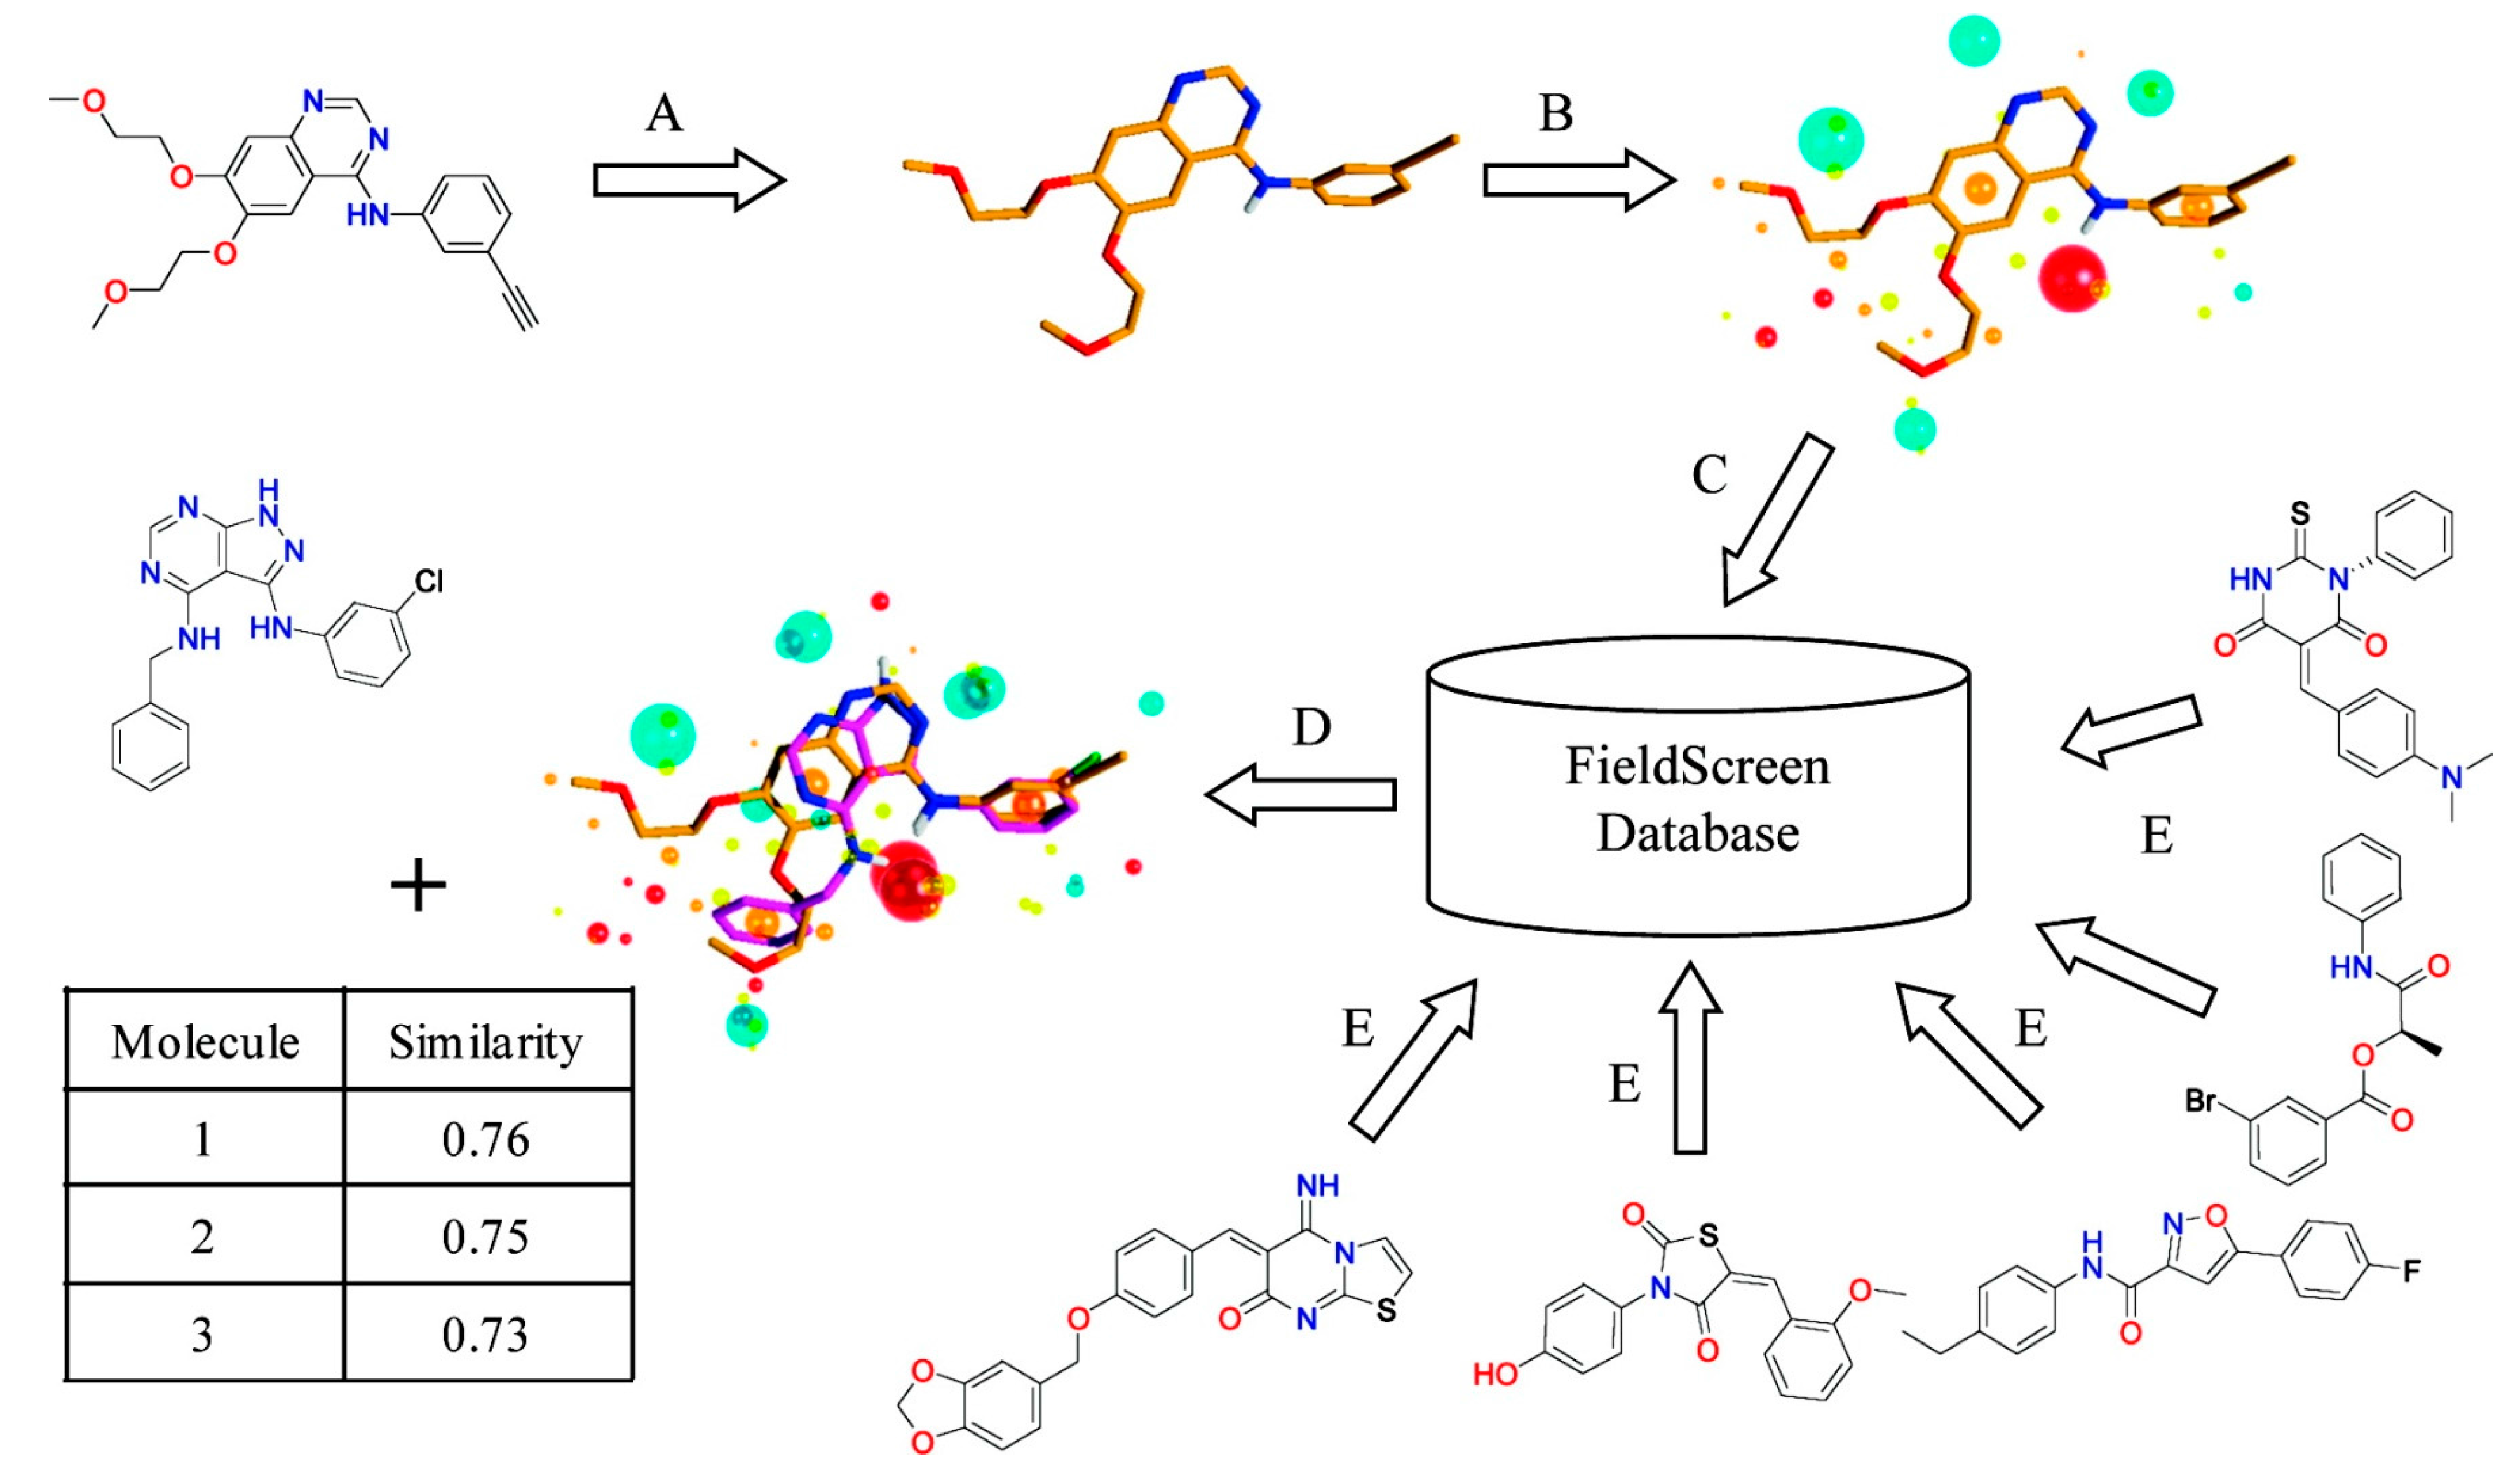
Cheeseright
et al. developed an algorithm called Blaze [
13,
42]. They calculate four molecular fields for the 3D space around a target molecule by rolling a probe sphere on the 3D grid. In addition, van der Waals potential described by the Morse potential, the positive and the negative part of the electrostatic potential, and hydrophobicity are considered. To simplify the field representation, grid points that show similar energy values are merged and they are represented by the maximum points of each field. The similarity between molecules is calculated by the number and the size of the field points matched after aligning molecules so that the overlap between grid points is maximized.
Figure 3 illustrates the Blaze workflow.
BRUTUS [
43] focuses on the electrostatic potential to represent the field around molecules. Because selection of partial charges is important for aligning molecules, it uses four types of empirical charges: Gasteiger-Huckel, Gasteiger-Marsili, MMFF94, and MOPAC6.0 MNDO/ESP. The electrostatic potential of a ligand is calculated by CoMFA [
44] with a 1.0 Å grid. The similarity between ligands is calculated by the Hogkin index using electrostatic potentials inside the van der Waals surface.
Field-based methods compare how the presence of molecules affects to other molecules in the space but do not directly compare 3D structure of molecules. Parretti
et al. reported that the alignment using electrostatic potential is often different from the optimal superimposition [
45]. However, the flip side of the coin is that because the alignment is not based on actual shape, it has the ability to find new leads that are structurally different from a template ligand.
Figure 3.
Schematic view of Blaze, which was previously called Fieldscreen. (
A) A known active molecule is selected as a query; (
B) Field points generation; (
C) Searching a ligand database; (
D) Rank compounds in the database by the similarity score. Reprinted with permission from [
13]. Copyright (2015) American Chemical Society.


