1. Introduction
The search for chemicals for use in cancer treatments involves many times the discovery of new prototypes based in natural products, especially those obtained from plants and microorganisms [
1]. This approach has led to the discovery of several drugs currently used in cancer therapy, including vinblastine (Velban
®), vincristine (Oncovin
®), vindesine (Eldisine
®), vinorelbine (Navelbine
®), paclitaxel (Taxol
®), docetaxel (Taxotere
®), podofilotoxin, etoposide (Etopophos
®), teniposide (Vumon
®), camptothecin, topotecan (Hycamtin
®), and irinotecan (Camptosar
®) [
2,
3,
4]. However, considering that less than 2% of all plants with therapeutic properties have been properly analyzed for the detection and isolation of compounds with cytotoxic activity [
5], there is an extraordinary potential to discover new compounds with antitumor activity in Brazilian plant species due to their high phylogenetic and chemical diversity. In this context,
Nectandra megapotamica (Lauraceae), popularly known in Brazil as “canela-lora”, “canela-preta” or “canela-do-mato”, has been used in traditional medicine in the treatment of rheumatism and to relieve pain [
6,
7]. Phytochemically, this plant accumulates several natural products such as neolignans, phenylpropanoids and alkaloids with antileishmanial [
8], anti-inflammatory [
9] and antitrypanosomal [
7] activities. As part of a continuous effort to find new cytotoxic compounds from Brazilian flora [
10,
11], this study reports a bioactivity-guided fractionation of the MeOH extract from the leaves of
N. megapotamica, aiming at the isolation of compounds with
in vitro cytotoxic activity. Additionally, we also propose a possible mechanism of action for the most active compounds against human leukemia (HL-60) cells.
2. Results and Discussion
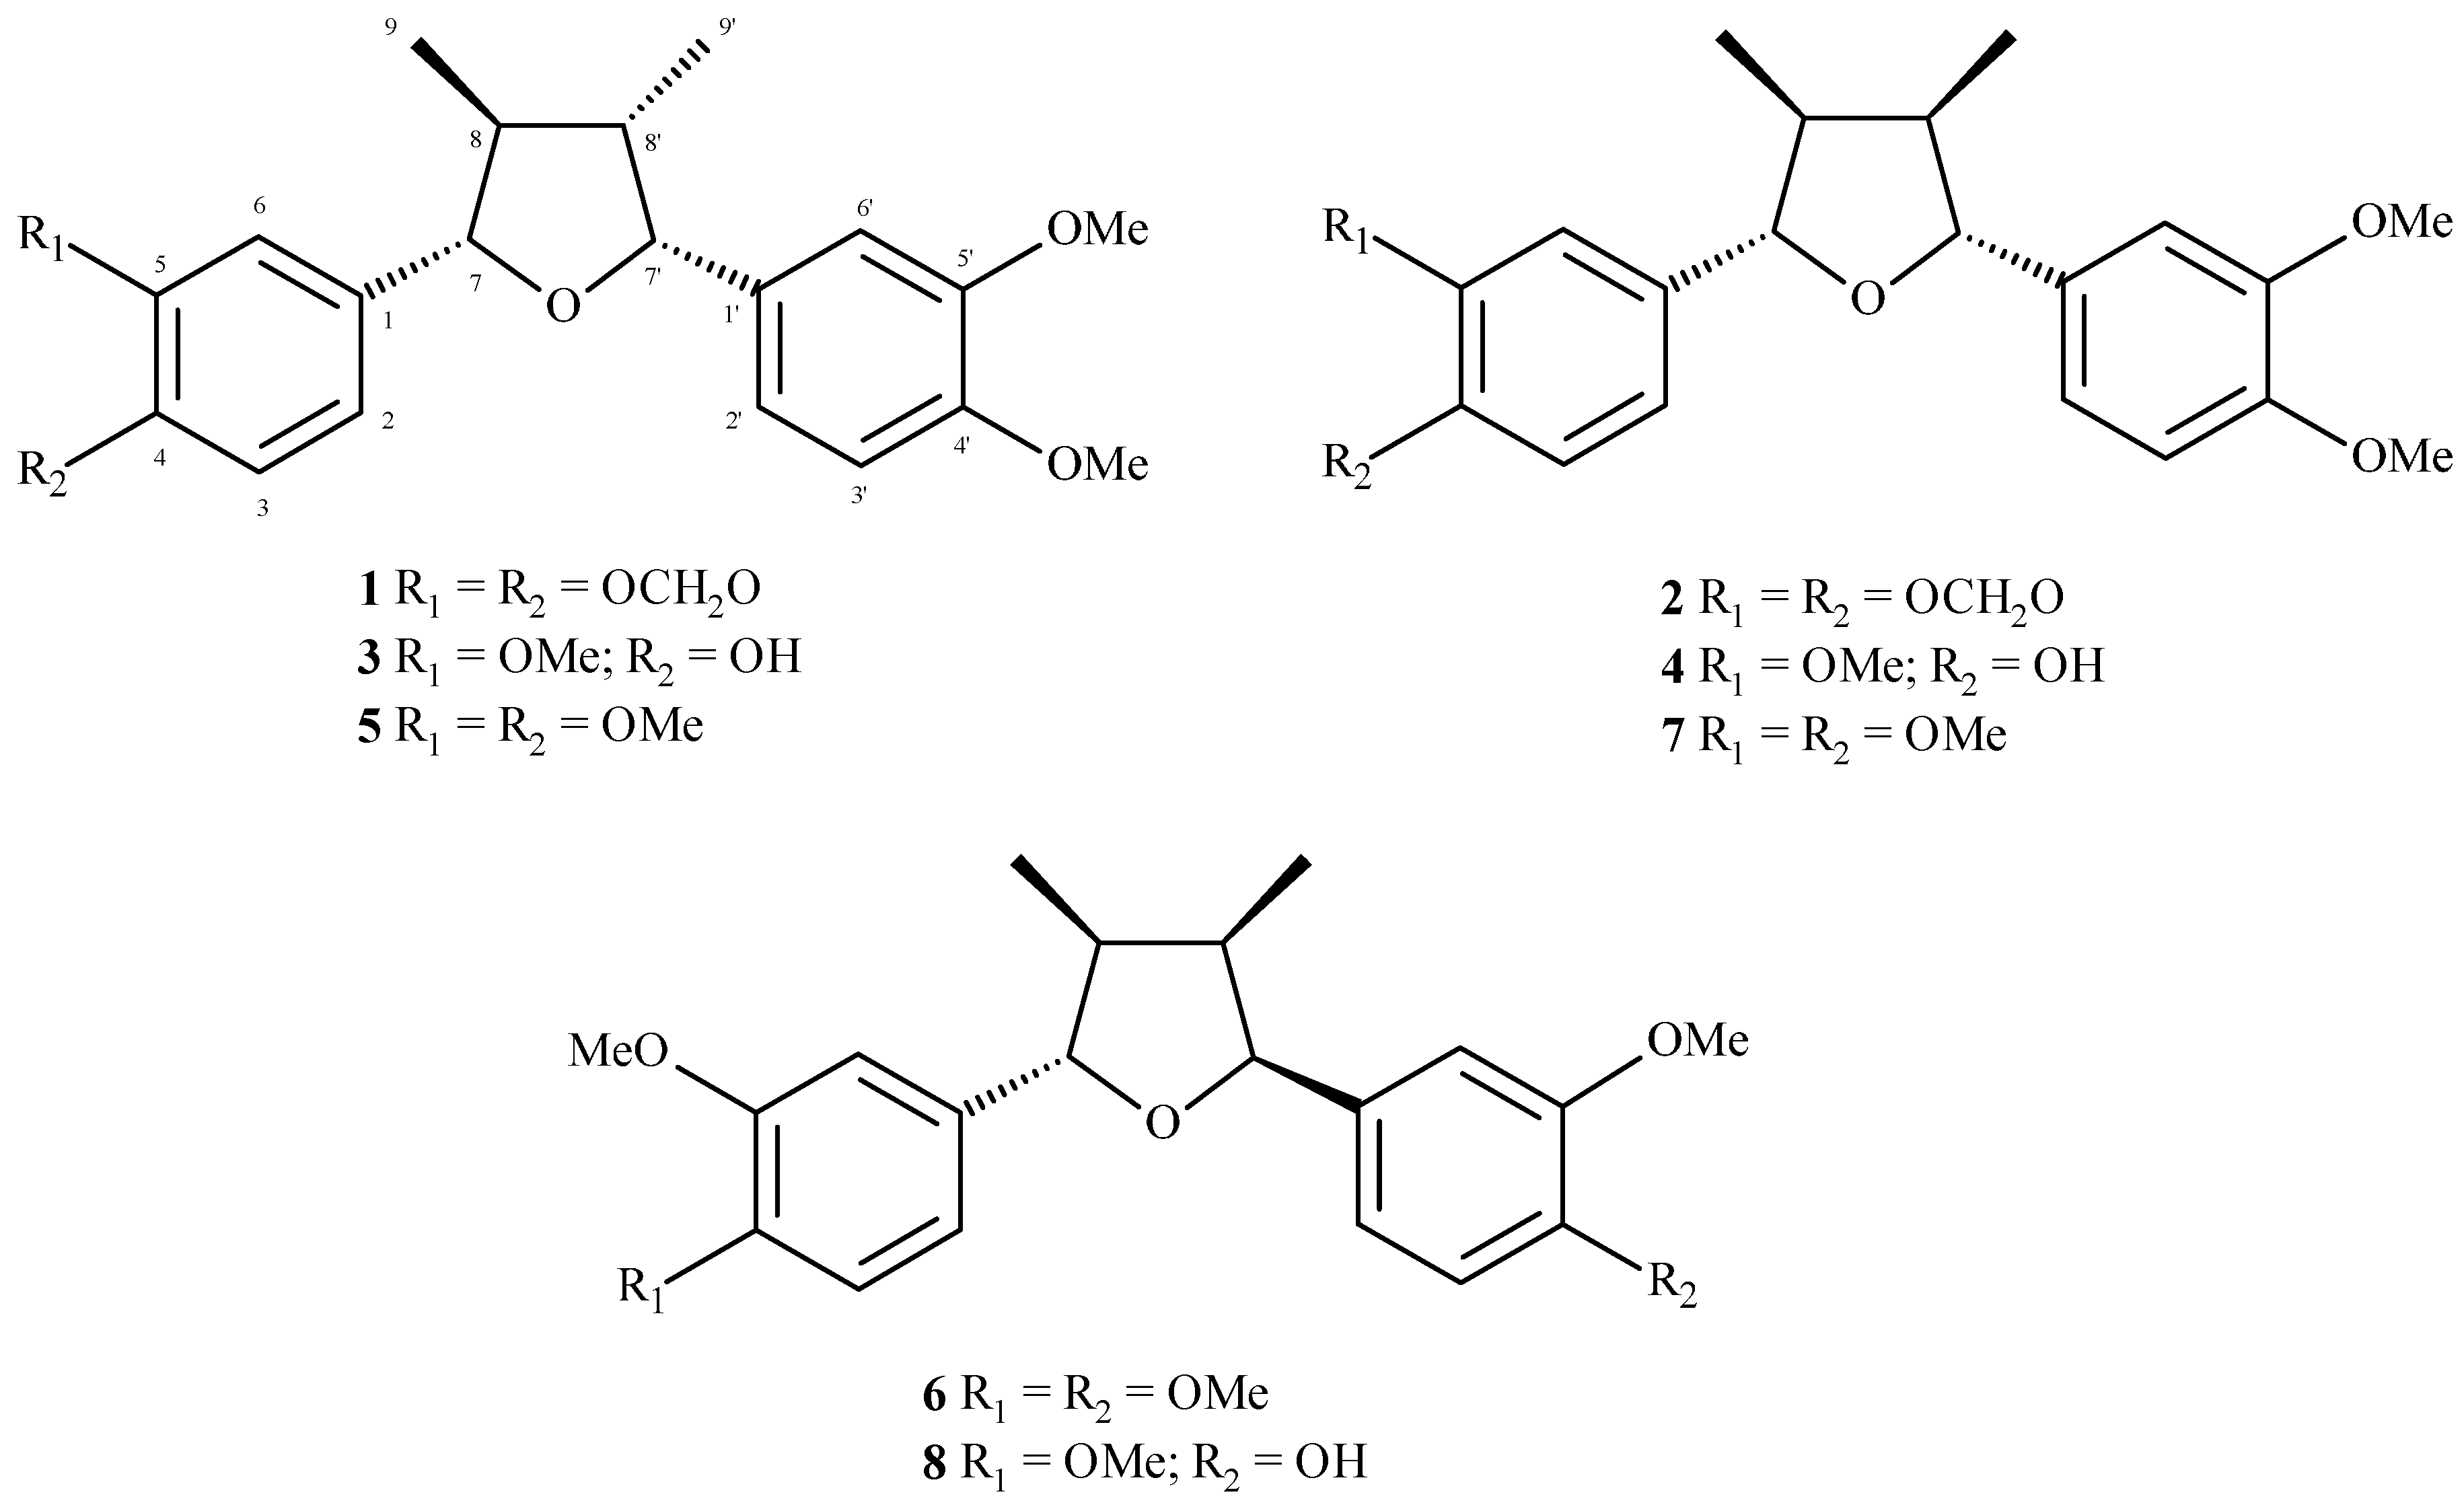
After several chromatographic procedures, guided by the evaluation of cytotoxic activity, we isolated eight related compounds from MeOH extract from leaves of
N. megapotamica. The
1H-NMR spectra of
1–
8 indicated the presence of a 1,3,4-trisubstituted aromatic ring due to the signals ranging from δ 6.7 to 7.1 (H-2/H-2′, H-3/H-3′ and H-6/H-6′). Additionally, signals attributed to methoxyl or methylenedioxyl groups were detected at approximately δ 4.0 (s) and δ 6.0 (s), respectively. These data, associated to the doublets assigned to oxymethine hydrogens H-7/H-7′ (δ 4.43–5.48) as well as to methyl groups linked to C-8/C-8′ (δ 0.63–1.08), suggested the occurrence of tetrahydrofuran neolignans [
12]. The
13C-NMR of compounds
1–
8 showed peaks at δ 108.1–149.5 attributed to aromatic rings (C-1 to C-6 and C-1′ to C-6′), a tetrahydrofuran unit at δ 43.2–47.4 (C-8/C-8′) and δ 85.1–88.2 (C-7/C-7′) as well as methyl groups (C-9/C-9′) at δ 8.9–14.8. Substituents on the aromatic rings such as methoxyl and/or methylenedioxyl groups were observed approximately at δ 56 and δ 101, respectively. Finally, comparison of spectral data with those reported in the literature [
12,
13,
14,
15,
16,
17], associated to LREIMS analysis, allowed the identification of calopeptin (
1), machilin-G (
2), machilin-I (
3), aristolignin (
4), nectandrin A (
5), veraguensin (
6), ganschisandrin (
7), and galgravin (
8), whose structures are shown in
Figure 1.
Figure 1.
Tetrahydrofuran neolignans 1–8 isolated from the leaves of N. megapotamica.
Figure 1.
Tetrahydrofuran neolignans 1–8 isolated from the leaves of N. megapotamica.
As previously reported in the literature,
N. megapotamica produces different compounds with important pharmacological and biological activities such as trypanocidal alkaloids [
6], fungitoxic phenylpropanoids [
18] as well as anti-inflammatory, trypanocidal and antileishmanial neolignans [
7,
8]. However, there are no previous studies evaluating the cytotoxic activity against cancer cells of crude extract and/or isolated compounds. Thus, cytotoxicity of crude MeOH extract, partition phases and compounds
1–
8 obtained from leaves of
N. megapotamica was determined on murine melanoma (B16F10) and human (HeLa, MCF7, A2058 and HL-60) cancer cell lines. Since crude MeOH extract displayed activity against all tested cell lines, this material was partitioned using hexane, CH
2Cl
2 and EtOAc. Hexane and CH
2Cl
2 phases showed activity while EtOAc phase was inactive (IC
50 > 100 µg/mL) (
Table 1).
Table 1.
IC50 (µg/mL) values of neolignans 1–8 from N. megapotamica and positive control (cisplatin) against different tumor cell lineages.
Table 1.
IC50 (µg/mL) values of neolignans 1–8 from N. megapotamica and positive control (cisplatin) against different tumor cell lineages.
| | IC50 (µg/mL) |
|---|
| Cancer Cell Line |
|---|
| B16F10 | HeLa | MCF7 | A2058 | HL-60 |
|---|
| MeOH extract | 75.1 ± 2.9 | 83.1 ± 4.0 | 93.3 ± 2.5 | 75.2 ± 5.7 | 56.1 ± 5.8 |
| Hexane phase | 81.1 ± 1.8 | >100 | >100 | >100 | 89.0 ± 4.2 |
| CH2Cl2 phase | 57.3 ± 3.1 | 80.6 ± 2.4 | 73.2 ± 1.6 | 78.1 ± 3.2 | 39.3 ± 3.4 |
| EtOAc phase | >100 | >100 | >100 | >100 | >100 |
| 1 | 72.8 ± 3.0 | >100 | >100 | 98.1 ± 1.2 | 73.1 ± 4.9 |
| 2 | >100 | >100 | >100 | >100 | 89.0 ± 2.1 |
| 3 | >100 | >100 | >100 | >100 | 53.5 ± 3.6 |
| 4 | 41.1 ± 2.4 | 65.1 ± 2.8 | 54.3 ± 2.8 | 67.8 ± 3.4 | 14.2 ± 0.7 |
| 5 | 40.4 ± 1.9 | 55.4 ± 2.7 | 69.0 ± 3.3 | 59.7 ± 3.1 | 16.9 ± 0.8 |
| 6 | 37.9 ± 1.7 | >100 | >100 | >100 | 18.8 ± 0.4 |
| 7 | 31.2 ± 1.3 | 99.1 ± 5.2 | >100 | 75.0 ± 3.9 | 29.1 ± 1.2 |
| 8 | 60.0 ± 3.2 | 68.0 ± 3.2 | >100 | >100 | 16.5 ± 0.8 |
| cisplatin | 53.1 ± 4.2 | 20.6 ± 1.5 | 21.1 ± 1.4 | 43.2 ± 3.2 | 21.2 ± 2.3 |
Following bioactivity-guided fractionation, individual compounds were isolated from different fractions and their IC
50 values were determined against different tumor cell lines (
Table 1). Compounds
1 and
2 were isolated from the hexane phase, being
1 the most active. IC
50 values for human cancer cells varied from 73.1 ± 4.9 to 98.1 ± 1.2 µg/mL, while the IC
50 for murine melanoma B16F10 was 72.8 ± 3.0 µg/mL. Using the same approach, the CH
2Cl
2 fraction was also subjected to chromatographic separation and compounds
3–
8 were isolated from the bioactive fractions. Compounds
3 and
7 displayed weak cytotoxic activity against human cancer cells. On the other hand, compounds
4 and
5 displayed activity against all tested cell lines with IC
50 values ranging from 69.0 ± 3.3 to 14.2 ± 0.7 µg/mL. Compound
6 showed strong activity against HL-60 (IC
50 of 18.8 ± 0.4 µg/mL) and B16F10 (IC
50 37.9 ± 1.7 µg/mL) cell lines, higher than the positive control drug, cisplatin (IC
50 of 21.2 ± 2.3 and 53.1 ± 4.2 µg/mL, respectively), but was inactive against the other tested human cancer cells. Similarly, compound
8 displayed promising cytotoxic activity to HL-60 cell lines (IC
50 16.5 ± 0.8 µg/mL) but lower activity against other human cancer cells. Considering the structural differences among the isolated neolignans, it was suggested that the presence of hydroxyl and methoxyl substituents on the aromatic rings of
4 and
8 might have contributed to the higher efficacy among the tested compounds. However, if these groups are substituted by a methylenedioxyl moiety, the activity is strongly reduced, as could be observed to compounds
1 and
2. Otherwise, the presence of four methoxyl groups, as observed to compounds
4–
6 and
8, caused an increment in the cytotoxic potential.
Additionally, because compounds
4,
5 and
8 displayed higher antitumor potential against HL-60 cells (human leukemia), further investigation for better understanding their cytotoxic properties was carried out. Treatment of HL-60 cells with compounds
4,
5 and
8 induced several apoptotic hallmarks, such as cytoplasm retraction, bleb formation (apoptotic bodies) and condensation of nuclear material (pyknosis) followed by chromatin fragmentation (karyorrhexis) [
19,
20]. To verify whether morphological alterations induced by
4,
5 and
8 were accompanied by changes in the mitochondrial transmembrane potential (ΔΨm), the cationic lipophilic dye, TMRE, was used. It has been reported that ΔΨm collapse constitutes an early event of apoptosis and marks an already irreversible stage of the apoptotic process [
21,
22,
23].
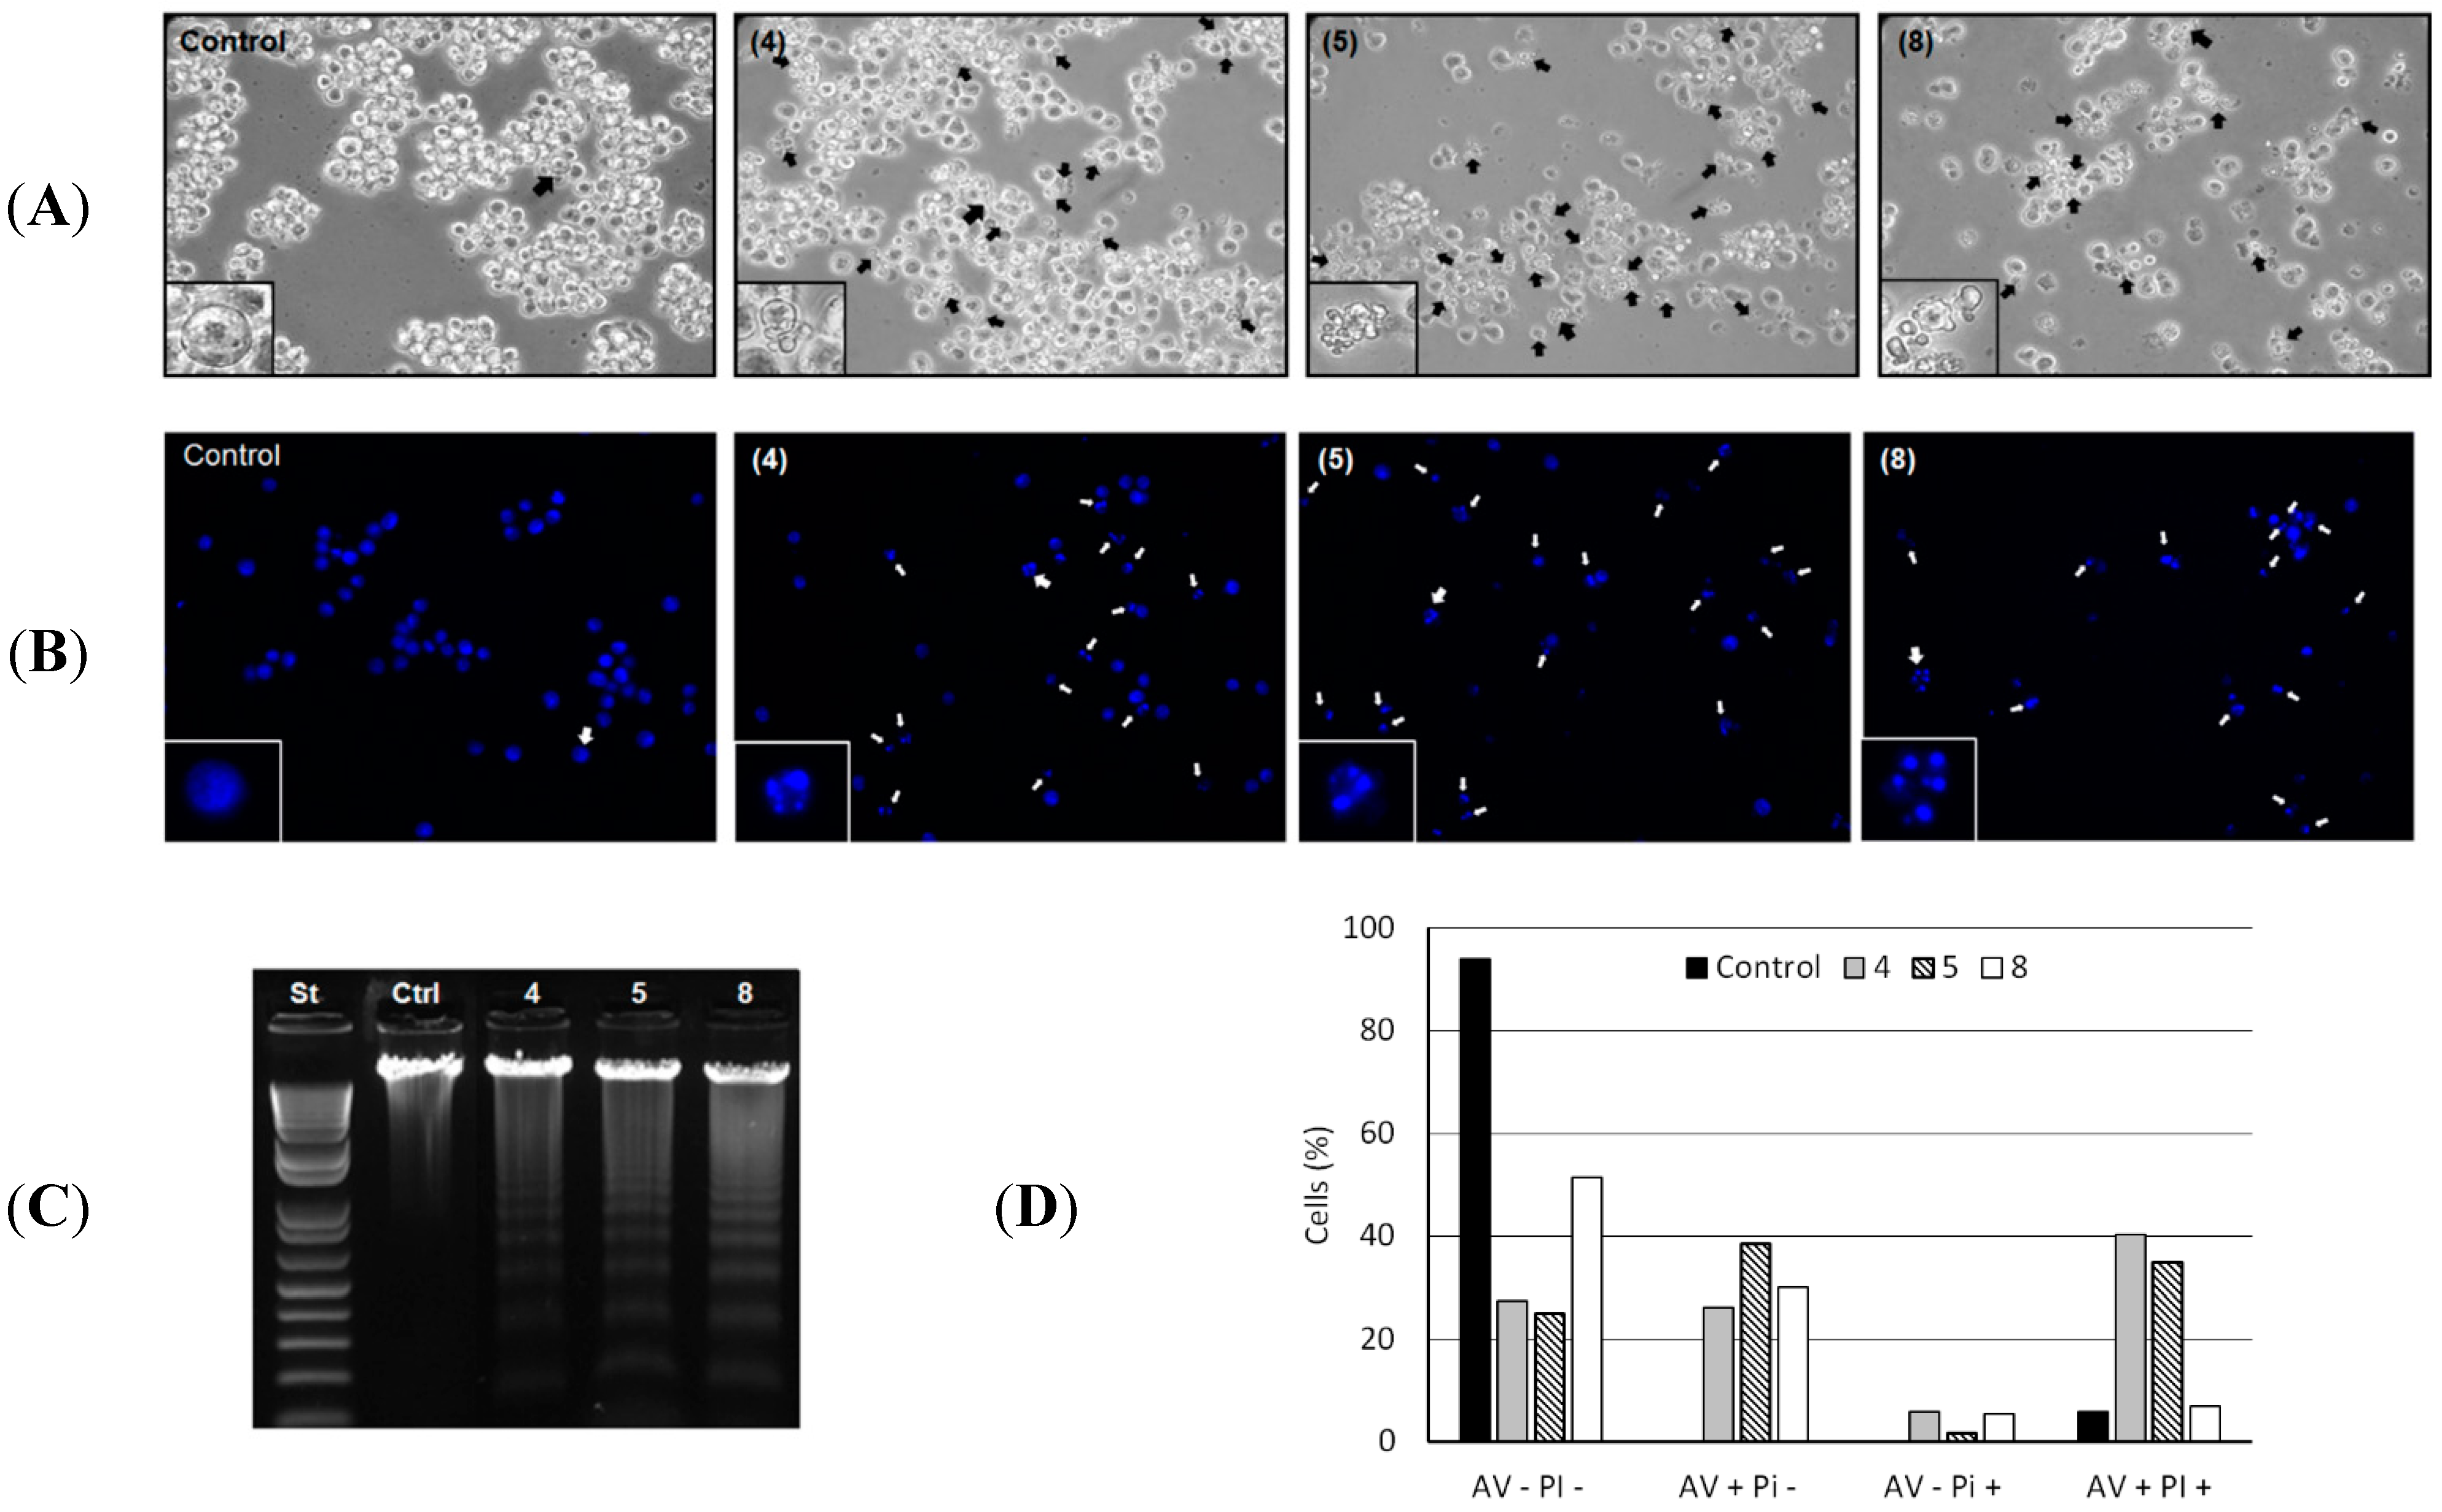
Morphological alterations in HL-60 cells induced by the compounds
4,
5 and
8 are shown in
Figure 2A. The formation of blebs and cell fragmentation could be directly related to an apoptosis process as described elsewhere [
19]. Chromatin condensation and fragmentation were also evidenced. Analysis by fluorescence microscopy of the genome integrity of HL-60 cells revealed chromatin condensation in 60.2%, 67.8% and 37.0% of total cells treated with 50 µg/mL of
4,
5 and
8, respectively (
Figure 2B). Cleavage of chromosomal DNA into oligonucleosomal fragments was alternatively evaluated by gel electrophoresis of the tumor cell DNA after incubation with 50 µg/mL of each compound for 24 h, resulting in a ladder fragmentation pattern observed in agarose gel (
Figure 2C).
Figure 2.
(A) Morphological changes induced by 4, 5 and 8. HL-60 cells were incubated with 50 µg/mL of each compound for 24 h and analyzed by light microscopy. The formation of blebs in cell membrane was evidenced in all HL-60 treated cells. Magnification ×400; (B) Chromatin condensation and fragmentation analysis by fluorescence microscopy. 1 × 10⁵ HL-60 cells were incubated with 50 µg/mL of 4, 5 and 8 for 24 h and stained with DAPI (blue) for chromatin analysis (original magnification, ×400). White arrows indicate chromatin condensation and fragmentation process; (C) DNA analysis of HL-60 cells after incubation with 50 µg/mL of 4, 5 and 8 for 24 h. DNA was extracted from tumor cells and analyzed in 1% agarose gel; (D) Translocation of phosphatidylserine in B16F10-Nex2 (5 × 10⁵ cells) previously incubated with compounds 4, 5 and 8 at 100 µg/mL and negative control (RPMI medium) for 24 h. AV−PI− (live cells); AV+PI− (early apoptotic cells); AV−PI+ (necrotic cells); AV+PI+ (late apoptotic cells).
![Molecules 20 12757 g002]()
The externalization of the inward-facing phosphatidylserine of the cell membrane to the outer layer is a well-known apoptotic hallmark, and Annexin V is a phosphatidylserine-binding protein currently used for the detection of apoptosis [
19]. Thus, induction of apoptosis by compounds
4,
5 and
8 in HL-60 cells was further confirmed by evaluation of phosphatidylserine externalization using the Annexin-V/PI assay. We observed that compounds
4,
5 and
8 significantly increased the number of early apoptotic cells (AV+/PI−: 26.2%, 38.5% and 12.7%) and late apoptotic cells (AV+/PI+: 34.5%, 29% and 1%) relative to negative control (
Figure 2D). Early apoptosis is characterized by single Annexin V (AV) staining and double staining of AV and PI only occurs in the later stages of apoptosis, probably when cell membranes have been damaged during apoptosis or in necrotic cells with no single AV staining [
24]. The necroptosis cell death process was discarded during treatment with compounds
4,
5 and
8 since their cytotoxic activity at 100 µg/mL were not inhibited by necrostatin-1 (data not shown), a well-known necroptosis inhibitor [
25].
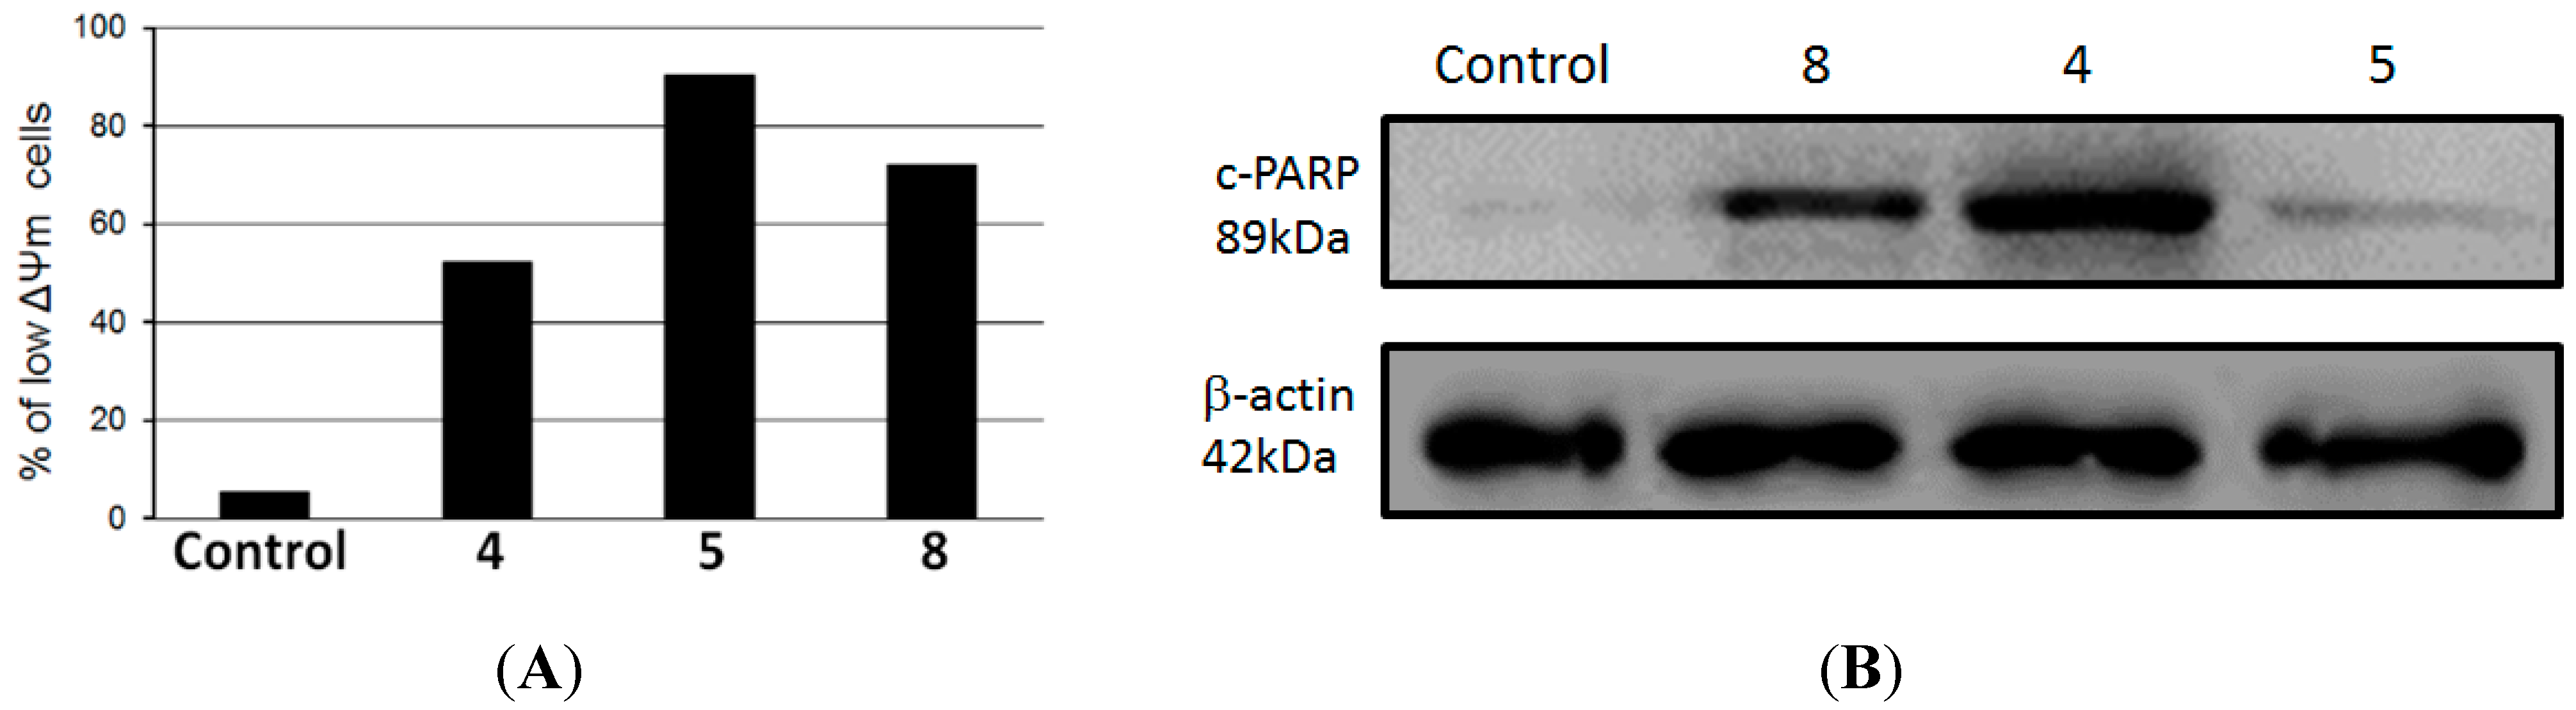
Apoptosis occur mainly by the extrinsic, or death receptor pathway, and the intrinsic, or mitochondrial, pathway [
26]. Since HL-60 cells undergo apoptosis during compounds
4,
5 and
8 treatment, we investigated whether the intrinsic mitochondrial pathway might be involved. Cells were treated with 100 µg/mL of
4,
5 and
8 for 24 h and then ΔΨm was determined by flow cytometry using TMRE probe. As determined by flow cytometry, compounds
4,
5 and
8 induced loss of mitochondrial membrane potential in 90.4%, 72.2% and 52.2% of HL-60 treated cells, respectively, whereas only 5.3% of untreated control cells presented a low ΔΨm (
Figure 3A). In addition, we observed that there was an increase in the levels of cleavage of poly(ADP-ribose) polymerase (PARP) in HL-60 treated cells compared to a negative control, as observed by immunoblotting positive spots at 89 kDa (
Figure 3B), a well-known apoptotic hallmark in HL-60 cells [
24]. Cleavage of PARP is catalyzed by caspase-3 in the later events of apoptosis and is related to depletion of NAD and ATP during apotosis [
27].
Figure 3.
(A) Mitochondrial membrane depolarization induced by compounds 4, 5 and 8 in HL-60 cells; (B) Lysates from HL-60 cells, previously treated with compounds 4, 5 and 8 at 100 µg/mL for 24 h at 37 °C, were analyzed by Western blotting. Antibodies against cleavage PARP and β-actin (protein loading control) were used.
Based on the obtained data, we believe that these compounds might trigger cell death through the mitochondria-mediated apoptosis pathway in HL-60 cells. Current available chemotherapic treatments of leukemia have many side effects and deficiencies, including drug-resistance against apoptosis [
28,
29]. Therefore, the identification of novel compounds that have potential to seed new chemotherapic drugs that specifically act against this type of cancer is of utmost importance.
3. Experimental Section
3.1. General Experimental Procedures
1H- and 13C-NMR spectra were recorded, respectively, at 300 and 75 MHz on an Avance III 300 spectrometer (Bruker, Fremont, CA, USA). CD3OD or CDCl3 (Aldrich, St. Louis, MO, USA) were used as solvent and as internal standard. LREIMS (70 eV) were measured on a 14B/QP5050A spectrometer (Shimadzu, Kyoto, Japan). Silica gel (Merck, Kenilworth, NJ, USA, 230–400 mesh) and Sephadex LH-20 (Aldrich) were used for column chromatography separations while silica gel 60 PF254 (Merck) was used for analytical TLC. Semi-preparative HPLC chromatography separations were performed on an Ultimate 3000 system (Dionex, Sunnyvale, CA, USA) equipped with a quaternary pump system, a PDA detector, and a Phenomenex reversed-phase C18 column (250 × 10.0 mm, 5 μm). All solvents used for column chromatography were of analytical grade (CAAL, São Paulo, Brazil) while those used for HPLC separations were of HPLC grade (Tedia, Fairfield, OH, USA).
3.2. Plant Material
Leaves of N. megapotamica were collected at the Atlantic Forest area, São Paulo State, Brazil, in April, 2010. The identification was performed by Dr. Maria Claudia M. Young (Instituto de Botânica-SP) and a voucher specimen has been deposited in the Herbarium of Instituto de Botânica de São Paulo.
3.3. Extraction and Isolation
Dried leaves of N. megapotamica (580 g) were powdered and exhaustively extracted with MeOH (5 × 1000 mL at room temperature). The obtained material was evaporated to dryness under reduced pressure, resuspended in 3:1 MeOH-H2O and subjected to sequential partition using hexane, CH2Cl2 and EtOAc. After evaporation of solvent under reduced pressure, hexane (28 g), CH2Cl2 (3 g) and EtOAc (7 g) phases were obtained. Part of the active hexane phase (27 g) was subjected to CC over SiO2 eluted with increasing amounts of EtOAc in hexane and MeOH in EtOAc. This procedure afforded eight fractions (H1-H8), in which activity was detected at fraction H5 (1.5 g). Part of this fraction (15 mg) was purified by HPLC (RP-18, MeOH:H2O 75:25, flow 1.75 mL/min) to afford 1 (4 mg) and 2 (4 mg). Part of the active CH2Cl2 phase (1.7 g) was fractioned over Sephadex LH-20 eluted with MeOH to give four fractions (D1-D4). As the cytotoxicity was detected on the group D2 (857 mg), this material was subjected to CC over SiO2 using increasing amounts of EtOAc in hexane as eluent, to afford eight fractions (D2-1 to D2-8). Part of the active fraction D2-4 (75 mg) was purified by HPLC (RP-18, MeOH:H2O 75:25, flow 2.0 mL/min) to afford 3 (4 mg), 4 (26 mg), 5 (13 mg), 6 (11 mg), 7 (3 mg), and 8 (2 mg).
3.4. Cell Lines
Murine melanoma cell line B16F10 as well as human melanoma A2058, breast adenocarcinoma MCF7, human leukemia HL-60, and human cervical carcinoma cell line HeLa were provided by the Experimental Oncology Unit (UNONEX) of the Federal University of São Paulo (UNIFESP, São Paulo SP, Brazil). Cells were cultured at 37 °C in a humidified atmosphere containing 5% CO2, in RPMI 1640 medium (Invitrogen, Carlsbad, CA, USA) supplemented with 10 mM N-2-hydroxyethylpiperazine-N-2-ethanesulfonic acid (Hepes, Sigma, St. Louis, MO, USA), 24 mM sodium bicarbonate (Sigma), 40 mg/L gentamycin (Schering-Plough, São Paulo, Brazil), pH 7.2, and 10% fetal calf serum (Invitrogen).
3.5. In Vitro Cytotoxicity Assay
Crude MeOH extract, partition phases and compounds
1–
8 were suspended in dimethylsulfoxide (DMSO) at a final concentration of 10 mg/mL, and finally diluted in complete RPMI medium supplemented with 10% fetal calf serum. Crude extracts and partition phases were evaluated at 300 µg/mL while compounds
1–
8 were assayed using different concentrations, ranging from 0 to 100 μg/mL. These materials were incubated with 1 × 10
4 cells in a 96-well plate at 37 °C and 5% CO
2. After 24 h of incubation, cell viability was assessed using the Cell Proliferation Kit I (MTT, Sigma), a MTT-based colorimetric assay as previously described [
30,
31]. Readings were made in a plate reader (Spectra Max M2e, Molecular Devices, Sunnyvale, CA, USA) at 570 nm with a reference of 650 nm. All experiments were performed in triplicates using cisplatin (Sigma) and DMSO 1% as positive and negative controls, respectively.
3.6. Morphology, Chromatin Condensation and Fragmentation Analysis
Morphology, chromatin condensation and fragmentation were analyzed by fluorescence microscopy. HL-60 cells (1 × 10
4) were seeded on 96-well plates and incubated with 50 µg/mL of compounds
4,
5 and
8 during 24 h at 37 °C and 5% CO
2. For morphology analysis, images were processed using a light inverted microscope (Magnification ×400). To analyze the condensation of chromatin, cells were harvested, washed in PBS and fixed for 15 min at room temperature using MeOH. Cells were pelleted and stained with 10 µg/mL DAPI (Sigma) in PBS for 15 min. The cells were analyzed by fluorescence microscopy using an inverted fluorescence microscope (Eclipse TS100, magnification ×40, Nikon, Tokyo, Japan). Alternatively, DNA fragmentation was assessed by electrophoresis in a 1% agarose gel. HL-60 (1 × 10
5) cells were incubated with 50 µg/mL of compounds
4,
5 and
8 for 24 h and then total DNA was extracted, processed and analyzed as previously described [
32].
3.7. Detection of Mitochondrial Membrane Potential (ΔΨm)
The cationic lipophilic dye tetramethylrhodamine ethyl ester (TMRE) was used to determine the mitochondrial membrane potential. 5 × 10
5 cells (HL-60) were grown in a 12-well culture plate and incubated with 100 µg/mL of
4,
5 and
8 for 24 h at 37 °C. Subsequently, cells were processed and analyzed as previously described [
33].
3.8. Annexin V and Propidium Iodide Labeling
Annexin V (AV) positive HL-60 cells were detected using Annexin V-FITC Apoptosis kit (Sigma-Aldrich, St. Louis, MO, USA). 5 × 10⁵ tumor cells were cultured in 6-well plates and further incubated with 100 µg/mL of compounds 4, 5 and 8 or complete medium (negative control) for 24 h at 37 °C. After treatment period, cells were washed three times with PBS and incubated with 1X binding buffer. Cells were incubated with binding buffer (10 mM HEPES/NaOH, pH 7.5, 140 mM NaCl and 2.5 mM CaCl2) in presence of 5 µL of AV-FITC and 10 µL of propidium iodide (PI) for 10 min at room temperature and immediately analyzed by flow cytometry (BD Bioscience FACSCanto II equipment, Franklin Lakes, NJ, USA). Quantification of live cells (AV−/PI−), necrotic cells (AV−/PI+), early apoptotic cells (AV+/PI−) and late apoptotic cells (AV+/PI+), were performed using FlowJo software (version 9.5.3, Tree Star Inc., Ashland, OR, USA).
3.9. Cell Lysate Extracts and Western Blotting
For protein extraction, 5 × 10
5 HL-60 cells, previously incubated with 100 µg/mL of compounds
4,
5,
8 and negative control for 24 h, were washed in PBS and lysed by adding 100 µL of 1X SDS sample buffer (62.5 mM Tris-HCl, pH 6.8 at 25 °C, 2%
w/
v SDS, 10% glycerol, 50 mM DTT, 0.01%
w/
v bromophenol blue) in the presence of phosphatase and protease inhibitors and heated to 95 °C for 5 min. Total proteins from each cell lysate were separated in SDS gel electrophoresis and Western blotting was carried out as described elsewhere [
33], and rabbit anti cleavaged PARP (c-PARP) was used. Anti β-actin was used as loading control. Both antibodies were purchased from Cell Signaling Technology (Beverly, MA, USA). Secondary antibody conjugated with IgG horseradish peroxidase was purchased from Sigma-Aldrich. Immunoreactivity was detected using the Immobilon solution (Millipore, Billerica, MA, USA) in an Uvitec Alliance 2.7 instrument (Cambridge, UK).
3.10. Statistical Analysis
The obtained data represent the means and standard deviations from three independent experiments. The IC50 were estimated using correlation curves carried out in Origin 5.0 statistical software (OriginLab, Northampton, MA, USA) for Windows and differences among them were assayed using Student’s t-test (* p < 0.05 vs control conditions).


