Article

Study of the Relationships between the Structure, Lipophilicity and Biological Activity of Some Thiazolyl-carbonyl-thiosemicarbazides and Thiazolyl-azoles

1
National Research and Development Institute for Cryogenic and Isotopic Technologies, 4th Uzinei Street, Râmnicu Vâlcea 240050, Romania
2
3Nano-SAE Research Centre, Faculty of Physics, University of Bucharest, P. O. Box MG-38, Bucharest-Măgurele RO-077125, Romania
3
SC Biotech Corp SRL, 4th Uzinei Street, Office C52, 2 Râmnicu Vâlcea 40050, Romania
4
Department of Chemistry and Chemical Engineering, Babeş-Bolyai University, 1st Mihail Kogălniceanu Street, Cluj-Napoca RO-400084, Romania
5
Department of Pharmaceutical Chemistry, Faculty of Pharmacy, Iuliu Haţieganu University of Medicine and Pharmacy, 41 Victor Babeş Street, Cluj-Napoca RO-400012, Romania
6
Department of Pharmacognosy, Faculty of Pharmacy, Iuliu Haţieganu University of Medicine and Pharmacy, 12 Ion Creangă Street, Cluj-Napoca RO-400010, Romania
*
Author to whom correspondence should be addressed.
Molecules 2015, 20(12), 22188-22201; https://doi.org/10.3390/molecules201219841
Submission received: 20 October 2015 / Revised: 20 November 2015 / Accepted: 3 December 2015 / Published: 11 December 2015
(This article belongs to the Section Medicinal Chemistry)

Abstract

:
Lipophilicity, as one of the most important physicochemical parameters of bioactive molecules, was investigated for twenty-two thiazolyl-carbonyl-thiosemicarbazides and thiazolyl-azoles. The determination was carried out by reversed-phase thin-layer chromatography, using a binary isopropanol-water mobile phase. Chromatographically obtained lipophilicity parameters were correlated with calculated log P and log D and with some biological parameters, determined in order to evaluate the anti-inflammatory and antioxidant potential of the investigated compounds, by using principal component analysis (PCA). The PCA grouped the compounds based on the nature of their substituents (X, R and Y), indicating that their nature, electronic effects and molar volumes influence the lipophilicity parameters and their anti-inflammatory and antioxidant effects. Also, the results of the PCA analysis applied on all the experimental and computed parameters show that the best anti-inflammatory and antioxidant compounds were correlated with medium values of the lipophilicity parameters. On the other hand, the knowledge of the grouping patterns of the tested variables allows the reduction of the number of parameters, determined in order to establish the biological activity.

Graphical Abstract

1. Introduction

Lipophilicity is an important physicochemical property of bioactive compounds affecting their biological activity with a determinant role in the transport of compounds through biological membranes and in the formation of the ligand-receptor complex. The lipophilic character of an active molecule, defined as the ability of a compound to penetrate through hydrophobic barriers in order to get from the delivery point to the site of action [1,2], is usually quantitatively characterized as the logarithmic forms of the n-octanol-water partition coefficient Pow (LogPow) and n-octanol-water distribution coefficient Dow (LogDow)—experimentally determined [3] or calculated by using a series of mathematical models [4]. Due to experimental limitations of the classical “shake-flask” method [5], the most widely used techniques for the measurement of the lipophilic properties of different chemical molecules are nowadays the chromatographic techniques in reversed-phase systems (RP-TLC and RP-HPLC) [6,7].
Some of the parameters resulting from a RP-TLC may be associated to the lipophilic character of the analytes [8,9]. The retention parameters (RM) are calculated by means of well-known Batte-Smith and Westall Equation (1):
RM = log (1/RF − 1)
Generally, the RM values determined by RP-TLC are linearly dependent on the concentration of the organic modifier (C) in the mobile phase Equation (2):
RM = RM0 + bC
where b and RM0 are, respectively, the slope and the intercept of Equation (2). Extrapolation of the RM value to pure water, leads to determination of RM0, which can be considered as an estimation of the partitioning of compounds between nonpolar stationary phase and the aqueous system, and hence a way to estimate the lipophilicity of the compounds (Soczewinski-Wachtmeister model) [9,10]. Additionally, it has been stated that not only the RM0, but also the slope, b, as a characteristic of the specific hydrophobic surface area of the compounds, can be used as an estimation of lipophilicity [6,11,12]. The advantages of TLC methods consist in the small quantity of compounds needed for the determination, and the rapidity and simplicity of the method. Also, they are inexpensive, rapid and easy to perform [13].
Principal Component Analysis (PCA) is a chemometric tool designed to transform a set of original variables into new uncorrelated variables (axes), which are called principal components. The new variables are linear combinations of the original variables and the new axes lie along the directions of maximum variance. PCA provides an objective way of finding indices of this type, so that the variation in the data can be accounted for, as concisely as possible. By applying PCA to the matrix formed by the retardation factors (RF) of all compounds in all mobile phases, it is possible to obtain a new lipophilicity scale where the linear combinations of retention indices (the scores) corresponding to the first component (PC1) appears to be a new parameter capable to quantitatively assess the lipophilic character of the compounds [6,14,15,16].
Based on our experience in the field of heterocyclic compounds [17,18,19], we synthesized and evaluated in vivo, in term of anti-inflammatory and antioxidant activity, a new series of thiazolyl-carbonyl-thiosemicarbazides and hybrid thiazolyl-1,3,4-oxadiazoles, thiazolyl-1,3,4-triazoles and thiazolyl-1,3,4-triazoles [20,21]. The results demonstrated that the new thiazole compounds exhibit anti-inflammatory effects, lowering the acute-phase response of bone marrow and the oxidative stress. Based on the virtual screening and on the obtained results, the activity may be due to their capacity to reduce NO synthesis by blocking the binding of l-arginine at the active site of inducible nitric oxide synthase (iNOS) [21].
The goal of the present study was to determine the relationships between the computed lipophilicity coefficients and RP-TLC retention parameters of new thiazolyl-carbonyl-thiosemicarbazides and thiazolyl-azoles with the anti-inflammatory/antioxidant potential and their structural parameters obtained by molecular modeling calculations, applying the PCA method.

2. Results and Discussion
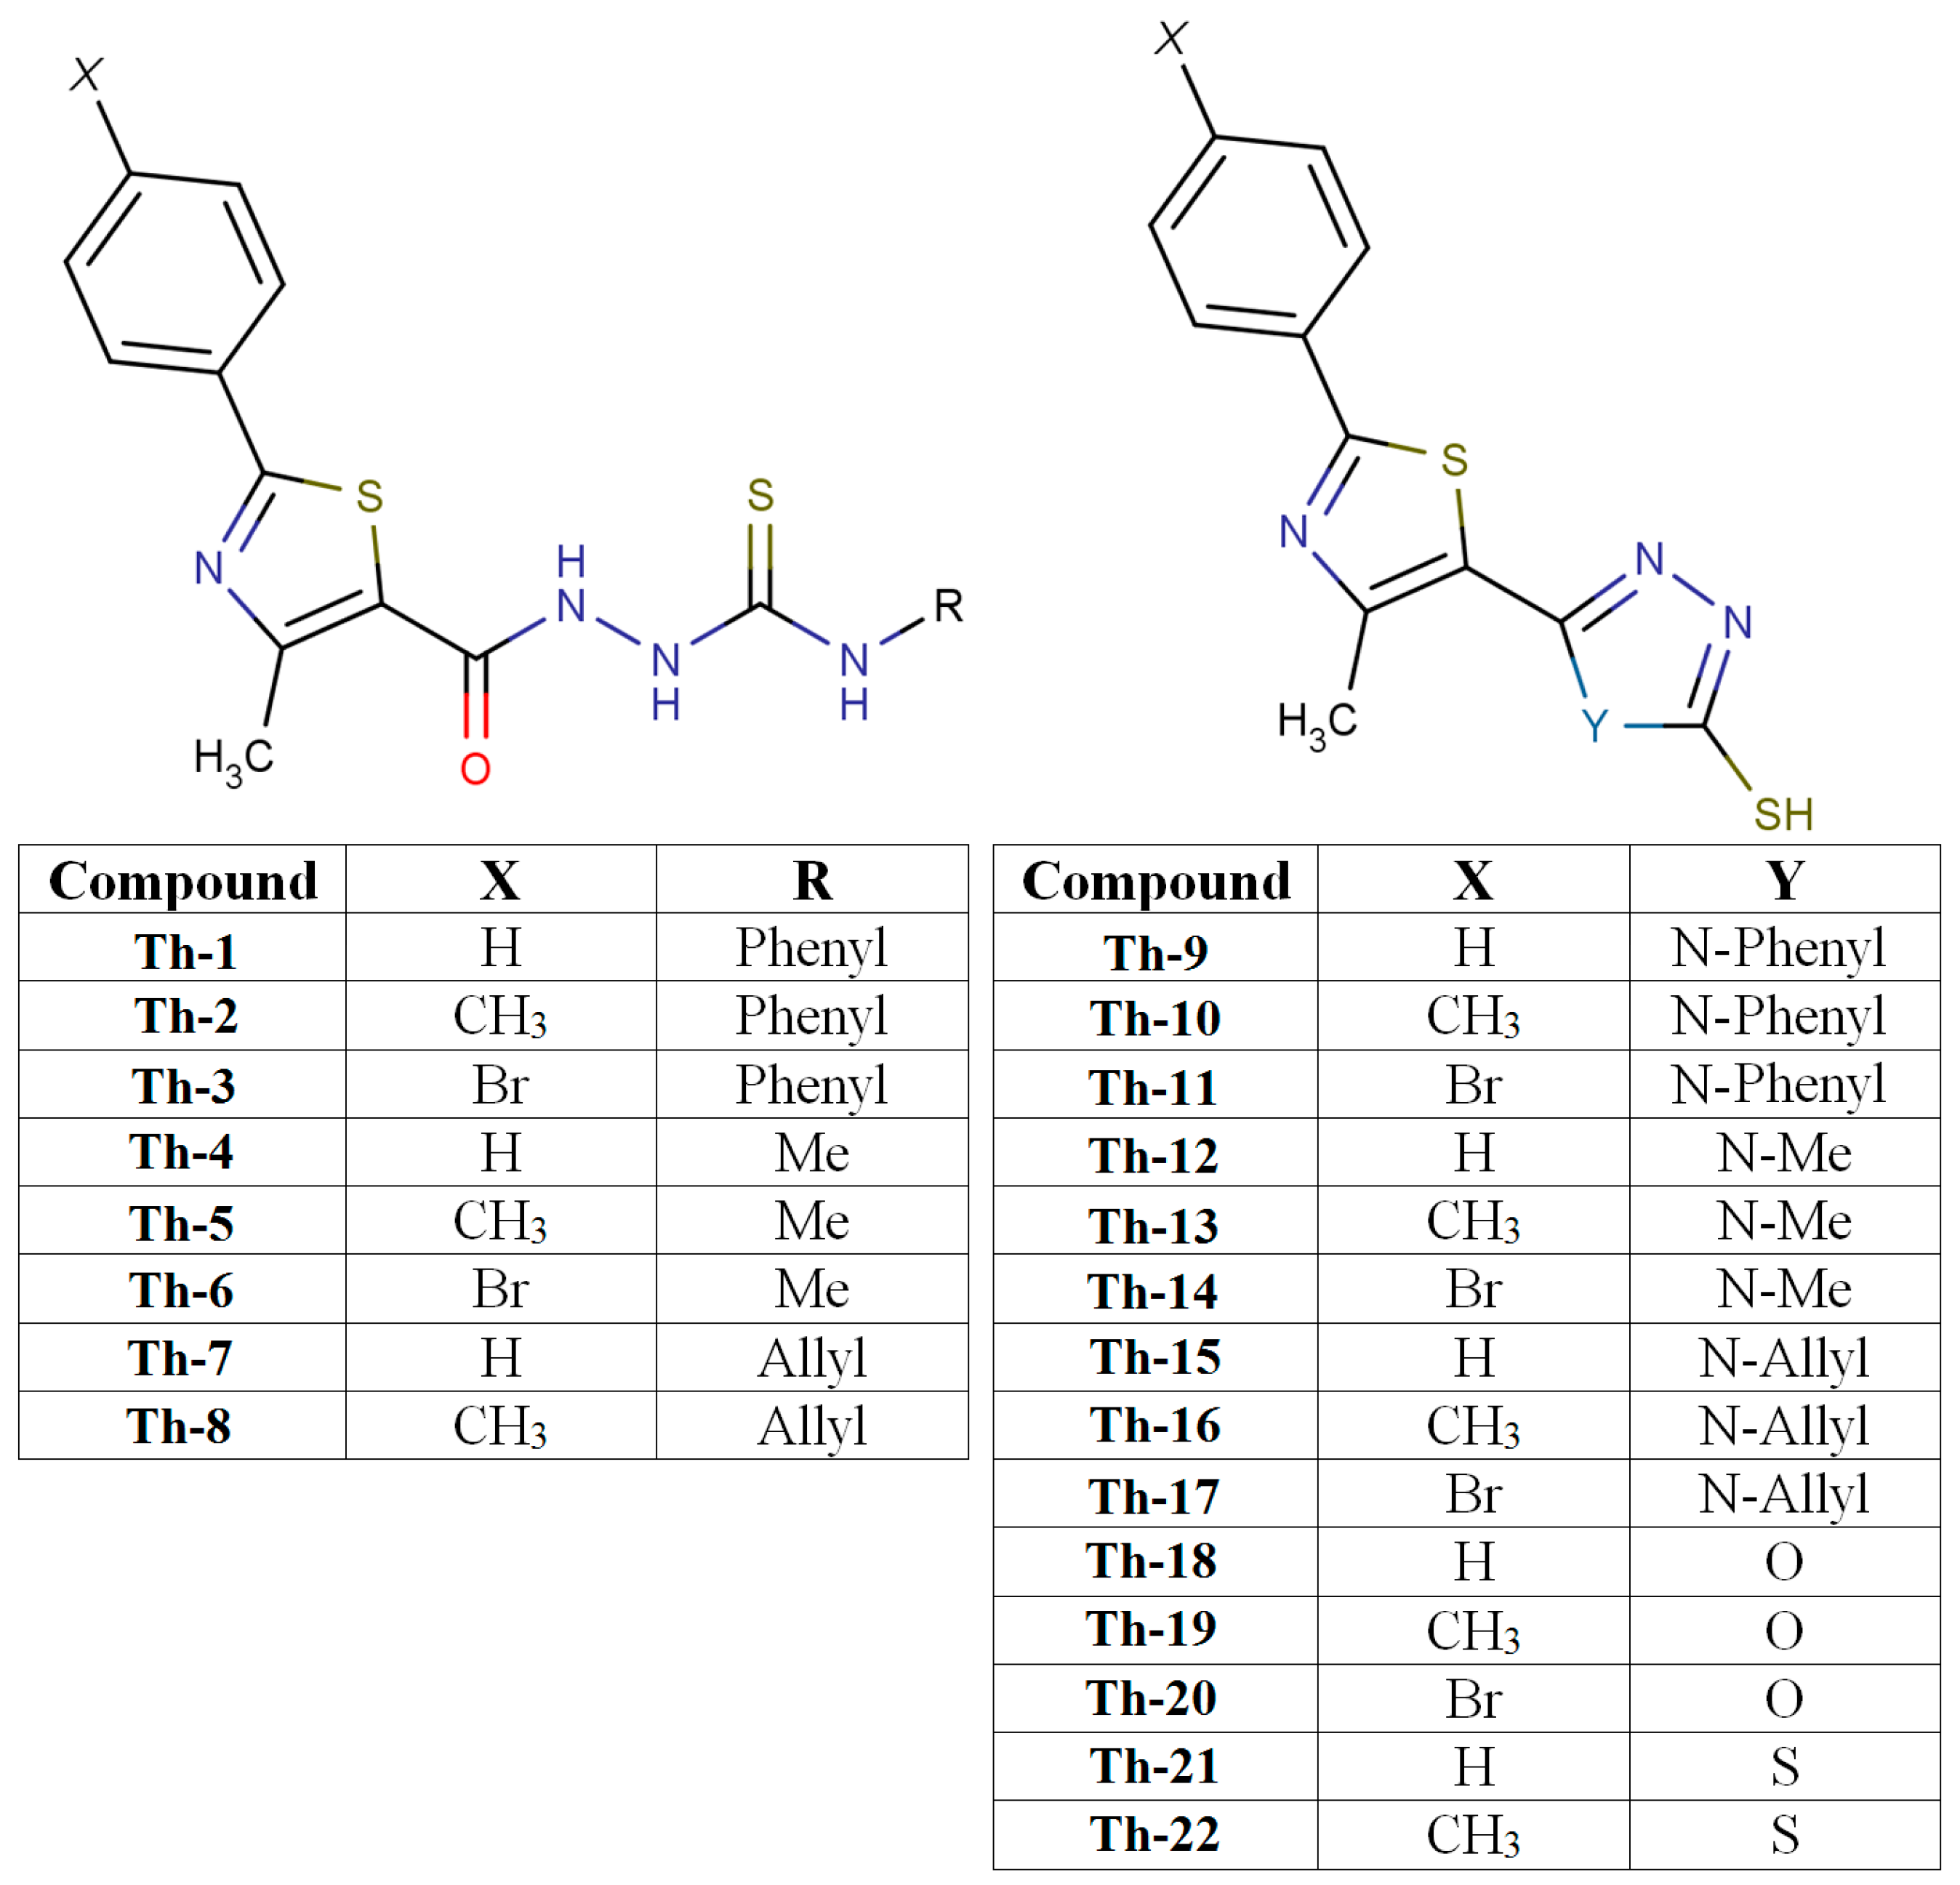
2.1. Chemistry

Twenty two thiazolyl-carbonyl-thiosemicarbazides and hybrid thiazolyl-1,3,4-oxadiazoles, thiazolyl-1,3,4-triazoles, and thiazolyl-1,3,4-triazoles (Th1Th22), synthesized in our laboratory, according to a previously described procedure [20], were investigated. The structures of the compounds used in this study are presented in Figure 1. All components of the mobile phases used were of analytical grade purity.
Figure 1. Structures of the studied thiazolyl-carbonyl-thisemicarbazides and thiazolyl-azole compounds—Marvin was used for drawing and displaying of chemical structures (MarvinSketch 6.3.1, 2014, ChemAxon Kft., Budapest, Hungary, http://www.chemaxon.com).
Molecules 20 19841 g001

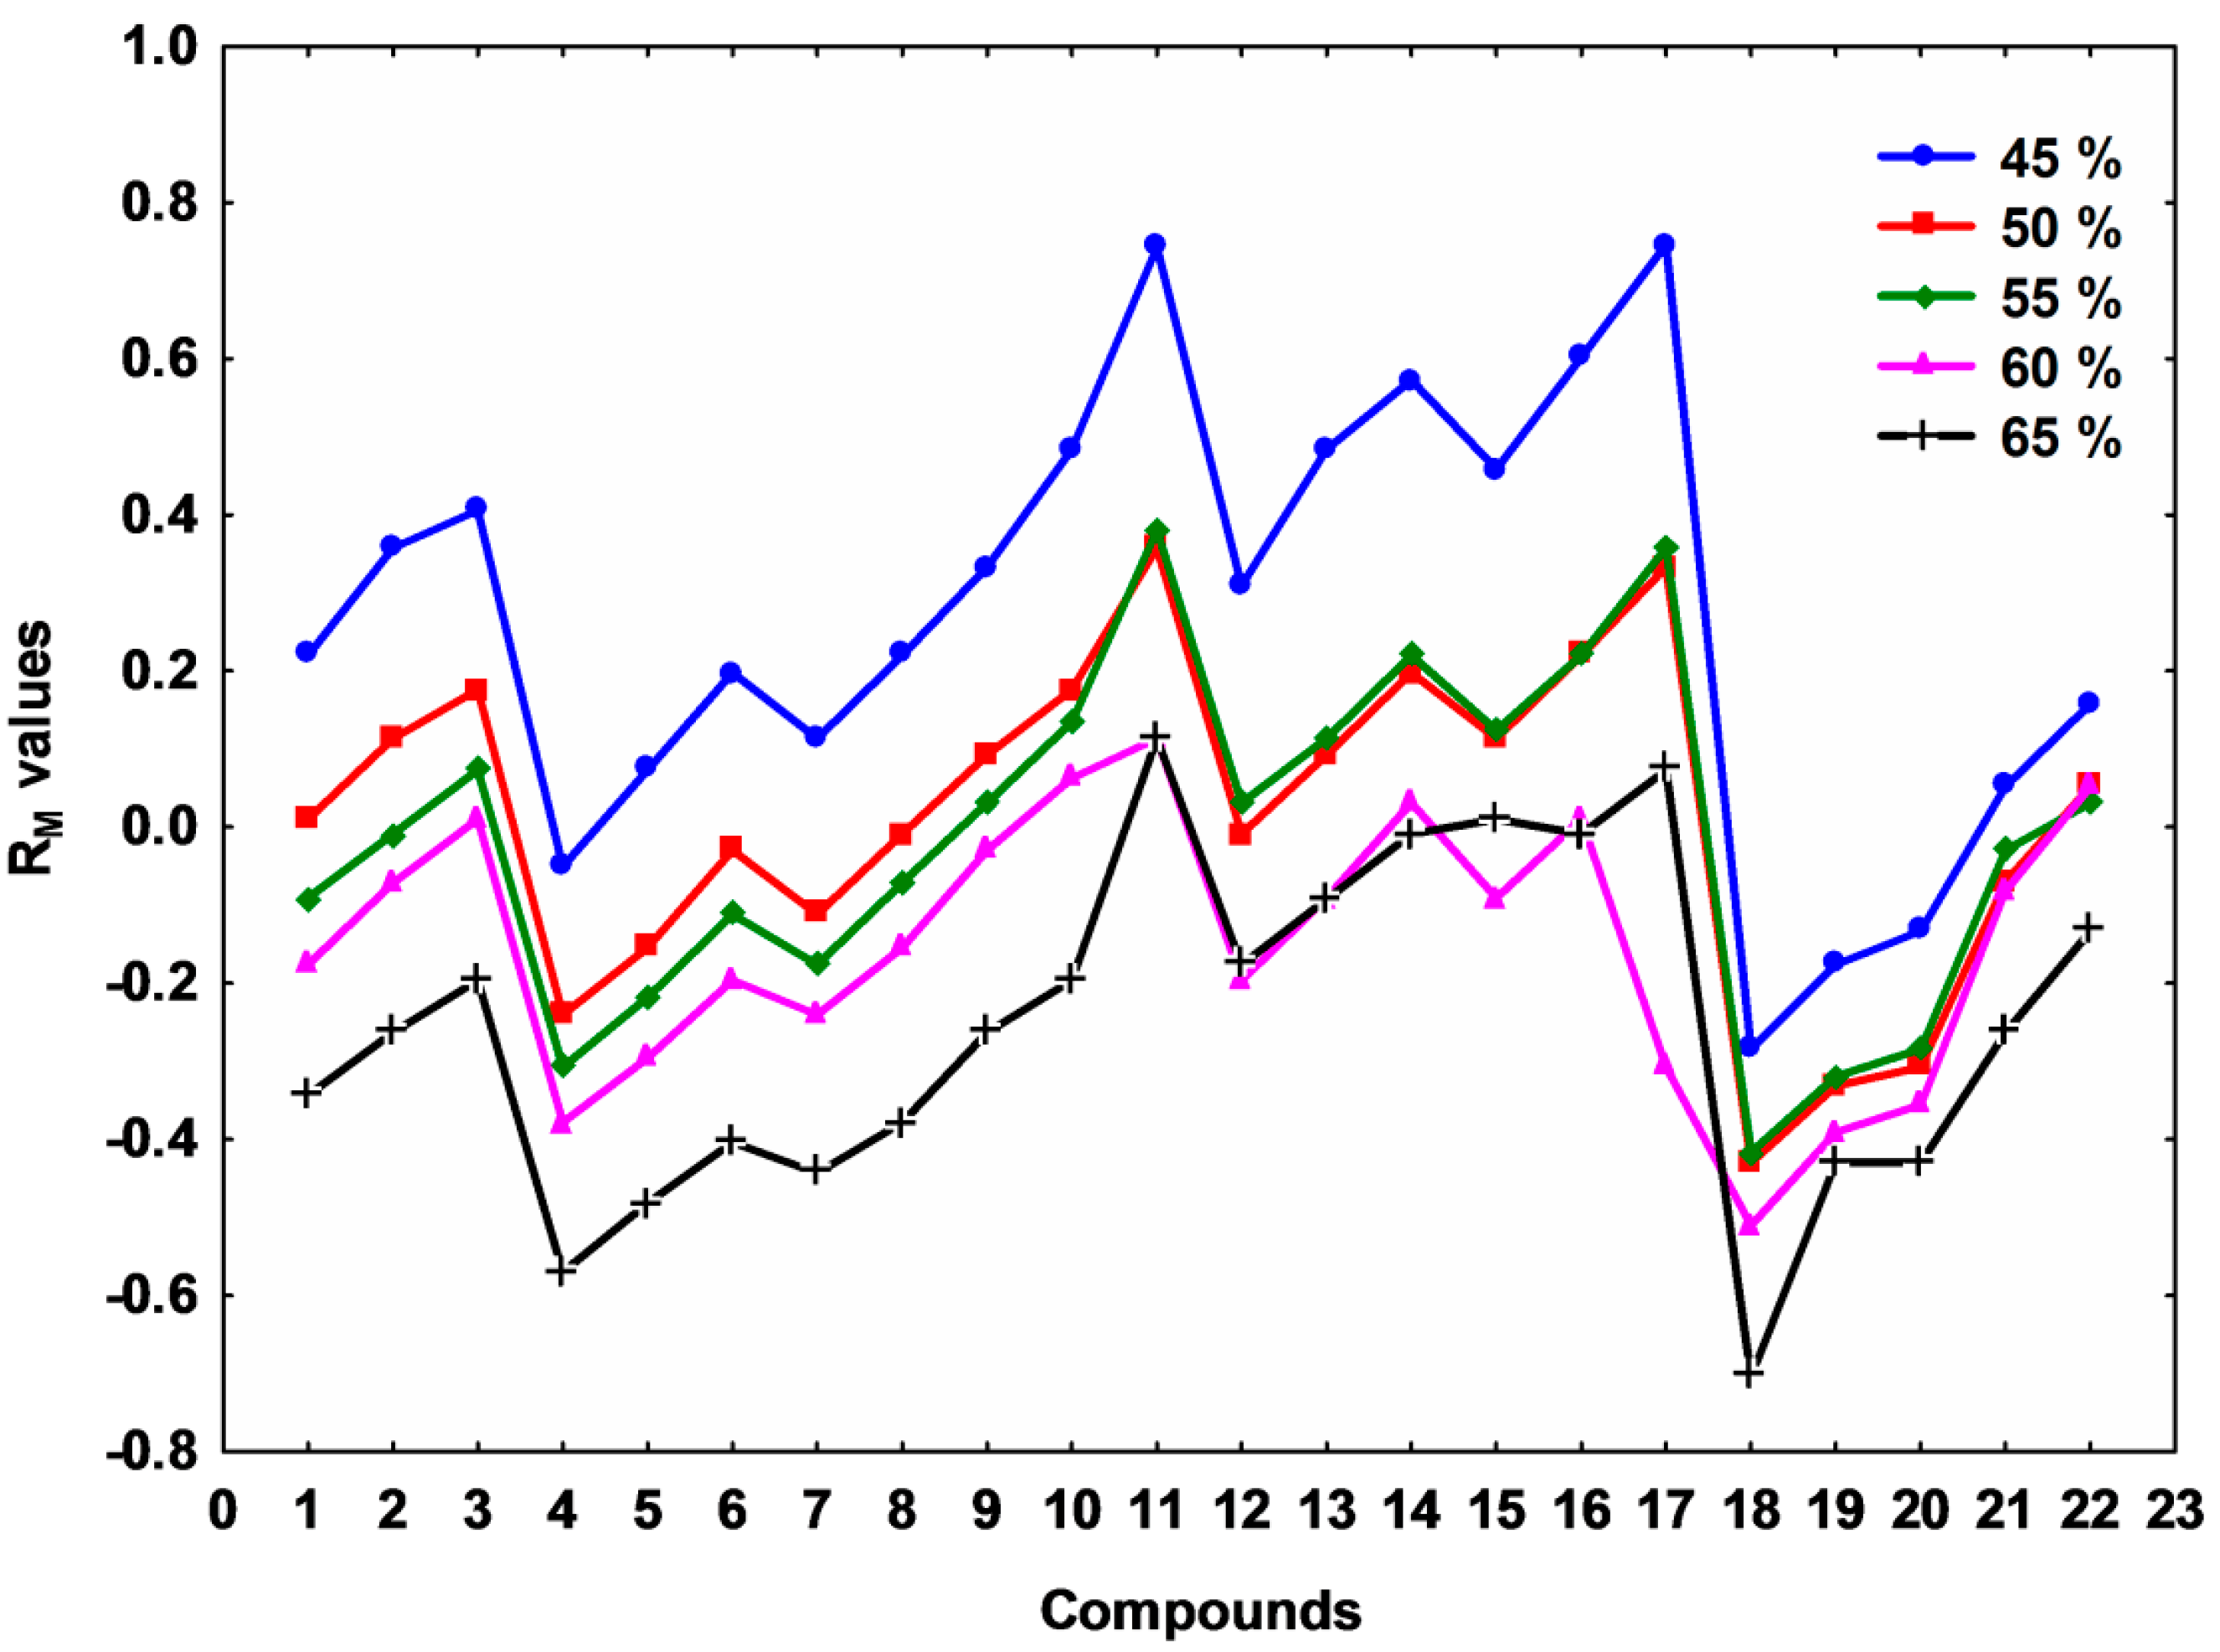
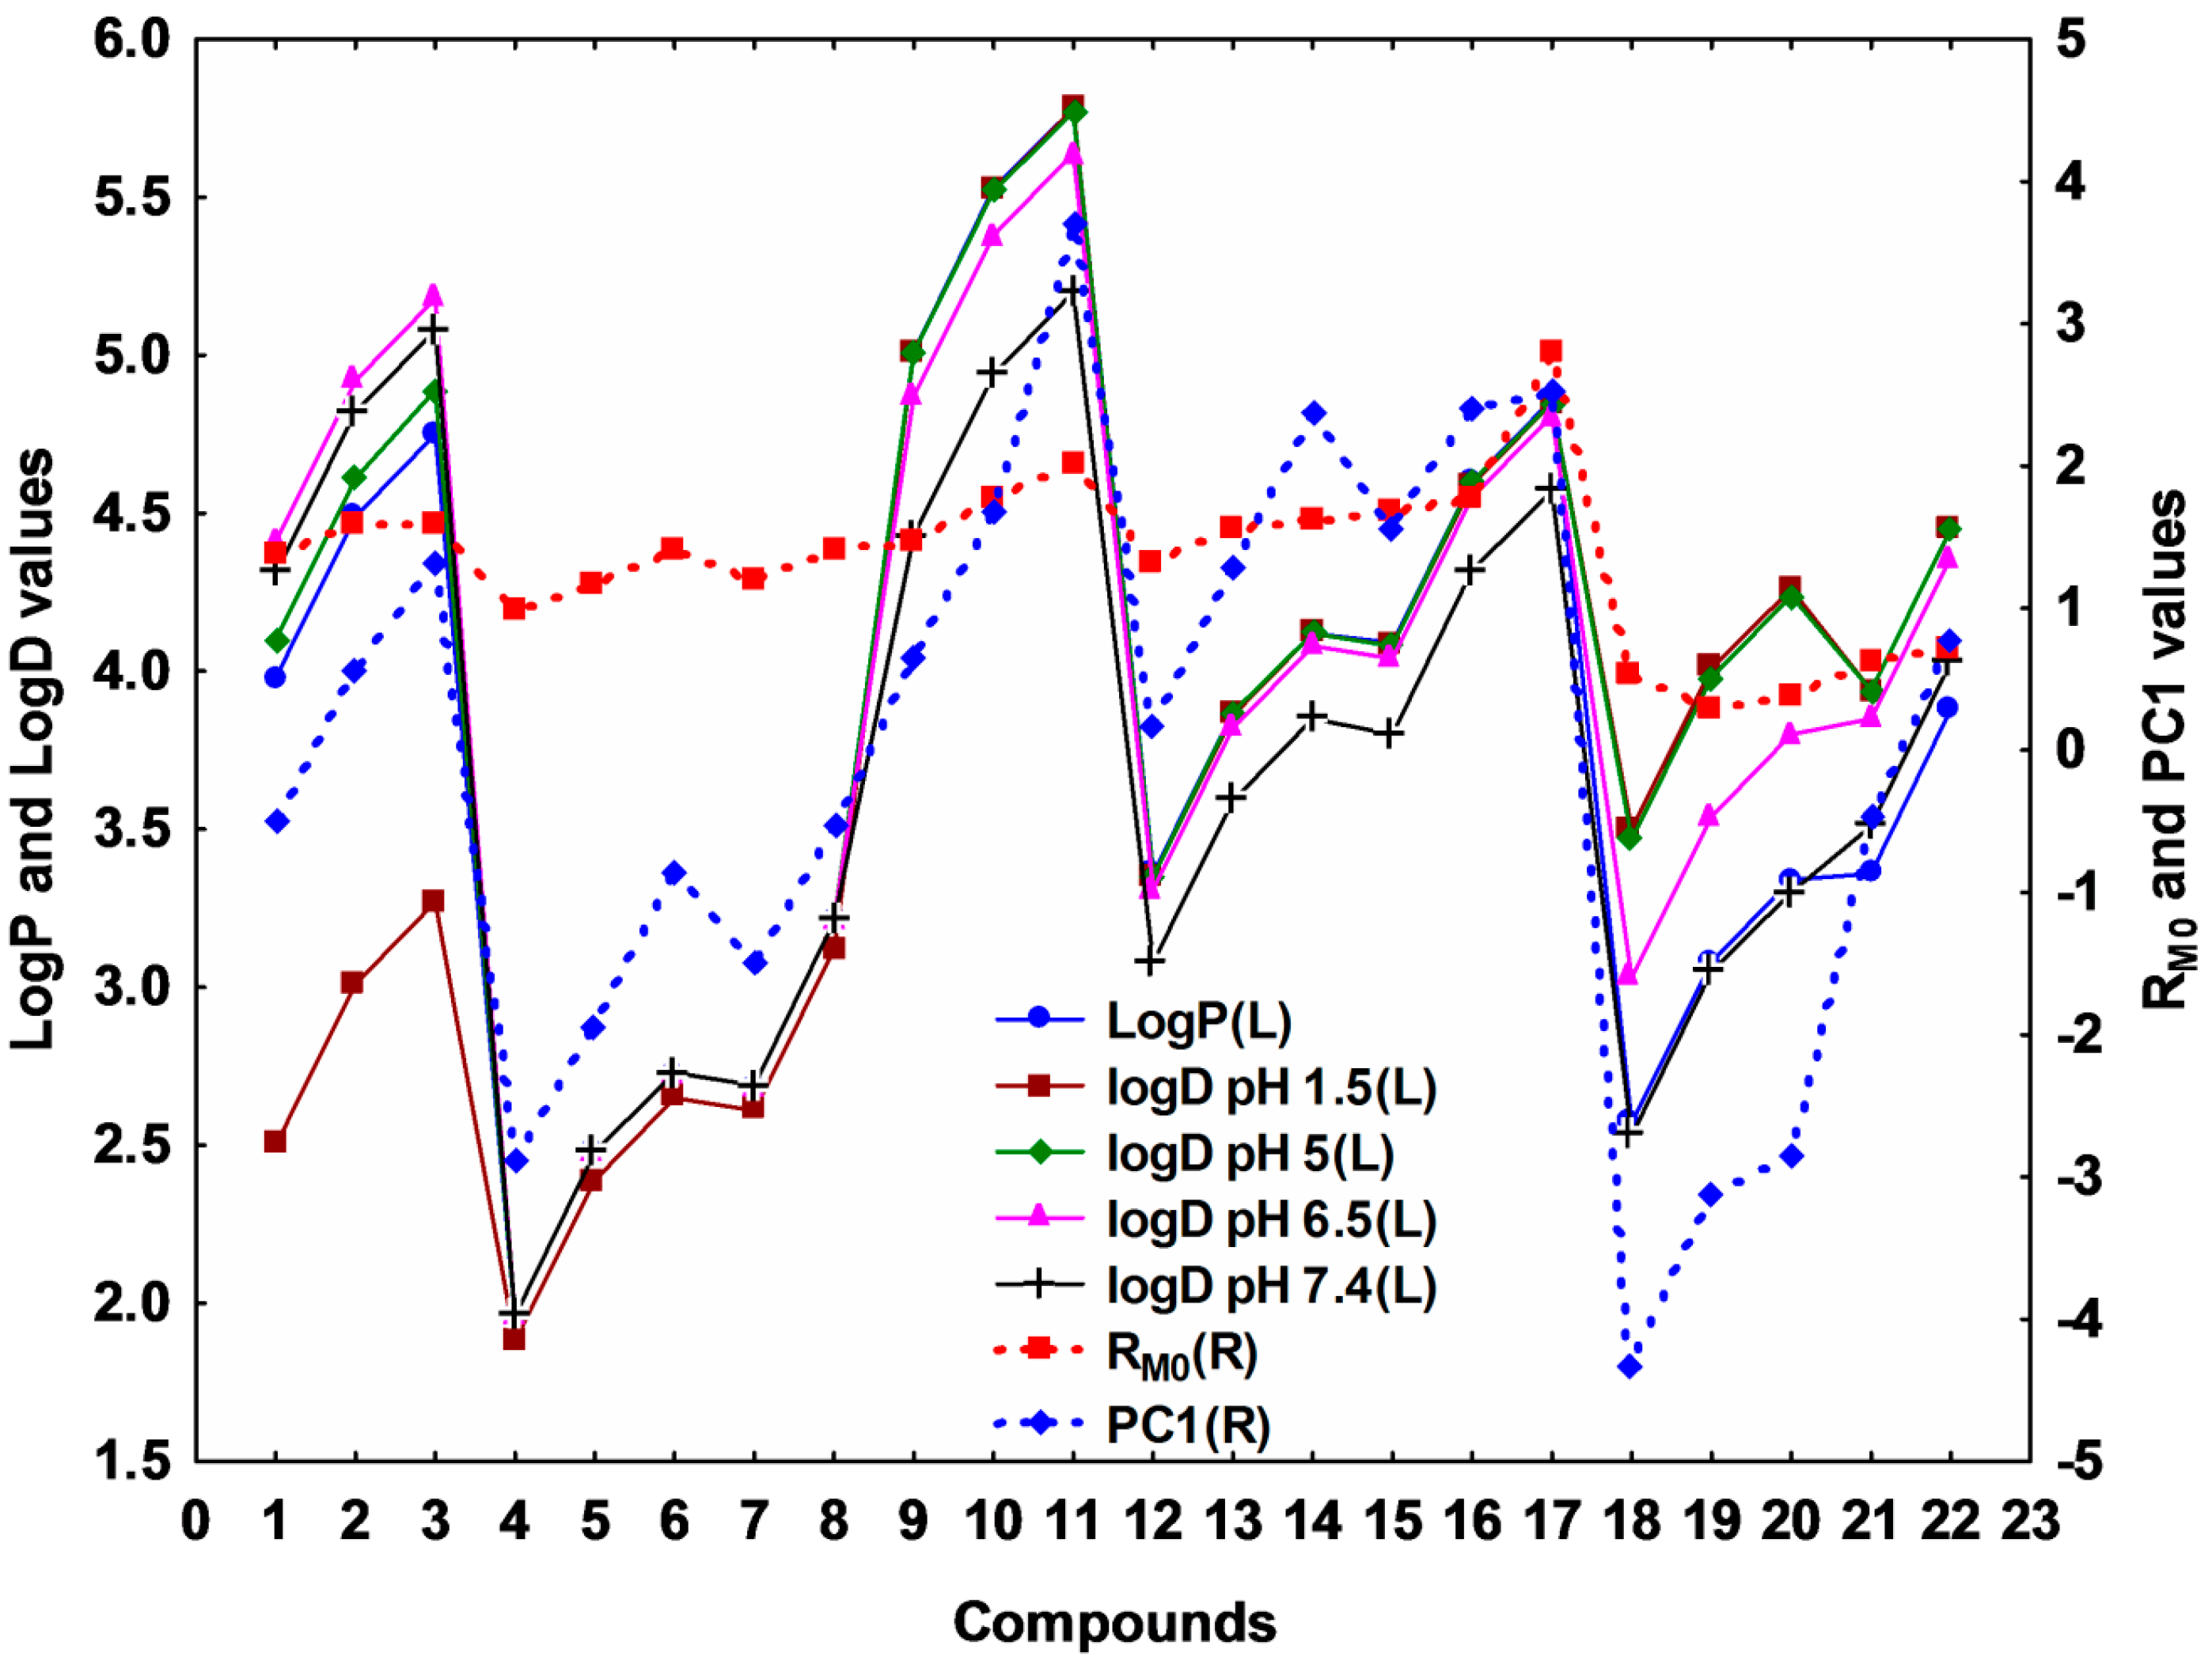
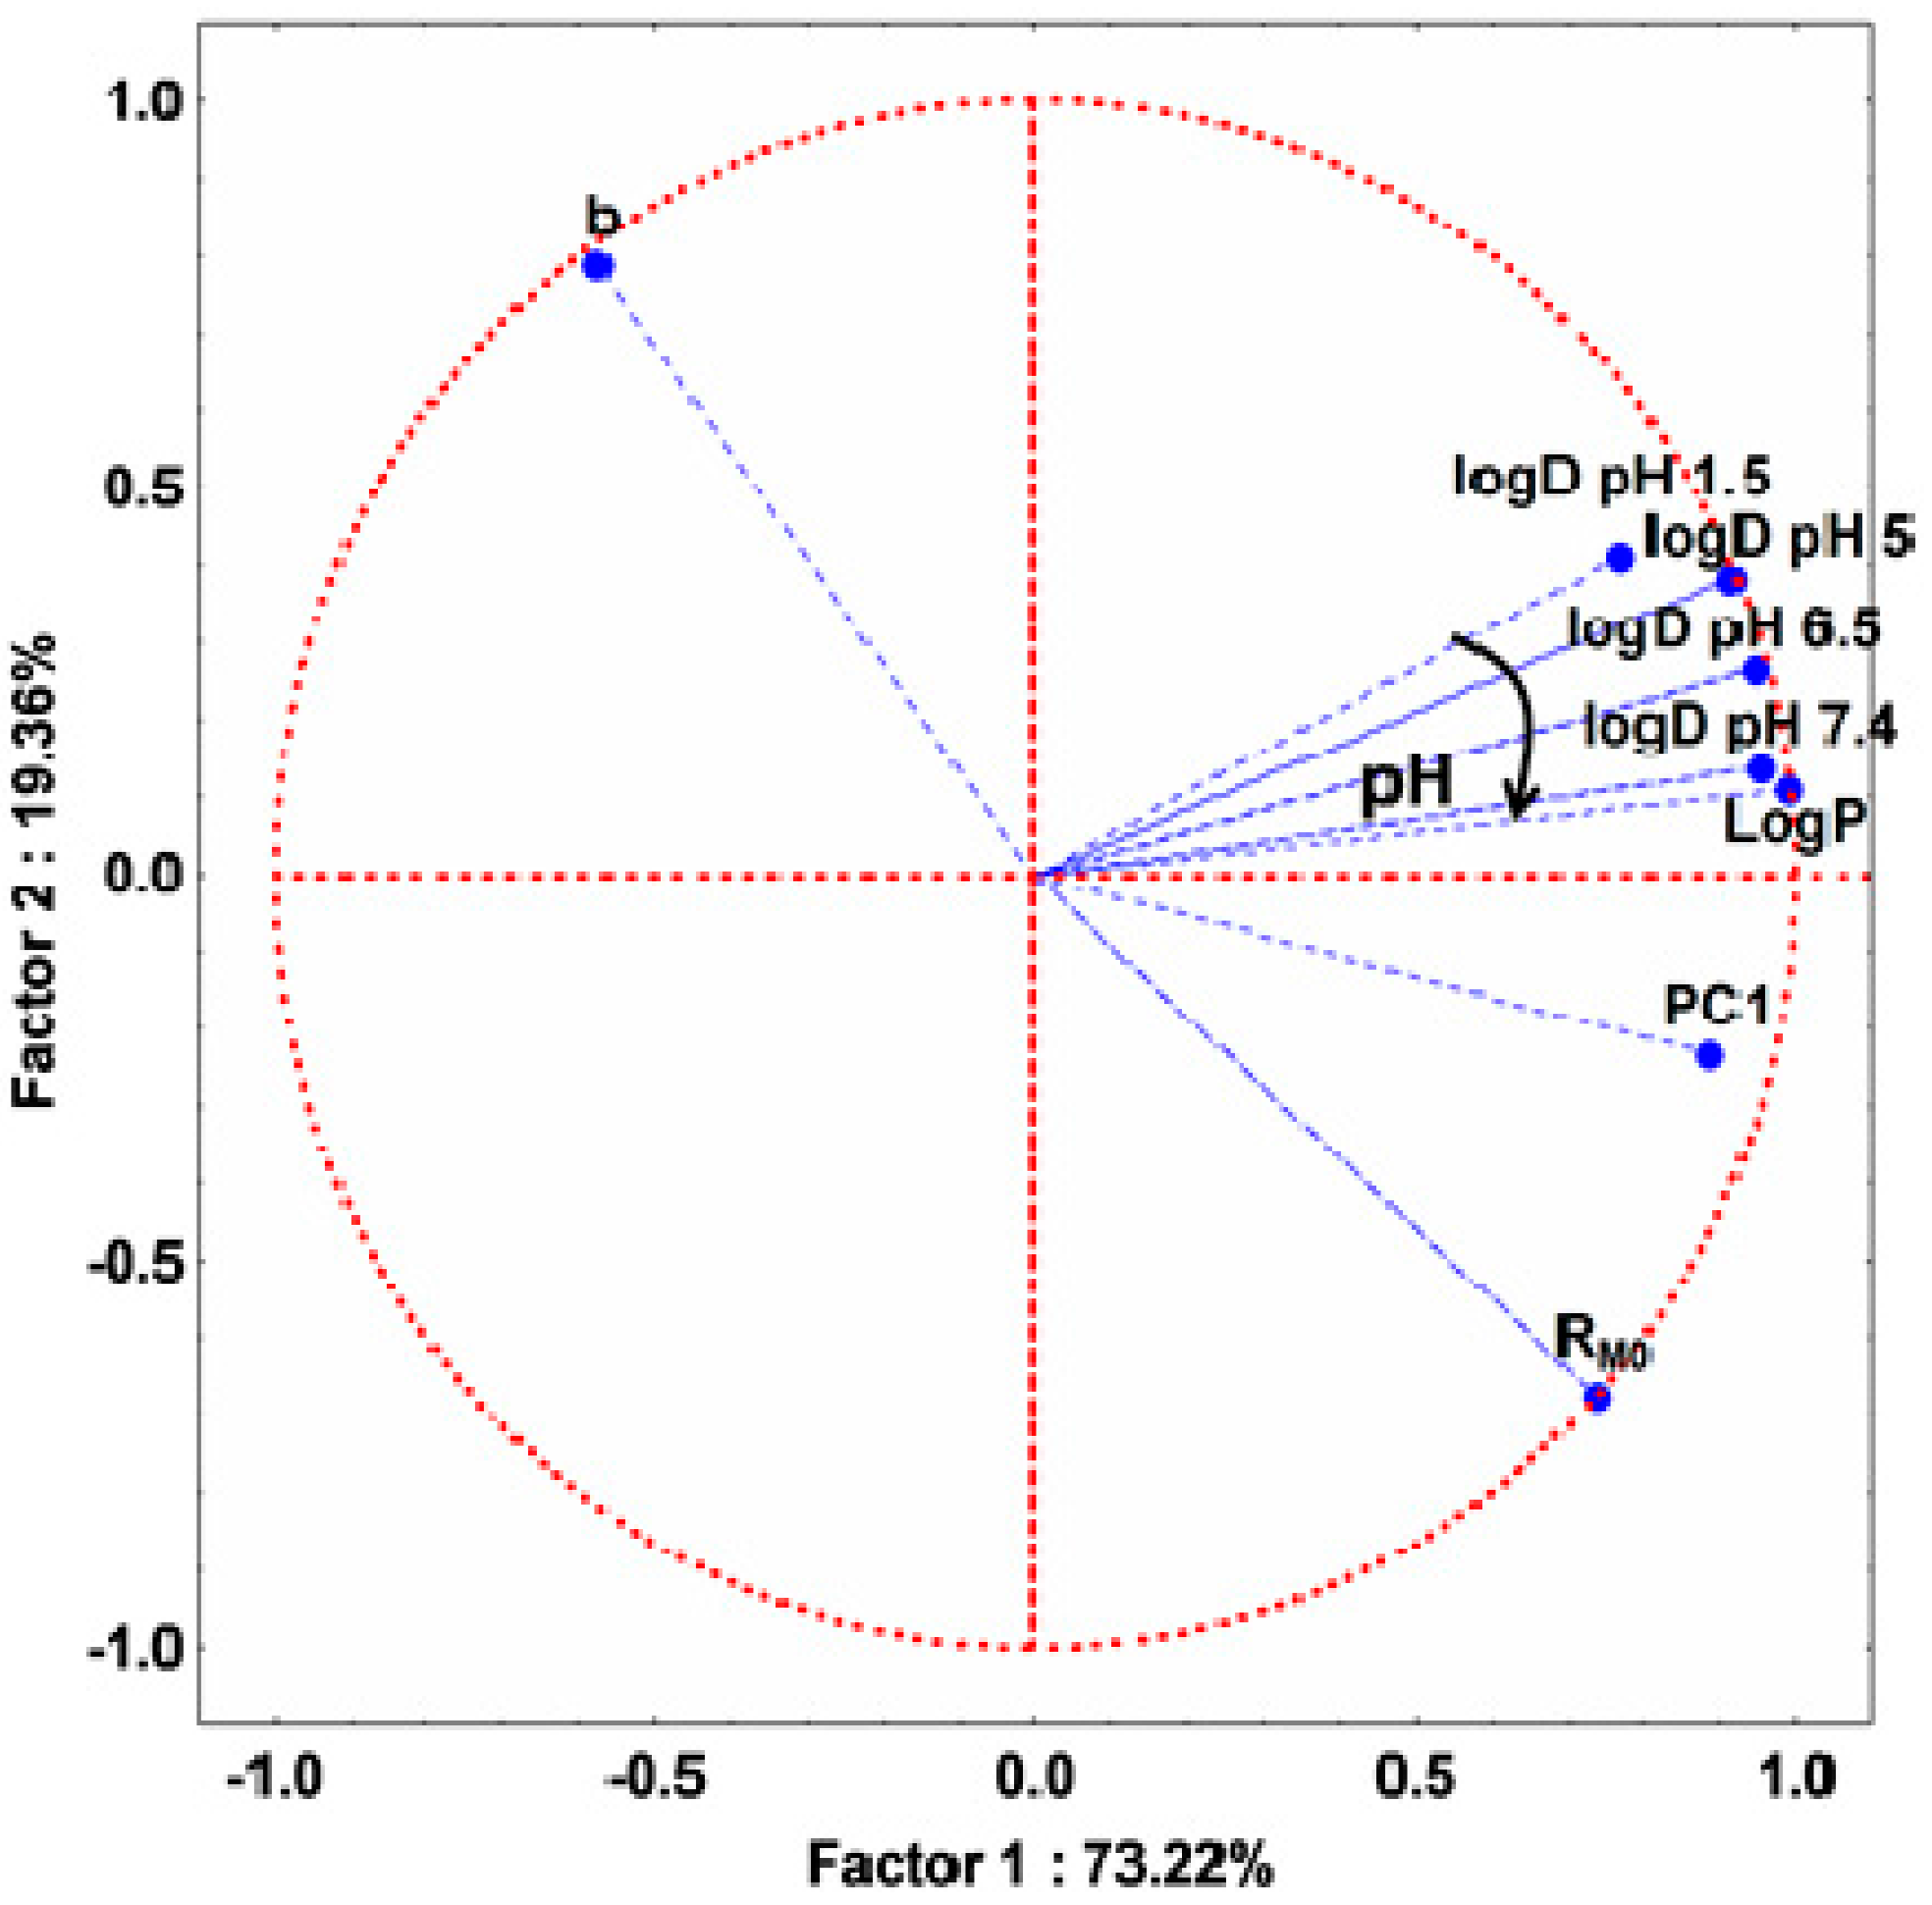
2.2. Lipophilicity Evaluation of the Studied Compounds

In all instances, it was found that the retention of the investigated compounds increased with increasing concentration of the organic modifier in the mobile phase. The change of the retardation factor with increasing the organic solvent content in the binary mobile phase, correlates well with the polarity, the substituents (phenyl, allyl, methyl, hydrogen and bromine). The RM values obtained from Equation (1) decrease linearly as the concentration of the organic modifier in the mobile phase increases, and therefore they might be used to assess lipophilicity. The profiles of the RM values present regular changes as the organic modifier content increases, indicating that the same mechanism of lipophilic interaction is dominant (Figure 2). Nevertheless, minor changes of these systematic regularities can be observed with compounds Th-11-17, most probably due to their more rigid molecular structures compared to compounds Th-1-8.
The results of regression analyses using Equation (2) (intercept values (RM0), slopes (b) and correlation coefficient (r) are presented in Table 1. These values afford a quantitative estimation for the distribution of the investigated compounds between a non-polar phase (a chemically bound reversed stationary phase) that represents the biological membranes, and a polar phase that represents the extracellular aqueous environment. As expected, it can be observed that there is a linear dependence between the values of RM0 (lipophilic parameter) and the values of b (specific hydrophobic surface) for the majority of these compounds. This linear dependence shows that thiazolyl derivatives might form a homologous series of compounds, as has been suggested by some authors [22]. Once more, it can be observed that compound Th-1-8 has a mean correlation coefficient of 0.979 ± 0.005, while compounds Th-9-17 and Th-18-22 have 0.927 ± 0.034 and 0.925 ± 0.018, respectively. In addition, similar significant differences (p < 0.0003, 12.56 < f < 25.34, ANOVA test) could be observed between these three groups, for RM0 and b values (Table 1). Based on these observations and together with structural aspects (Table 1), the studied compounds have been divided in three groups: compounds Th-1-8 form group A, while compounds Th-9-17 and Th-18-22 form group B and group C, respectively. This classification will be used in further observations and discussions (vide infra).
Figure 2. Profiles of RM values at all mobile binary phase composition (% of organic modifier) for all studied compounds.
Molecules 20 19841 g002
Table 1. Retention parameters obtained from equation RM = RM0 + bC.
GroupCompd.RM0Mean ± SDbMean ± SDr aMean ± SD
ATh-11.3691.338 ± 0.213−2.627−2.623 ± 0.1650.9870.979 ± 0.005
Th-21.595−2.8530.980
Th-31.600−2.7390.979
Th-40.986−2.3550.979
Th-51.161−2.5020.976
Th-61.398−2.7400.981
Th-71.195−2.4840.972
Th-81.398−2.6850.975
BTh-91.4791.779 ± 0.435−2.630−3.012 ± 0.6800.9650.927 ± 0.034
Th-101.754−2.9480.954
Th-112.020−3.1330.912
Th-121.305−2.4630.899
Th-131.565−2.6720.898
Th-141.630−2.6590.876
Th-151.664−2.9050.943
Th-161.783−2.9620.921
Th-172.808−4.7370.974
CTh-180.5400.508 ± 0.168−1.840−1.354 ± 0.2790.9510.925 ± 0.018
Th-190.286−1.1340.920
Th-200.393−1.2830.921
Th-210.620−1.2860.900
Th-220.701−1.2270.931
a bold = correlation coefficients > 0.95. RM0 = lipophilicity estimation parameter; b = slope.
Besides the well-known RM0 values which are the experimentally-determined indices for the lipophilicity of the studied compounds, PC1 values, which are obtained by applying PCA to the matrix of the RF values for all mobile phases for all compounds, can be successfully used for quantifying the lipophilicity and may bring complementary information to the RM0 [14,15]. The variation of these two parameters for the studied compounds, along with the computed LogP and LogD values, is presented in Figure 3. It can be observed that the RM0 and PC1 profiles are well correlated with the profiles of the computed LogP and LogD values, all describing similar patterns. Regarding the experimental lipophilicity parameters, RM0 and PC1, the compounds present expected variations of the lipophilicity, as the functional groups are modified (both R and X groups).
Figure 3. Relationship between computed LogP and LogD (calculated by the equally weighted calculation algorithm combining the three methods described in the Experimental Section) values profiles and experimental lipophilicity indices RM0 and PC1. The L or R information in the brackets refers to either left or right disposition of the values on the y axis.
Molecules 20 19841 g003
Analyzing the values obtained for PC1, it was noticed that the cyclisation of thiosemicarbazides Th-1-8 to the corresponding thiazolyl-triazoles Th-9-17 increased the lipophilicity, probably as result of a decrease of the polar character of the former, due to the -CO-NH-NH-CS-NH- fragment. Concerning the nature of the Y substituent, it can be observed that the presence of an electron withdrawing substituent (phenyl) increases the lipophilicity, while electron donating groups decrease it (Th-11 > Th-14 > Th-17) (Figure 3). Regarding the X substituent and the whole molecules, as expected in these homologous series, the lipophilicity increases with the molecular volume, the bromo substituted derivatives being the most lipophilic compounds. Also, the N-substituted thiazolyl-triazoles (Th-9-17) are more lipophilic then the corresponding thiadiazoles (Th-21-22) and oxadiazoles (Th-18-20), the molecular volume decreasing in the order: group B > group C (S > O) (Figure 3).
According to their structure (Figure 1), the studied compounds can be involved in acid-base equilibria, and are hence ionizable, so that the analysis of the distribution coefficient (LogD) at several physiological relevant pH levels is adequate. Figure 3 also presents the profiles of the LogD values at four pH levels (stomach (1.5), duodenum (5), jejuno-ileum (6.5) and blood serum (7.4) pH levels). The compounds from group A (Th-1-8) have slightly basic behavior; the LogD values increase as the pH increases, with a more pronounced effect, thus a much wider interval of distribution, for the first three compounds—which can be explained by the electron withdrawing inductive effect of the phenyl group. Mainly due to the presence of the thiol group, the compounds from groups B and C (Th-9-22) present rather an acidic behavior, which is more evident for compounds Th-9-11 and in group C (Th-18-22). This may suggest that compounds Th-1-3 are better absorbed in intestine than in stomach, while compounds Th-9-11 and Th-18-22 are better absorbed in stomach and less in intestine, due to their higher uncharged population of molecules in the first mentioned compartments. The other compounds (Th-4-9, Th-12-17) are to a lesser extent affected by pH variation at the studied interval (i.e., 1.5–7.4).
Applying PCA on both experimentally and computed lipophilicity indices on all studied compounds, 2D plot of the loadings (circle correlation) showed a regular increase of the correlation between LogD values and experimentally determined lipophilicity indices (PC1, RM0) as the pH increases (Figure 4 and Figure S1). However, since the compounds behaved differently according to their group, a PCA application on two separated groups: A (basic compounds) and B and C (acidic compounds) revealed interesting results (Figure 5 and Figure S2). As expected, in both groups, PC1 and RM0 positively correlate with each other (r = 0.804) and these indices present a strong negative correlation with b (r = −0.965 with RM0 and r = −0.621 with PC1) since it is the characteristic of the specific hydrophobic surface area [6,11,12]. LogP and LogD values afford a relatively moderate correlation with the experimentally determined indices, most probably due to the limitation of estimation of computed indices for complex compounds, since none of the available methods can take into consideration all the effects of molecular conformation. However, as can be observed from Figure 5, LogD at acidic pH in the case of group A and LogD at basic pH in the case of groups B and C are more correlated with RM0 and PC1 values.
The scatterplot of the scores of the first three principal components after applying PCA on all the previously discussed lipophilicity indices reveals an obvious clustering of the compounds, according to their properties and structural aspects, in very good agreement with the grouping performed in Table 1 (Figure 6). Group A and group B overlap to some extent but group C forms a distinct cluster despite the high scattering within it, most probably due to numerous changes caused by the presence of the heteroatom (Y substituent, Table 1). Compound Th-17 appeared as an outlier due to its distinct higher RM0 value.
Figure 4. Loadings (circle correlation) for the experimental lipophilicity indices (RM0, PC1, b) and computed (logD and logP—calculated by the equally weighted calculation algorithm combining the three methods described in the Experimental Section) lipophilicity indices for all the studied compounds.
Molecules 20 19841 g004
Figure 5. Loadings (circle correlation) for the experimental lipophilicity indices (RM0, PC1, b) and computed (LogD and LogP—calculated by the equally weighted calculation algorithm combining the three methods described in the Experimental Section) lipophilicity indices for compounds in group A (left) and for compounds in groups B and C (right).
Molecules 20 19841 g005
Figure 6. 3D plot of the scores for first three principal components after applying PCA on all the discussed parameters, describing lipophilicity for all the studied compounds.
Molecules 20 19841 g006

2.3. Antioxidant and Anti-Inflammatory Effects of the Studied Compounds

The new thiazole compounds have anti-inflammatory effects by lowering the acute-phase response of bone marrow (L and PMN), phagocytic capacity (PI and PA) and oxidative stress [21]. The best anti-inflammatory and antioxidant effects were found for thiazolyl-carbonyl-thiosemicarbazides Th-1-8 (Group A) and for the oxadiazoles Th-18-20 and thiadiazole Th-21 (Group C). Also, the virtual screening of thiazole derivatives revealed that all twenty-two compounds bind the active site of iNOS [21]. Based on the virtual screening and on the obtained results, the activity may be due to their capacity to reduce NO synthesis by blocking the active site of iNOS [21].
In order to obtain a model with less variables, we applied PCA on determined biological parameters (L, PMN, PA, PI, NO, TOS, TAR, OSI) (Table 2).
Table 2. Effect of thiazolyl-carbonyl-thiosemicarbazides and thiazolyl-azoles on the determined biological parameters for anti-inflammatory and antioxidant activities.
Comp.LeukocytesPMNPAPINOTOSTAROSI
Th-15587.5 ± 45560.4 ± 4.118.5 ± 1.821.5 ± 4.650.479 ± 5.751.622 ± 6.21.108 ± 0.0034.66 ± 2.2
Th-26543 ± 27160.6 ± 3.122.5 ± 2.821.5 ± 2.851.827 ± 6.363.265 ± 5.41.099 ± 0.0035.76 ± 5.3
Th-34987 ± 13363.6 ± 3.931 ± 1.821.5 ± 0.952.838 ± 8.939.601 ± 7.91.095 ± 0.0033.62 ± 2.9
Th-412,218.8 ± 134182.8 ± 4.129 ± 1.822.5 ± 3.547.501 ± 2.849.823 ± 3.61.109 ± 0.0064.49 ± 3.6
Th-511,633.3 ± 15459.8 ± 3.622.5 ± 0.919.5 ± 2.347.024 ± 8.951.557 ± 17.11.096 ± 0.0014.7 ± 3.1
Th-66056.25 ± 86270.4 ± 2.918 ± 1.513 ± 3.250.591 ± 9.143.108 ± 5.61.097 ± 0.0063.93 ± 2.6
Th-76356.25 ± 6673.2 ± 4.053.5 ± 3.520.5 ± 0.954.355 ± 6.244.073 ± 3.81.107 ± 0.0033.98 ± 3.8
Th-85718.75 ± 10466.6 ± 1.021 ± 1.121.5 ± 0.948.793 ± 5.555.664 ± 4.21.107 ± 0.0025.03 ± 4.1
Th-99000 ± 42867.4 ± 3.020.5 ± 0.921 ± 7.065.479 ± 4.868.780 ± 16.21.101 ± 0.0016.25 ± 5.2
Th-105606.25 ± 15461.2 ± 3.423 ± 1.120.5 ± 0.965.142 ± 5.354.164 ± 5.41.095 ± 0.0034.95 ± 5.4
Th-1111,137.5 ± 48386.4 ± 2.619.75 ± 2.421 ± 1.166.799 ± 5.966.394 ± 8.91.092 ± 0.0036.08 ± 4.9
Th-128456.25 ± 56578.6 ± 1.020 ± 1.522.5 ± 3.570.029 ± 6.490.592 ± 4.21.095 ± 0.0048.27 ± 4.2
Th-1310,172 ± 33180.8 ± 3.027.5 ± 0.925.5 ± 2.875.451 ± 6.950.886 ± 5.61.1 ± 0.0124.63 ± 3.6
Th-1410,172 ± 52075.4 ± 4.523.5 ± 0.928 ± 2.186.04 ± 2.966.876 ± 9.71.097 ± 0.0066.1 ± 4.7
Th-159982.5 ± 8177.4 ± 5.129 ± 3.224 ± 4.371.630 ± 5.969.171 ± 4.41.094 ± 0.0066.32 ± 4.4
Th-169225 ± 33377.4 ± 1.927 ± 1.121.2 ± 1.063.091 ± 5.166.681 ± 9.11.103 ± 0.0096.04 ± 4.1
Th-1710,147.5 ± 52875.4 ± 5.219.5 ± 0.915 ± 3.560.479 ± 11.869.962 ± 5.21.093 ± 0.0036.38 ± 5.2
Th-184575 ± 80563.7 ± 2.456 ± 8.617 ± 1.943.23 ± 3.978.089 ± 14.11.118 ± 0.0066.98 ± 4.1
Th-197443.75 ± 117272.8 ± 5.013.5 ± 2.7820 ± 1.545.198 ± 2.279.849 ± 121.119 ± 0.0097.13 ± 5.9
Th-204837.5 ± 130559.2 ± 5.620 ± 1.516 ± 3.043.288 ± 5.081.022 ± 13.21.106 ± 0.0037.32 ± 3.2
Th-213000 ± 24152.6 ± 2.123 ± 1.914.5 ± 4.643.737 ± 6.267.137 ± 10.61.114 ± 0.0076.03 ± 4.5
Th-225812.5 ± 39966.4 ± 0.823.5 ± 0.935 ± 8.252.08 ± 8.156.694 ± 7.91.105 ± 0.0015.13 ± 4.9
After applying PCA only on these biological activity parameters, an acceptable model was obtained, the first three principal components containing 75.87% of total variance (Figure S3). However, it is interesting that the 3D scatterplot of the first three principal components revealed a pattern of clustering of the studied compounds, similar to the one of their lipophilicity (Figure 7). The three groups are well and distinctly grouped, with compound Th-22 as an exception. Here, groups A and B are better separated than in case of the lipophilicity (Figure 6), indicating their more distinct behavior in case of their biological activities.
Figure 7. 3D scatterplot of the scores for the first three principal components after applying PCA on all the discussed parameters, describing biological activity for all the studied compounds.
Molecules 20 19841 g007

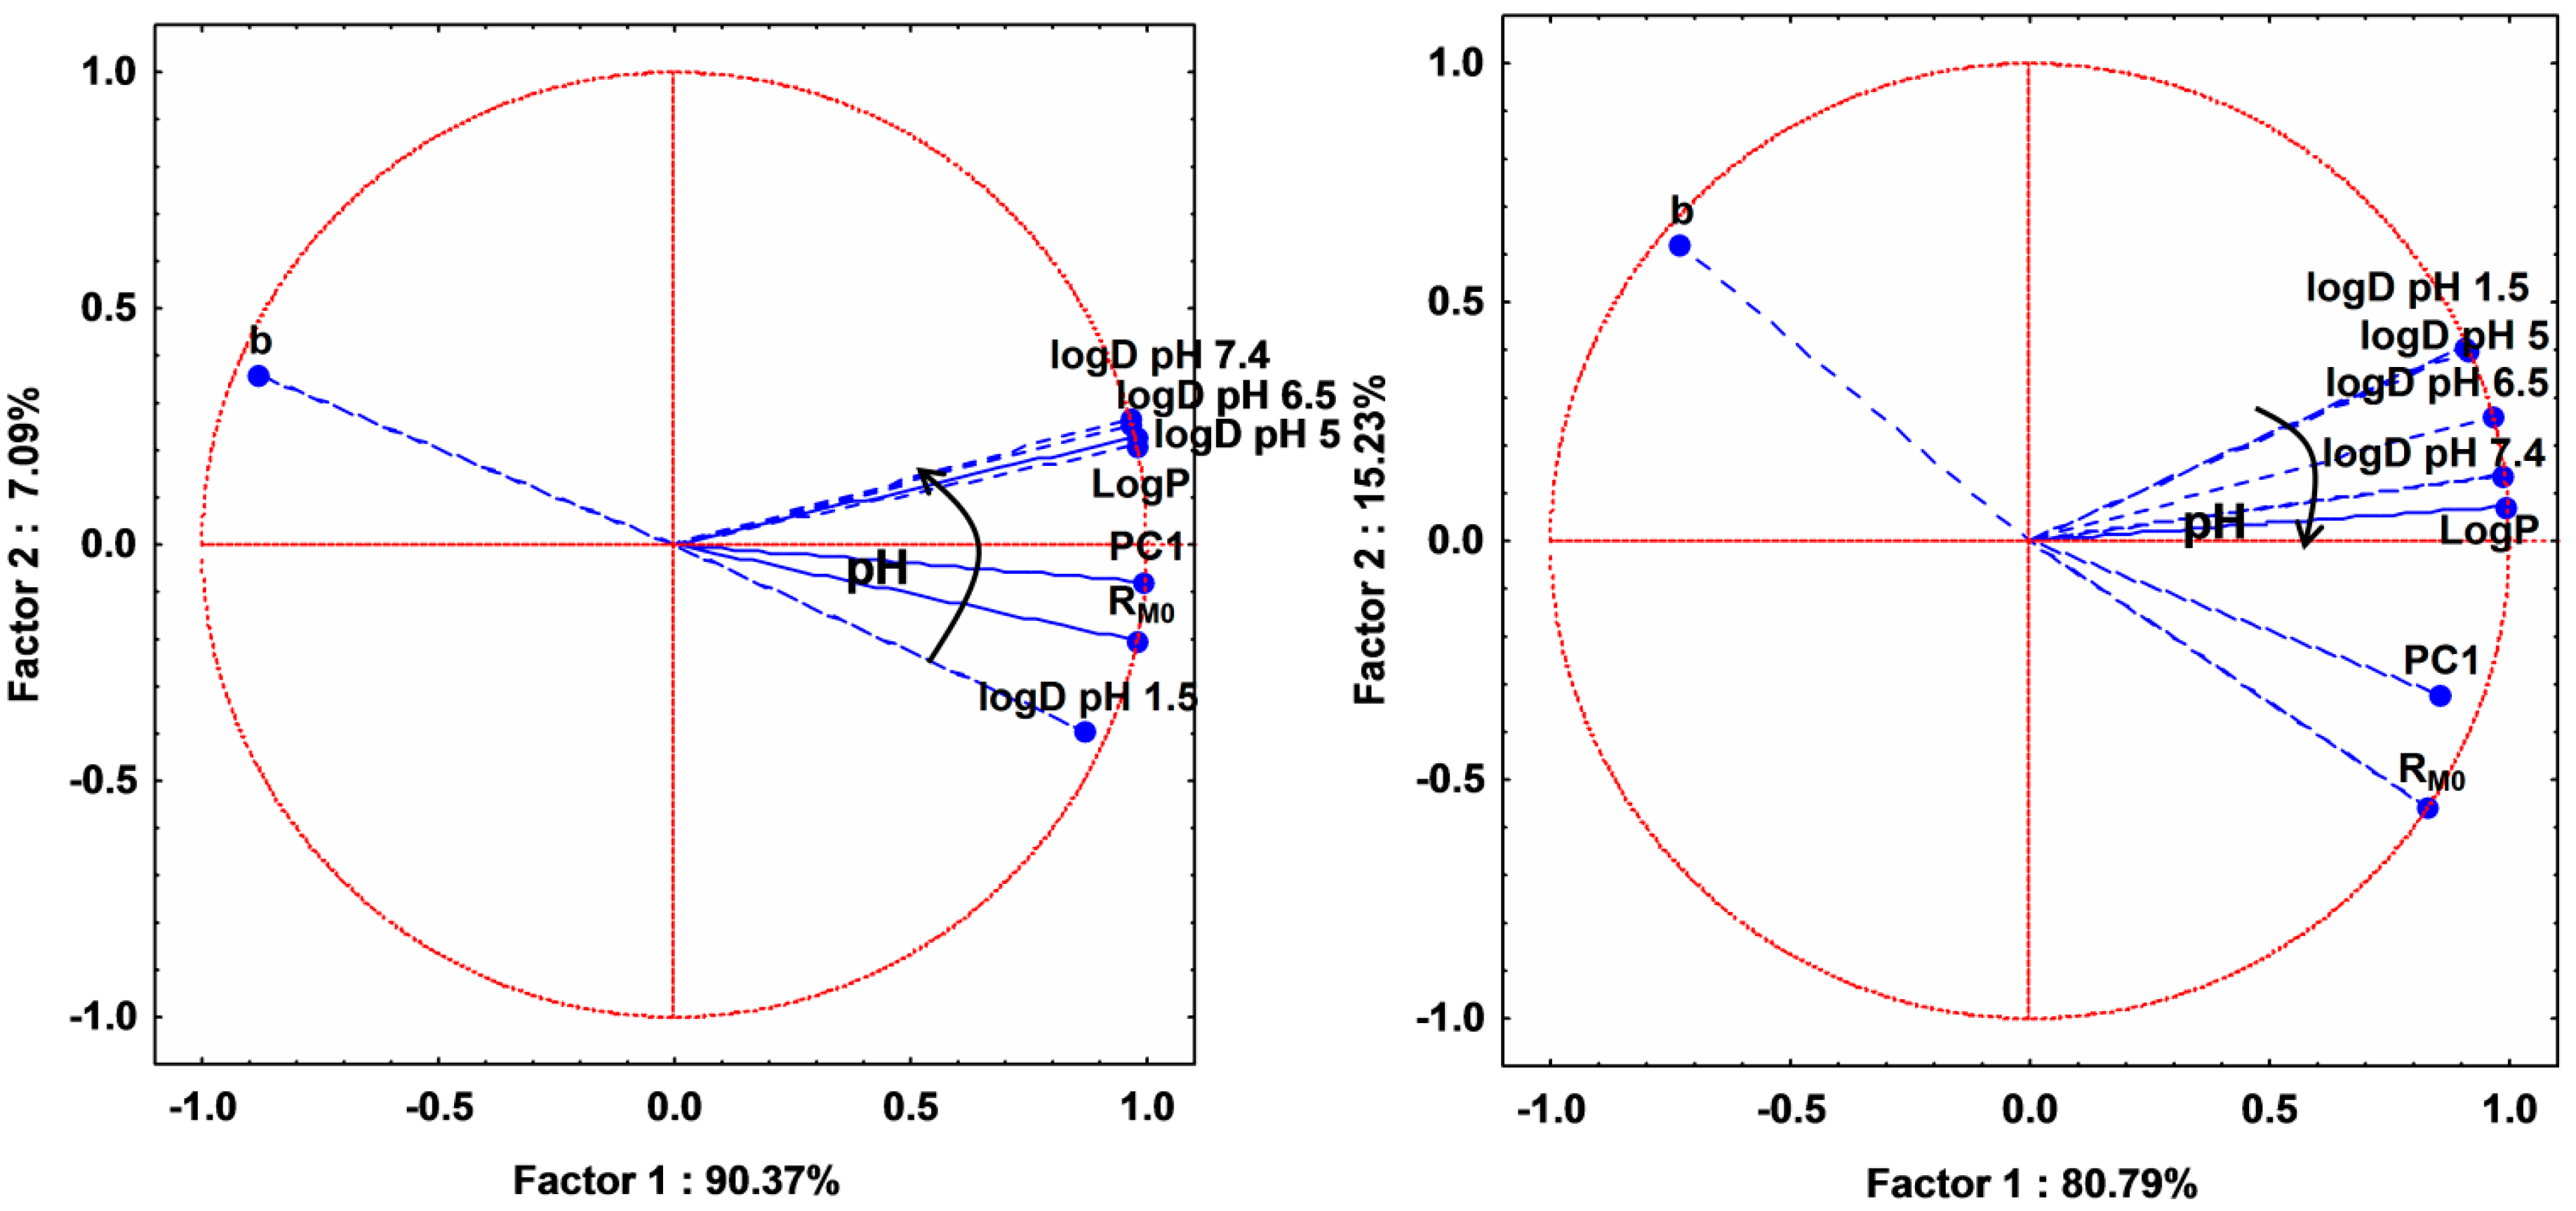
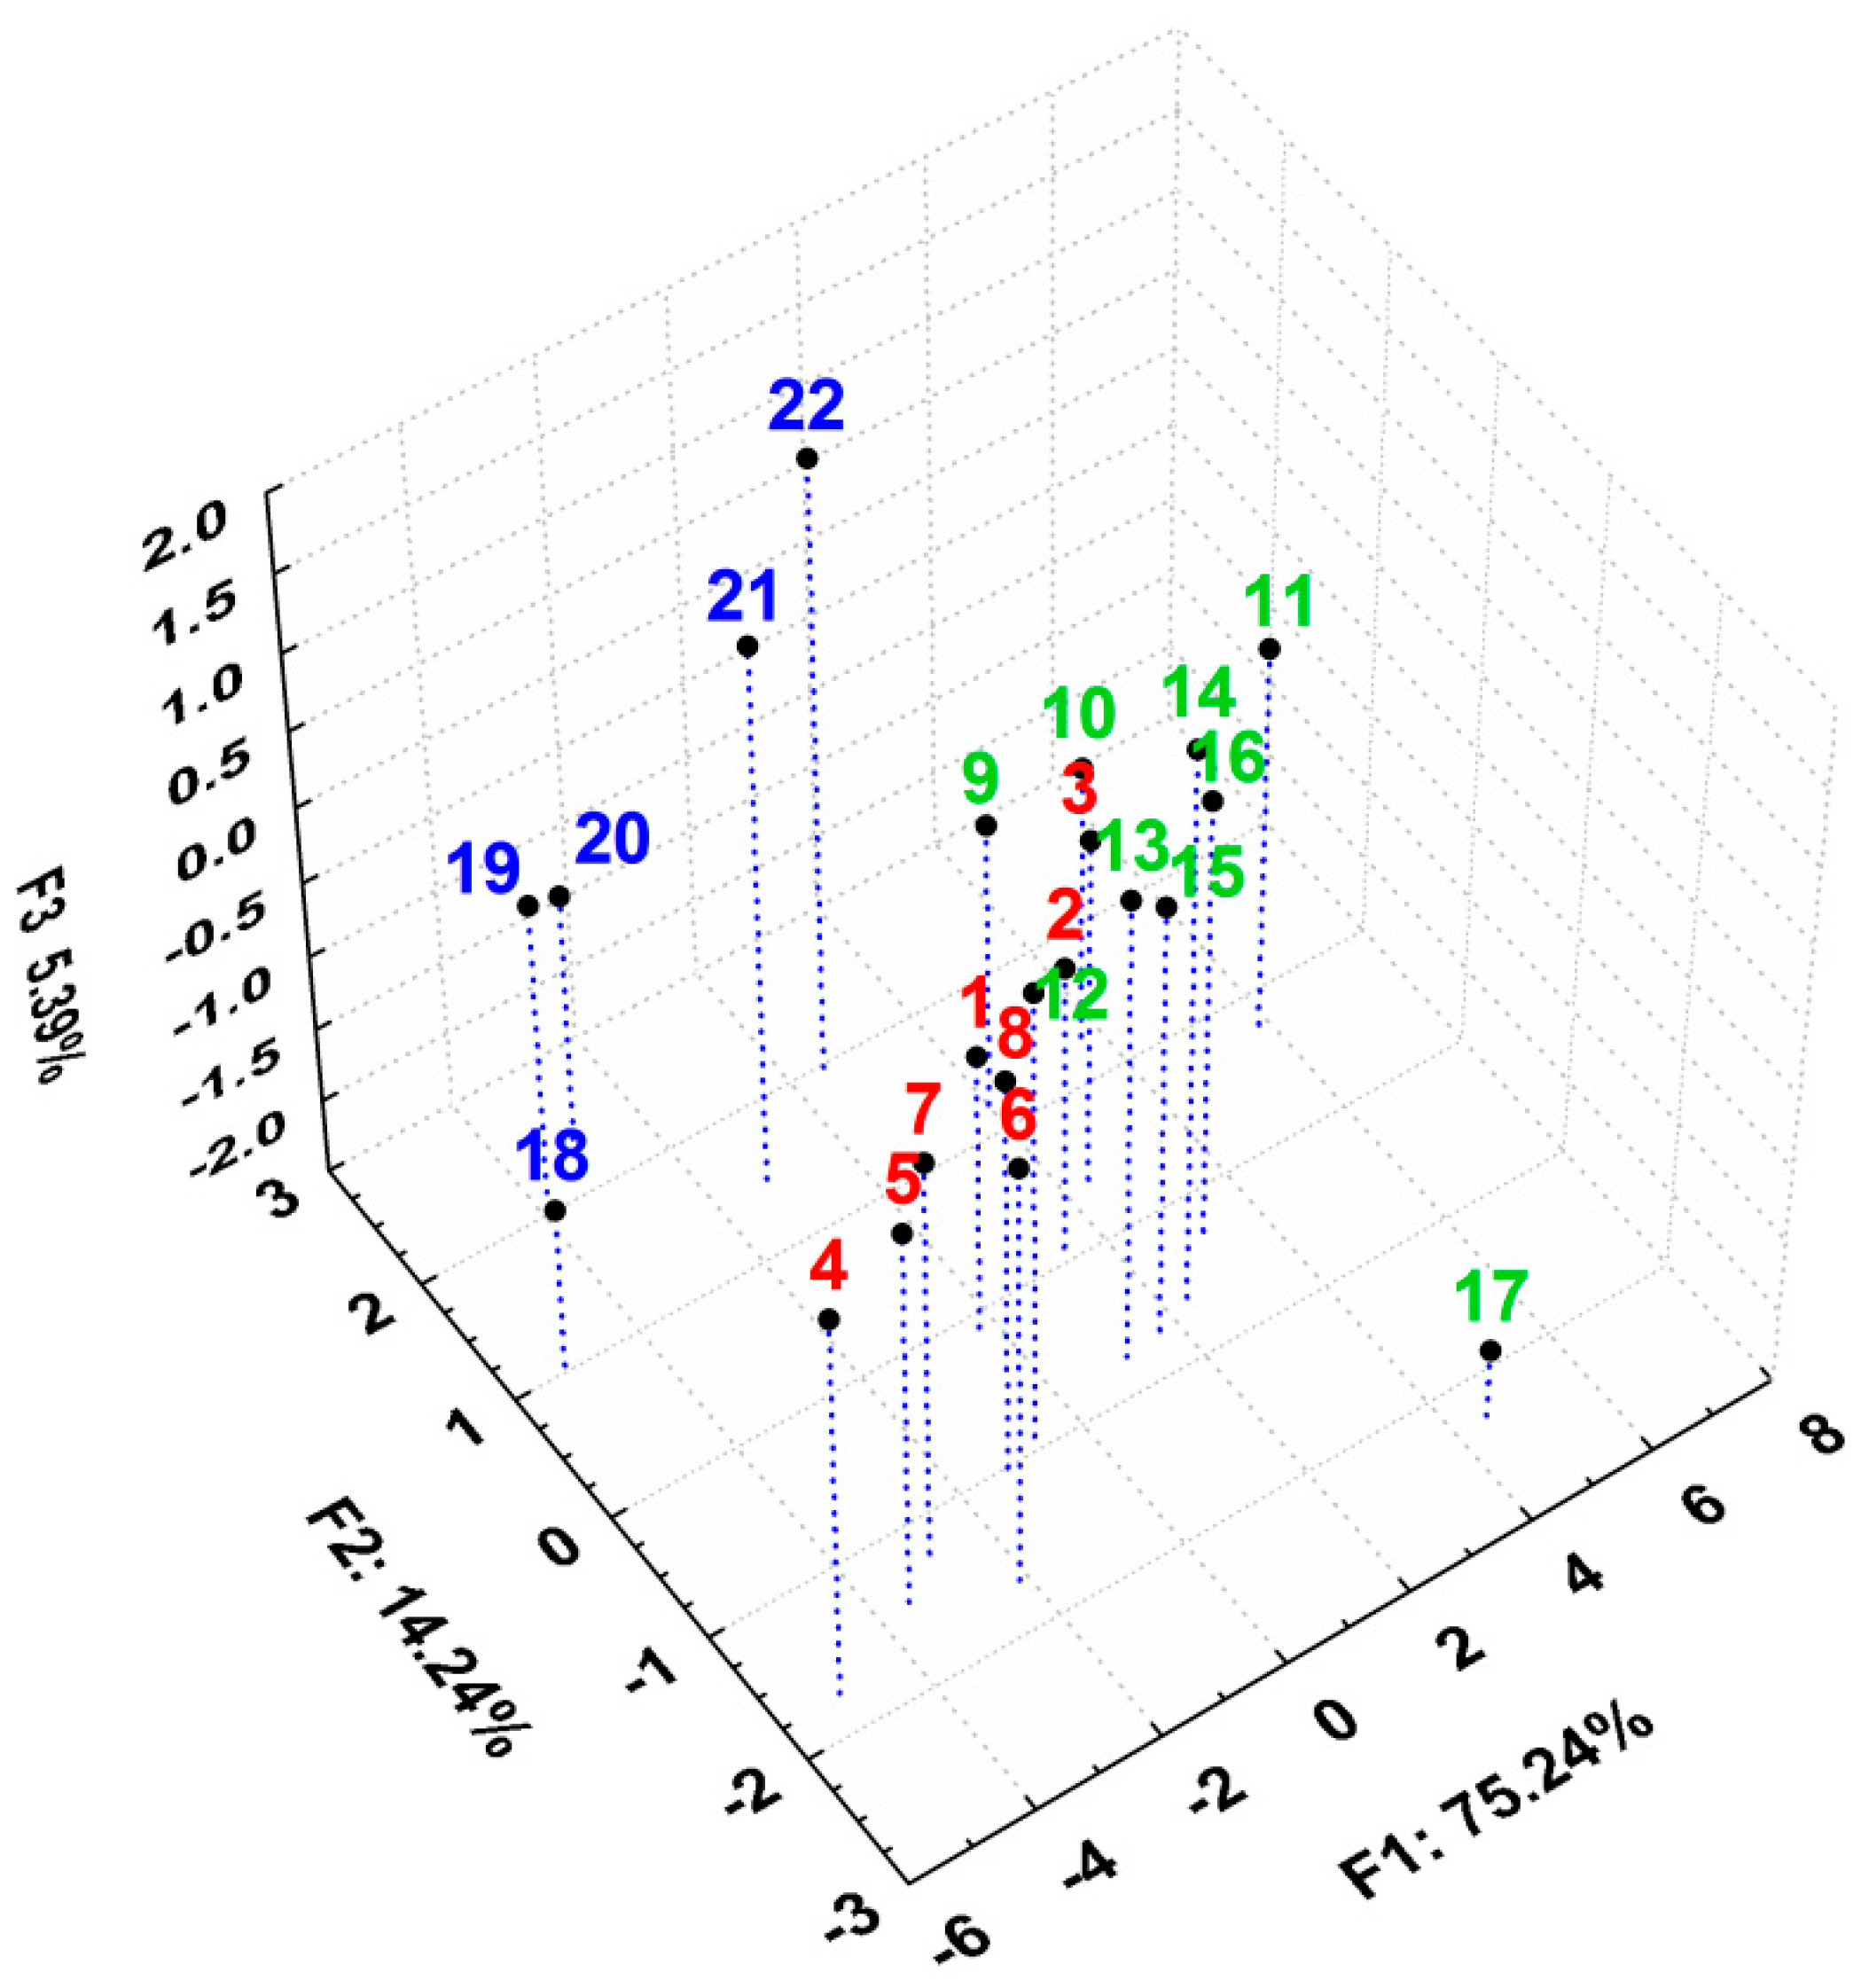
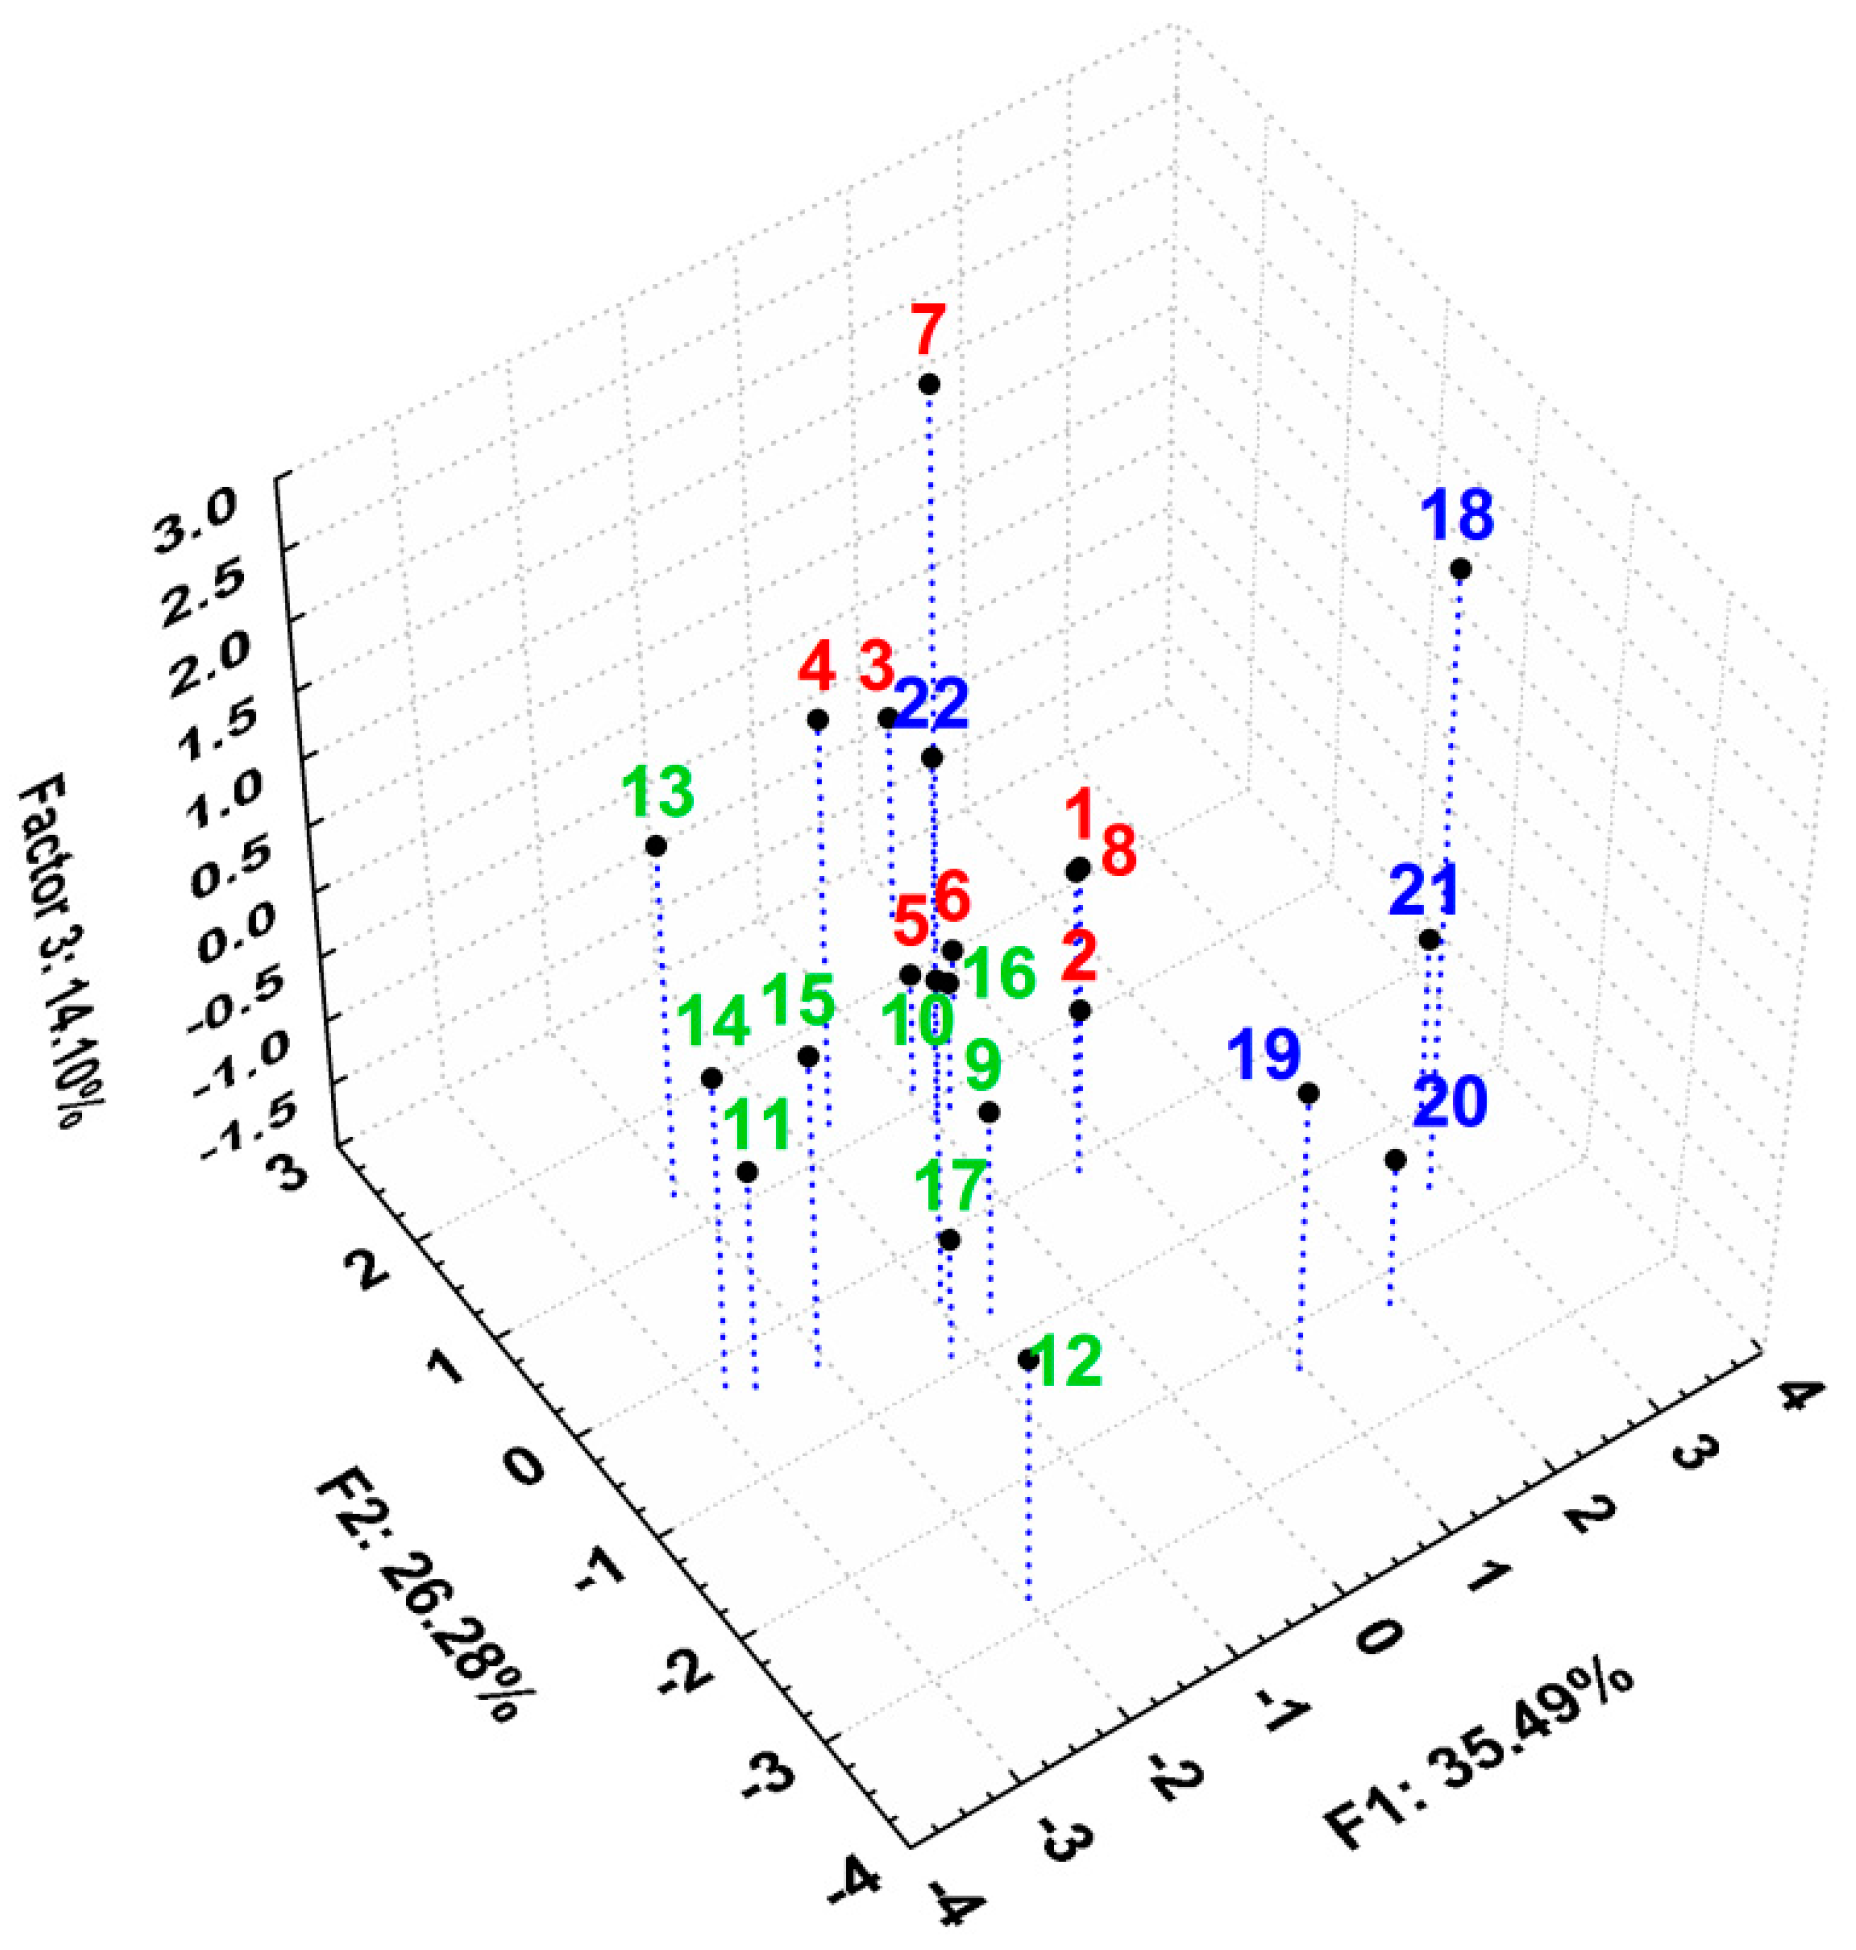
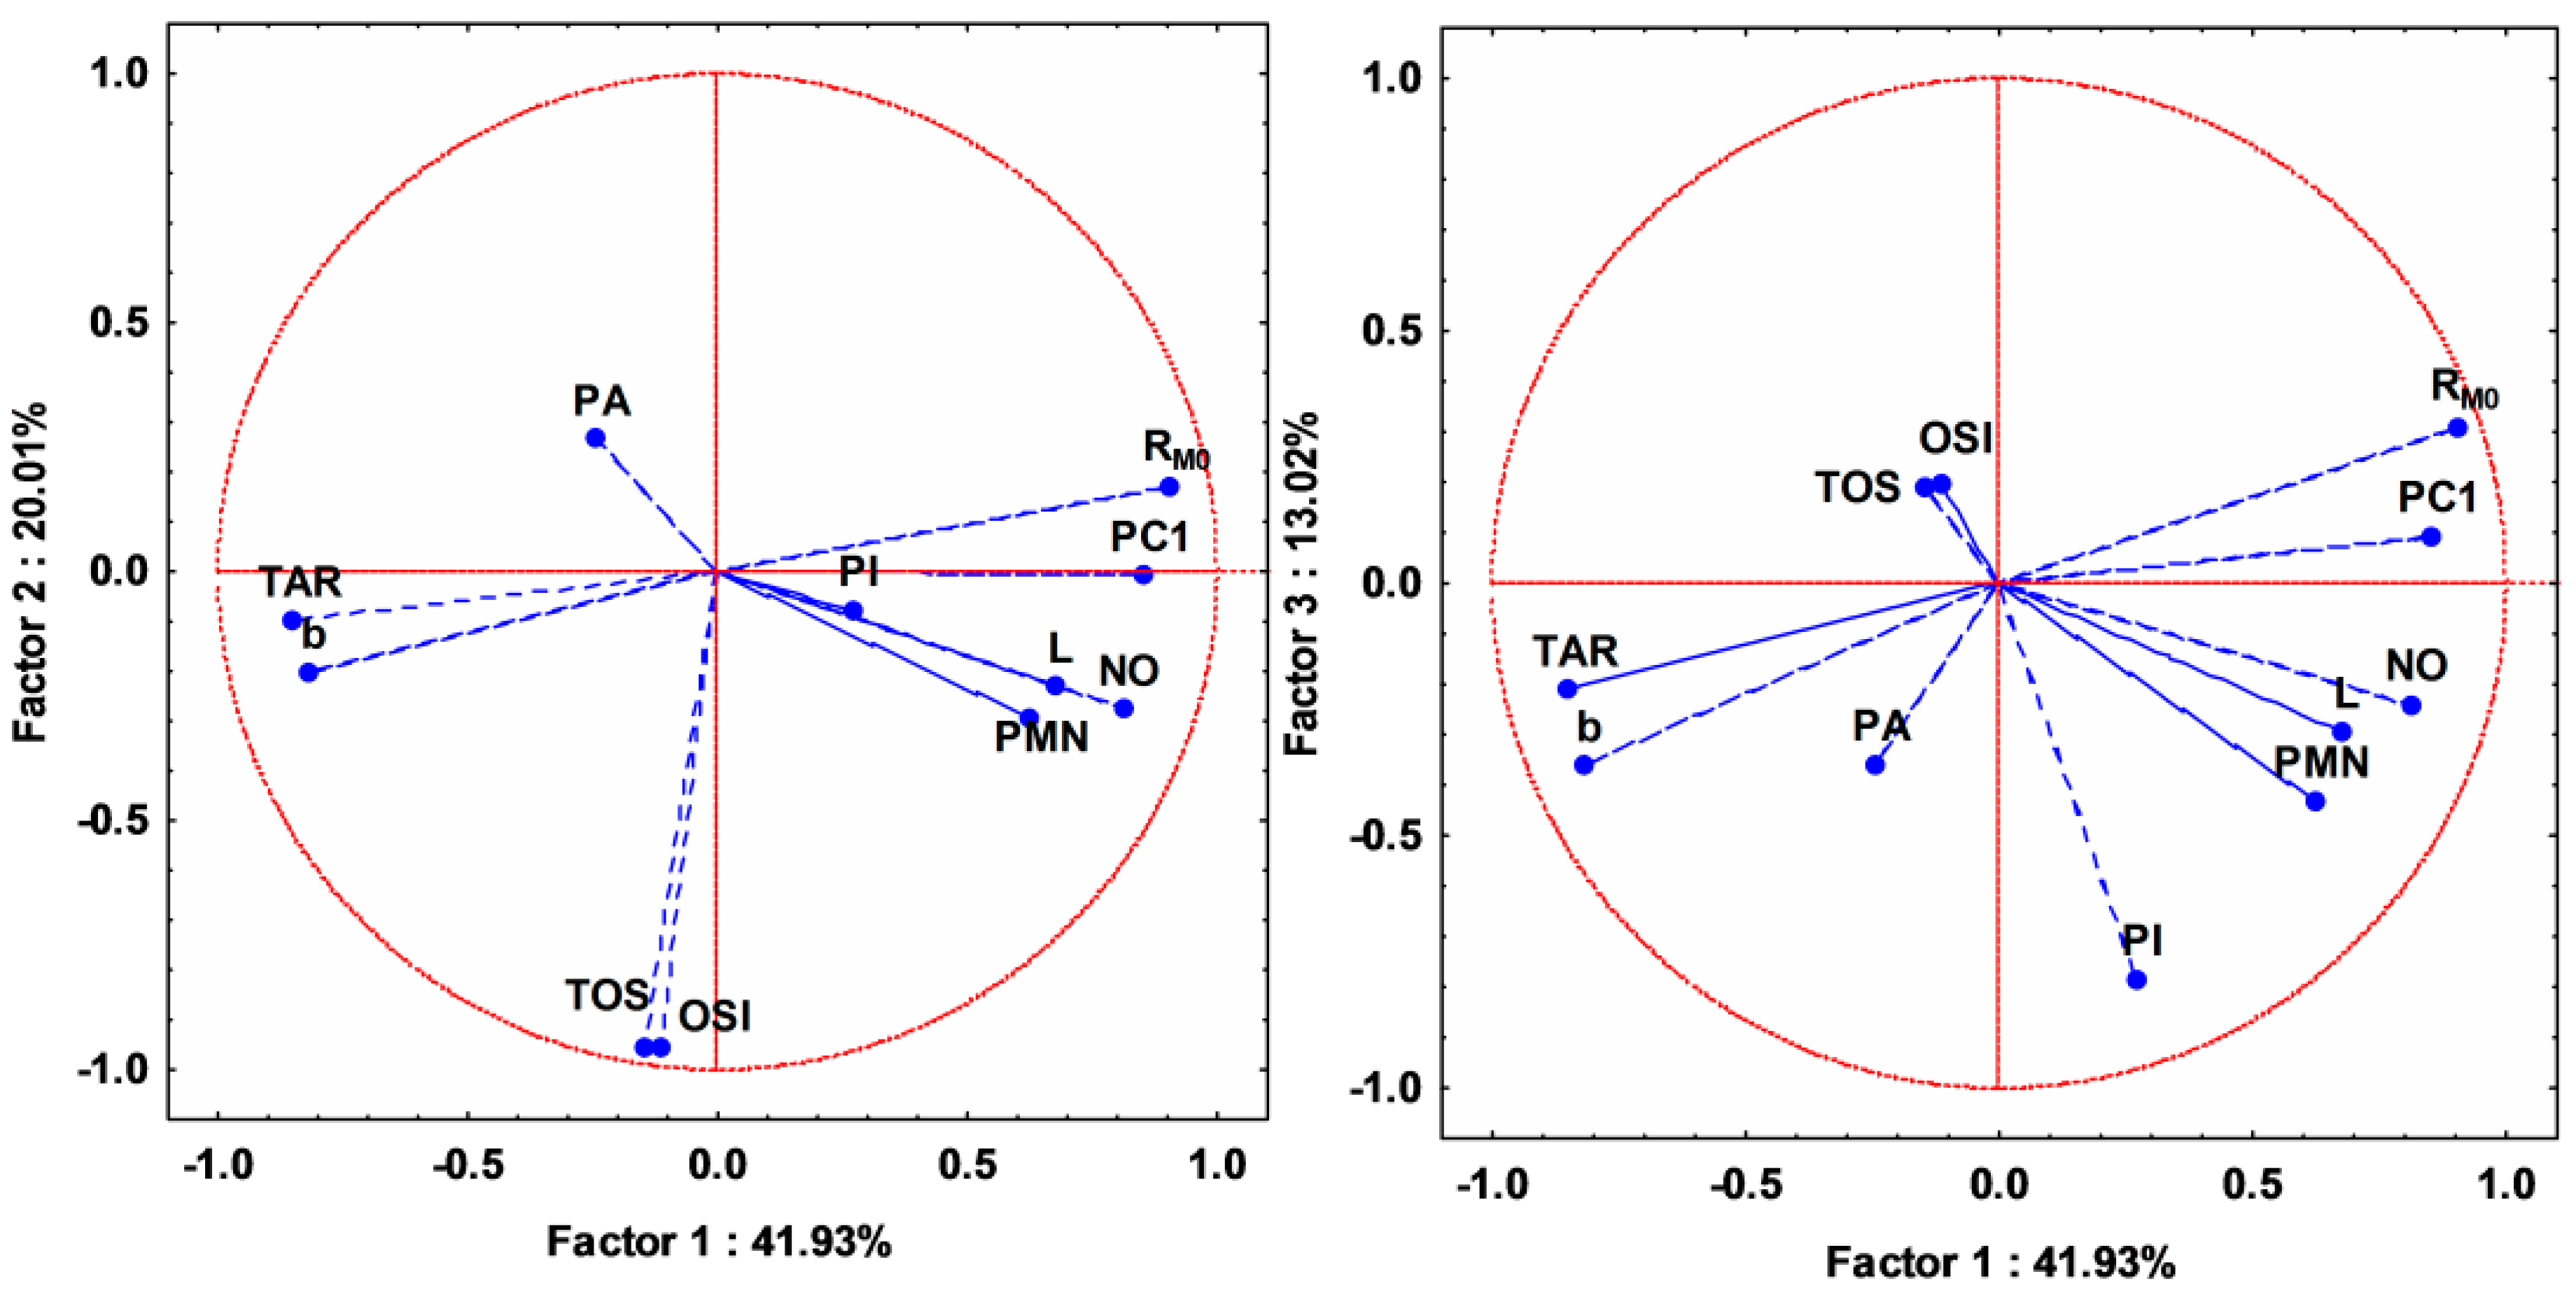
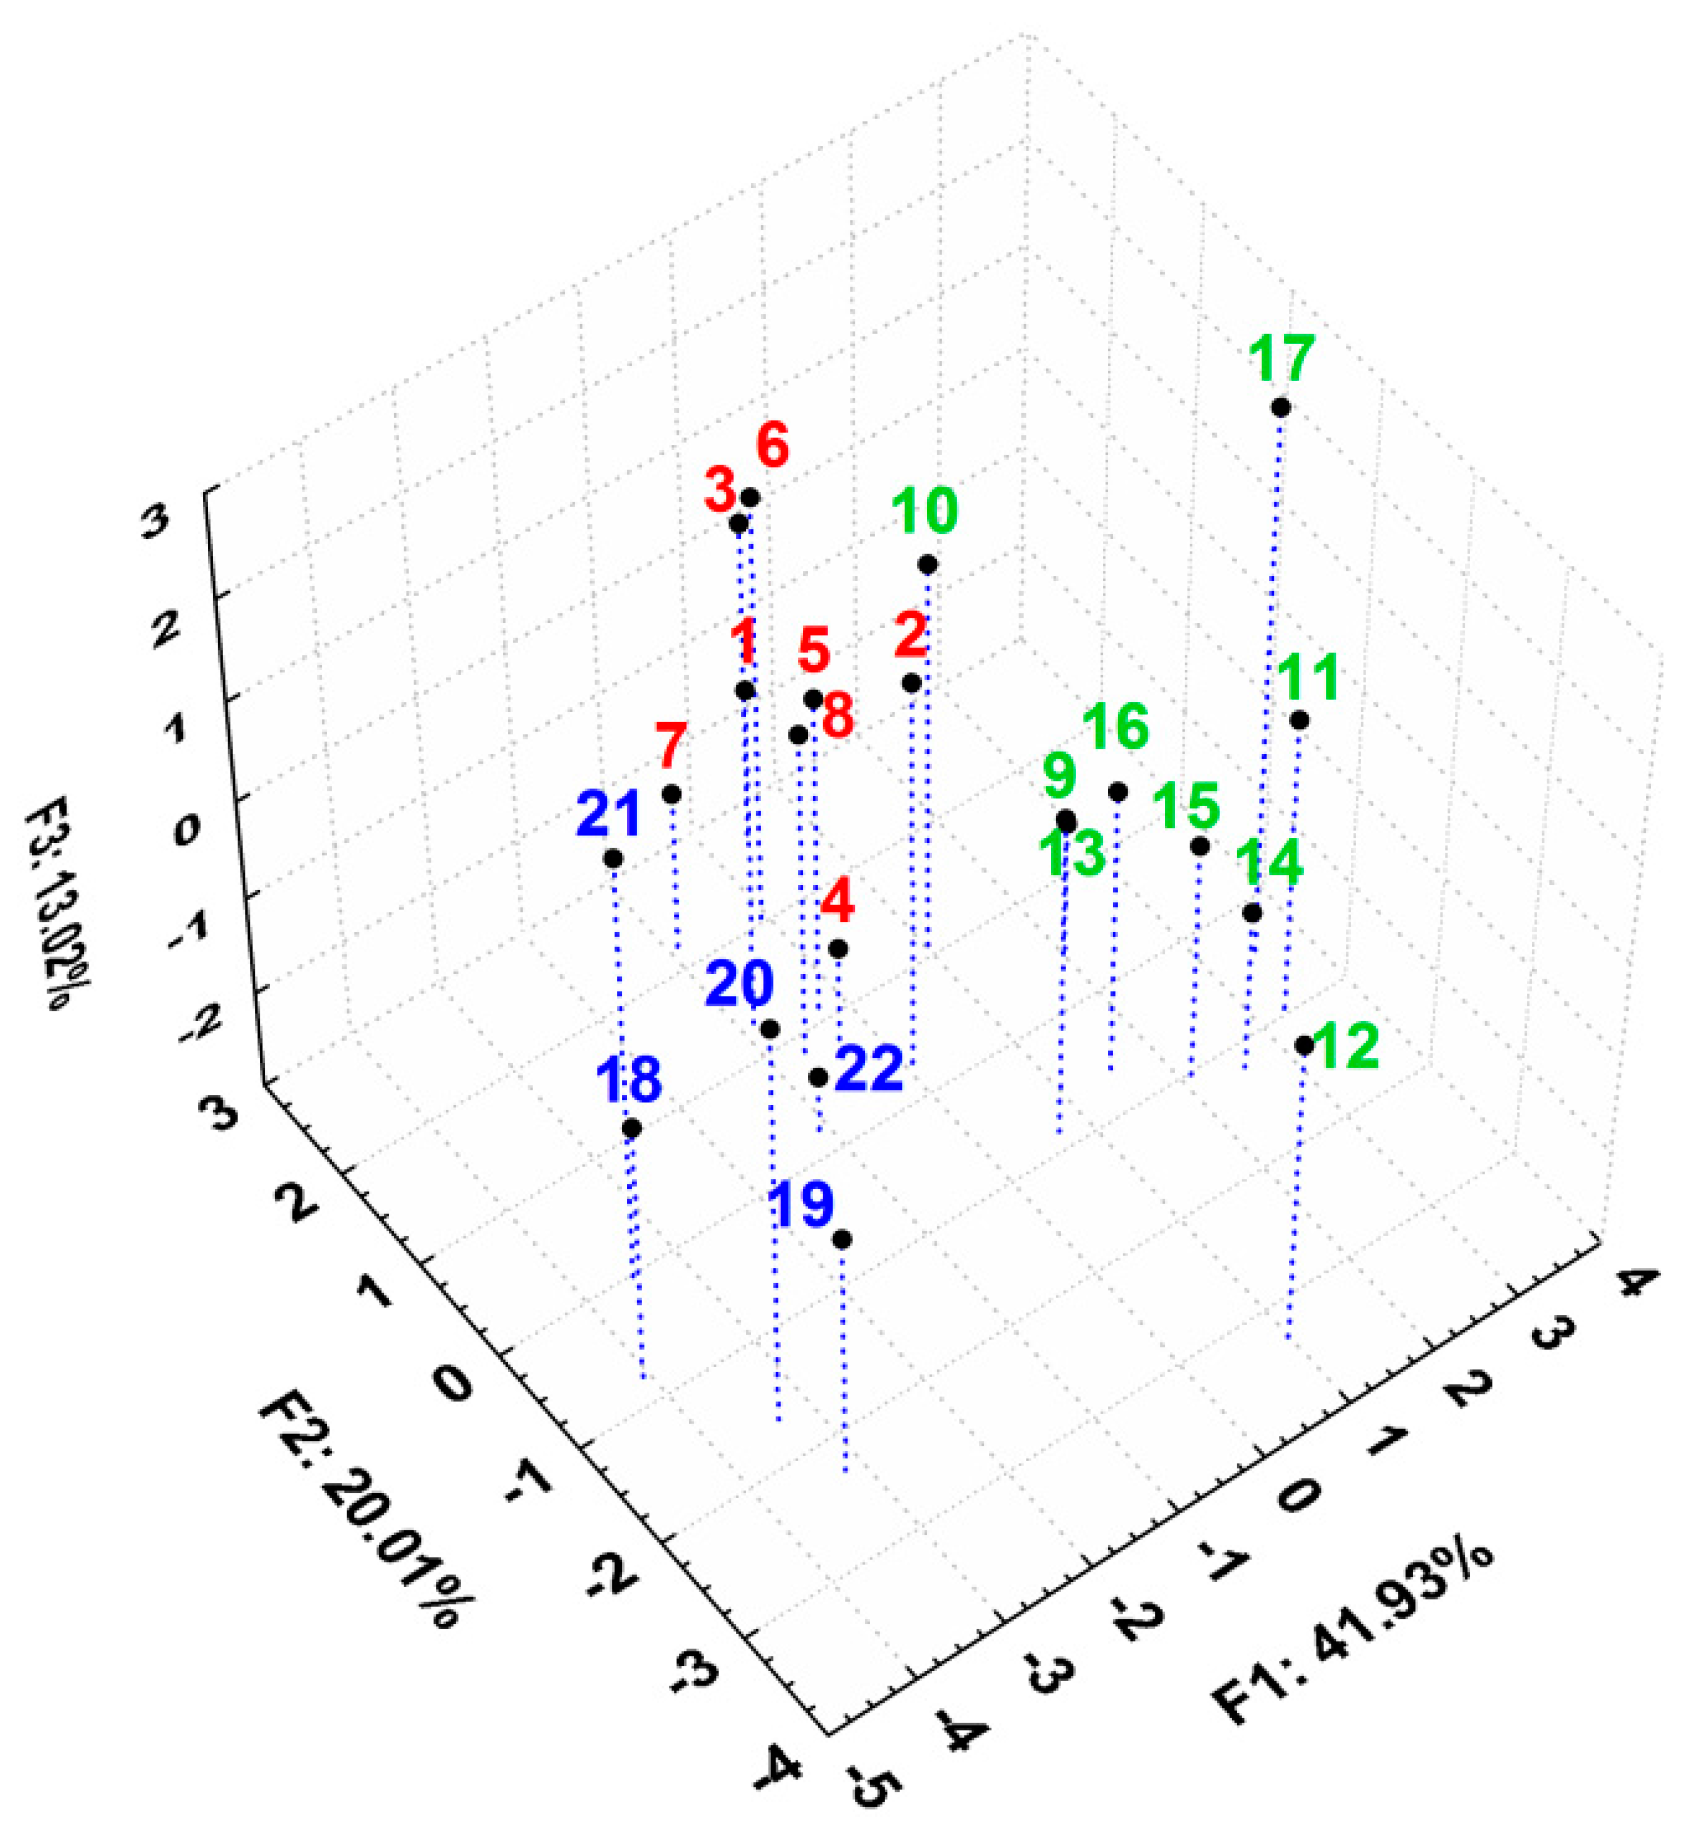
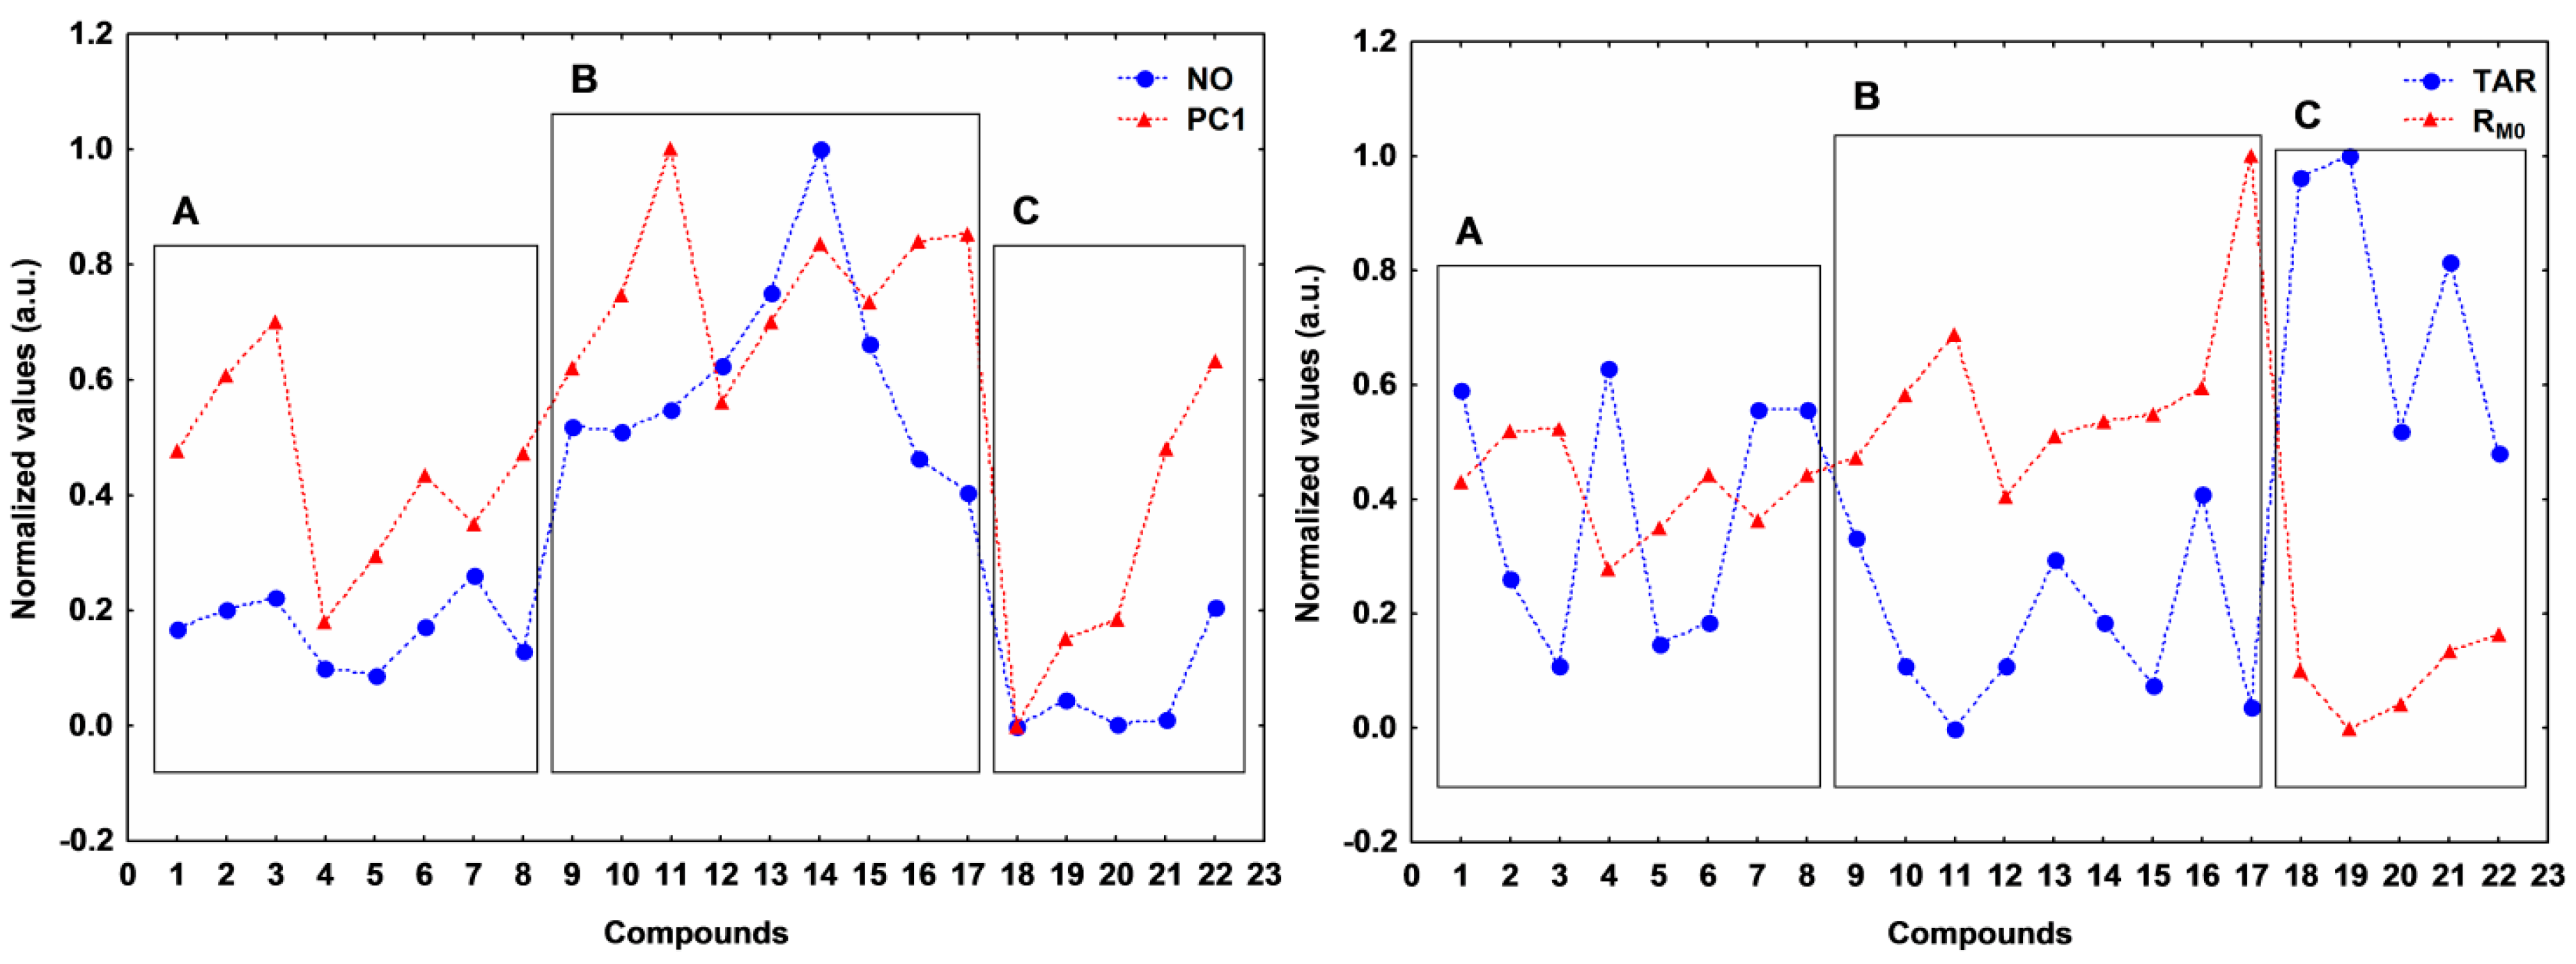
2.4. Comparative Evaluation of Both Lipophilicity Indices and Antioxidant and Anti-Inflammatory Activities Evaluation for the Studied Compounds

A similar clustering of the compounds to the one seen in the case of their lipophilicity indicates that there are some possible correlations between their lipophilicity and their biological activity. In this regard, PCA was applied on all the studied variables, describing lipophilicity and the anti-inflammatory and antioxidant activities. After applying PCA, an acceptable model was obtained—the first three principal components containing 74.96% of total variance (Figure S4). Analyzing the loadings of the variables and the matrix correlation of the original variables, we observed that NO parameter is positively correlated with the lipophilicity, and TAR activities are negatively correlated with the lipophilicity indices (Figure 8, Table 3).
Table 3. Correlation matrix of the lipophilicity indices and antioxidant and anti-inflammatory effects for all the studied compounds. Values greater than 0.5 are in bold face characters.
LPMNPAPINOTOSTAROSIRM0bPC1
L1.0000.735−0.1750.2500.5220.025−0.4550.0430.453−0.4690.313
PMN 1.0000.0160.2810.5760.086−0.3050.0980.398−0.3840.354
PA 1.000−0.008−0.111−0.1620.291−0.174−0.1660.071−0.318
PI 1.0000.443−0.105−0.127−0.098−0.0090.1530.320
NO 1.0000.109−0.6290.1350.600−0.4740.741
TOS 1.0000.1780.999−0.2060.208−0.091
TAR 1.0000.142−0.7820.704−0.741
OSI 1.000−0.1780.184−0.063
RM0 1.000−0.9650.804
b 1.000−0.621
PC1 1.000
L = leukocytes; PMN = polymorphonuclear leukocytes; PA = phagocytic activity; PI = phagocytosis index; NO = nitric oxide; TOS = total oxidative status; TAR = total antioxidant response; OSI = oxidative stress index; RM0 = lipophilicity estimation parameter; b = slope; PC1 = first principal component.
Figure 8. Loadings (circle correlation) for the assessed biological activity (left panel) and lipophilicity indices (right panel) for all studied compounds. L = leukocytes; PMN = polymorphonuclear leukocytes; PA = phagocytic activity; PI = phagocytosis index; NO = nitric oxide; TOS = total oxidative status; TAR = total antioxidant response; OSI = oxidative stress index; RM0 = lipophilicity estimation parameter; b = slope; PC1 = first principal component.
Molecules 20 19841 g008
Besides this, PA, PI, TOS and OSI have statistically no correlation, while PMN and L have low correlation with any lipophilicity indices. However, the two previously mentioned variables (TAR and NO) have distinctly higher correlation with all lipophilicity indices. Activation and stimulation of phagocytes in the inflammatory process is dependent on membrane-derived lipid mediators (e.g., arachidonic acid derivatives) [23,24]. This may explain the positive correlation between the reactive nitrogen intermediates (RNIs) (i.e., NO), produced by phagocytes, and lipophilicity (Figure 8 and Figure 9). On the other hand, as a consequence of oxidative stress increase by reactive oxygen intermediates (ROIs) and RNIs, the antioxidant defense capacity is reduced. This justifies the negative correlation between TAR and lipophilicity (Figure 8 and Figure 9).
Figure 9. Profiles of NO vs. PC1 (left panel) and TAR vs. RM0 (right panel) for all studied compounds.
Molecules 20 19841 g009
The 3D scatterplot of the scores for the first three principal components reported in Figure 10 reveals an even better and more compact clustering for the studied compounds forming the three distinct groups: the thiosemicarbazides Th-1-8 from group A with the best anti-inflammatory and antioxidant effects [21], the triazoles Th-9-17 from group B and the oxadiazoles and thiadiazoles Th-18-22 from group C.
Figure 10. 3D scatterplot of the scores for the first three principal components after applying PCA on all the discussed parameters describing biological activity and lipophilicity for all studied compounds.
Molecules 20 19841 g010
The knowledge of the grouping patterns of the tested variables allows for the reduction of experimental determined parameters, the variables which are close to each other in PCA results describing similar properties of the substances. For this reason, it is not necessary to measure and evaluate all variables to achieve the same characterization—thus reducing the amount of experimental work required [25].
The pattern of the profiles of both NO and TAR vs. PC1 and RM0 respectively, clearly sustain the positive and negative correlation (Figure 9). For the first case (NO vs. PC1), the A and C groups present a distinctly higher similarity of the pattern than the B group (Figure 9 left), and the NO synthesis increases with the lipophilicity in agreement with the previous observations. Thus, best anti-inflammatory compounds Th-1-8 have the medium values for the lipophilicity parameters. For the second case, the negative correlation profiles between TAR and RM0 (Figure 9 right) is salient for group A and for some compounds from groups B and C. The negative correlation might be explained by the fact that the increase in hydrophobicity of a given compound may imply an increase in redox potential, thus decreasing its antioxidant ability [26].

3. Experimental Section

3.1. Chromatographic Procedure

Chromatography was performed on 20 × 20 cm RP-18F254s TLC precoated silica plates (Merck; Darmstadt, Germany). Solutions (1 mg/mL) of the tested compounds were prepared in iso-propanol, and 3 μL aliquots were spotted in duplicate on the plates by hand, 10 mm from the bottom edge and 20 mm apart. The mobile phases were composed of the iso-propanol-water binary mixtures, with a varying content of organic modifier between 45% and 65% (v/v) in 5% increments, as the study compounds differed considerably in their retention. Chromatography was performed in a normal developing chamber at room temperature, the developing distance being 10 cm. The chromatography chamber was saturated with the mobile phase for 30 min before use. After the development (30–60 min), the plates were air dried at room temperature and examined under a UV lamp (λ = 254 nm), and the RF (retardation factor) values were measured manually by a digital caliper. The experiments were performed in triplicate.

3.2. Prediction of Partitioning and Distribution Coefficients

The lipophilicity effects of compounds were predicted as log P and log D using the partitioning module of MarvinSketch 5.5.0.1, 2011 (ChemAxon Kft., Budapest, Hungary, http://www.chemaxon.com). Calculations for log D were estimated for the implicit reference values: log D1.5 (log D calculated at the physiological pH of stomach), log D5.0 (log D calculated at the physiological pH of duodenum), log D6.5 (log D calculated at the physiological pH of jejuno-ileum) and log D7.4 (log D calculated at the physiological pH of blood serum). Both calculations for log P and log D were performed using four different methods: a calculation algorithm developed by ChemAxon Kft. based on the publication of Viswanadhan and coworkers [27], one based on method developed by Klopman and coworkers [28], another one using the log P data from PHYSPROP© database and an equally weighted calculation algorithm combining the three methods. Supplementary, the software was set to take in account, for each set of calculations/algorithm, the major tautomeric forms of each compound.

3.3. Biological Activity Measurements

The synthesized thiazolyl-carbonyl-thiosemicarbazides and thiazolyl-azoles Th-1-Th-22 were previously evaluated in vivo for their anti-inflammatory activity in a turpentine oil-induced inflammation model [21]. Their anti-inflammatory activity was assessed by evaluating the acute-phase response of bone marrow by leukocytes count (L) and by differential leucocyte count, expressed as a percentage (PMN) and by phagocytes’ capacity (PI%-phagocytosis index, PA-phagocytic activity), nitric oxide (NO) synthesis and antioxidant capacity (TOS-total oxidative status, TAR-total antioxidant response and OSI-oxidative stress index [21].

3.4. Statistical Analysis

All results were expressed as mean ± standard deviation (SD) of three independent experiments. Statistical comparisons between the groups were performed using one-way analysis of variance (ANOVA) test. A value of p < 0.05 was considered to be statistically significant.

4. Conclusions

The applied PCA method of multivariate analysis allowed us to compare the chromatographic retention data, the lipophilic parameters and the biological parameters of the investigated thiazolyl-carbonyl-thiosemicarbazides and thiazolyl-azoles.
The obtained results illustrate how the nature of the substituents attached to a pharmacophore (thiazole for group A, thiazolyl-azole for groups B and C) influences the chromatographic retention, i.e., the lipophilic behavior and the determined biological parameters of the investigated compounds.
The PCA method could be used to group the studied compounds based on the influence of the substituents on the lipophilic character of the whole molecule. Also, the results of the PCA analysis applied on all the experimental and computed lipophilic parameters and on the biological parameters show, as expected, that the best anti-inflammatory and antioxidant compounds are correlated with medium values for the lipophilicity parameters (an optimum hydrophilic-lipophilic balance). The knowledge of the grouping patterns of the tested variables offers the possibility to reduce the number of determined parameters, needed for predicting biological activity.

Supplementary Materials

Supplementary materials can be accessed at: https://www.mdpi.com/1420-3049/20/12/19841/s1.

Acknowledgments

This study was supported by The Executive Agency for Higher Education Research Development and Innovation Funding (UEFISCDI), Bucharest, Romania, on the Contract no. 210/2014—Project PN-II-PT-PCCA-2013-4-2075 “Synthesis, screening and controlled release of some novel thiazole, bithiazole and thiazolidin-4-one compounds with antioxidant, antiproliferative and antimicrobial activity”.

Author Contributions

Radu Tamaian was responsible of virtual prediction of the lipophilicity parameters, using computer software. Augustin Moț and Radu Silaghi-Dumitrescu have done the correlations between the biological parameters and lipophilicity and chemical structures. Brîndușa Tiperciuc conducted the design of this study and supervised all the steps of the project. Ovidiu Oniga, Brîndușa Tiperciuc, Ioana Ionuț, Anca Stana, Cristina Nastasă, Daniela Benedec were responsible for the experimental determination of lipophilicity parameters, the analyze of the results from the biological investigation, collecting data, interpreting correlation partial results and writing the manuscript.

Conflicts of Interest

The authors declare no conflict of interest.

References

  1. Testa, B.; Crivori, P.; Reist, M.; Carrupt, P.-A. The influence of lipophilicity on the pharmacokinetic behavior of drugs: Concepts and examples. Perspect. Drug Discov. Des. 2000, 19, 179–211. [Google Scholar] [CrossRef]
  2. Van de Waterbeemd, H. Calculation of drug lipophilicity—The hydrophobic fragmental constant approach. Quant. Struct. Act. Relatsh. 1993, 12. [Google Scholar] [CrossRef]
  3. Sangster, J. Octanol-Water Partition Coefficients: Fundamentals and Physical Chemistry, 1st ed.; John Wiley & Sons Ltd.: Hoboken, NJ, USA, 1997. [Google Scholar]
  4. Mannhold, R.; Poda, G.I.; Ostermann, C.; Tetko, I.V. Calculation of molecular lipophilicity: State-of-the-art and comparison of log P methods on more than 96,000 compounds. J. Pharm. Sci. 2009, 98, 861–893. [Google Scholar] [CrossRef] [PubMed]
  5. Leo, A.; Hansch, C.; Elkins, D. Partition coefficients and their uses. Chem. Rev. 1971, 71, 525–616. [Google Scholar] [CrossRef]
  6. Tiperciuc, B.; Sârbu, C. Prediction of the chromatographic retention (lipophilicity) of some new methyl-thiazole-oxadiazoline derivatives by multivariate regression methods. J. Liq. Chromatogr. Relat. Technol. 2006, 29, 2257–2270. [Google Scholar] [CrossRef]
  7. Durcekova, T.; Boronova, K.; Mocak, J.; Lehotay, J.; Cizmarik, J. QSRR models for potential local anaesthetic drugs using high performance liquid chromatography. J. Pharm. Biomed. Anal. 2012, 59, 209–216. [Google Scholar] [CrossRef] [PubMed]
  8. Pyka, A.; Miszczyk, M. Chromatographic evaluation of the lipophilic properties of selected pesticides. Chromatographia 2005, 61, 37–42. [Google Scholar] [CrossRef]
  9. Biagi, G.L.; Barbaro, A.M.; Sapone, A.; Recanatini, M. Determination of lipophilicity by means of reversed-phase thin-layer chromatography I. Basic aspects and relationship between slope and intercept of TLC equations. J. Chromatogr. A 1994, 662, 341–361. [Google Scholar] [CrossRef]
  10. Soczewiński, E.; Wachtmeister, C.A. The relation between the composition of certain ternary two-phase solvent systems and RM values. J. Chromatogr. A 1962, 7, 311–320. [Google Scholar] [CrossRef]
  11. Sârbu, C.; Casoni, D.; Darabantu, M.; Maiereanu, C. Quantitative structure—Retention activity relationship of some 1,3-oxazolidine systems by RP-HPTLC and PCA. J. Pharm. Biomed. Anal. 2004, 35, 213–219. [Google Scholar] [CrossRef] [PubMed]
  12. Alvarez-Coque, M.C.G.; Lapasió, J.R.T. Quantitation of hydrophobicity in micellar liquid chromatography. TrAC Trends Anal. Chem. 1999, 18, 533–543. [Google Scholar] [CrossRef]
  13. Fuchs, B.; Süss, R.; Teuber, K.; Eibisch, M.; Schiller, J. Lipid analysis by thin-layer chromatography—A review of the current state. J. Chromatogr. A 2011, 1218, 2754–2774. [Google Scholar] [CrossRef] [PubMed]
  14. Maćkiewicz, A.; Ratajczak, W. Principal components analysis. Comput. Geosci. 1993, 19, 303–342. [Google Scholar] [CrossRef]
  15. Mannhold, R.; Cruciani, G.; Dross, K.; Rekker, R.F. Multivariate analysis of experimental and calculative descriptors for molecular lipophilicity. J. Comput. Aided Mol. Des. 1998, 12, 573–581. [Google Scholar] [CrossRef] [PubMed]
  16. Casoni, D.; Kot-Wasik, A.; Namieśnik, J.; Sârbu, C. Lipophilicity data for some preservatives estimated by reversed-phase liquid chromatography and different computation methods. J. Chromatogr. A 2009, 1216, 2456–2465. [Google Scholar] [CrossRef] [PubMed]
  17. Oniga, O.; Grosu, I.; Mager, S.; Simiti, I. Heterocycles LXXVIII. Electrophilic substitution 2′-phenyl-4R-2,4′-bisthiazoles. Monatsh. Chem. 1998, 129, 661–669. [Google Scholar] [CrossRef]
  18. Zaharia, V.; Ignat, A.; Palibroda, N.; Ngameni, B.; Kuete, V.; Fokunang, C.N.; Moungang, M.L.; Ngadjui, B.T. Synthesis of some p-toluenesulfonyl-hydrazinothiazoles and hydrazino-bis-thiazoles and their anticancer activity. Eur. J. Med. Chem. 2010, 45, 5080–5085. [Google Scholar] [CrossRef] [PubMed]
  19. Moldovan, C.M.; Oniga, O.; Pârvu, A.; Tiperciuc, B.; Verité, P.; Pîrnău, A.; Crişan, O.; Bojiţă, M.; Pop, R. Synthesis and anti-inflammatory evaluation of some new acyl-hydrazones bearing 2-aryl-thiazole. Eur. J. Med. Chem. 2011, 46, 526–534. [Google Scholar] [CrossRef] [PubMed]
  20. Tiperciuc, B.; Zaharia, V.; Colosi, I.; Moldovan, C.; Crişan, O.; Pîrnău, A.; Vlase, L.; Duma, M.; Oniga, O. Synthesis and evaluation of antimicrobial activity of some new hetaryl-azoles derivatives obtained from 2-aryl-4-methylthiazol-5-carbohydrazydes and isonicotinic acid hydrazide. J. Heterocycl. Chem. 2012, 49, 1407–1414. [Google Scholar] [CrossRef]
  21. Tiperciuc, B.; Pârvu, A.; Tamaian, R.; Nastasă, C.; Ionuţ, I.; Oniga, O. New anti-inflammatory thiazolyl-carbonyl-thiosemicarbazides and thiazolyl-azoles with antioxidant properties as potential iNOS inhibitors. Arch. Pharm. Res. 2013, 36, 702–714. [Google Scholar] [CrossRef] [PubMed]
  22. Horváth, C.; Melander, W.; Molnár, I. Solvophobic interactions in liquid chromatography with nonpolar stationary phases. J. Chromatogr. A 1976, 125, 129–156. [Google Scholar] [CrossRef]
  23. Apostolova, N.; Garcia-Bou, R.; Hernandez-Mijares, A.; Herance, R.; Rocha, M.; Victor, V.M. Mitochondrial antioxidants alleviate oxidative and nitrosative stress in a cellular model of sepsis. Pharm. Res. 2011, 28, 2910–2919. [Google Scholar] [CrossRef] [PubMed]
  24. Asadollahi, K.; Beeching, N.J.; Gill, G.V. Leukocytosis as a predictor for non-infective mortality and morbidity. QJM 2010, 103, 285–292. [Google Scholar] [CrossRef] [PubMed]
  25. Vastag, G.; Apostolov, S.; Perišić-Janjić, N.; Matijević, B. Multivariate analysis of chromatographic retention data and lipophilicity of phenylacetamide derivatives. Anal. Chim. Acta 2013, 767, 44–49. [Google Scholar] [CrossRef] [PubMed]
  26. De Faria, C.M.Q.G.; Nazaré, A.C.; Petrônio, M.S.; Paracatu, L.C.; Zeraik, M.L.; Regasini, L.O.; Silva, D.H.S.; da Fonseca, L.M.; Ximenes, V.F. Protocatechuic acid alkyl esters: Hydrophobicity as a determinant factor for inhibition of NADPH oxidase. Curr. Med. Chem. 2012, 19, 4885–4893. [Google Scholar] [CrossRef] [PubMed]
  27. Viswanadhan, V.N.; Ghose, A.K.; Revankar, G.R.; Robins, R.K. Atomic physicochemical parameters for three dimensional structure directed quantitative structure-activity relationships. 4. Additional parameters for hydrophobic and dispersive interactions and their application for an automated superposition of certain naturally occurring nucleoside antibiotics. J. Chem. Inf. Model. 1989, 29, 163–172. [Google Scholar]
  28. Klopman, G.; Li, J.-Y.; Wang, S.; Dimayuga, M. Computer automated log P calculations based on an extended group contribution approach. J. Chem. Inf. Model. 1994, 34, 752–781. [Google Scholar] [CrossRef]
  • Sample Availability: Samples of the compounds Th-122 are available from the authors.

