First Order Temperature Dependent Phase Transition in a Monoclinic Polymorph Crystal of 1,6-Hexanedioic Acid: An Interpretation Based on the Landau Theory Approach

Abstract
:1. Introduction

2. Results and Discussion

| Crystal Properties | 297(2) K (RTP) | 120.0(1) K (LTP) |
|---|---|---|
| CCDC deposition numbers | 989931 | 989973 |
| Formula | C6H10O4 | C6H10O4 |
| Formula Weight | 146.14 | 146.14 |
| Color; Shape | Colorless; Block | Colorless; Block |
| Crystal System | Monoclinic | Monoclinic |
| Space Group | P21/c | P21/c |
| Z | 2 | 6 |
| Lattice Constants | a =7.3647(3)Å | a = 7.3865(6)Å |
| b = 5.1503(3)Å | b = 14.9130(13)Å | |
| c = 10.1332(5)Å | c = 10.0475(9)Å | |
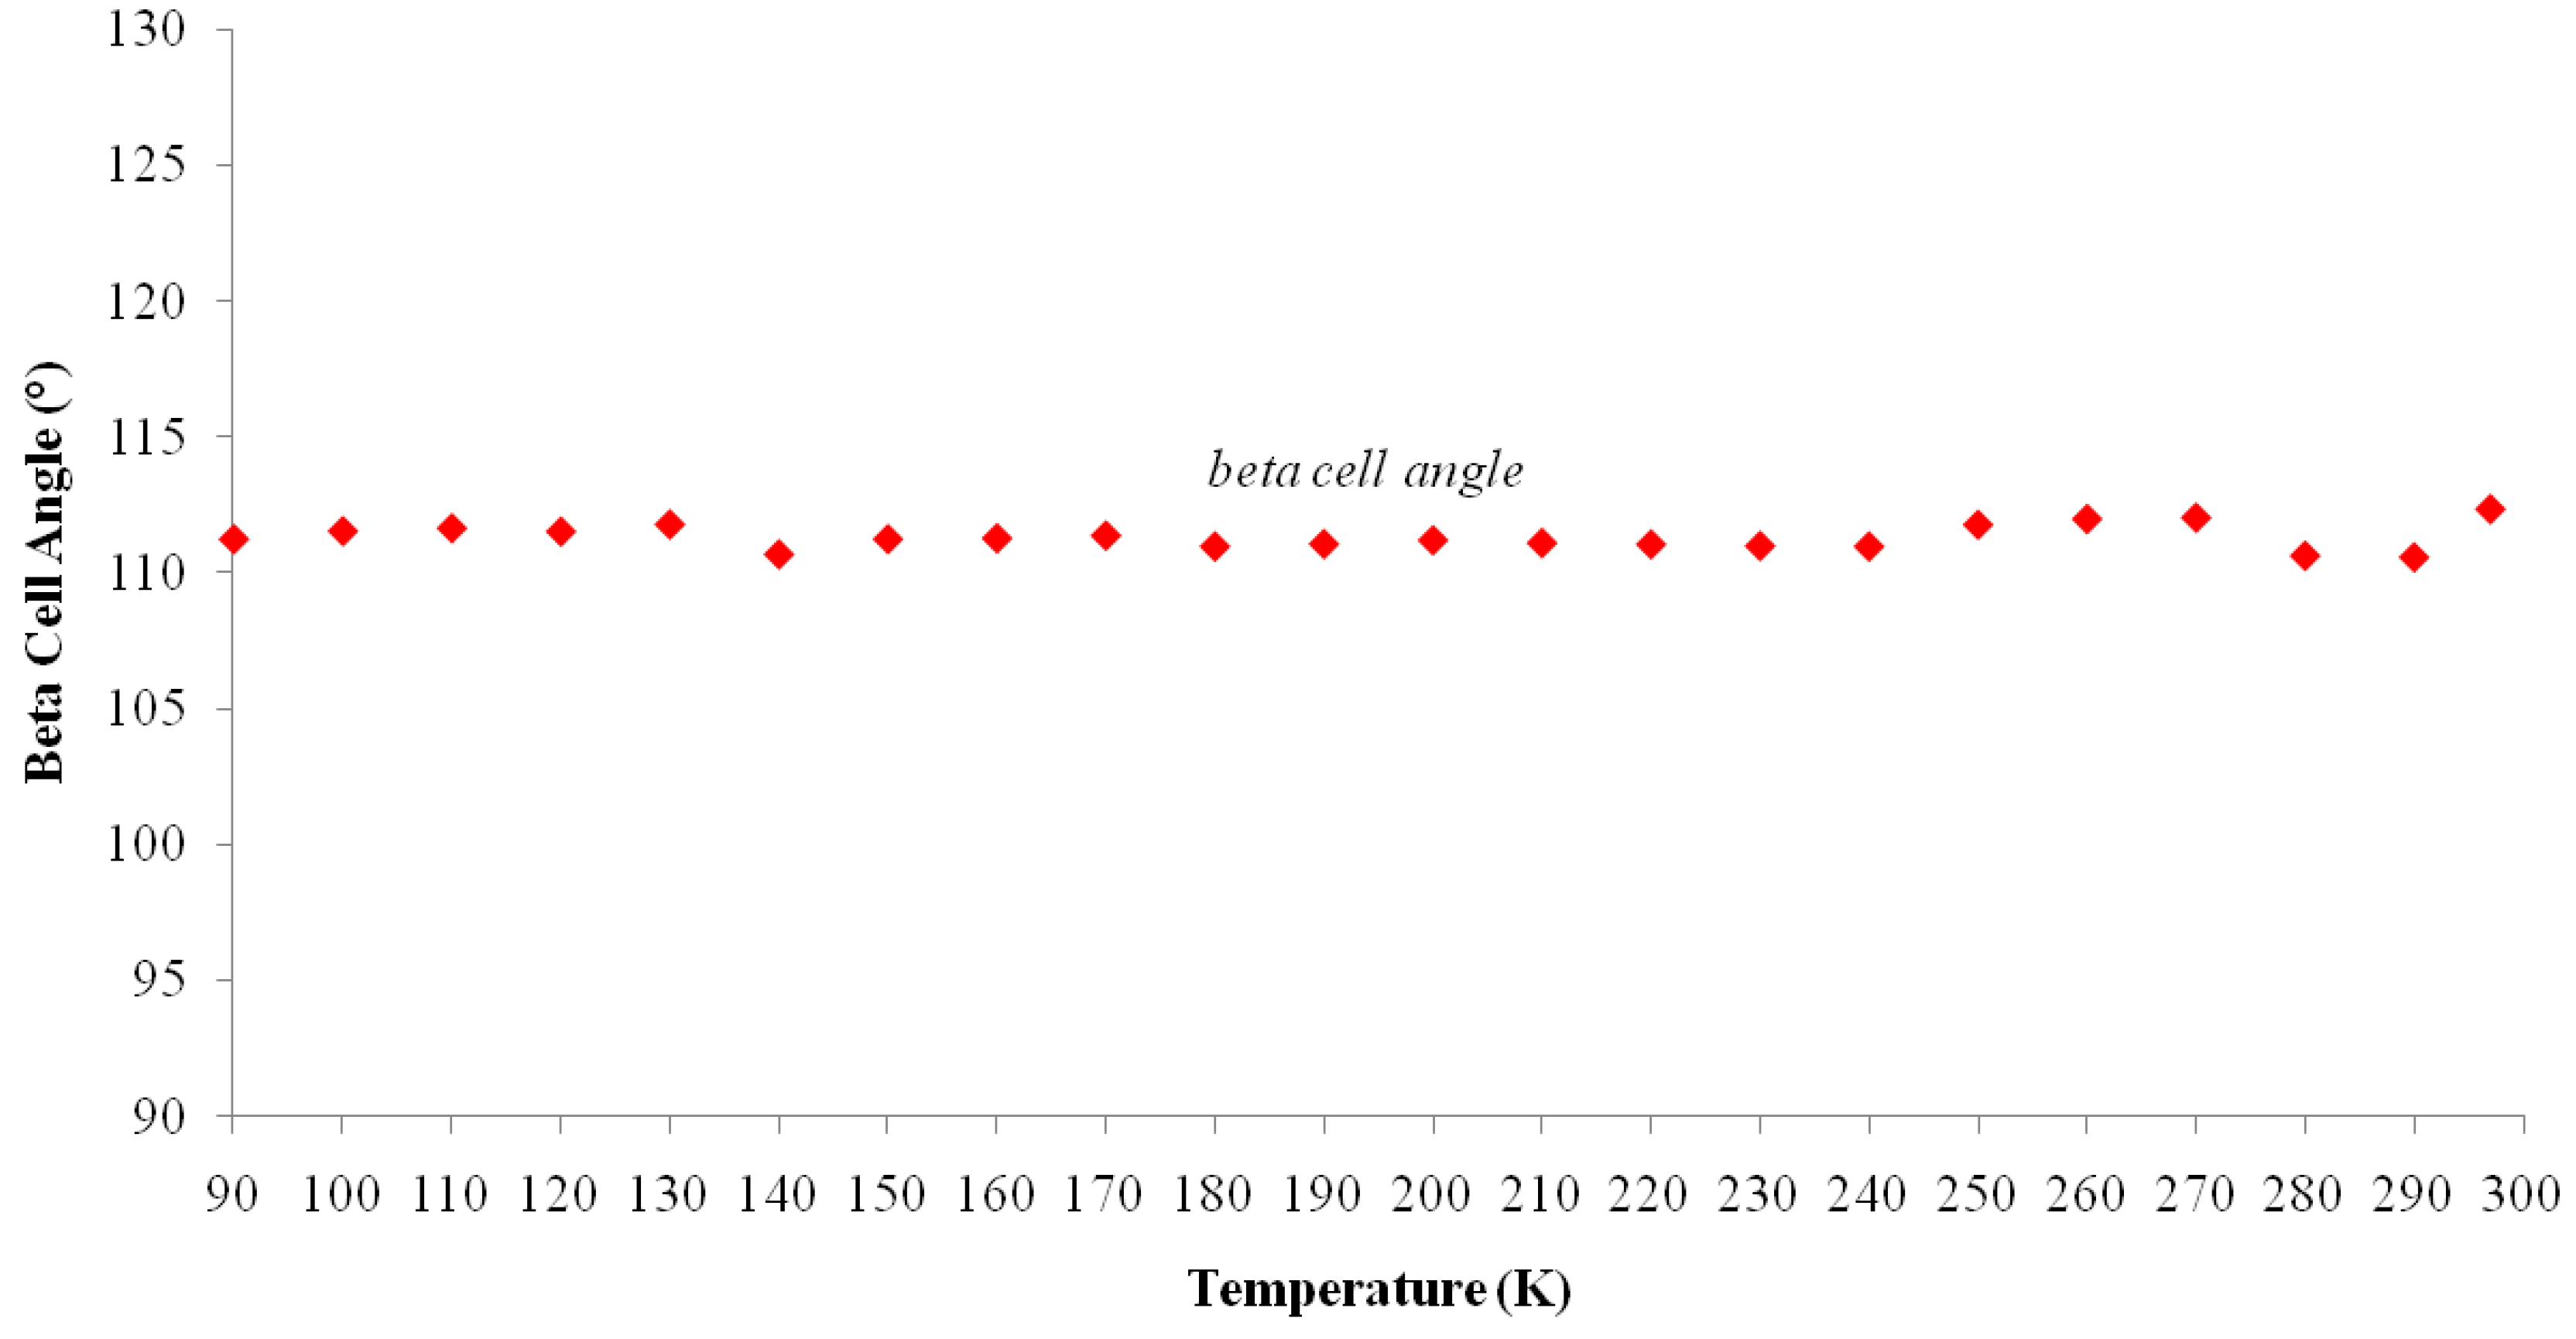
| β = 112.274(3)° | β = 111.656(6)° | |
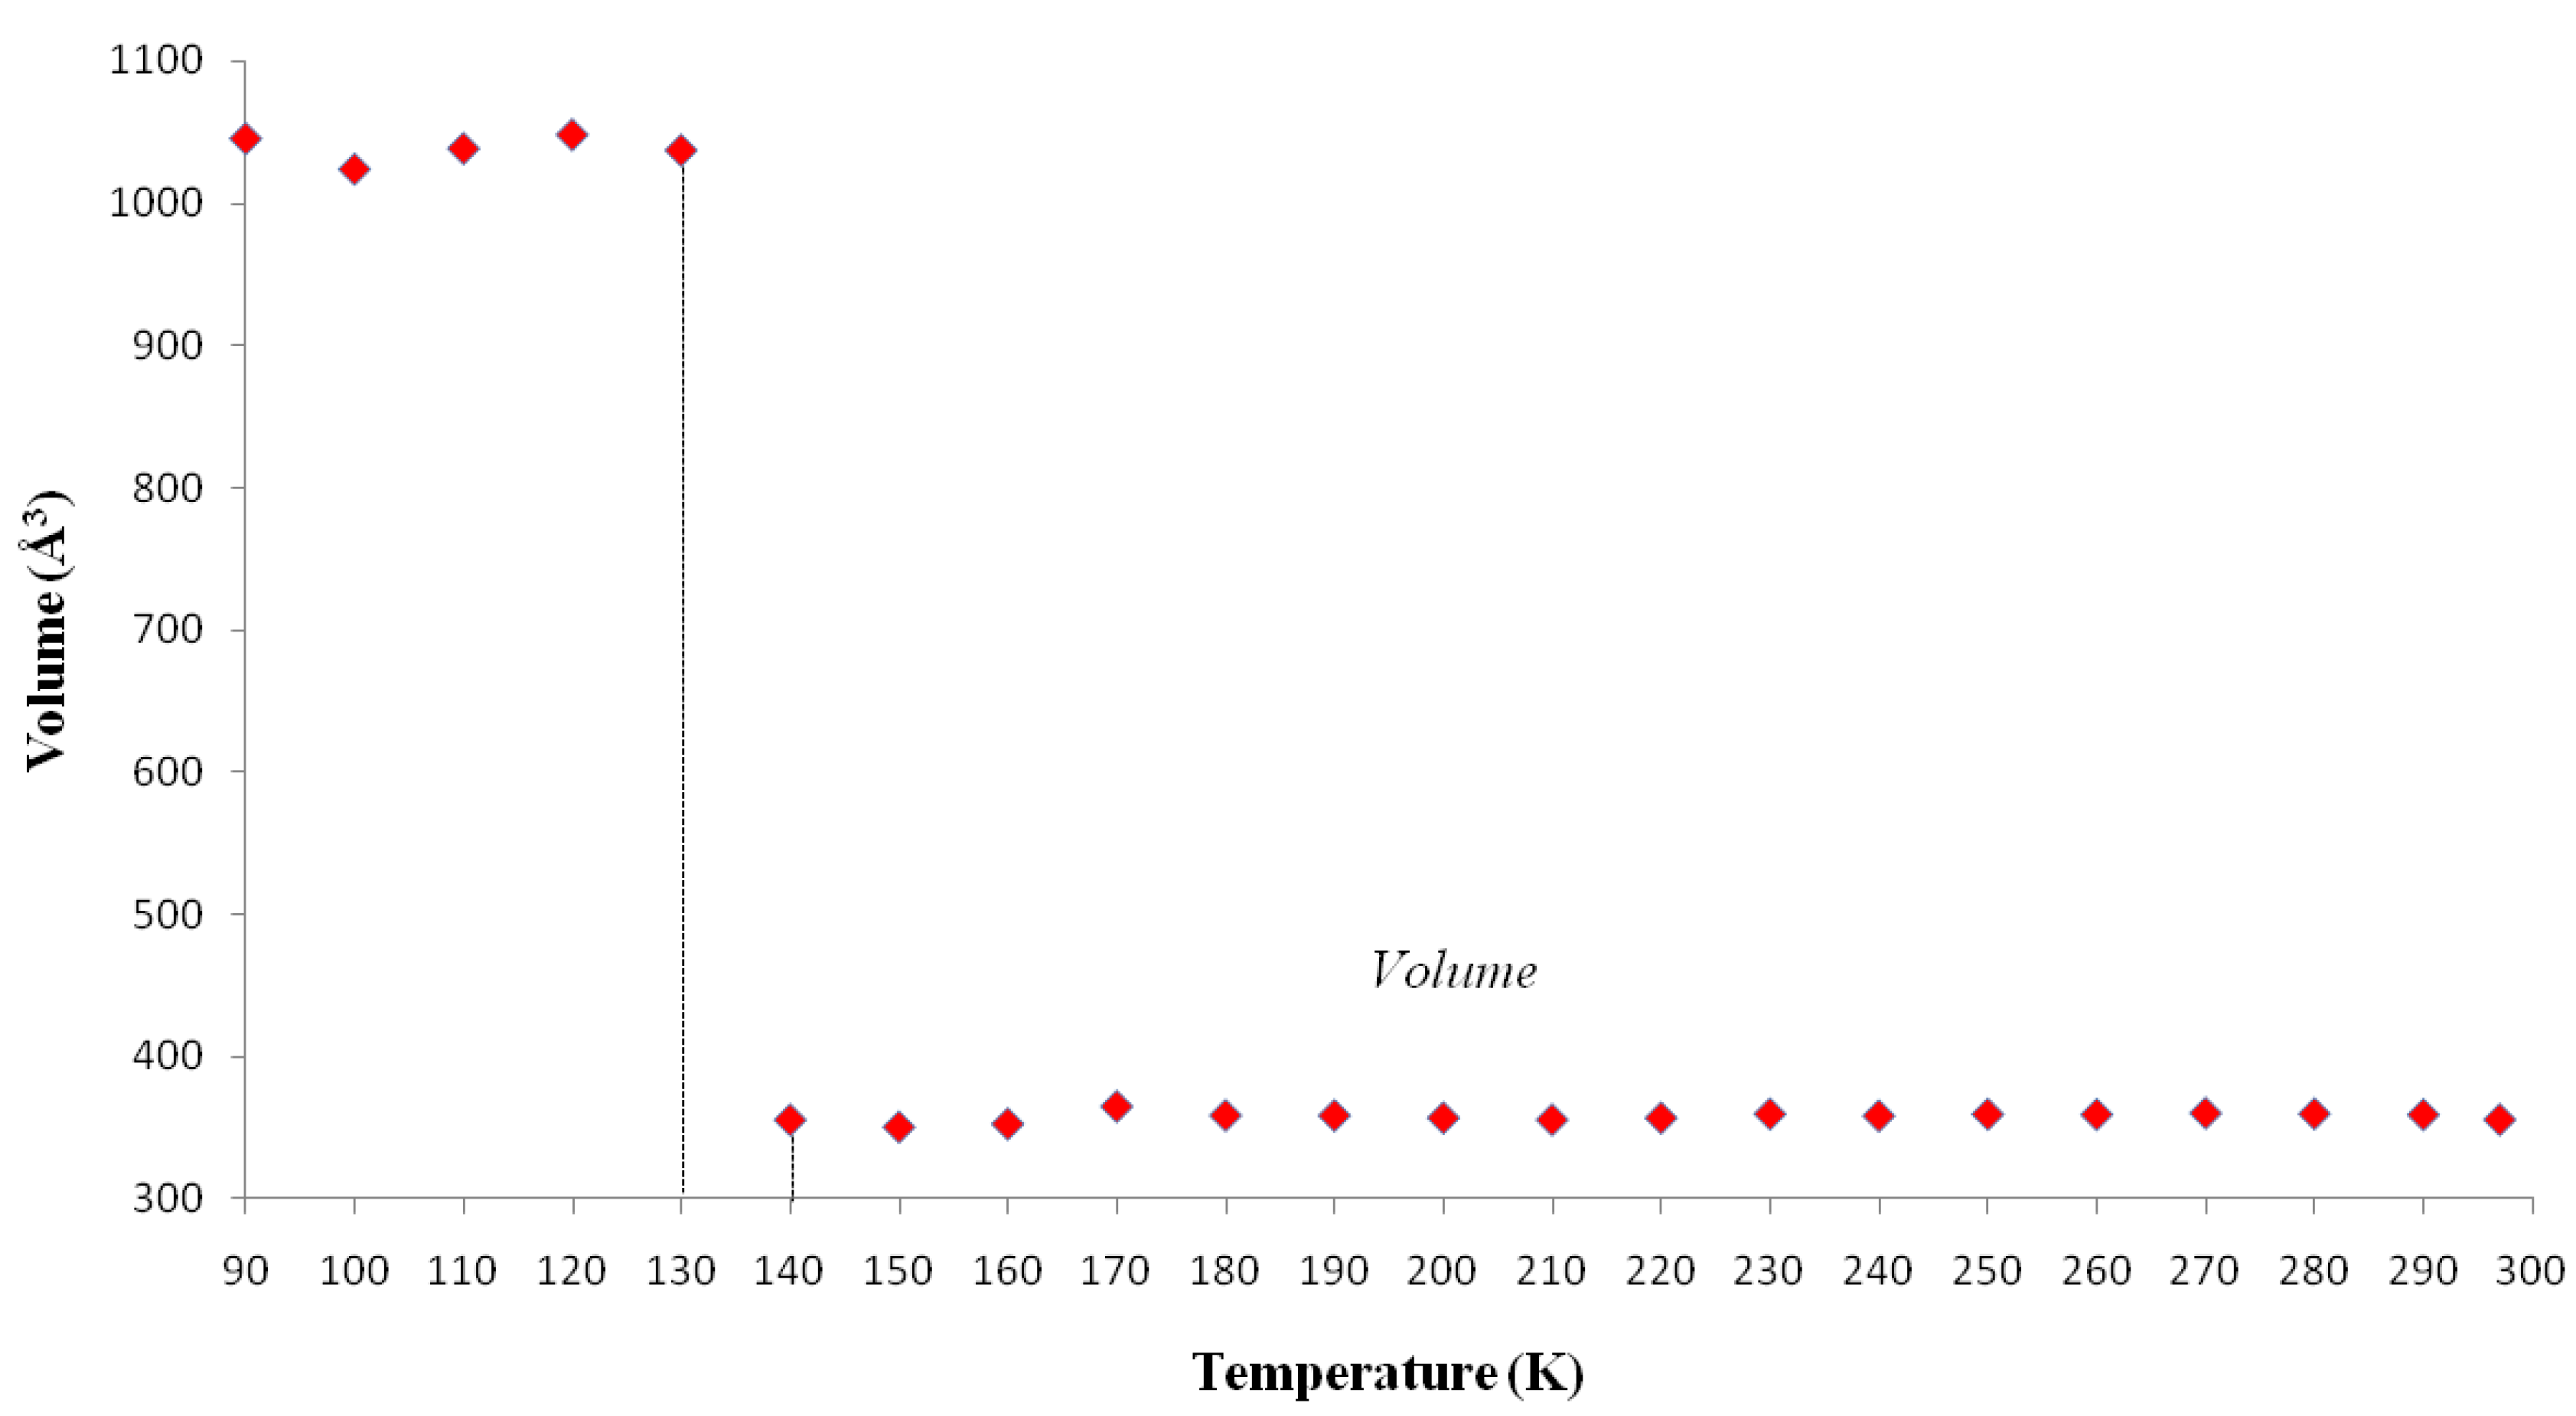
| Volume [Å3] | 355.42(3) | 1028.66(15) |
| Dx [Mg·m−3] | 1.366 | 1.415 |
| μ [mm−1] | 0.115 | 0.120 |
| F(000) | 156 | 468 |
| θ range [°] | 2.99–32.50 | 2.57–27.50 |
| h, k, l | −10/11, −7/7, −14/15 | −9/9, −19/7, −13/13 |
| Reflections Collected | 5118 | 10307 |
| Reflections Unique | 1279 | 2346 |
| Tmin/Tmax | 0.9661/0.9394 | 0.9373/0.9649 |
| R(int) | 0.0270 | 0.0523 |
| Number of Parameters | 67 | 136 |
| GoF | 1.052 | 1.180 |
| Final R index[I > 2σ(I)] | 0.0453 | 0.0949 |
| Monoclinic at 297(2) K | Monoclinic at 120.0(1) K | ||
|---|---|---|---|
| Bonds | |||
| O1-C1 | 1.2242(11) | O1A-C1A | 1.219(5) |
| O2-C1 | 1.2989(11) | O2A-C1A | 1.308(5) |
| O2-H1O | 0.98(2) | O2A-H1OA | 0.82 |
| C1-C2 | 1.4931(11) | C1A-C2A | 1.523(6) |
| C2-C3 | 1.5091(13) | C2A-C3A | 1.499(6) |
| C3-C3 i | 1.5135(15) | C3A-C3 ii | 1.546(8) |
| O1B-C1B | 1.220(5) | ||
| O2B-C1B | 1.316(5) | ||
| O2B-H1OB | 0.82 | ||
| C1B-C2B | 1.505(5) | ||
| C2B-C3B | 1.514(5) | ||
| C3B-C4B | 1.514(5) | ||
| Angles | |||
| O1-C1-O2 | 122.79(8) | O1A-C1A-O2A | 123.9(4) |
| O1-C1-C2 | 122.93(8) | O1A-C1A-C2A | 123.5(4) |
| O2-C1-C2 | 114.28(8) | O2A-C1A-C2A | 112.6(3) |
| C1-C2-C3 | 114.80(8) | C1A-C2A-C3A | 113.4(3) |
| O1B-C1B-O2B | 123.1(3) | ||
| O1B-C1B-C2B | 123.7(3) | ||
| O2B-C1B-C2B | 113.3(3) | ||
| C1B-C2B-C3B | 114.7(3) | ||
| Torsion angles | |||
| O1-C1-C2-C3 | −7.40(15) | O1A-C1A-C2A-C3A | −2.6(6) |
| O2-C1-C2-C3 | 172.92(9) | O2A-C1A-C2A-C3A | 177.2(3) |
| C1-C2-C3-C3 i | −174.46(9) | C1A-C2A-C3A-C3A ii | 177.6(4) |
| O1B-C1B-C2B-C3B | 9.6(6) | ||
| O2B-C1B-C2B-C3B | −170.1(3) | ||
| C1B-C2B-C3B-C4B | 172.8(3) | ||
| Phase | Plane | Plane | Interplanar angle (°) |
|---|---|---|---|
| RTP | O1/O2/C1/C2 | C2/C3/C2A/C3A | 6.95(9) |
| at 297(2) K | |||
| LTP | O1A/O2A/C1A/C2A | C2A/C3A/C2AA/C3AA | 4.2(4) |
| at 120.0(1) K | O1B/O2B/C1B/C2B | C2B/C3B/C4B/C5B | 8.1(4) |
| O3B/O4B/C5B/C6B | C2B/C3B/C4B/C5B | 9.3(4) |
| Crystals | D-H···A | D-H (Å) | H···A (Å) | D···A (Å) | D-H···A (°) |
|---|---|---|---|---|---|
| RTP | O2-H1O···O1 iii | 0.985(19) | 1.673(19) | 2.6508(11) | 171.3(18) |
| at 297(2) K | |||||
| LTP | O2A-H1OA···O1A iv | 0.82 | 1.85 | 2.668(4) | 176 |
| at 120.0(1) K | O2B-H1OB···O3B v | 0.82 | 1.83 | 2.648(4) | 175 |
| O4B-H2BA···O1B vi | 0.82 | 1.84 | 2.658(4) | 175 |
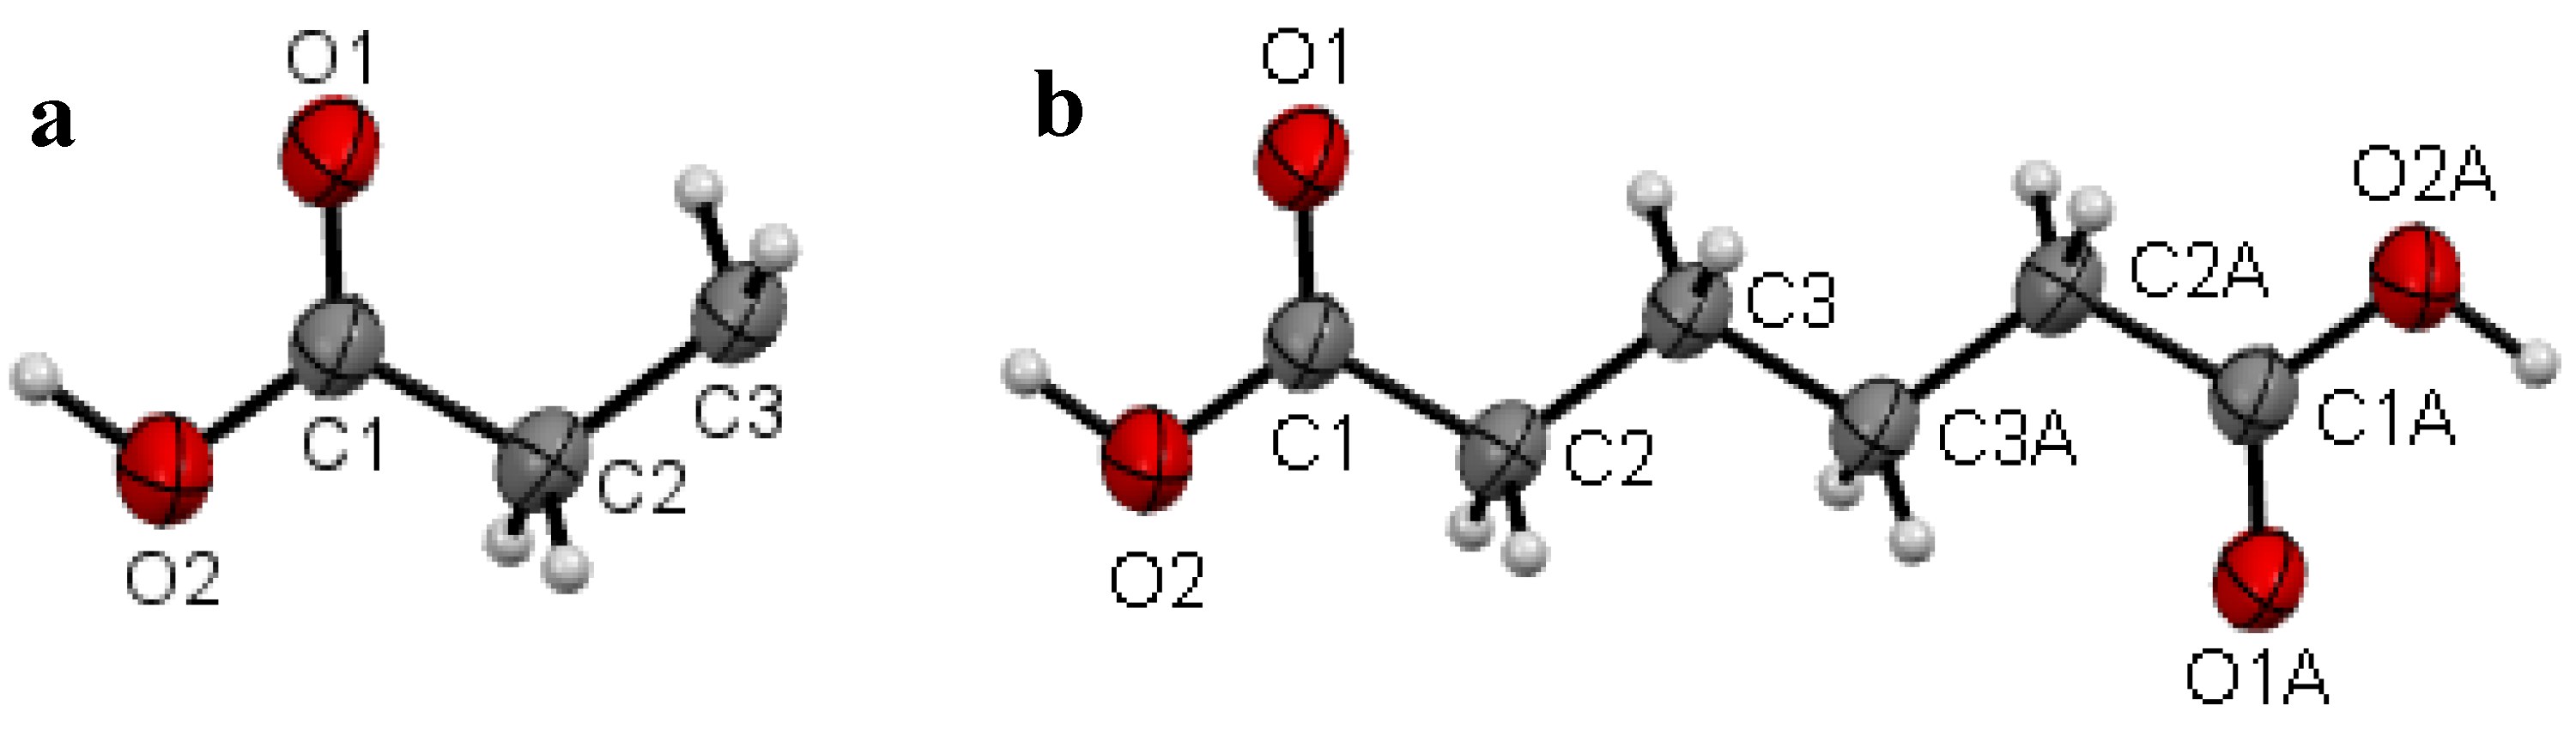
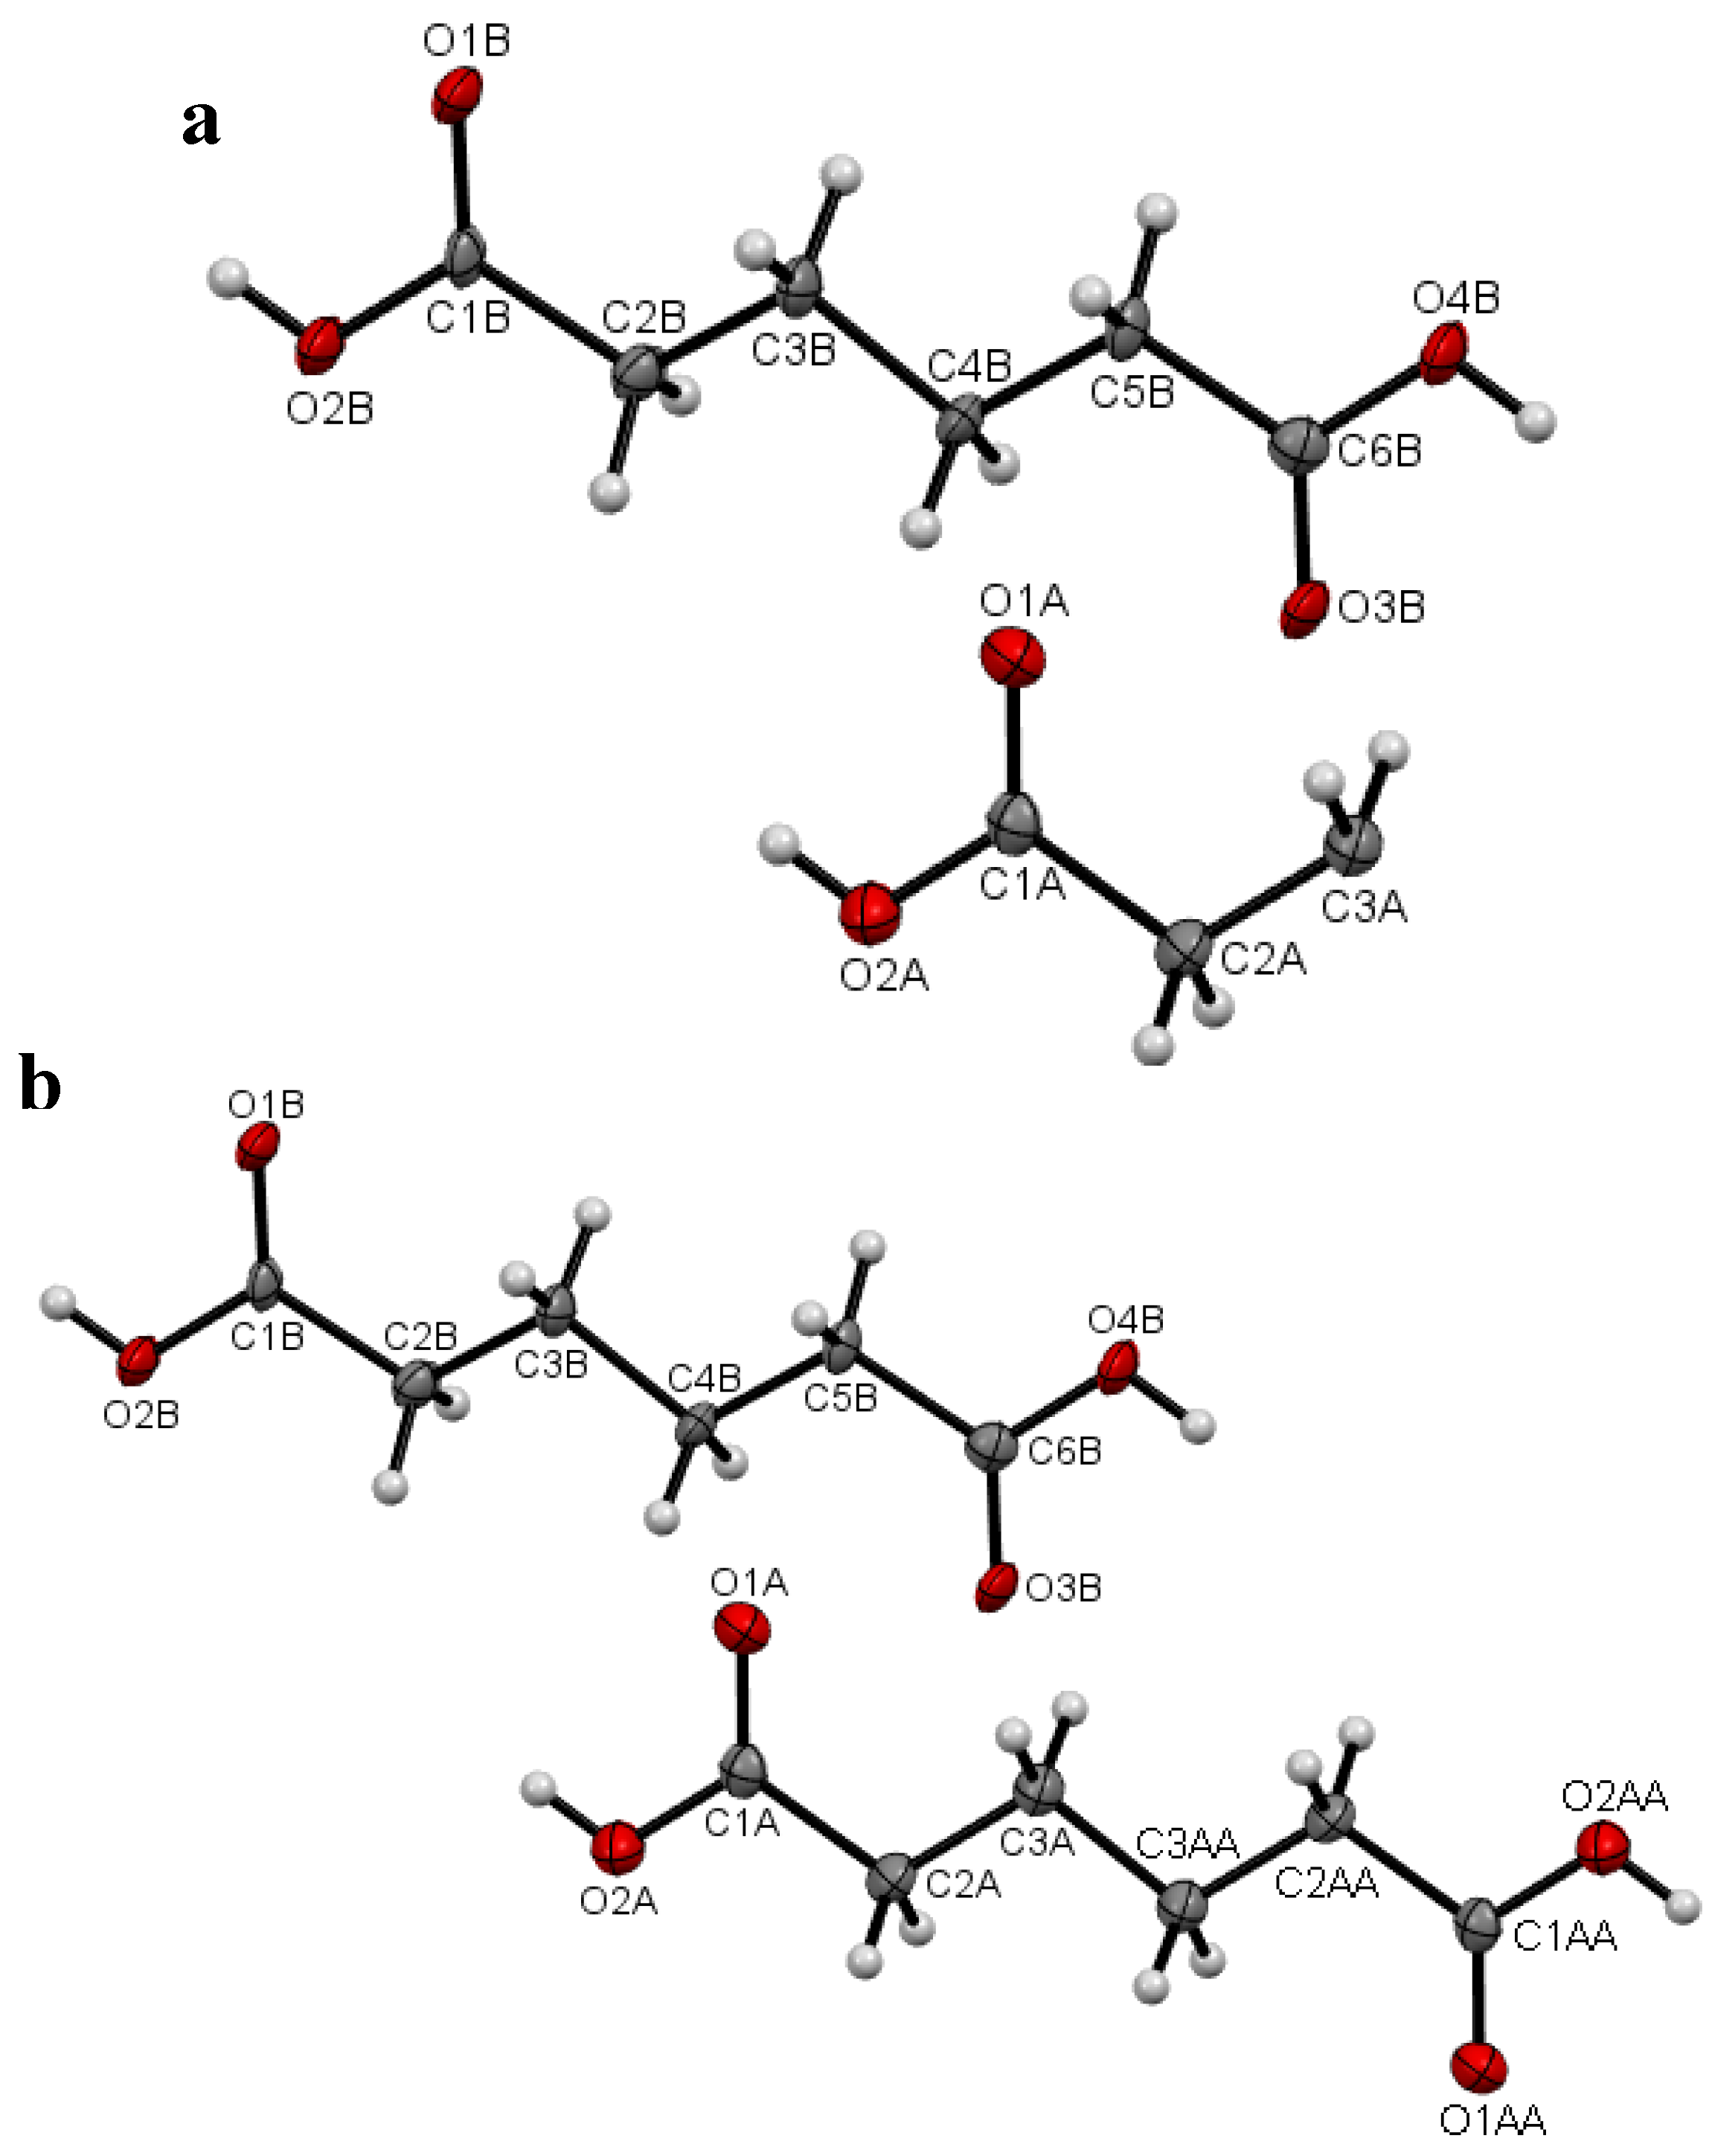
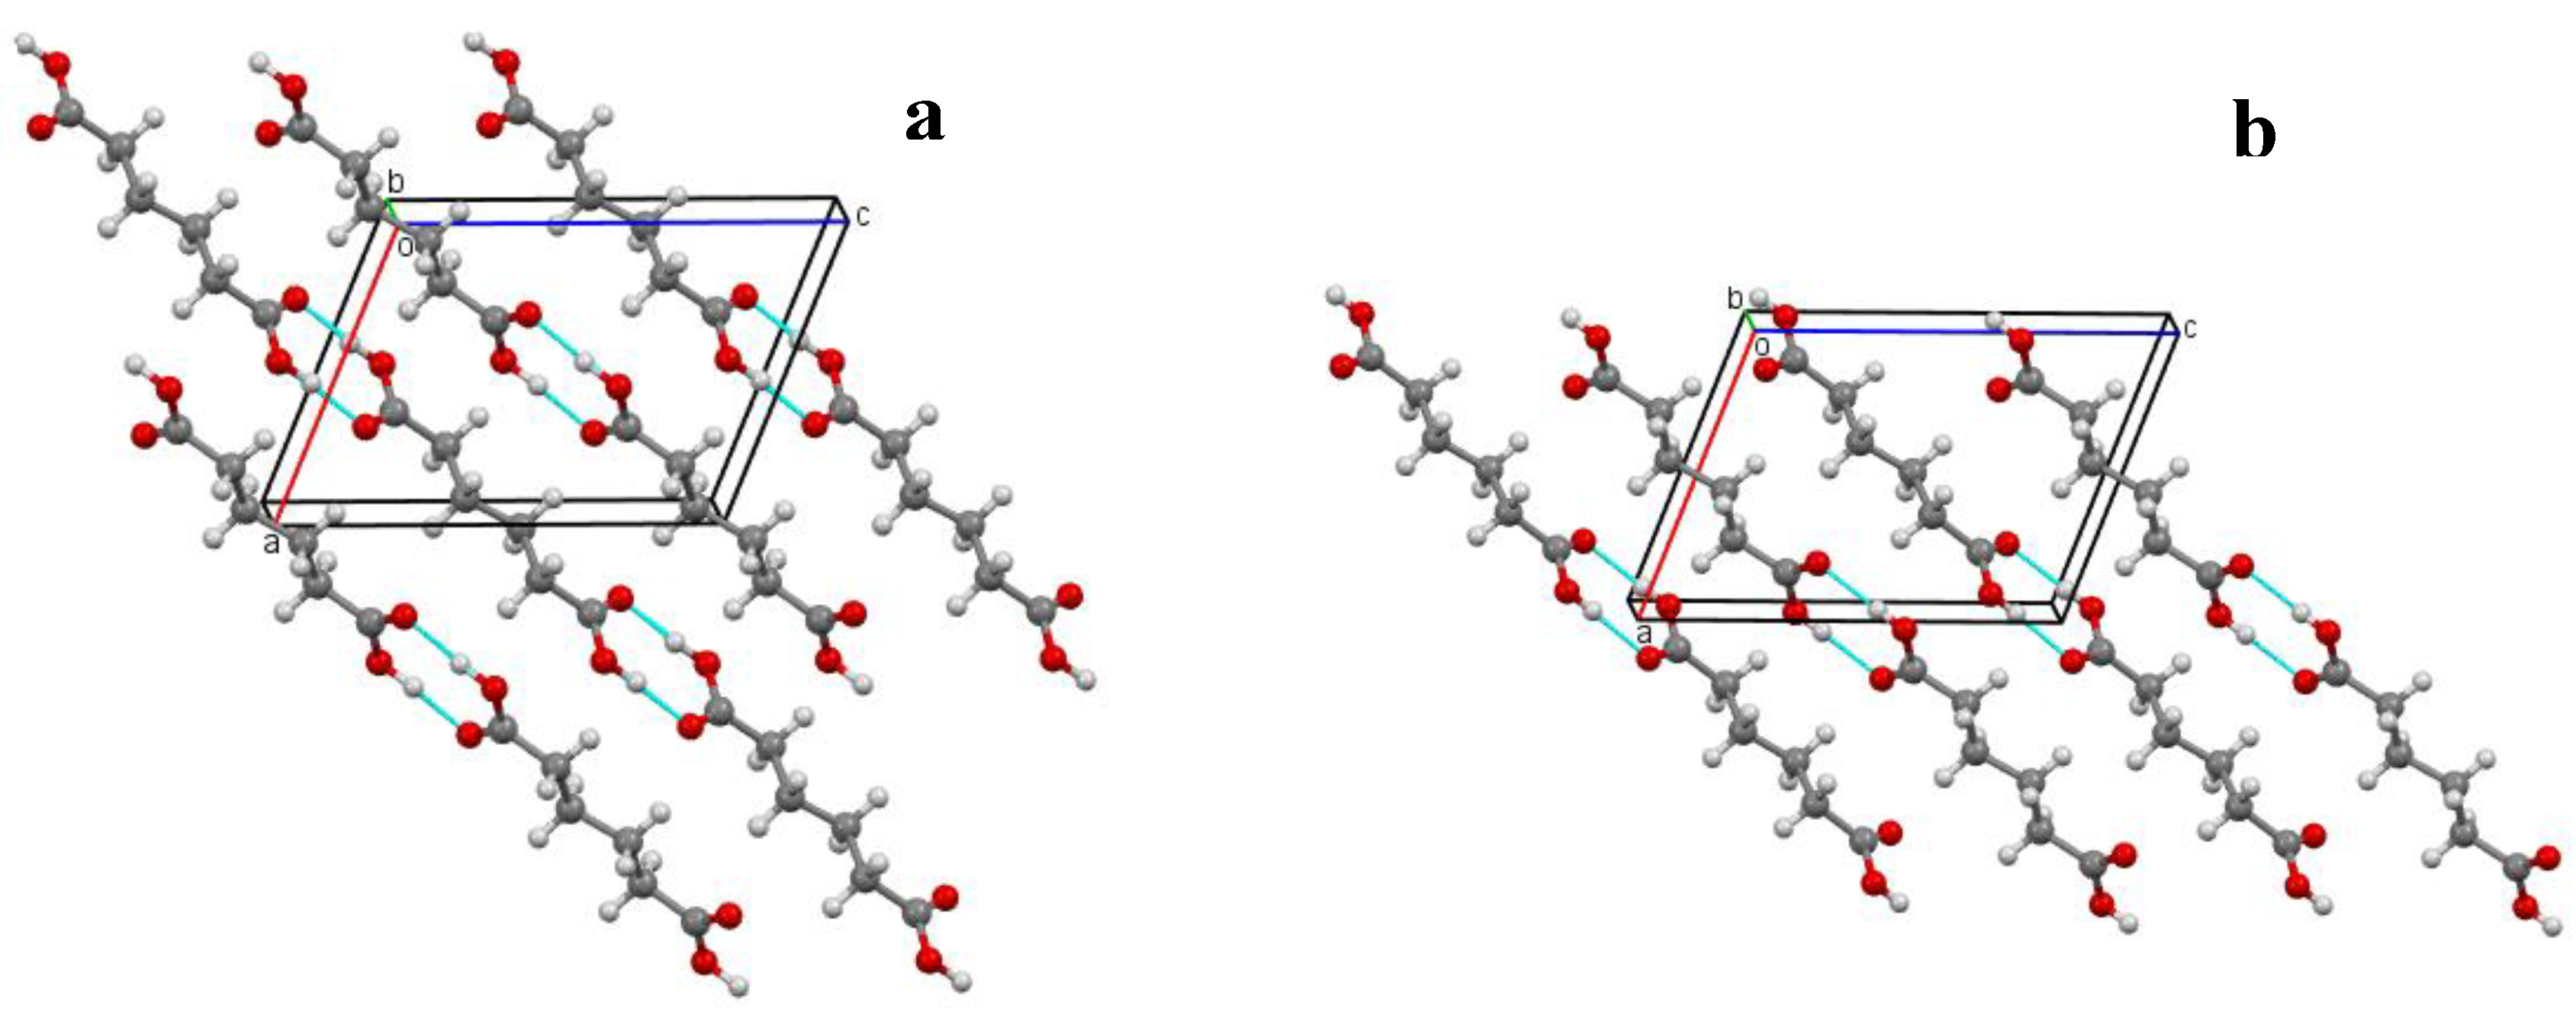
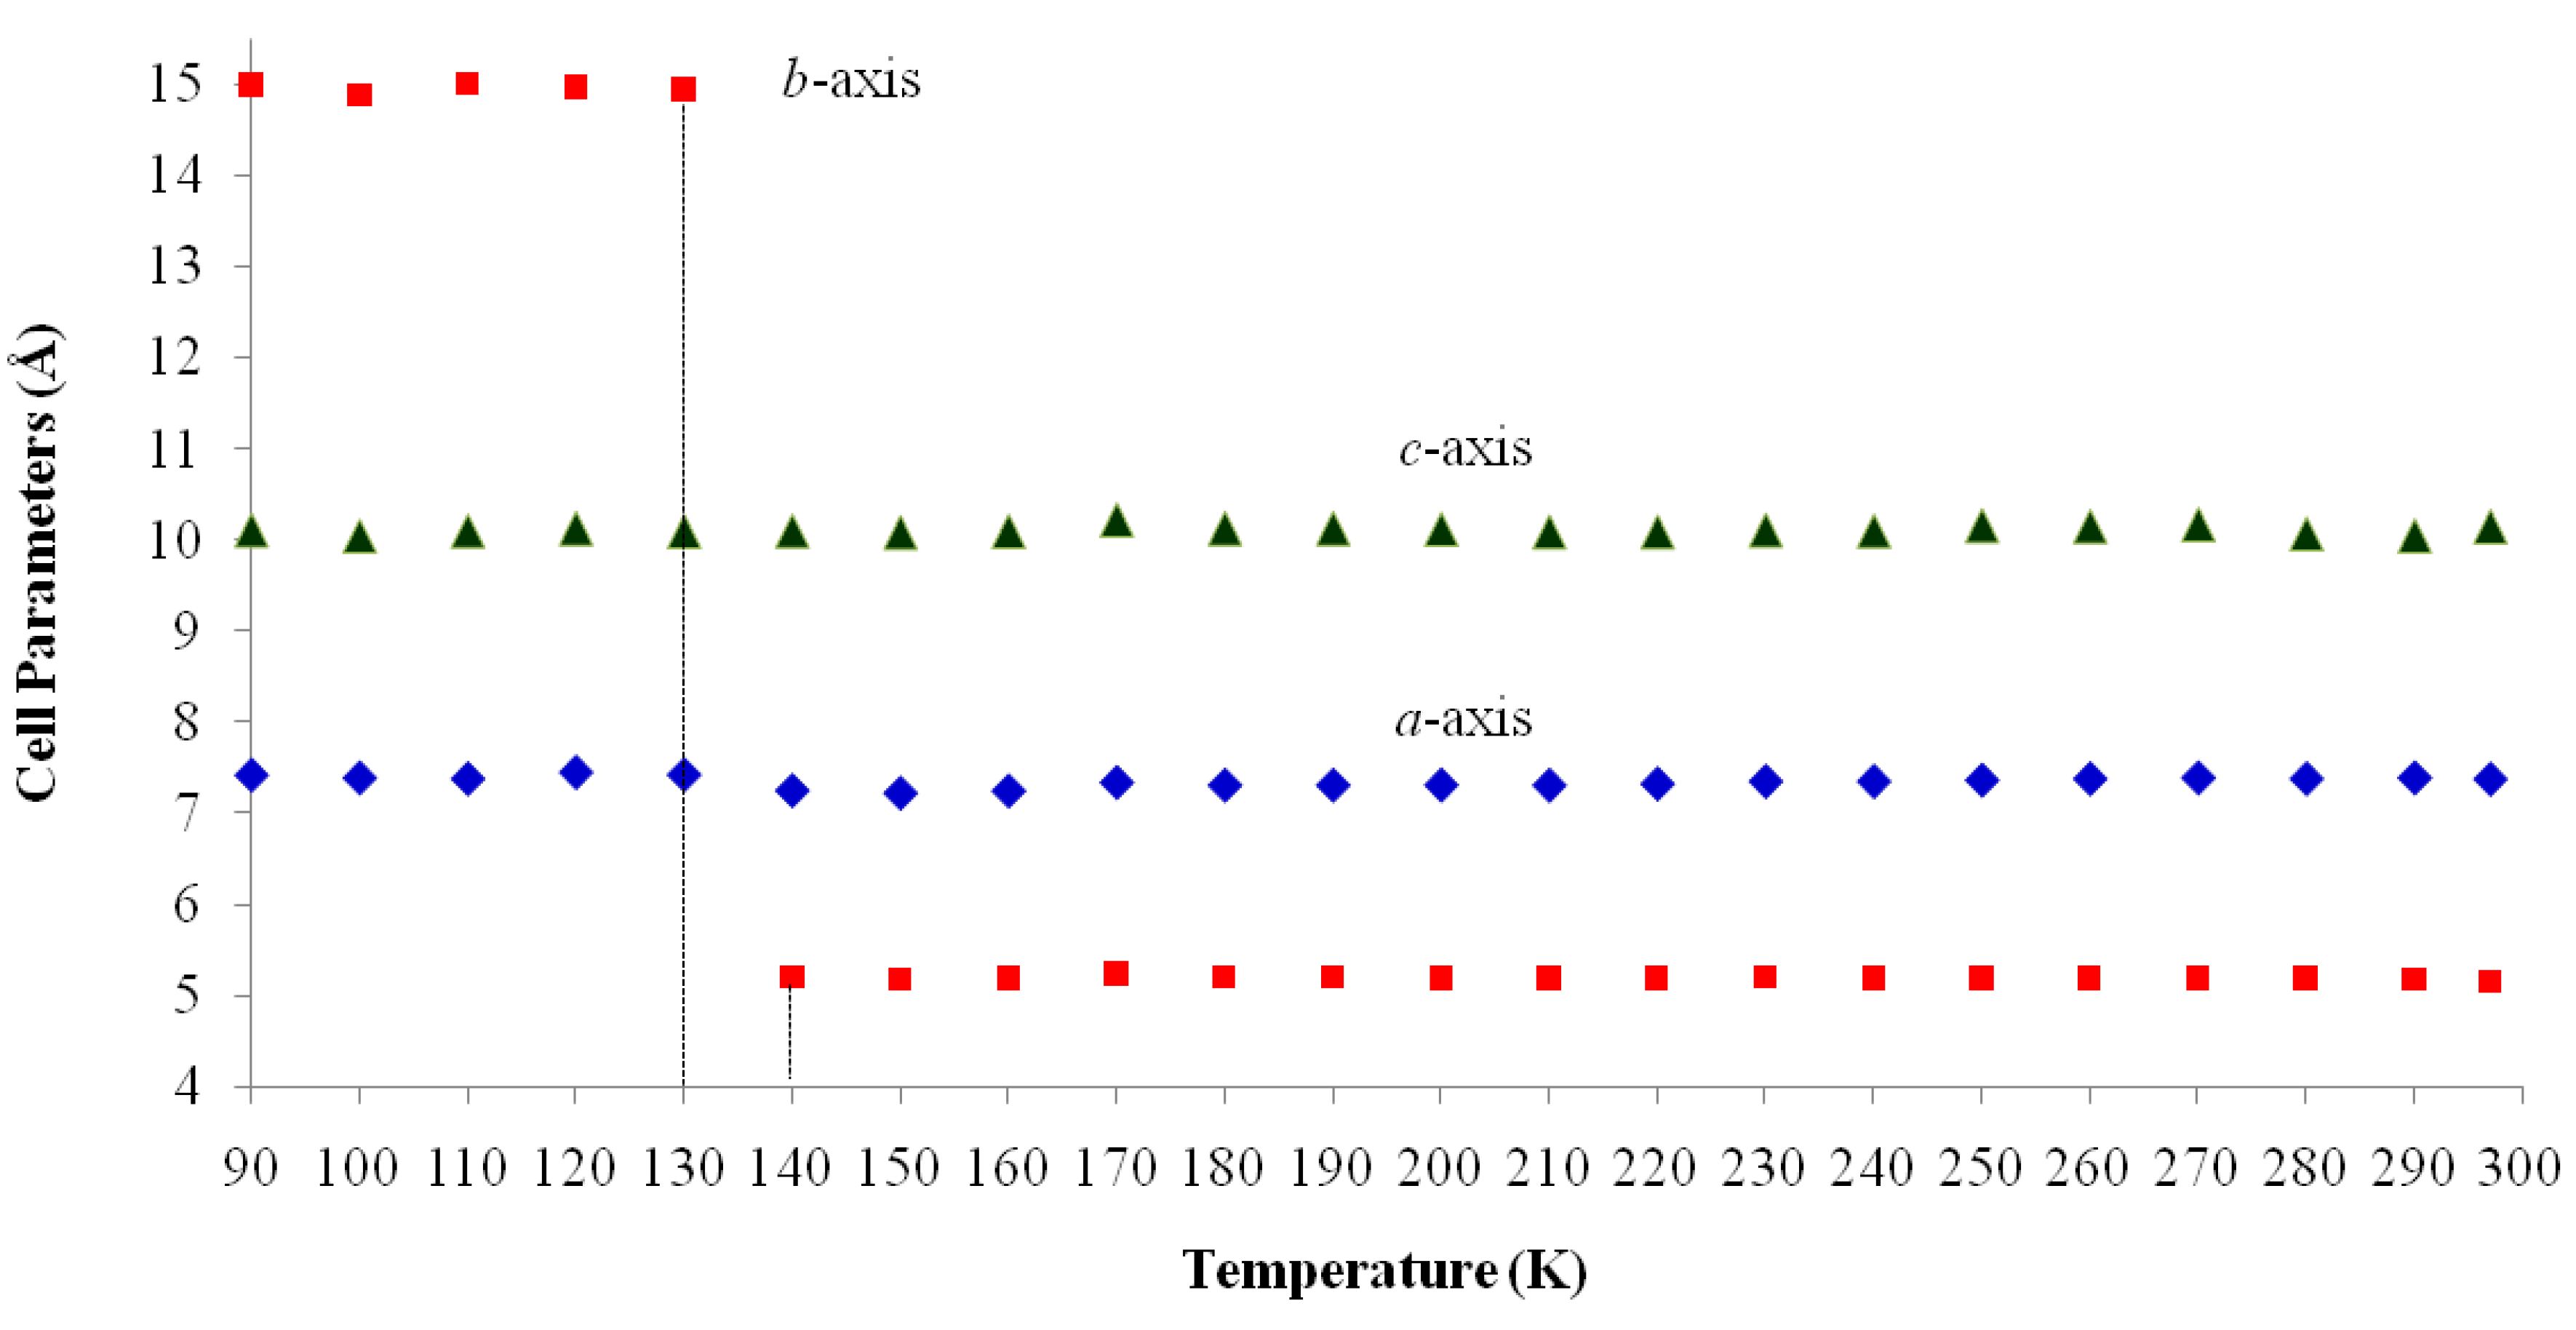
2.1. Crystal Structure


| Temp (K) | a (Å) | b (Å) | c (Å) | β (°) | Volume (Å3) |
|---|---|---|---|---|---|
| 297 | 7.3660(4) | 5.1539(3) | 10.1383(5) | 112.333(4) | 356.0(2) |
| 290 | 7.38(3) | 5.182(18) | 10.04(4) | 110.56(7) | 359.5(1) |
| 280 | 7.37(3) | 5.19(2) | 10.06(5) | 110.62(9) | 360.2(1) |
| 270 | 7.38(2) | 5.193(16) | 10.16(3) | 112.02(9) | 360.6(1) |
| 260 | 7.37(2) | 5.191(13) | 10.14(3) | 111.97(8) | 359.6(9) |
| 250 | 7.355(17) | 5.191(11) | 10.15(2) | 111.76(7) | 359.8(9) |
| 240 | 7.342(15) | 5.188(10) | 10.09(2) | 110.96(5) | 358.7(9) |
| 230 | 7.342(13) | 5.198(9) | 10.10(2) | 110.98(4) | 360.0(8) |
| 220 | 7.315(14) | 5.188(9) | 10.08(2) | 111.04(5) | 357.2(8) |
| 210 | 7.299(13) | 5.185(9) | 10.08(2) | 111.09(4) | 355.9(8) |
| 200 | 7.302(16) | 5.194(11) | 10.11(2) | 111.19(7) | 357.3(8) |
| 190 | 7.30(2) | 5.202(14) | 10.12(3) | 111.05(11) | 358.9(7) |
| 180 | 7.30(2) | 5.206(15) | 10.12(3) | 110.96(10) | 359.0(8) |
| 170 | 7.33(3) | 5.24(2) | 10.21(5) | 111.36(11) | 365.3(7) |
| 160 | 7.239(8) | 5.187(5) | 10.088(14) | 111.26(3) | 353.0(6) |
| 150 | 7.215(7) | 5.179(5) | 10.074(14) | 111.23(3) | 350.8(6) |
| 140 | 7.243(16) | 5.206(11) | 10.09(2) | 110.67(10) | 355.8(6) |
| 130 | 7.414(5) | 14.942(11) | 10.087(9) | 111.77(3) | 1037.8(3) |
| 120 | 7.44(2) | 14.97(4) | 10.12(3) | 111.51(5) | 1048.7(7) |
| 110 | 7.37(4) | 15.01(9) | 10.09(6) | 111.63(15) | 1039.0(8) |
| 100 | 7.3791(3) | 14.8734(7) | 10.0347(5) | 111.525(2) | 1024.52(7) |
| 90 | 7.41(3) | 14.99(7) | 10.10(5) | 111.23(9) | 1046.0(7) |


2.2. Landau Phenomenological Theory of First Order Structural Phase Transitions in I

 . We can then rewrite ek in term of Q as:

 .
.
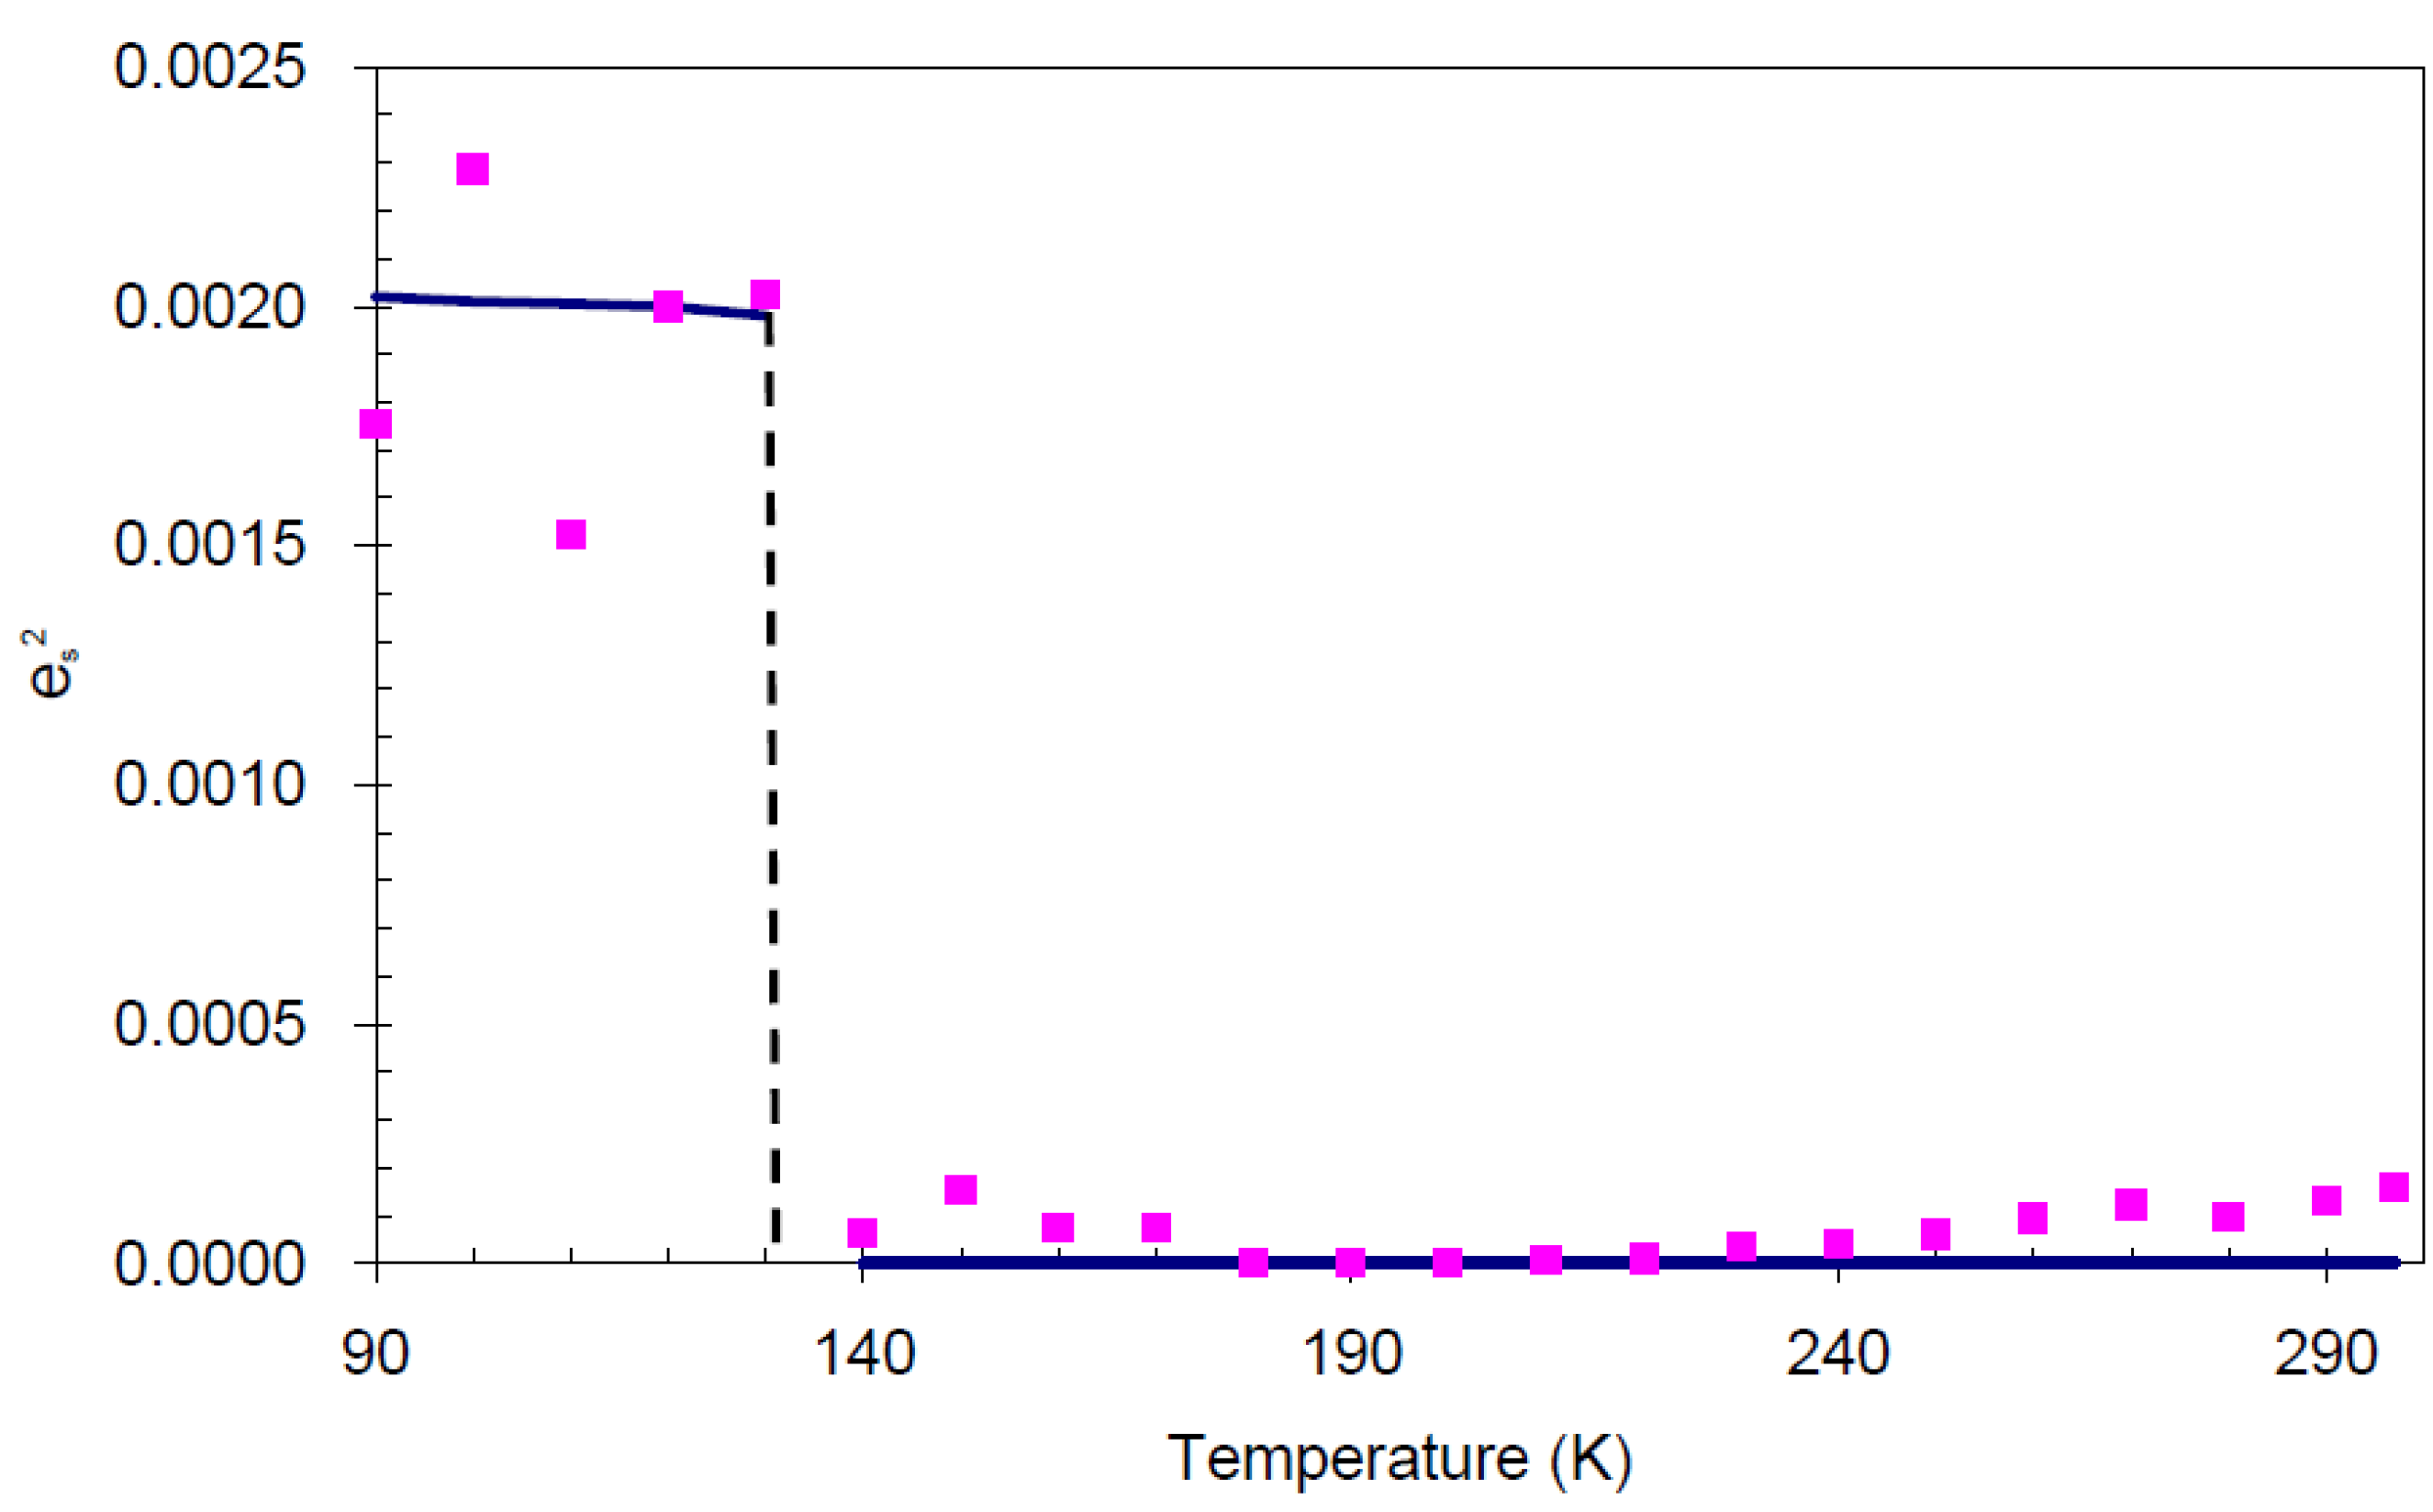
 ), are the values of the spontaneous order parameter (denoted as Q'). Q' varies non-linearly with temperature T with a discontinuity at is an indication of first order phase transition.
 ,
,  , e4 = 0,
  and e6 = 0 , are formulated according to Schlenker et al. [16]. The values for a0, b0, c0 are the average values of the HTP a-unit cell, b-unit cell and c-unit cell length respectively. β0 is the average value of HTP, and as variation of β from LTP to HTP is very small, thus it is considered in the calculation that β ≈ β0. The scalar spontaneous strain es, according to that proposed by Aizu [17] is:

 . Since from the data β ≈ β0, e3 and e5 ≈ 0, thus
  .
. and order parameter Q2 [12]. (square of spontaneous strain). The line indicates the trend of the data, and the values are calculated from raw data.
(square of spontaneous strain). The line indicates the trend of the data, and the values are calculated from raw data.
and order parameter Q2 [12]. (square of spontaneous strain). The line indicates the trend of the data, and the values are calculated from raw data.
(square of spontaneous strain). The line indicates the trend of the data, and the values are calculated from raw data.
3. Experimental Section
General Information
4. Conclusions
Acknowledgments
Author Contributions
Conflicts of Interest
References
- Hashimoto, M.; Harada, M.; Mizuno, M.; Hamada, M.; Ida, T.; Suhara, M. Phase transitions, hydrogen bond and crystal dynamics of p-methylbenzyl alcohol as studied by single crystal X-ray diffraction and H-NMR. Z. Naturforsch. 2002, 57a, 381–387. [Google Scholar]
- Choudhury, R.R.; Chitra, R.; Sastry, P.U.; Das, A.; Ramanadham, M. Phase transition in triglycine family of hydrogen bonded ferroelectrics: An interpretation based on structural studies. Pramana 2004, 63, 107–115. [Google Scholar] [CrossRef]
- Katrusiak, A. Conformational transformation coupled with the order-disorder phase transition in 2-methyl-1,3-cyclohexanedione crystals. Acta Crystallogr. B 2000, 56, 872–881. [Google Scholar] [CrossRef]
- Usman, A.; Chantrapromma, S.; Fun, H.K. The 143 and 300 K polymorphs of hexamethylenetetraminium 2,4-dinitrophenolate monohydrate. Acta Crystallogr. C 2001, 57, 1443–1446. [Google Scholar] [CrossRef]
- Fun, H.K.; Usman, A.; Chantrapromma, S.; Osman, J.; Ong, L.H.; Tilley, D.R.; Ishibashi, Y. Phase transitions in hydrogen-bonded phenol-amine adducts: Analysis by ferroelastic theory. Solid State Commun. 2003, 127, 677–682. [Google Scholar] [CrossRef]
- How, P.T.; Lee, B.S.; Fun, H.K.; Razak, I.A.; Chantrapromma, S. Microscopic theory of phase transitions in hydrogen-bonded phenol-amine adducts. Phys. Rev. B 2005, 71, 174109. [Google Scholar]
- Chantrapromma, S.; Fun, H.K.; Usman, A. Orthorhombic-to-monoclinic temperature-dependent phase transition of hexamethylenetetraminium-3,5-dinitrobenzoate-3,5-dinitrobenzoic acid monohydrate crystal. J. Mol. Struct. 2006, 789, 30–36. [Google Scholar] [CrossRef]
- Fun, H.K.; Rosli, M.M.; Lee, B.S.; Ong, L.H.; Chantrapromma, S. First order temperature-dependent phase transition of hexamethylenetetraminium 3,5-dinitrobenzoate hemihydrate crystal: Landau phenomenological theory approach. J. Mol. Struct. 2007, 837, 132–141. [Google Scholar] [CrossRef]
- Ranganathan, A.; Kulkarni, G.U.; Rao, C.N.R. Understanding the hydrogen bond in terms of the location of the bond critical point and the geometry of the lone pairs. J. Phys. Chem. A 2003, 107, 6073–6081. [Google Scholar] [CrossRef]
- Ohki, H.; Nakamura, N.; Chihara, H. Phase transition in solid adipic acid. J. Phys. Soc. Jpn. 1988, 57, 382–383. [Google Scholar] [CrossRef]
- Fun, H.K.; Chantrapromma, S. A triclinic polymorph of hexanedioic acid. Acta Crystallogr. E 2009, 65, o624. [Google Scholar] [CrossRef]
- Salje, E.K.H. Phase Transition in Ferroelastic and Co-elastic Crystals; Cambridge University Press: University of Cambridge, Cambridge, UK, 1990; pp. 28–32. [Google Scholar]
- Gesi, K. Phenomenological theory of an isomorphous transition in polar crystals-application to the II-III transition in ferroelectric Ca2Pb(C2H5COO)6. J. Phys. Soc. Jpn. 1976, 40, 483–489. [Google Scholar] [CrossRef]
- Jayaraman, A. Fusion curve of cerium to 70 kilobar and phenomena associated with supercritical behavior of fcc cerium. Phys. Rev. 1965, 137, A179. [Google Scholar] [CrossRef]
- Nye, J.F. Physical Properties of Crystals: Their Representation by Tensor and Matrices; Oxford University Press: Oxford, UK, 1972; pp. 93–109. [Google Scholar]
- Schlenker, J.L.; Gibbs, G.V.; Boisen, M.B. Strain-tensor components expressed in terms of lattice parameters. Acta Crystallogr. A 1978, 34, 52–54. [Google Scholar] [CrossRef]
- Aizu, K. Determination of the state parameters and formulation of spontaneous strain for ferroelastics. J. Phys. Soc. Jpn. 1970, 28, 706–716. [Google Scholar] [CrossRef]
- APEX2 (Version 1.27), SAINT (Version 7.12a) and SADABS (Version 2004/1). Bruker AXS Inc.: Madison, WI, USA, 2005.
- Sheldrick, G.M. A short history of SHELX. Acta Crystallogr. A 2008, 64, 112–122. [Google Scholar] [CrossRef]
- Spek, A.L. Structure validation in chemical crystallography. Acta Crystallogr. D 2009, 65, 148–155. [Google Scholar] [CrossRef]
- Macrae, C.F.; Bruno, I.J.; Chisholm, J.A.; Edgington, P.R.; McCabe, P.; Pidcock, E.; Rodriguez-Monge, L.; Taylor, R.; van de Streek, J.; Wood, P.A. Mercury CSD 2.0-new features for the visualization and investigation of crystal structures. J. Appl. Crystallogr. 2008, 41, 466–470. [Google Scholar] [CrossRef]
- Sample Availability: Samples of the compounds are available from the authors.
© 2014 by the authors. Licensee MDPI, Basel, Switzerland. This article is an open access article distributed under the terms and conditions of the Creative Commons Attribution license ( http://creativecommons.org/licenses/by/4.0/).
Share and Cite
Fun, H.-K.; Chantrapromma, S.; Ong, L.-H. First Order Temperature Dependent Phase Transition in a Monoclinic Polymorph Crystal of 1,6-Hexanedioic Acid: An Interpretation Based on the Landau Theory Approach. Molecules 2014, 19, 10137-10149. https://doi.org/10.3390/molecules190710137
Fun H-K, Chantrapromma S, Ong L-H. First Order Temperature Dependent Phase Transition in a Monoclinic Polymorph Crystal of 1,6-Hexanedioic Acid: An Interpretation Based on the Landau Theory Approach. Molecules. 2014; 19(7):10137-10149. https://doi.org/10.3390/molecules190710137
Chicago/Turabian StyleFun, Hoong-Kun, Suchada Chantrapromma, and Lye-Hock Ong. 2014. "First Order Temperature Dependent Phase Transition in a Monoclinic Polymorph Crystal of 1,6-Hexanedioic Acid: An Interpretation Based on the Landau Theory Approach" Molecules 19, no. 7: 10137-10149. https://doi.org/10.3390/molecules190710137