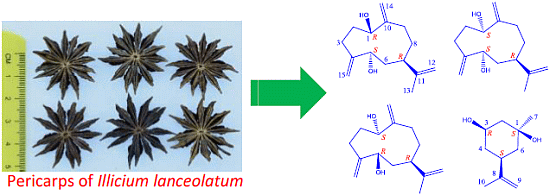
Germacranes and m-Menthane from Illicium lanceolatum

Abstract
:
1. Introduction
2. Results and Discussion

| No. | 1 (mult.) | 2 (mult.) | 3 (mult.) | 4 (mult.) |
|---|---|---|---|---|
| 1 | 77.2 (C) | 70.6 (C) | 74.1 (C) | 75.3 (C) |
| 2 | 33.9 (CH2) | 33.5 (CH2) | 34.4 (CH2) | 33.5 (CH2) |
| 3 | 29.2 (CH2) | 26.7 (CH2) | 27.0 (CH2) | 25.8 (CH2) |
| 4 | 152.7 (C) | 152.2 (C) | 153.6 (C) | 151.6 (C) |
| 5 | 72.5 (CH) | 74.6 (CH) | 76.7 (CH) | 77.3 (CH) |
| 6 | 41.1 (CH2) | 40.6 (CH2) | 40.1 (CH2) | 37.8 (CH2) |
| 7 | 39.7 (CH) | 40.8 (CH) | 42.1 (CH) | 42.2 (CH) |
| 8 | 30.4 (CH2) | 30.1 (CH2) | 31.5 (CH2) | 33.4 (CH2) |
| 9 | 29.8 (CH2) | 35.2 (CH2) | 32.1 (CH2) | 31.4 (CH2) |
| 10 | 150.6 (C) | 152.1 (C) | 151.7 (C) | 150.6 (C) |
| 11 | 151.3 (C) | 150.7 (C) | 150.4 (C) | 150.5 (C) |
| 12 | 110.3 (CH2) | 110.5 (CH2) | 110.4 (CH2) | 110.5 (CH2) |
| 13 | 20.1 (CH3) | 20.5 (CH3) | 19.0 (CH3) | 19.4 (CH3) |
| 14 | 116.9 (CH2) | 113.8 (CH2) | 114.3 (CH2) | 114.4 (CH2) |
| 15 | 112.4 (CH2) | 111.4 (CH2) | 112.8 (CH2) | 114.9 (CH2) |
| No. | 1 [mult., J (Hz)] | 2 [mult., J (Hz)] | 3 [mult., J (Hz)] | 4 [mult., J (Hz)] |
|---|---|---|---|---|
| 1 | 4.24 dd (5.2, 10.5) | 4.23 dd (4.5, 9.6) | 4.11 dd (4.2, 10.4) | 4.16 dd (4.1, 9.6) |
| 2 | 2.10 m; 1.98 m | 2.22 m; 1.95 m | 2.25 m; 1.82 m | 2.09 m; 1.56 m |
| 3 | 2.29 m | 2.38 dd (4.0, 11.4); 2.07 m | 2.11 (overlap) | 2.32 dd (4.0, 14.2); 2.07 m |
| 5 | 4.36 dd (3.9, 7.0) | 4.31 dd (3.5, 5.9) | 3.88 t (7.8) | 3.92 dd (3.9, 11.4) |
| 6 | 1.83 m | 1.91 ddd (2.3, 6.4, 14.2); 1.69 (overlap) | 1.67 (overlap) | 1.85 ddd (2.7, 11.3, 14.0); 1.59 m |
| 7 | 2.68 m | 2.42 m | 2.11 (overlap) | 2.17 m |
| 8 | 1.68 m | 1.74 m; 1.53 m | 1.61 m | 1.96 m; 1.64 m |
| 9 | 2.45 m; 2.04 m | 2.20 m; 2.13 dd (3.0, 11.2) | 2.14 (overlap) | 2.42 m; 2.05 m |
| 12 | 4.77 s | 4.73 s; 4.69 s | 4.66 br s | 4.69 s; 4.68 s |
| 13 | 1.76 s | 1.70 s | 1.67 s | 1.69 s |
| 14 | 5.16 s; 4.95 s | 5.19 s; 5.03 s | 5.24 s; 5.02 s | 5.18 s; 5.02 s |
| 15 | 5.13 s; 5.02 s | 5.05 s; 4.98 s | 5.12 s; 5.05 s | 5.02 br s |


| No. | δC (mult.) | δH [mult., J (Hz)] |
|---|---|---|
| 1 | 71.4 (C) | - |
| 2 | 33.7 (CH2) | 1.72 (partial overlap); 1.49 (partial overlap) |
| 3 | 73.8 (CH) | 3.60 d (3.2) |
| 4 | 34.0 (CH2) | 1.91 ddd (2.8, 11.6, 14.0); 1.63 dt (3.4, 13.8) |
| 5 | 37.4 (CH) | 2.23 m |
| 6 | 26.1 (CH2) | 1.53 (partial overlap) |
| 7 | 26.5 (CH3) | 1.23 s |
| 8 | 149.2 (C) | - |
| 9 | 109.0 (CH2) | 4.70 br s |
| 10 | 21.1 (CH3) | 1.69 s |
3. Experimental
3.1. General
3.2. Plant Material
3.3. Extraction and Isolation
3.4. Spectral Data
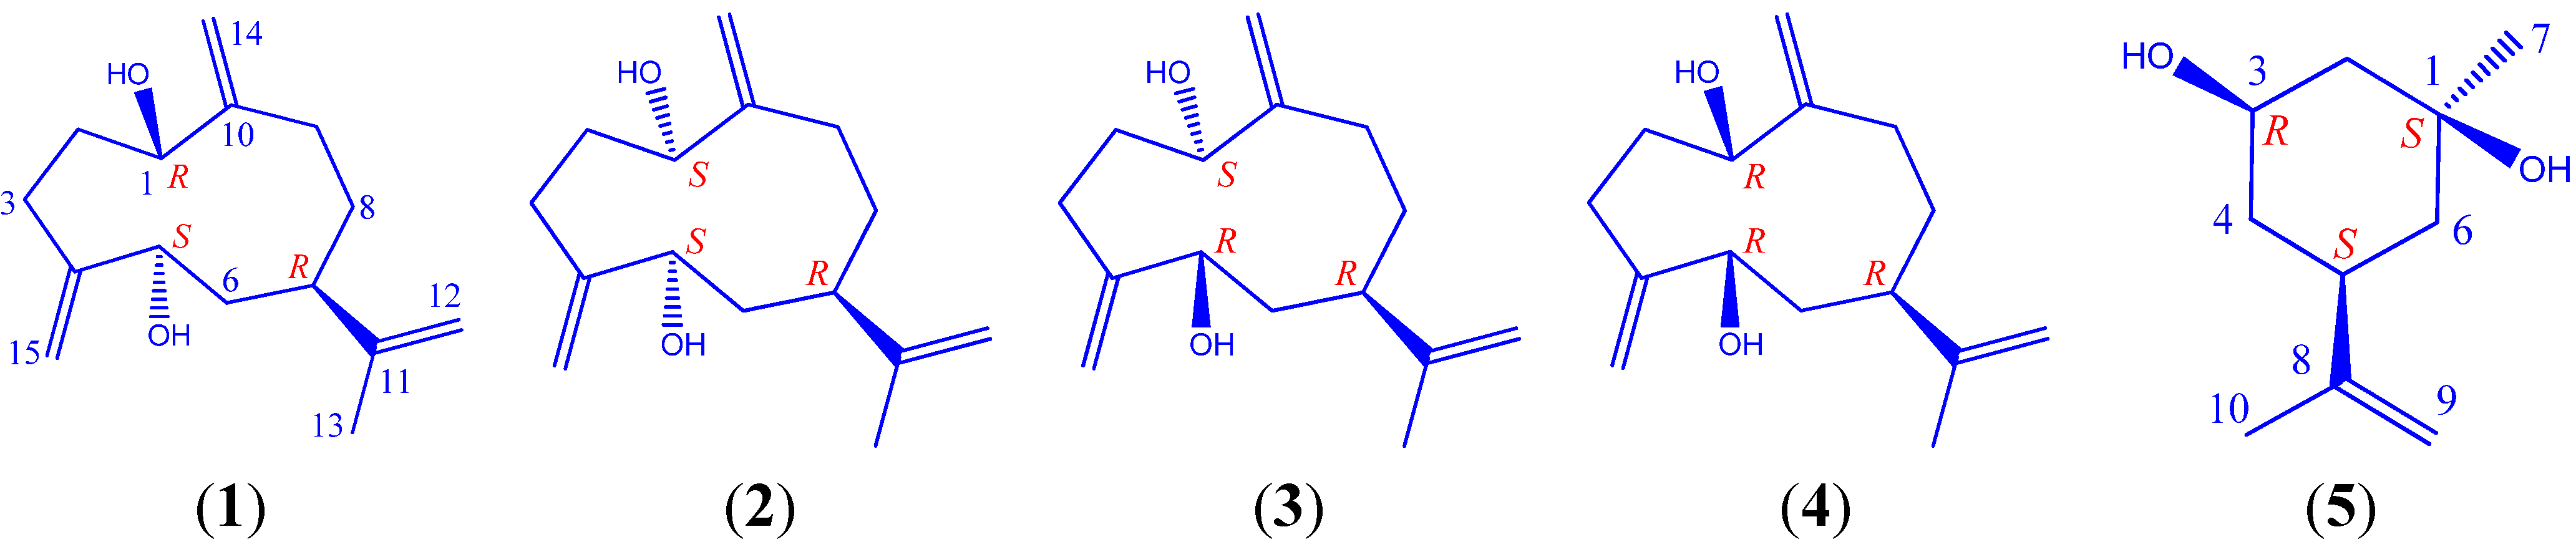
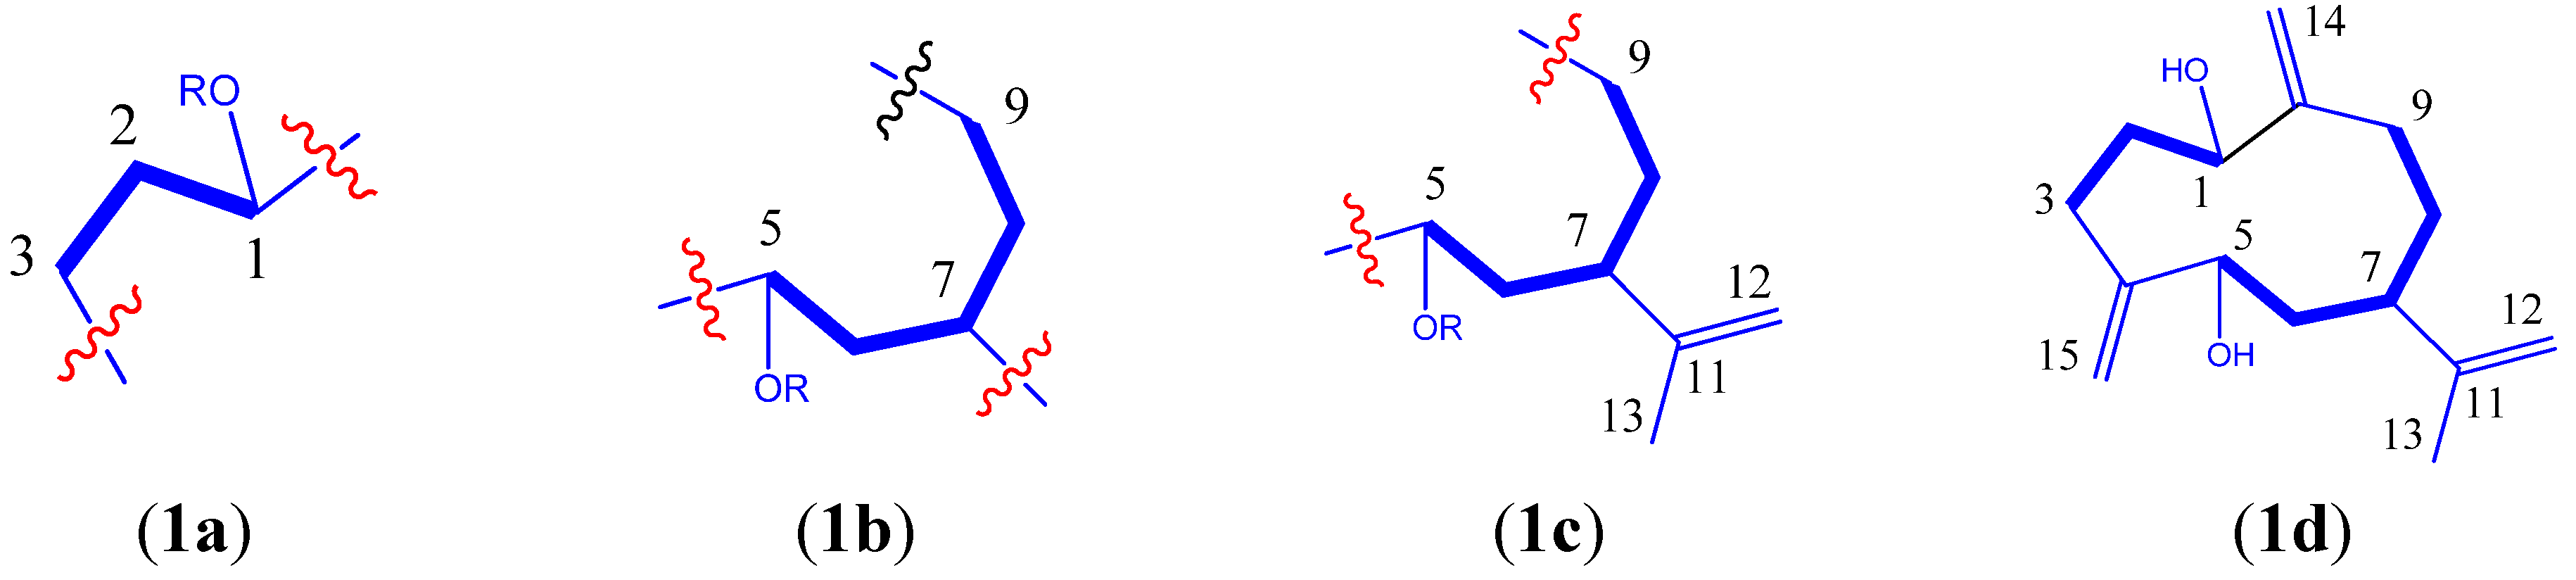
 −3° (c 0.12, MeOH). 13C- and 1H-NMR spectroscopic data (CD3OD): see Table 1 and Table 2, respectively. HR-ESI-MS m/z 219.1733 [M−H2O+H]+ (calcd. for C15H23O, 219.1743), m/z 201.1639 [M-−2H2O+H]+. −7° (c 0.14, MeOH). 13C- and 1H-NMR spectroscopic data (CD3OD): see Table 1 and Table 2, respectively. HR-ESI-MS m/z 219.1735 [M−H2O+H]+ (calcd. for C15H23O, 219.1743), 201.1630 [M−2H2O+H]+. −4° (c 0.17, MeOH). 13C- and 1H-NMR spectroscopic data (CD3OD): see Table 1 and Table 2, respectively. 1H spectroscopic data (CDCl3, 400 Hz): δH 5.24 (1H, s, H-14a), 5.03 (1H, s, H-14b); 5.16 (1H, s, H-15a), 5.06 (1H, s, H-15b); 4.65 (1H, s, H-12a), 4.64 (1H, s, H-12b); 4.16 (1H, dd, J = 4.3, 10.2 Hz, H-1); 3.95 (1H, dd, J = 5.0, 10.7 Hz, H-5); 2.27 (1H, m, H-2a), 1.83 (1H, m, H-2b); 2.13 (4H, overlapped, H-3 and H-9); 2.06 (1H, t, J = 5.7 Hz, H-7); 1.73 (1H, t, J = 5.2 Hz, H-6a), 1.59 (1H, partially overlapped, H-6b); 1.58 (2H, partially overlapped, H-8a; 1.65 (3H, s, H-13). HR-ESI-MS m/z 219.1734 [M−H2O+H]+ (calcd. for C15H23O, 219.1743), 201.1642 [M−2H2O+H]+, 237.1820 [M+H]+. +11° (c 0.16, MeOH). 13C- and 1H-NMR spectroscopic data (CD3OD): see Table 1 and Table 2, respectively. HR-ESI-MS m/z 219.1740 [M−H2O+H]+ (calcd. for C15H23O, 219.1743), 201.1650 [M−2H2O+H]+.
3.5. Preparation of the (R)- and (S)-MTPA Ester Derivatives of 1–5
3.6. In Vitro Assay on SH-SY5Y
4. Conclusions
Supplementary Files
Acknowledgments
Author Contributions
Conflicts of Interest
References
- Jordal, M.M. Illicium, Pimpinella and Foeniculum; CRC Press LLC: Boca Raton, FL, USA, 2004. [Google Scholar]
- Kubo, M.; Shima, N.; Harada, K.; Hioki, H.; Fukuyama, Y. New prenylated C6-C3 compounds from the twigs of Illicium anisatum. Chem. Pharm. Bull. 2011, 59, 898–901. [Google Scholar] [CrossRef]
- Estevez, A.M.; Estevez, R.J. A short overview on the medicinal chemistry of (−)-shikimic acid. Mini-Rev. Med. Chem. 2012, 12, 1443–1454. [Google Scholar] [CrossRef]
- Wang, G.-W.; Hu, W.-T.; Huang, B.-K.; Qin, L.-P. Illicium verum: A review on its botany, traditional use, chemistry and pharmacolog. J. Ethnopharmacol. 2011, 136, 10–20. [Google Scholar] [CrossRef]
- Editorial Committee of Chinese Pharmacopoeia. Chinese Pharmacopoeia, 2010 ed.; China Medical Science and Technology Press: Beijing, China, 2010. [Google Scholar]
- Ize-Ludlow, D.; Ragone, S.; Bruck Isaac, S.; Bernstein Jeffrey, N.; Duchowny, M.; Pena Barbara, M.G. Neurotoxicities in infants seen with the consumption of star anise tea. Department of Pediatrics, Miami Children’s Hospital: Miami, FL 33155, USA, United States FIELD Citation, 2004; pp. e653–e656.
- Garzo Fernandez, C.; Gomez Pintado, P.; Barrasa Blanco, A.; Martinez Arrieta, R.; Ramirez Fernandez, R.; Ramon Rosa, F. Cases of neurological symptoms associated with star anise consumption used as a carminative. An. Esp. Pediatr. 2002, 57, 290–294. [Google Scholar] [CrossRef]
- Johanns, E.S.D.; van der Kolk, L.E.; van Gemert, H.M.A.; Sijben, A.E.J.; Peters, P.W.J.; de Vries, I. An epidemic of epileptic seizures after consumption of herbal tea. Ned. Tijdschr. Geneeskd. 2002, 146, 813–816. [Google Scholar]
- Xu, X.R. The authentication of Star Anise and toxic Illicium lanceolatum. Qilu Yaoshi 1984, 3, 27–28. [Google Scholar]
- Lane, J.F.; Koch, W.T.; Leeds, N.S.; Gorin, G. The toxin of Illicium anisatum. I. The isolation and characterization of a convulsant principle: Anisatin. J. Am. Chem. Soc. 1952, 74, 3211–3214. [Google Scholar] [CrossRef]
- Yamada, K.; Takada, S.; Nakamura, S.; Hirata, Y. Structures of anisatin and neoanisatin toxic sesquiterpenes from Illicium anisatum. Tetrahedron 1968, 24, 199–229. [Google Scholar] [CrossRef]
- Yang, C.; Hashimoto, M.; Baba, N.; Takahshi, M.; Kaneto, H.; Kawano, N.; Kouno, I. A new toxic neoanisatin derivative from the pericarps of Illicium majus. Chem. Pharm. Bull. 1990, 38, 291–292. [Google Scholar] [CrossRef]
- Ikeda, T.; Ozoe, Y.; Okuyama, E.; Nagata, K.; Honda, H.; Shono, T.; Narahashi, T. Anisatin modulation of the γ-aminobutyric acid receptor-channel in rat dorsal root ganglion neurons. Br. J. Pharmacol. 1999, 127, 1567–1576. [Google Scholar] [CrossRef]
- Kakemoto, E.; Okuyama, E.; Nagata, K.; Ozoe, Y. Interaction of anisatin with rat brain γ-aminobutyric acidA receptors: Allosteric modulation by competitive antagonists. Biochem. Pharmacol. 1999, 58, 617–621. [Google Scholar] [CrossRef]
- Kudo, Y.; Oka, J.; Yamada, K. Anisatin, a potent GABA antagonist, isolated from Illicium anisatum. Neurosci. Lett. 1981, 25, 83–88. [Google Scholar] [CrossRef]
- Matsumoto, K.; Fukuda, H. Anisatin modulation of GABA- and pentobarbital-induced enhancement of diazepam binding in rat brain. Neurosci. Lett. 1982, 32, 175–179. [Google Scholar] [CrossRef]
- Kuriyama, T.; Schmidt, T.J.; Okuyama, E.; Ozoe, Y. Structure-activity relationships of seco-prezizaane terpenoids in γ-aminobutyric acid receptors of houseflies and rats. Bioorg. Med. Chem. 2002, 10, 1873–1881. [Google Scholar] [CrossRef]
- Schmidt, T.J.; Gurrath, M.; Ozoe, Y. Structure-activity relationships of seco-prezizaane and picrotoxane/picrodendrane terpenoids by quasar receptor-surface modeling. Bioorg. Med. Chem. 2004, 12, 4159–4167. [Google Scholar] [CrossRef]
- Schmidt, T.J.; Okuyama, E.; Fronczek, F.R. The molecular structure of 2α-hydroxyneoanisatin and structure-activity relationships among convulsant sesquiterpenes of the seco-prezizaane and picrotoxane types. Bioorg. Med. Chem. 1999, 7, 2857–2865. [Google Scholar] [CrossRef]
- Kubo, M.; Okada, C.; Huang, J.-M.; Harada, K.; Hioki, H.; Fukuyama, Y. Novel pentacyclic seco-prezizaane-type sesquiterpeneoids with neurotrophic properties from Illicium jiadifengpi. Org. Lett. 2009, 11, 5190–5193. [Google Scholar] [CrossRef]
- Takaoka, S.; Takaoka, N.; Minoshima, Y.; Huang, J.-M.; Kubo, M.; Harada, K.; Hioki, H.; Fukuyama, Y. Isolation, synthesis, and neurite outgrowth-promoting activity of illicinin A from the flowers of Illicium anisatum. Tetrahedron 2009, 65, 8354–8361. [Google Scholar] [CrossRef]
- Trzoss, L.; Xu, J.; Lacoske, M.H.; Mobley, W.C.; Theodorakis, E.A. Enantioselective synthesis of (−)-jiadifenin, a potent neurotrophic modulator. Org. Lett. 2011, 13, 4554–4557. [Google Scholar] [CrossRef]
- Yokoyama, R.; Huang, J.-M.; Yang, C.-S.; Fukuyama, Y. New seco-prezizaane-type sesquiterpenes, jiadifenin with neurotrophic activity and 1,2-dehydroneomajucin from Illicium jiadifengpi. J. Nat. Prod. 2002, 65, 527–531. [Google Scholar] [CrossRef]
- Ohtani, I.; Kusumi, T.; Kashman, Y.; Kakisawa, H. High-field FT NMR application of Mosher’s method. The absolute configurations of marine terpenoids. J. Am. Chem. Soc. 1991, 113, 4092–4096. [Google Scholar] [CrossRef]
- Rieser, M.J.; Hui, Y.H.; Rupprecht, J.K.; Kozlowski, J.F.; Wood, K.V.; McLaughlin, J.L.; Hanson, P.R.; Zhuang, Z.; Hoye, T.R. Determination of absolute configuration of stereogenic carbinol centers in annonaceous acetogenins by proton and fluorine 19-NMR analysis of Mosher ester derivatives. J. Am. Chem. Soc. 1992, 114, 10203–10213. [Google Scholar] [CrossRef]
- Triana, J.; Lopez, M.; Rico, M.; Gonzalez-Platas, J.; Quintana, J.; Estevez, F.; Leon, F.; Bermejo, J. Sesquiterpeneoid derivatives from Gonospermum elegans and their cytotoxic activity for HL-60 human promyelocytic cells. J. Nat. Prod. 2003, 66, 943–948. [Google Scholar] [CrossRef]
- Bohlmann, F.; Gupta, R.K.; Jakupovic, J.; King, R.M.; Robinson, H. Naturally occurring terpene derivatives. Part 338. Eudesmanolides and heliangolides from Calea rotundifolia. Phytochemistry 1981, 20, 1635–1637. [Google Scholar] [CrossRef]
- Matsumoto, T.; Ishida, T.; Takeda, Y.; Yagi, J. The enantioselective metabolism of 4-isopropenyltoluene in rabbits. Biol. Pharm. Bull. 1994, 17, 1441–1445. [Google Scholar] [CrossRef]
- Matsuura, H.; Miyazaki, H.; Asakawa, C.; Amano, M.; Yoshihara, T.; Mizutani, J. Isolation of α-glucosidase inhibitors from hyssop (Hyssopus officinalis). Phytochemistry 2004, 65, 91–97. [Google Scholar] [CrossRef]
- Dong, S.-H.; Nikolic, D.; Simmler, C.; Qiu, F.; van Breemen, R.B.; Soejarto, D.D.; Pauli, G.F.; Chen, S.-N. Diarylheptanoids from Dioscorea villosa (Wild Yam). J. Nat. Prod. 2012, 75, 2168–2177. [Google Scholar] [CrossRef]
- Sample Availability: Samples of the compound 3, 4, and 5–8 are available from the authors.
© 2014 by the authors. Licensee MDPI, Basel, Switzerland. This article is an open access article distributed under the terms and conditions of the Creative Commons Attribution license ( http://creativecommons.org/licenses/by/3.0/).
Share and Cite
Zhao, M.; Zhang, X.; Wang, Y.; Huang, M.; Duan, J.-A.; Gödecke, T.; Szymulanska-Ramamurthy, K.M.; Yin, Z.; Che, C.-T. Germacranes and m-Menthane from Illicium lanceolatum. Molecules 2014, 19, 4326-4337. https://doi.org/10.3390/molecules19044326
Zhao M, Zhang X, Wang Y, Huang M, Duan J-A, Gödecke T, Szymulanska-Ramamurthy KM, Yin Z, Che C-T. Germacranes and m-Menthane from Illicium lanceolatum. Molecules. 2014; 19(4):4326-4337. https://doi.org/10.3390/molecules19044326
Chicago/Turabian StyleZhao, Ming, Xianming Zhang, Yan Wang, Min Huang, Jin-Ao Duan, Tanja Gödecke, Karina M. Szymulanska-Ramamurthy, Zhiqi Yin, and Chun-Tao Che. 2014. "Germacranes and m-Menthane from Illicium lanceolatum" Molecules 19, no. 4: 4326-4337. https://doi.org/10.3390/molecules19044326