Simultaneous Determination of Original, Degraded Ginsenosides and Aglycones by Ultra High Performance Liquid Chromatography Coupled with Quadrupole Time-of-Flight Mass Spectrometry for Quantitative Evaluation of Du-Shen-Tang, the Decoction of Ginseng

Abstract
:1. Introduction
2. Results and Discussion
2.1. Optimization of Chromatographic Conditions
2.2. Optimization of MS Conditions


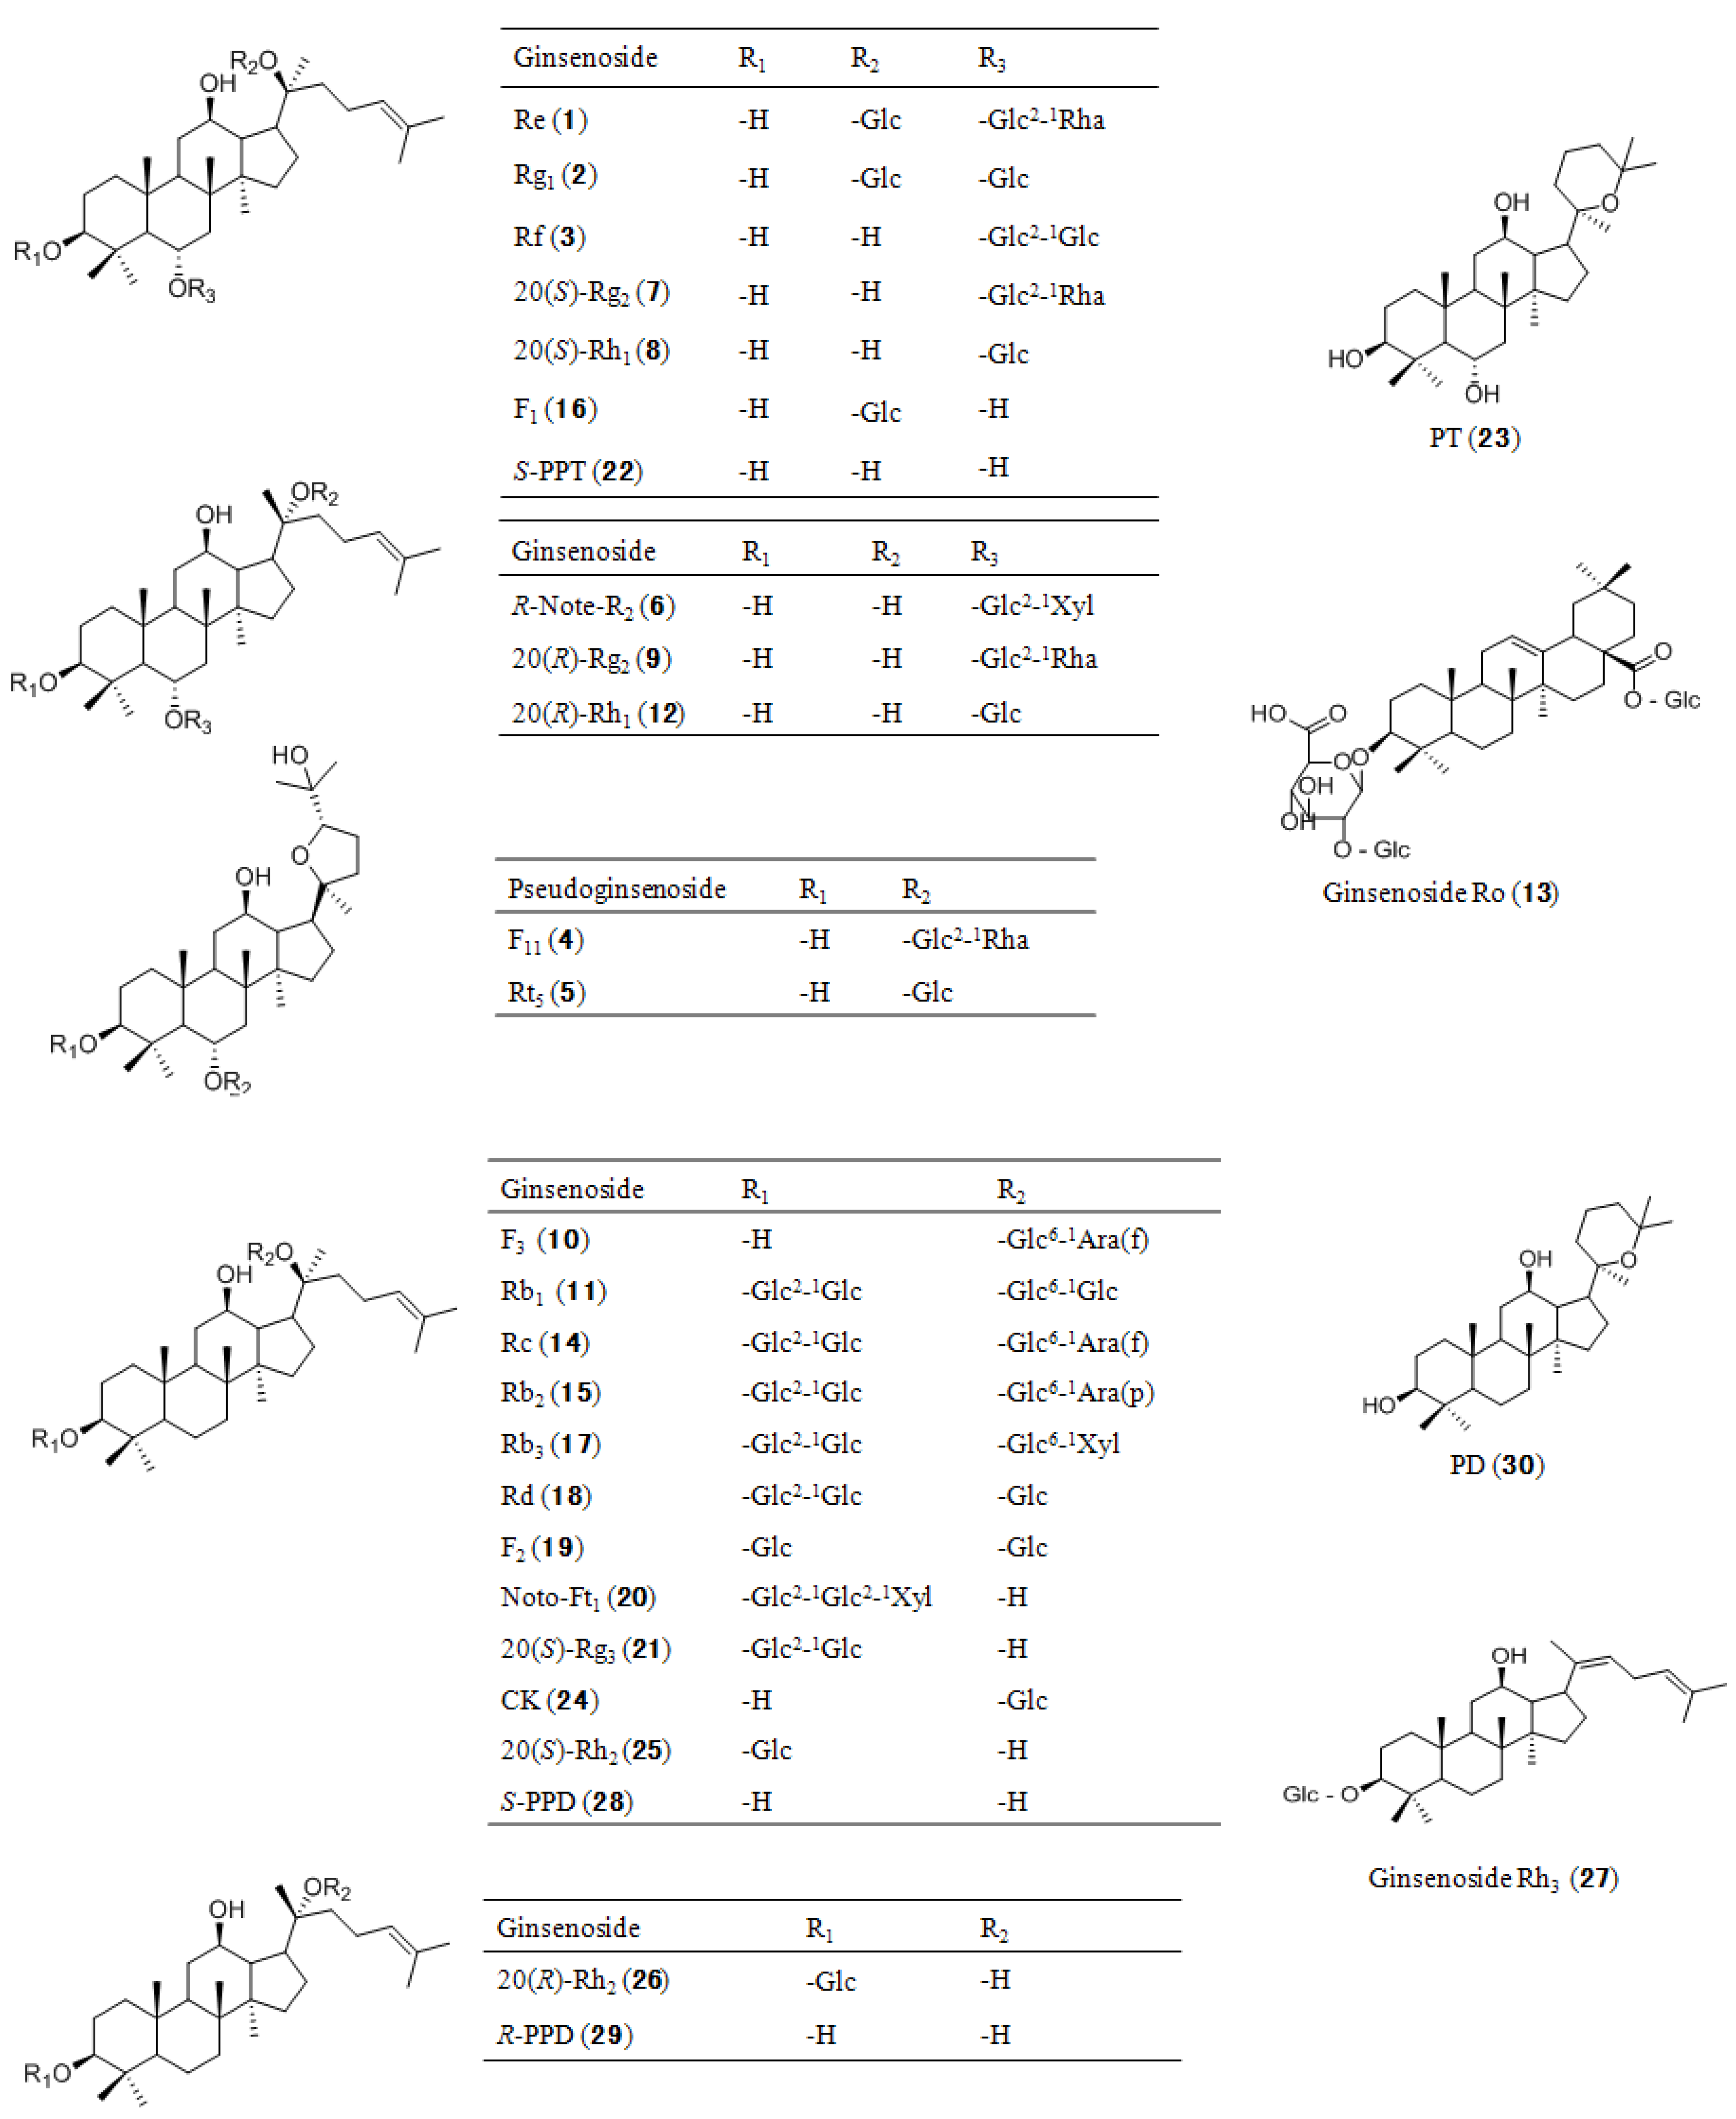
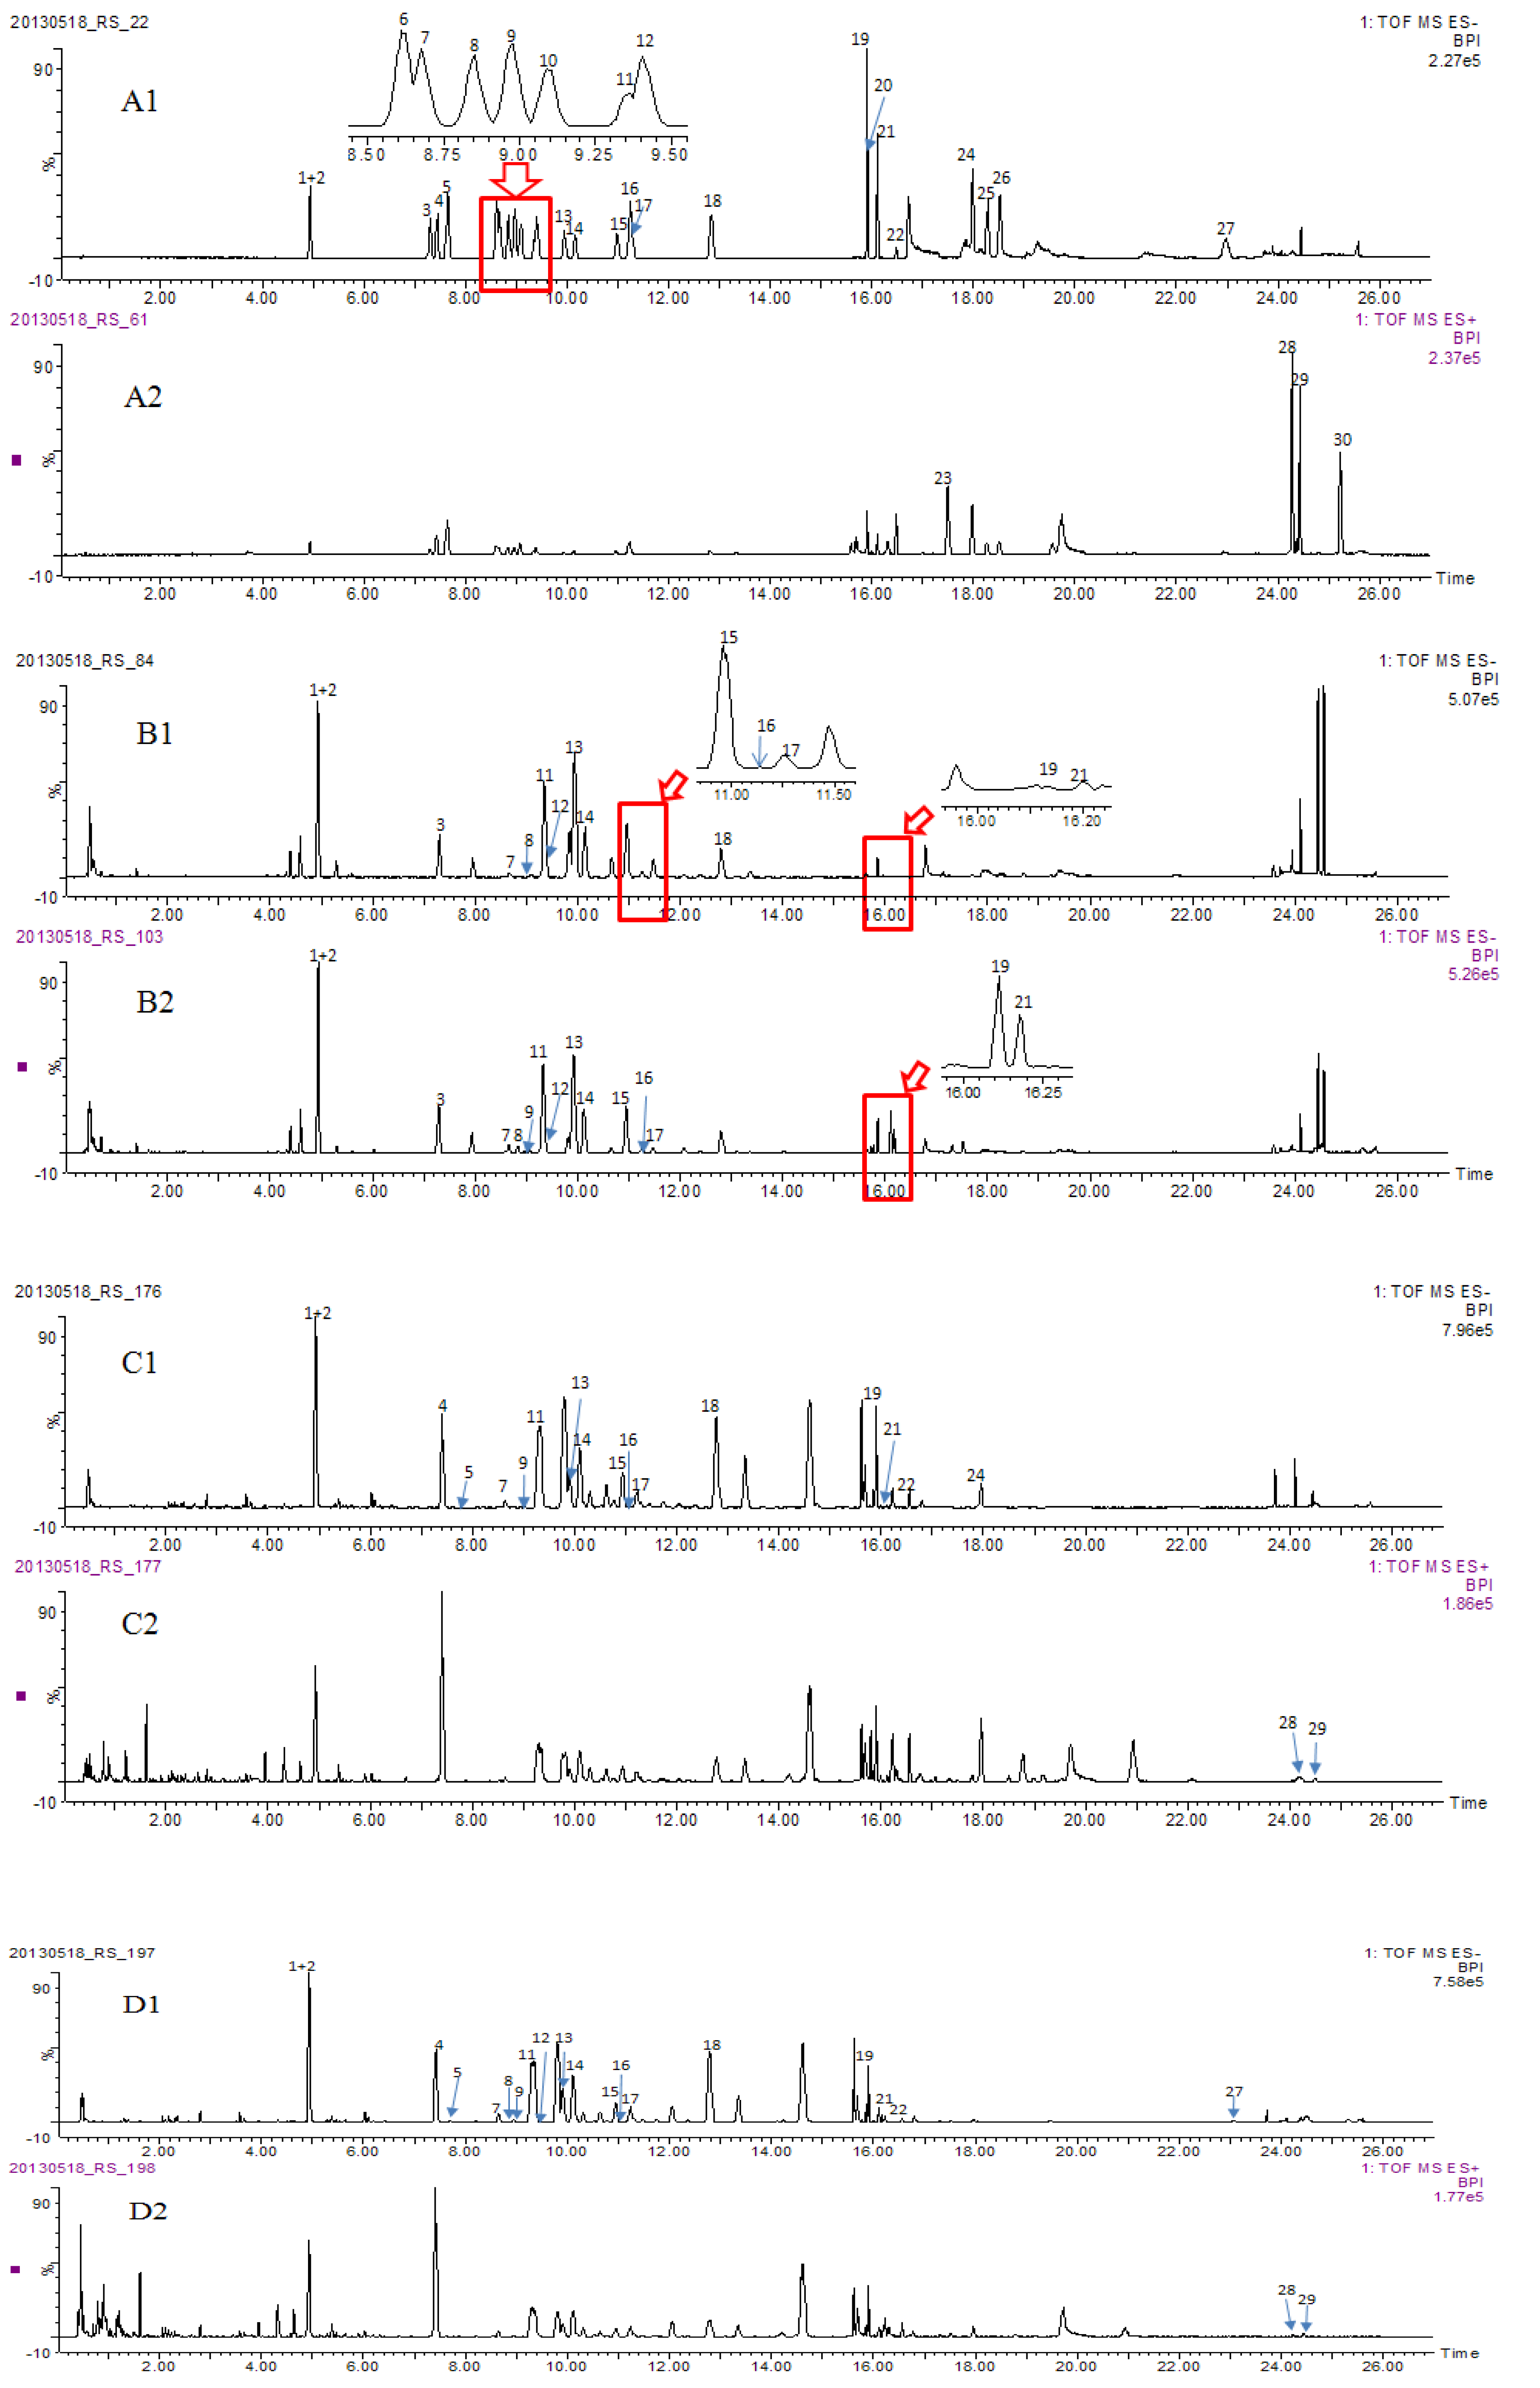
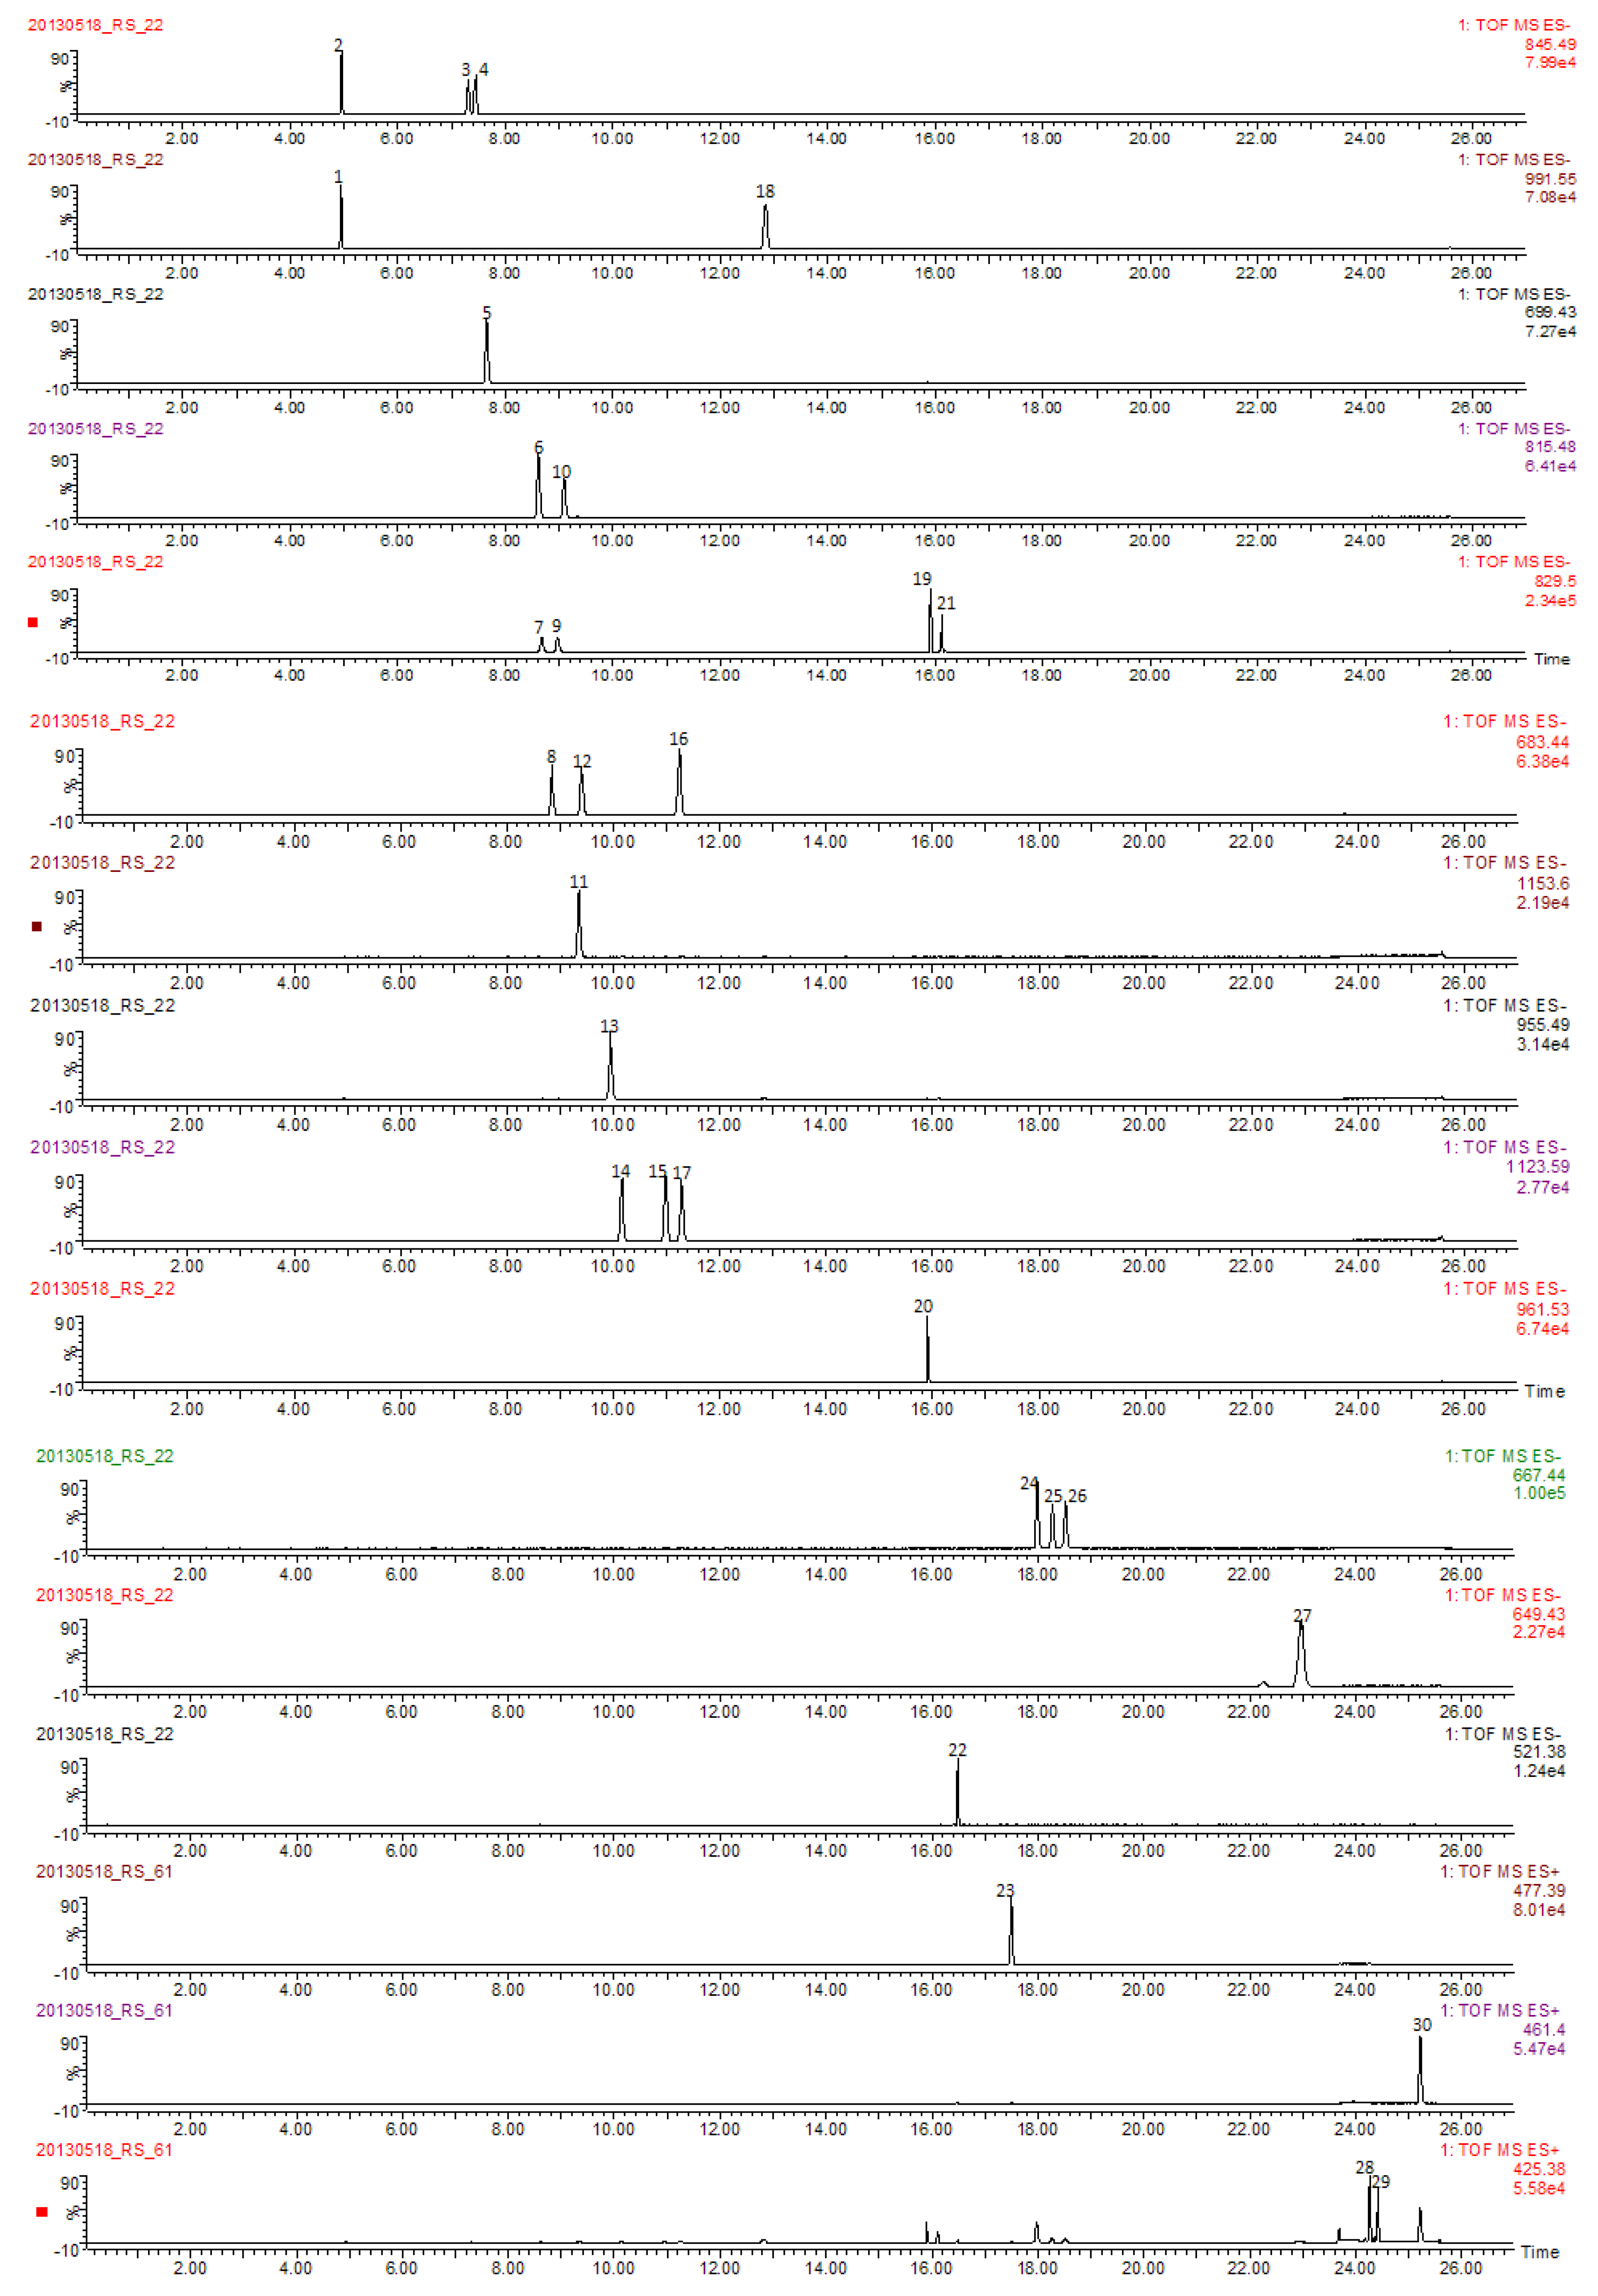
2.3. Identity Confirmation and Selection of Extracting Ions for Quantification of 30 Analytes
2.4. Method Validation

| No. | Analyte | tR (min) | Extracting Ion (m/z) | Range (μg/mL) | Equation | R2 | Ions for Identity Confirmation * |
|---|---|---|---|---|---|---|---|
| 1 | Re | 4.96 | 991.55[M–H+HCOOH]− | 0.39–50.00 | y = 278.10x + 118.50 | 0.997 | 991.5482[M−H+HCOOH]− (991.5478, 0.4) |
| 981.5180[M+Cl]− (981.5190, −1.0) | |||||||
| 945.5443[M–H]− (945.5423, 2.1) | |||||||
| 799.4845[M–H–(Rha–H2O)]− (799.4844, 0.1) | |||||||
| 783.4921[M–H–(Glc–H2O)]− (783.4895, 3.3) | |||||||
| 637.4335[M–H–(Rha–H2O)–(Glc–H2O)]− (637.4316, 3.0) | |||||||
| 475.3779[M–H–(Rha–H2O)–2(Glc–H2O)]− (475.3787, −1.7) | |||||||
| 2 | Rg1 | 4.97 | 845.49[M–H+HCOOH]− | 0.39–50.00 | y = 284.00x + 284.70 | 0.992 | 845.4905[M–H+HCOOH]− (845.4899, 0.7) |
| 835.4617[M+Cl]− (835.4611, 0.7) | |||||||
| 799.4845[M–H]− (799.4844, 0.1) | |||||||
| 637.4335[M–H–(Glc–H2O)]− (637.4316, 3.0) | |||||||
| 475.3773[M–H–2(Glc–H2O)]− (475.3787, −2.9) | |||||||
| 3 | Rf | 7.35 | 845.49[M–H+HCOOH]− | 0.39–50.00 | y = 283.00x − 39.76 | 0.998 | 845.4886[M–H+HCOOH]− (845.4899, −1.5) |
| 835.4595[M+Cl]− (835.4611, −1.9) | |||||||
| 799.4806[M–H]− (799.4844, −4.8) | |||||||
| 637.4305[M–H–(Glc–H2O)]− (637.4316, −1.7) | |||||||
| 475.3785[M–H–2(Glc–H2O)]− (475.3787, −0.4) | |||||||
| 4 | Pseudo-F11 | 7.57 | 845.49[M–H+HCOOH]− | 0.39–50.00 | y = 242.90x + 118.00 | 0.995 | 845.4900[M–H+HCOOH]− (845.4899, 0.1) |
| 835.4623[M+Cl]− (835.4611, 1.4) | |||||||
| 799.4850[M–H]− (799.4844, 0.8) | |||||||
| 653.4268[M–H–(Rha–H2O)]− (653.4265, 0.5) | |||||||
| 635.4162[M–H–(Rha–H2O)–H2O]− (635.4159, 0.5) | |||||||
| 491.3747[M–H–(Rha–H2O)–(Glc–H2O)]− (491.3736, 2.2) | |||||||
| 5 | Pseudo-Rt5 | 7.72 | 699.43[M–H+HCOOH]− | 0.39–12.50 | y = 659.60x − 133.60 | 0.998 | 699.4313[M–H+HCOOH]− (699.4320, −1.0) |
| 689.4020[M+Cl]− (689.4032, −1.7) | |||||||
| 653.4271[M–H]− (653.4265, 0.9) | |||||||
| 491.3746[M–H–(Glc–H2O)]− (491.3736, 2.0) | |||||||
| 6 | R-Note-R2 | 8.68 | 815.48[M–H+HCOOH]− | 0.39–12.50 | y = 642.30x − 217.40 | 0.998 | 815.4788[M–H+HCOOH]− (815.4793, −0.6) |
| 805.4504[M+Cl]− (805.4505, −0.1) | |||||||
| 769.4731[M–H]− (769.4738, −0.9) | |||||||
| 637.4323[M–H–(Xyl–H2O)]− (637.4316, 1.1) | |||||||
| 475.3782 [M–H–(Xyl–H2O)–(Glc–H2O)]− (475.3787, −1.1) | |||||||
| 7 | 20(S)-Rg2 | 8.74 | 829.50[M–H+HCOOH]− | 0.39–50.00 | y = 414.40x − 19.21 | 0.999 | 829.4952[M–H+HCOOH]− (829.4949, 0.4) |
| 819.4666[M+Cl]− (819.4661, 0.6) | |||||||
| 783.4897[M–H]− (783.4895, 0.3) | |||||||
| 637.4311[M–H–(Rha–H2O)]− (637.4316, –0.8) | |||||||
| 475.3786[M–H–(Rha–H2O)–(Glc–H2O)]− (475.3787, −0.2) | |||||||
| 8 | 20(S)-Rh1 | 8.91 | 683.44[M–H+HCOOH]− | 0.39–100.00 | y = 419.50x − 80.11 | 0.999 | 683.4369[M–H+HCOOH]− (683.4370, –0.1) |
| 673.4070[M+Cl]− (673.4082, −1.8) | |||||||
| 637.4312[M–H]− (637.4316, −0.6) | |||||||
| 475.3778 [M–H–(Glc–H2O)]− (475.3787, −1.9) | |||||||
| 9 | 20(R)-Rg2 | 9.04 | 829.50[M–H+HCOOH]− | 0.39–100.00 | y = 516.10x − 8.84 | 0.999 | 829.4946[M–H+HCOOH]− (829.4949, −0.4) |
| 819.4650[M+Cl]− (819.4661, −1.3) | |||||||
| 783.4904[M–H]− (783.4895, 1.1) | |||||||
| 637.4330[M–H–(Rha–H2O)]− (637.4316, 2.2) | |||||||
| 475.3785[M–H–(Rha–H2O)–(Glc–H2O)]− (475.3787, −0.4) | |||||||
| 10 | F3 | 9.17 | 815.48[M–H+HCOOH]− | 0.39–100.00 | y = 353.60x + 90.34 | 0.999 | 815.4788[M–H+HCOOH]− (815.4793, −0.6) |
| 805.4503[M+Cl]− (805.4505, −0.2) | |||||||
| 769.4730[M–H]− (769.4738, −1.0) | |||||||
| 637.4324[M–H–(Xyl–H2O)]− (637.4316, 1.3) | |||||||
| 475.3792 [M–H–(Xyl–H2O)–(Glc–H2O)]− (475.3787, 1.1) | |||||||
| 11 | Rb1 | 9.43 | 1153.60[M–H+HCOOH]− | 0.39–100.00 | y = 234.20x − 114.70 | 0.999 | 1153.6013[M–H+HCOOH]− (1153.6006, 0.6) |
| 1143.5693[M+Cl]− (1143.5718, −2.2) | |||||||
| 1107.5957[M–H]− (1107.5951, 0.5) | |||||||
| 945.5427[M–H–(Glc–H2O)]− (945.5423, 0.4) | |||||||
| 783.4916[M–H–2(Glc–H2O)]− (783.4895, 2.7) | |||||||
| 621.4380[M–H–3(Glc–H2O)]− (621.4366, 2.3) | |||||||
| 12 | 20(R)-Rh1 | 9.48 | 683.44[M–H+HCOOH]− | 0.39–100.00 | y = 395.80x + 69.26 | 0.999 | 683.4382[M–H+HCOOH]− (683.4370, 1.8) |
| 673.4080[M+Cl]− (673.4082, −0.3) | |||||||
| 637.4310[M–H]− (637.4316, −0.9) | |||||||
| 475.3799[M–H–(Glc–H2O)]− (475.3787, 2.5) | |||||||
| 13 | Ro | 10.02 | 955.49[M–H]− | 0.39–100.00 | y = 284.40x − 183.20 | 0.999 | 955.4890[M–H]− (955.4903, −1.4) |
| 793.4354[M–H–(Glc–H2O)]− (793.4374, −2.5) | |||||||
| 14 | Rc | 10.25 | 1123.59[M–H+HCOOH]− | 0.39–100.00 | y = 257.80x − 206.90 | 0.998 | 1123.5935[M–H+HCOOH]− (1123.5900, 3.1) |
| 1113.5659[M+Cl]− (1113.5612, 4.2) | |||||||
| 1077.5852[M–H]− (1077.5845, 0.6) | |||||||
| 945.5405[M–H–(Ara(f)–H2O)]− (945.5423, −1.9) | |||||||
| 915.5335[M–H–(Glc–H2O)]− (915.5317, 2.0) | |||||||
| 783.4894[M–H–(Ara(f)–H2O)–(Glc–H2O)]− (783.4895, −0.1) | |||||||
| 621.4370[M–H–(Ara(f)–H2O)–2(Glc–H2O)]− (621.4366, 0.6) | |||||||
| 15 | Rb2 | 11.07 | 1123.59[M–H+HCOOH]− | 0.39–100.00 | y = 319.20x − 281.40 | 0.998 | 1123.5908[M–H+HCOOH]− (1123.5900, 0.7) |
| 1113.5627[M+Cl]− (1113.5612, 1.3) | |||||||
| 1077.5858[M–H]− (1077.5845, 1.2) | |||||||
| 945.5421[M–H–(Ara(p)–H2O)]− (945.5423, −0.2) | |||||||
| 915.5345[M–H–(Glc–H2O)]− (915.5317, 3.1) | |||||||
| 783.4895[M–H–(Ara(p)–H2O)–(Glc–H2O)]− (783.4895, 0.0) | |||||||
| 621.4370[M–H–(Ara(p)–H2O)–2(Glc–H2O)]− (621.4366, 0.6) | |||||||
| 16 | F1 | 11.34 | 683.44[M–H+HCOOH]− | 0.39–12.50 | y = 694.40x − 181.40 | 0.998 | 683.4367[M–H+HCOOH]− (683.4370, −0.4) |
| 673.4099[M+Cl]− (673.4082, 2.5) | |||||||
| 637.4331[M–H]− (637.4316, 2.4) | |||||||
| 475.3780[M–H–(Glc–H2O)]− (437.3787, −1.5) | |||||||
| 17 | Rb3 | 11.38 | 1123.59[M–H+HCOOH]− | 0.39–100.00 | y = 276.60x − 71.21 | 0.999 | 1123.5892[M–H+HCOOH]− (1123.5900, −0.7) |
| 1113.5605[M+Cl]− (1123.5612, −0.6) | |||||||
| 1077.5856[M–H]− (1077.5845, 1.0) | |||||||
| 945.5408[M–H–(Xyl–H2O)]− (945.5423, −1.6) | |||||||
| 915.5325[M–H–(Glc–H2O)]− (915.5317, 0.9) | |||||||
| 783.4913[M–H–(Xyl–H2O)–(Glc–H2O)]− (783.4895, 2.3) | |||||||
| 621.4338[M–H–(Xyl–H2O)–2(Glc–H2O)]− (621.4366, −4.5) | |||||||
| 18 | Rd | 12.94 | 991.55[M–H+HCOOH]− | 0.39–50.00 | y = 92.99x + 42.17 | 0.997 | 991.5477[M–H+HCOOH]− (991.5478, −0.1) |
| 981.5195[M+Cl]− (991.5190, 0.5) | |||||||
| 945.5424[M–H]− (945.5423, 0.1) | |||||||
| 783.4913[M–H–(Glc–H2O)]− (783.4895, 2.3) | |||||||
| 621.4385[M–H–2(Glc–H2O)]− (621.4366, 3.1) | |||||||
| 19 | F2 | 15.92 | 829.50[M–H+HCOOH]− | 0.39–6.25 | y = 615.80x − 143.40 | 0.998 | 829.4949[M–H+HCOOH]− (829.4949, 0.0) |
| 819.4653[M+Cl]− (819.4661, −1.0) | |||||||
| 783.4910[M–H]− (783.4895, 1.9) | |||||||
| 621.4377[M–H–(Glc–H2O)]− (621.4366, 1.8) | |||||||
| 459.3843[M–H–2(Glc–H2O)]− (459.3838, −1.1) | |||||||
| 20 | Note-Ft1 | 15.93 | 961.53[M–H+HCOOH]− | 0.39–6.25 | y = 192.90x − 52.76 | 0.996 | 961.5366[M–H+HCOOH]− (961.5372, −0.6) |
| 951.5073[M+Cl]− (951.5084, −1.2) | |||||||
| 915.5300[M–H]− (915.5317, −1.9) | |||||||
| 783.4902[M–H–(Xyl–H2O)]− (783.4895, 0.9) | |||||||
| 621.4374[M–H–(Xyl–H2O)–(Glc–H2O)]− (621.4366, 1.3) | |||||||
| 459.3856 [M–H–(Xyl–H2O)–2(Glc–H2O)]− (459.3838, 3.9) | |||||||
| 21 | 20(S)-Rg3 | 16.13 | 829.50[M–H+HCOOH]− | 0.78-12.50 | y = 553.50x − 202.10 | 0.999 | 829.4944[M–H+HCOOH]− (829.4949, −0.6) |
| 819.4640[M+Cl]− (819.4661, −2.6) | |||||||
| 783.4891[M–H]− (783.4895, −0.5) | |||||||
| 621.4373[M–H–(Glc–H2O)]− (621.4366, 1.1) | |||||||
| 459.3837[M–H–2(Glc–H2O)]− (459.3838, −0.2) | |||||||
| 22 | S-PPT | 16.51 | 521.38[M–H+HCOOH]− | 0.39–200.00 | y = 104.40x − 140.70 | 0.997 | 521.3850[M–H+HCOOH]− (521.3842, 1.5) |
| 511.3556[M+Cl]− (511.3554, 0.4) | |||||||
| 475.3803[M–H]− (475.3787, 3.4) | |||||||
| 23 | PT | 17.55 | 477.39[M+H]+ | 0.39–12.50 | y = 686.70x − 90.04 | 0.999 | 477.3945[M+H]+ (477.3944, 0.2) |
| 459.3837[M+H–H2O]+ (459.3838, −0.2) | |||||||
| 423.3628[M+H–3H2O]+ (423.3627, 0.2) | |||||||
| 405.3518[M+H–4H2O]+ (405.3521, −0.7) | |||||||
| 24 | CK | 18.02 | 667.44[M–H+HCOOH]− | 0.39–12.50 | y = 837.10x − 236.30 | 0.998 | 667.4426[M–H+HCOOH]− (667.4421, 0.7) |
| 657.4142[M+Cl]− (657.413, 1.4) | |||||||
| 621.4365[M–H]− (621.4366, −0.2) | |||||||
| 459.3839[M–H–(Glc–H2O)]− (459.3838, 0.2) | |||||||
| 25 | 20(S)-Rh2 | 18.32 | 667.44[M–H+HCOOH]− | 0.39–50.00 | y = 419.50x + 167.20 | 0.996 | 667.4413[M–H+HCOOH]− (667.4421, −1.2) |
| 657.4120[M+Cl]− (657.4133, −2.0) | |||||||
| 621.4389[M–H]− (621.4366, 3.7) | |||||||
| 459.3836 [M–H–(Glc–H2O)]− (459.3838, −0.4) | |||||||
| 26 | 20(R)-Rh2 | 18.56 | 667.44[M–H+HCOOH]− | 0.39–12.50 | y = 711.70x − 216.80 | 0.998 | 667.4426[M–H+HCOOH]− (667.4421, 0.7) |
| 657.4121[M+Cl]− (651.4133, −1.8) | |||||||
| 621.4384[M–H]− (621.4366, 2.9) | |||||||
| 459.3822 [M–H–(Glc–H2O)]− (459.3838, −3.5) | |||||||
| 27 | Rh3 | 23.08 | 649.43[M–H+HCOOH]− | 0.39–200.00 | y = 591.00x − 1246.00 | 0.998 | 649.4304[M–H+HCOOH]− (649.4316, −1.8) |
| 639.4003[M+Cl]− (639.4028, −3.9) | |||||||
| 603.4252 [M–H]− (603.4261, −1.5) | |||||||
| 28 | S-PPD | 24.26 | 425.38[M+H-2H2O]+ | 0.39–12.50 | y = 257.30x − 8.87 | 0.997 | 499.3561[M+K]+ (499.3554, 1.4) |
| 483.3816[M+Na]+ (483.3814, 0.4) | |||||||
| 443.3890[M+H–H2O]+ (443.3889, 0.2) | |||||||
| 425.3788 [M+H–2H2O]+ (425.3783, 1.2) | |||||||
| 29 | R-PPD | 24.42 | 425.38[M+H-2H2O]+ | 0.39–12.50 | y = 160.00x − 20.73 | 0.999 | 499.3568[M+K]+ (499.3554, 2.8) |
| 483.3817[M+Na]+ (483.3814, 0.6) | |||||||
| 443.3890[M+H–H2O]+ (443.3889, 0.2) | |||||||
| 425.3785 [M+H–2H2O]+ (425.3783, 0.5) | |||||||
| 30 | PD | 25.24 | 461.40[M+H]+ | 0.39–12.50 | y = 396.30x − 39.50 | 0.999 | 483.3822[M+Na]+ (483.3814, 1.7) |
| 461.3400[M+H]+ (461.3995, 1.1) | |||||||
| 443.3892[M+H–H2O]+ (443.4889, 0.7) | |||||||
| 425.3787[M+H–2H2O]+ (425.3783, 0.9) | |||||||
| 407.3679[M+H–3H2O]+ (407.3678, 0.2) |

| No. | Analyte | LOQ (ng) | LOD (ng) | Precision (RSD, %, n = 6) | Spike Recovery (%, n = 3) | Stability (RSD, %, n = 6) | |||
|---|---|---|---|---|---|---|---|---|---|
| Intra-day | Inter-day | Low | Middle | High | |||||
| 1 | Re | 0.02 | 0.01 | 3.12 | 4.74 | 36.05 | 37.72 | 37.34 | 3.67 |
| 2 | Rg1 | 0.02 | 0.01 | 3.05 | 4.42 | 44.87 | 45.79 | 44.51 | 2.48 |
| 3 | Rf | 0.05 | 0.02 | 4.13 | 3.60 | 105.31 | 94.45 | 99.28 | 2.70 |
| 4 | Pseudo-F11 | 0.05 | 0.02 | 1.13 | 1.97 | 91.37 | 88.27 | 87.84 | 1.53 |
| 5 | Pseudo-Rt5 | 0.02 | 0.01 | 4.66 | 5.21 | 114.14 | 114.88 | 113.79 | 4.16 |
| 6 | R-Note-R2 | 0.02 | 0.01 | 2.15 | 3.33 | 111.52 | 111.80 | 103.19 | 2.32 |
| 7 | 20(S)-Rg2 | 0.02 | 0.01 | 2.21 | 4.27 | 102.75 | 100.13 | 109.37 | 3.38 |
| 8 | 20(S)-Rh1 | 0.02 | 0.01 | 2.52 | 3.60 | 101.41 | 105.32 | 108.20 | 2.17 |
| 9 | 20(R)-Rg2 | 0.02 | 0.01 | 2.04 | 3.86 | 105.39 | 107.03 | 108.61 | 2.11 |
| 10 | F3 | 0.02 | 0.01 | 3.33 | 3.19 | 94.49 | 86.30 | 96.53 | 2.69 |
| 11 | Rb1 | 0.02 | 0.01 | 1.78 | 2.97 | 114.84 | 114.42 | 114.06 | 1.37 |
| 12 | 20(R)-Rh1 | 0.02 | 0.01 | 2.28 | 4.18 | 91.11 | 90.49 | 96.39 | 2.74 |
| 13 | Ro | 0.02 | 0.01 | 2.17 | 3.80 | 93.49 | 86.41 | 91.03 | 2.11 |
| 14 | Rc | 0.02 | 0.01 | 2.68 | 3.92 | 90.16 | 89.62 | 92.76 | 1.85 |
| 15 | Rb2 | 0.02 | 0.01 | 1.86 | 3.62 | 98.68 | 94.80 | 99.22 | 1.60 |
| 16 | F1 | 0.02 | 0.01 | 2.41 | 3.20 | 105.00 | 95.98 | 94.01 | 2.17 |
| 17 | Rb3 | 0.02 | 0.01 | 2.51 | 4.43 | 92.21 | 101.89 | 105.07 | 4.21 |
| 18 | Rd | 0.02 | 0.01 | 1.05 | 3.31 | 96.19 | 88.81 | 94.04 | 1.07 |
| 19 | F2 | 0.02 | 0.01 | 5.18 | 4.71 | 95.86 | 93.77 | 97.74 | 6.13 |
| 20 | Note-Ft1 | 0.05 | 0.02 | 7.27 | 5.90 | 105.65 | 106.86 | 109.60 | 7.73 |
| 21 | 20(S)-Rg3 | 0.02 | 0.01 | 6.17 | 4.58 | 95.60 | 107.17 | 100.73 | 6.37 |
| 22 | S-PPT | 0.05 | 0.02 | 4.49 | 3.98 | 100.42 | 98.45 | 98.60 | 3.31 |
| 23 | PPT | 0.05 | 0.02 | 1.21 | 2.38 | 88.08 | 113.21 | 114.41 | 1.82 |
| 24 | CK | 0.02 | 0.01 | 2.17 | 3.06 | 95.99 | 96.50 | 107.30 | 1.95 |
| 25 | 20(S)-Rh2 | 0.02 | 0.01 | 3.88 | 2.99 | 88.94 | 97.14 | 98.71 | 3.37 |
| 26 | 20(R)-Rh2 | 0.02 | 0.01 | 1.82 | 2.21 | 87.21 | 87.90 | 86.76 | 3.38 |
| 27 | Rh3 | 0.02 | 0.01 | 1.12 | 2.14 | 109.27 | 96.83 | 93.76 | 1.24 |
| 28 | S-PPD | 0.05 | 0.02 | 4.82 | 4.41 | 90.75 | 112.73 | 113.56 | 2.58 |
| 29 | R-PPD | 0.05 | 0.02 | 8.79 | 9.46 | 96.37 | 91.49 | 91.58 | 3.91 |
| 30 | PD | 0.05 | 0.02 | 2.71 | 4.69 | 91.21 | 93.42 | 95.21 | 3.08 |
2.5. Quantitative Evaluation of Du-Shen-Tang and the Raw Materials
| No. | Analyte | ASG | AMG | |||||
|---|---|---|---|---|---|---|---|---|
| Methanol Extract | Decoction | P b | Methanol Extract | Decoction | P b | |||
| 1 | Re a | Ginsenosides with relatively higher polarity | 3989.38 ± 1.29 | 3125.04 ± 1.56 | 0.035 | 12301.21 ± 4.49 | 12055.60 ± 4.49 | 0.004 |
| 2 | Rg1a | 8154.96 ± 2.93 | 7439.38 ± 4.62 | 0.003 | 713.49 ± 0.37 | 691.29 ± 0.44 | 0 | |
| 3 | Rf | 1072.51 ± 2.14 | 883.59 ± 0.62 | 0.01 | ND | ND | - | |
| 4 | Pseudo-F11 | ND | ND | - | 3823.27 ± 5.95 | 3169.70 ± 2.40 | 0.012 | |
| 6 | R-Note-R2 | ND | ND | - | ND | ND | - | |
| 13 | Ro | 3821.05 ± 3.72 | 1970.12 ± 0.99 | 0 | 1967.94 ± 0.55 | 1798.06 ± 1.30 | 0.005 | |
| 11 | Rb1 | 3368.43 ± 1.81 | 2328.44 ± 3.38 | 0 | 6950.76 ± 3.34 | 6766.78 ± 3.73 | 0.014 | |
| 14 | Rc | 1521.44 ± 2.56 | 989.80 ± 2.04 | 0 | 2976.80 ± 6.23 | 2860.60 ± 6.20 | 0 | |
| 15 | Rb2 | 1399.51 ± 1.78 | 945.10 ± 1.87 | 0 | 346.25 ± 0.24 | 378.31 ± 0.48 | 0.004 | |
| 17 | Rb3 | 160.92 ± 0.17 | 128.86 ± 0.26 | 0.005 | 961.18 ± 0.51 | 737.80 ± 1.30 | 0 | |
| 18 | Rd | 2564.89 ± 2.68 | 1582.96 ± 2.87 | 0 | 14986.82 ± 35.12 | 13407.25 ± 17.34 | 0 | |
| Total | 26053.09 | 19393.29 | - | 45027.72 | 41865.39 | - | ||
| 5 | Pseudo-Rt5 | Ginsenosides with relatively lower polarity | ND | ND | - | 14.28 ± 0.02 | 14.66 ± 0.03 | 0.001 |
| 7 | 20(S)-Rg2 | 93.50 ± 0.22 | 127.24 ± 0.17 | 0 | 222.41 ± 0.31 | 280.57 ± 0.47 | 0 | |
| 8 | 20(S)-Rh1 | 24.09 ± 0.04 | 112.22 ± 0.33 | 0 | ND | 18.78 ± 0.05 | 0 | |
| 9 | 20(R)-Rg2 | ND | 18.59 ± 0.03 | 0 | 5.34 ± 0.00 | 68.01 ± 0.05 | 0 | |
| 10 | F3 | ND | ND | - | ND | ND | - | |
| 12 | 20(R)-Rh1 | ND | 54.98 ± 0.08 | 0 | ND | BLOQ | - | |
| 16 | F1 | 12.81 ± 0.00 | 13.39 ± 0.01 | 0.001 | 20.02 ± 0.03 | 19.37 ± 0.04 | 0 | |
| 19 | F2 | 11.23 ± 0.01 | 12.92 ± 0.01 | 0 | 334.25 ± 0.34 | 550.33 ± 1.10 | 0 | |
| 20 | Note-Ft1 | ND | ND | - | ND | ND | - | |
| 21 | 20(S)-Rg3 | 18.09 ± 0.01 | 227.28 ± 0.15 | 0 | 27.31 ± 0.03 | 140.64 ± 0.06 | 0 | |
| 22 | S-PPT | ND | ND | - | BLOQ | BLOQ | - | |
| 23 | PT | ND | ND | - | ND | ND | - | |
| 24 | CK | ND | ND | - | 49.53 ± 0.08 | 291.09 ± 0.57 | 0 | |
| 25 | 20(S)-Rh2 | ND | ND | - | ND | 7.96 ± 0.01 | 0.001 | |
| 26 | 20(R)-Rh2 | ND | ND | - | ND | 15.34 ± 0.01 | 0 | |
| 27 | Rh3 | ND | ND | - | ND | 87.29 ± 0.03 | 0 | |
| 28 | S-PPD | ND | ND | - | 3.40 ± 0.02 | 8.22 ± 0.01 | 0 | |
| 29 | R-PPD | ND | ND | - | BLOQ | BLOQ | - | |
| 30 | PD | ND | ND | - | ND | ND | - | |
| Total | 159.72 | 556.62 | - | 676.54 | 1502.26 | - | ||
| Proportion of relatively lower to relatively higher polar ginsenosides | 0.61% | 2.87% | - | 1.50% | 3.59% | - | ||
3. Experimental
3.1. Chemicals, Reference Compounds and Samples
3.2. Sample Preparation
3.2.1. Reference Compounds Solutions
3.2.2. Ginseng Sample Solutions
3.3. Ultra High Performance Liquid Chromatography (UHPLC)
3.4. Mass Spectrometry
3.5. Method Validation
3.5.1. Linearity and Sensitivity
3.5.2. Accuracy, Precision and Stability
4. Conclusions
Acknowledgments
Author Contributions
Conflicts of Interest
References
- Chinese Pharmacopeia Commission. Pharmacopeia of the People’s Republic of China; China Medical Science Press: Beijing, China, 2010; Volume 1, pp. 8, 122. [Google Scholar]
- Qi, L.W.; Wang, C.Z.; Yuan, C.S. Isolation and analysis of ginseng: Advances and challenges. Nat. Prod. Rep. 2011, 28, 467–495. [Google Scholar] [CrossRef]
- Qi, L.W.; Wang, C.Z.; Yuan, C.S. Ginsenosides from American ginseng: Chemical and pharmacological diversity. Photochemistry 2011, 72, 689–699. [Google Scholar] [CrossRef]
- Song, C.J. Ten effective remedies and Du-Shen-Tang. Ginseng Res. 2005, 17, 2–3. [Google Scholar]
- Liu, B.C. Two cases treatment of cardiogenic shock by Du-Shen-Tang. Pract. Clin. Comb. West. Trad. Chin. Med. 2005, 5, 57–59. [Google Scholar]
- Zhen, F.H. Twenty cases treatment of expanding myocardium by Du-Shen-Tang. Chin. J. Clin. Pharmacol. Ther. 1997, 2, 12–14. [Google Scholar]
- Zhen, Y.X.; Yang, B.Y. Application of Du-Shen-Tang in obstetrics. Chendu Med. 2002, 28, 215–216. [Google Scholar]
- Wang, Y.K.; Jong, M.K.; Sang, B.H.; Seung, K.L.; Nak, D.K.; Man, K.P.; Chong, K.K.; Jeong, H.P. Steaming of ginseng at high temperature enhances biological activity. J. Nat. Prod. 2000, 63, 1702–1704. [Google Scholar] [CrossRef]
- Qi, L.W.; Wang, C.Z.; Yuan, C.S. American ginseng: Potential structure-function relationship in cancer chemoprevention. Biochem. Pharmacol. 2010, 80, 947–954. [Google Scholar] [CrossRef]
- Popovich, D.G.; Kitts, D.D. Structure-function relationship exists for ginsenosides in reducing cell proliferation and inducing apoptosis in the human leukemia (THP-1) cell line. Arch Biochem. Biophys. 2002, 406, 1–8. [Google Scholar] [CrossRef]
- Bae, E.A.; Han, M.J.; Kim, E.J.; Kim, D.H. Transformation of ginseng saponins to ginsenosides Rh2 by acids and human intestinal bacteria and biological activities of their transformants. Arch. Pharm. Res. 2004, 27, 61–67. [Google Scholar] [CrossRef]
- Liu, Y.; Zhang, J.W.; Li, W.; Ma, H.; Sun, J.; Deng, M.C.; Yang, L. Ginsenosides metabolites, rather than naturally occurring ginsenosides, lead to inhibition of human cytochrome P450 enzymes. Toxicol. Sci. 2006, 91, 356–364. [Google Scholar]
- Li, S.L.; Lai, S.F.; Song, J.Z.; Qiao, C.F.; Liu, X.; Zhou, Y.; Cai, H.; Cai, B.C.; Xu, H.X. Decoction-induced chemical transformations and global quality of Du-Shen-Tang, the decoction of ginseng evaluated by UPLC-Q-TOF-MS/MS based chemical profiling approach. J. Pharm. Biomed. Anal. 2010, 53, 946–957. [Google Scholar] [CrossRef]
- Jin, X.; Zhu, L.Y.; Shen, H.; Xu, J.; Li, S.L.; Jia, X.B.; Cai, H.; Cai, B.C.; Yan, R. Influence of sulphur-fumigation on the quality of white ginseng: A quantitative evaluation of major ginsenosides by high performance liquid chromatography. Food Chem. 2012, 135, 1141–1147. [Google Scholar] [CrossRef]
- Park, H.W.; In, G.; Han, S.T.; Lee, M.W.; Kim, S.Y.; Kim, K.T.; Cho, B.G.; Han, G.H.; Chang, I.M. Simultaneous determination of 30 ginsenosides in Panax ginseng preparations using ultra performance liquid chromatography. J. Ginseng Res. 2013, 37, 457–467. [Google Scholar] [CrossRef]
- Park, M.K.; Park, J.H.; Han, S.B.; Shin, Y.G.; Park, L.H. The determination of ginsenosides by high performance liquid chromatography-evaporative light scatering detector. Yao Wu Fen Xi Za Zhi 1996, 16, 412–414. [Google Scholar]
- Sun, B.S.; Gu, L.J.; Fang, Z.M.; Wang, C.Y.; Wang, Z.; Lee, M.R.; Li, Z.; Li, J.J.; Sung, C.K. Simultaneous quantification of 19 ginsenosides in black ginseng developed from Panax ginseng by HPLC-ELSD. J. Pharm. Biomed. Anal. 2009, 50, 15–22. [Google Scholar]
- Kim, S.N.; Ha, Y.W.; Shin, H.; Son, S.H.; Wu, S.J.; Kim, Y.S. Simultaneous quantification of 14 ginsenosides in Panax ginseng C.A. Meyer (Korean red ginseng) by HPLC-ELSD and its application to quality control. J. Pharm. Biomed. Anal. 2007, 45, 164–170. [Google Scholar] [CrossRef]
- Park, M.K.; Kim, B.K.; Park, J.H.; Shin, Y.G. Photoreactivity of anthraquinones for the analysis of ginsenosides using photoreduction fluorescence detection-HPLC. Arch. Pharm. Res. 1996, 19, 562–565. [Google Scholar] [CrossRef]
- Shangguan, D.; Han, H.; Zhao, R.; Zhao, Y.; Xiong, S.; Liu, G. New method for higH–performance liquid chromatographic separation and fluorescence detection of ginsenosides. J. Chromatogr. A 2001, 910, 367–372. [Google Scholar] [CrossRef]
- Yang, L.; Wang, Y.; Wang, L.; Xiao, H.; Wang, Z.; Hu, Z. Rapid quantification of iridoid glycosides analogues in the formulated Chinese medicine Longdan Xiegan Decoction using high-performance liquid chromatography coupled with mass spectrometry. J. Chromatogr. A 2009, 1216, 2098–2103. [Google Scholar] [CrossRef]
- Zhou, Y.; Li, N.; Choi, F.F.K.; Qiao, C.F.; Song, J.Z.; Li, S.L.; Liu, X.; Cai, Z.W.; Fu, P.P.; Lin, G.; et al. A new approach for simultaneous screening and quantification of toxic pyrrolizidine alkaloids in some potential pyrrolizidine alkaloid-containing plants by using ultra performance liquid chromatography-tandem quadrupole mass spectrometry. Anal. Chim. Acta 2010, 681, 33–40. [Google Scholar] [CrossRef]
- Wan, J.Y.; Liu, P.; Wang, H.Y.; Qi, L.W.; Wang, C.Z.; Li, P.; Yuan, C.S. Biotransformation and metabolic profile of American ginseng saponins with human intestinal microflora by liquid chromatography quadrupole time-of-flight mass spectrometry. J. Chromatogr. A 2013, 1286, 83–92. [Google Scholar] [CrossRef]
- Yi, L.; Liang, Z.T.; Peng, Y.; Yao, X.; Chen, H.B.; Zhao, Z.Z. Tissue-specific metabolite profiling of alkaloids in Sinomenii Caulis using laser microdissection and liquid chromatography-quadrupole/time of flight-mass spectrometry. J. Chromatogr. A 2012, 1248, 93–103. [Google Scholar] [CrossRef]
- Aller, M.R.; Gurny, R.; Veuthey, J.L.; Guillarme, D. Coupling ultra high–pressure liquid chromatography with mass spectrometry: Constraints and possible applications. J. Chromatogr. A 2013, 1292, 2–18. [Google Scholar] [CrossRef]
- Liang, Y.; Guan, T.; Zhou, Y.; Liu, Y.; Xing, L.; Zheng, X.; Dai, C.; Du, P.; Rao, T.; Zhou, L.; et al. Effects of mobile phase additives on qualitative and quantitative analysis of ginsenosides by liquid chromatography hybrid quadrupole-time of flight mass spectrometry. J. Chromatogr. A 2013, 1297, 29–36. [Google Scholar] [CrossRef]
- Guo, N.; Ablajan, K.; Fan, B.; Yan, H.; Yu, Y.H.; Dou, D.Q. Simultaneous determination of seven ginsenosides in Du Shen Tang decoction by rapid resolution liquid chromatography (RRLC) coupled with tandem mass spectrometry. Food Chem. 2013, 141, 4046–4050. [Google Scholar] [CrossRef]
- Mona, I.C.; Nathan, C.T.; Larry, R.M.; Daniel, R.D. Improving LC-MS sensitivity through increases in chromatographic performance: Comparisons of UPLC-ES/MS/MS to HPLC-ES/MS/MS. J. Chromatogr. B 2005, 825, 134–143. [Google Scholar] [CrossRef]
- Li, S.L.; Shen, H.; Zhu, L.Y.; Xu, J.; Jia, X.B.; Zhang, H.M.; Xu, H.X.; Lin, G.; Cai, H.; Cai, B.C.; et al. Ultra-high–performance liquid chromatography-quadrupole/time of flight mass spectrometry based chemical profiling approach to rapidly reveal chemical transformation of sulfur-fumigated medicinal herbs, a case study on white ginseng. J. Chromatogr. A 2012, 1231, 31–45. [Google Scholar] [CrossRef]
- Mandelis, A. Focus on spectroscopy. Phys. Today 2011. [Google Scholar] [CrossRef]
- Remane, D.; Meyer, M.R.; Wissenbach, D.K.; Maurer, H.H. Ion suppression and enhancement effects of co-eluting analytes in multi-analyte approaches: Systematic investigation using ultra-high–performance liquid chromatography/mass spectrometry with atmospheric-pressure chemical ionization or electrospray ionization. Rapid Commun. Mass Spectrom. 2010, 24, 3103–3108. [Google Scholar]
- Sample Availability: Samples of the compounds are available from Song-Lin Li.
© 2014 by the authors. Licensee MDPI, Basel, Switzerland. This article is an open access article distributed under the terms and conditions of the Creative Commons Attribution license ( http://creativecommons.org/licenses/by/3.0/).
Share and Cite
Zhou, S.-S.; Xu, J.-D.; Zhu, H.; Shen, H.; Xu, J.; Mao, Q.; Li, S.-L.; Yan, R. Simultaneous Determination of Original, Degraded Ginsenosides and Aglycones by Ultra High Performance Liquid Chromatography Coupled with Quadrupole Time-of-Flight Mass Spectrometry for Quantitative Evaluation of Du-Shen-Tang, the Decoction of Ginseng. Molecules 2014, 19, 4083-4104. https://doi.org/10.3390/molecules19044083
Zhou S-S, Xu J-D, Zhu H, Shen H, Xu J, Mao Q, Li S-L, Yan R. Simultaneous Determination of Original, Degraded Ginsenosides and Aglycones by Ultra High Performance Liquid Chromatography Coupled with Quadrupole Time-of-Flight Mass Spectrometry for Quantitative Evaluation of Du-Shen-Tang, the Decoction of Ginseng. Molecules. 2014; 19(4):4083-4104. https://doi.org/10.3390/molecules19044083
Chicago/Turabian StyleZhou, Shan-Shan, Jin-Di Xu, He Zhu, Hong Shen, Jun Xu, Qian Mao, Song-Lin Li, and Ru Yan. 2014. "Simultaneous Determination of Original, Degraded Ginsenosides and Aglycones by Ultra High Performance Liquid Chromatography Coupled with Quadrupole Time-of-Flight Mass Spectrometry for Quantitative Evaluation of Du-Shen-Tang, the Decoction of Ginseng" Molecules 19, no. 4: 4083-4104. https://doi.org/10.3390/molecules19044083
APA StyleZhou, S.-S., Xu, J.-D., Zhu, H., Shen, H., Xu, J., Mao, Q., Li, S.-L., & Yan, R. (2014). Simultaneous Determination of Original, Degraded Ginsenosides and Aglycones by Ultra High Performance Liquid Chromatography Coupled with Quadrupole Time-of-Flight Mass Spectrometry for Quantitative Evaluation of Du-Shen-Tang, the Decoction of Ginseng. Molecules, 19(4), 4083-4104. https://doi.org/10.3390/molecules19044083