2.1. Comparison of Cultivars and Effect of Maturity Stage
Principal Component Analysis (PCA) biplots were compiled to evaluate the association between samples, fruit attributes, TAC and phenolic composition (
Figure 1 and
Figure 2). The correlations between variables were also statistically evaluated using Pearson’s correlation coefficients (R values) (selected R values shown in
Table 2). ANOVA was performed on the average values of five pooled fruits from each of three trees (
Table 3,
Table 4 and
Table 5).
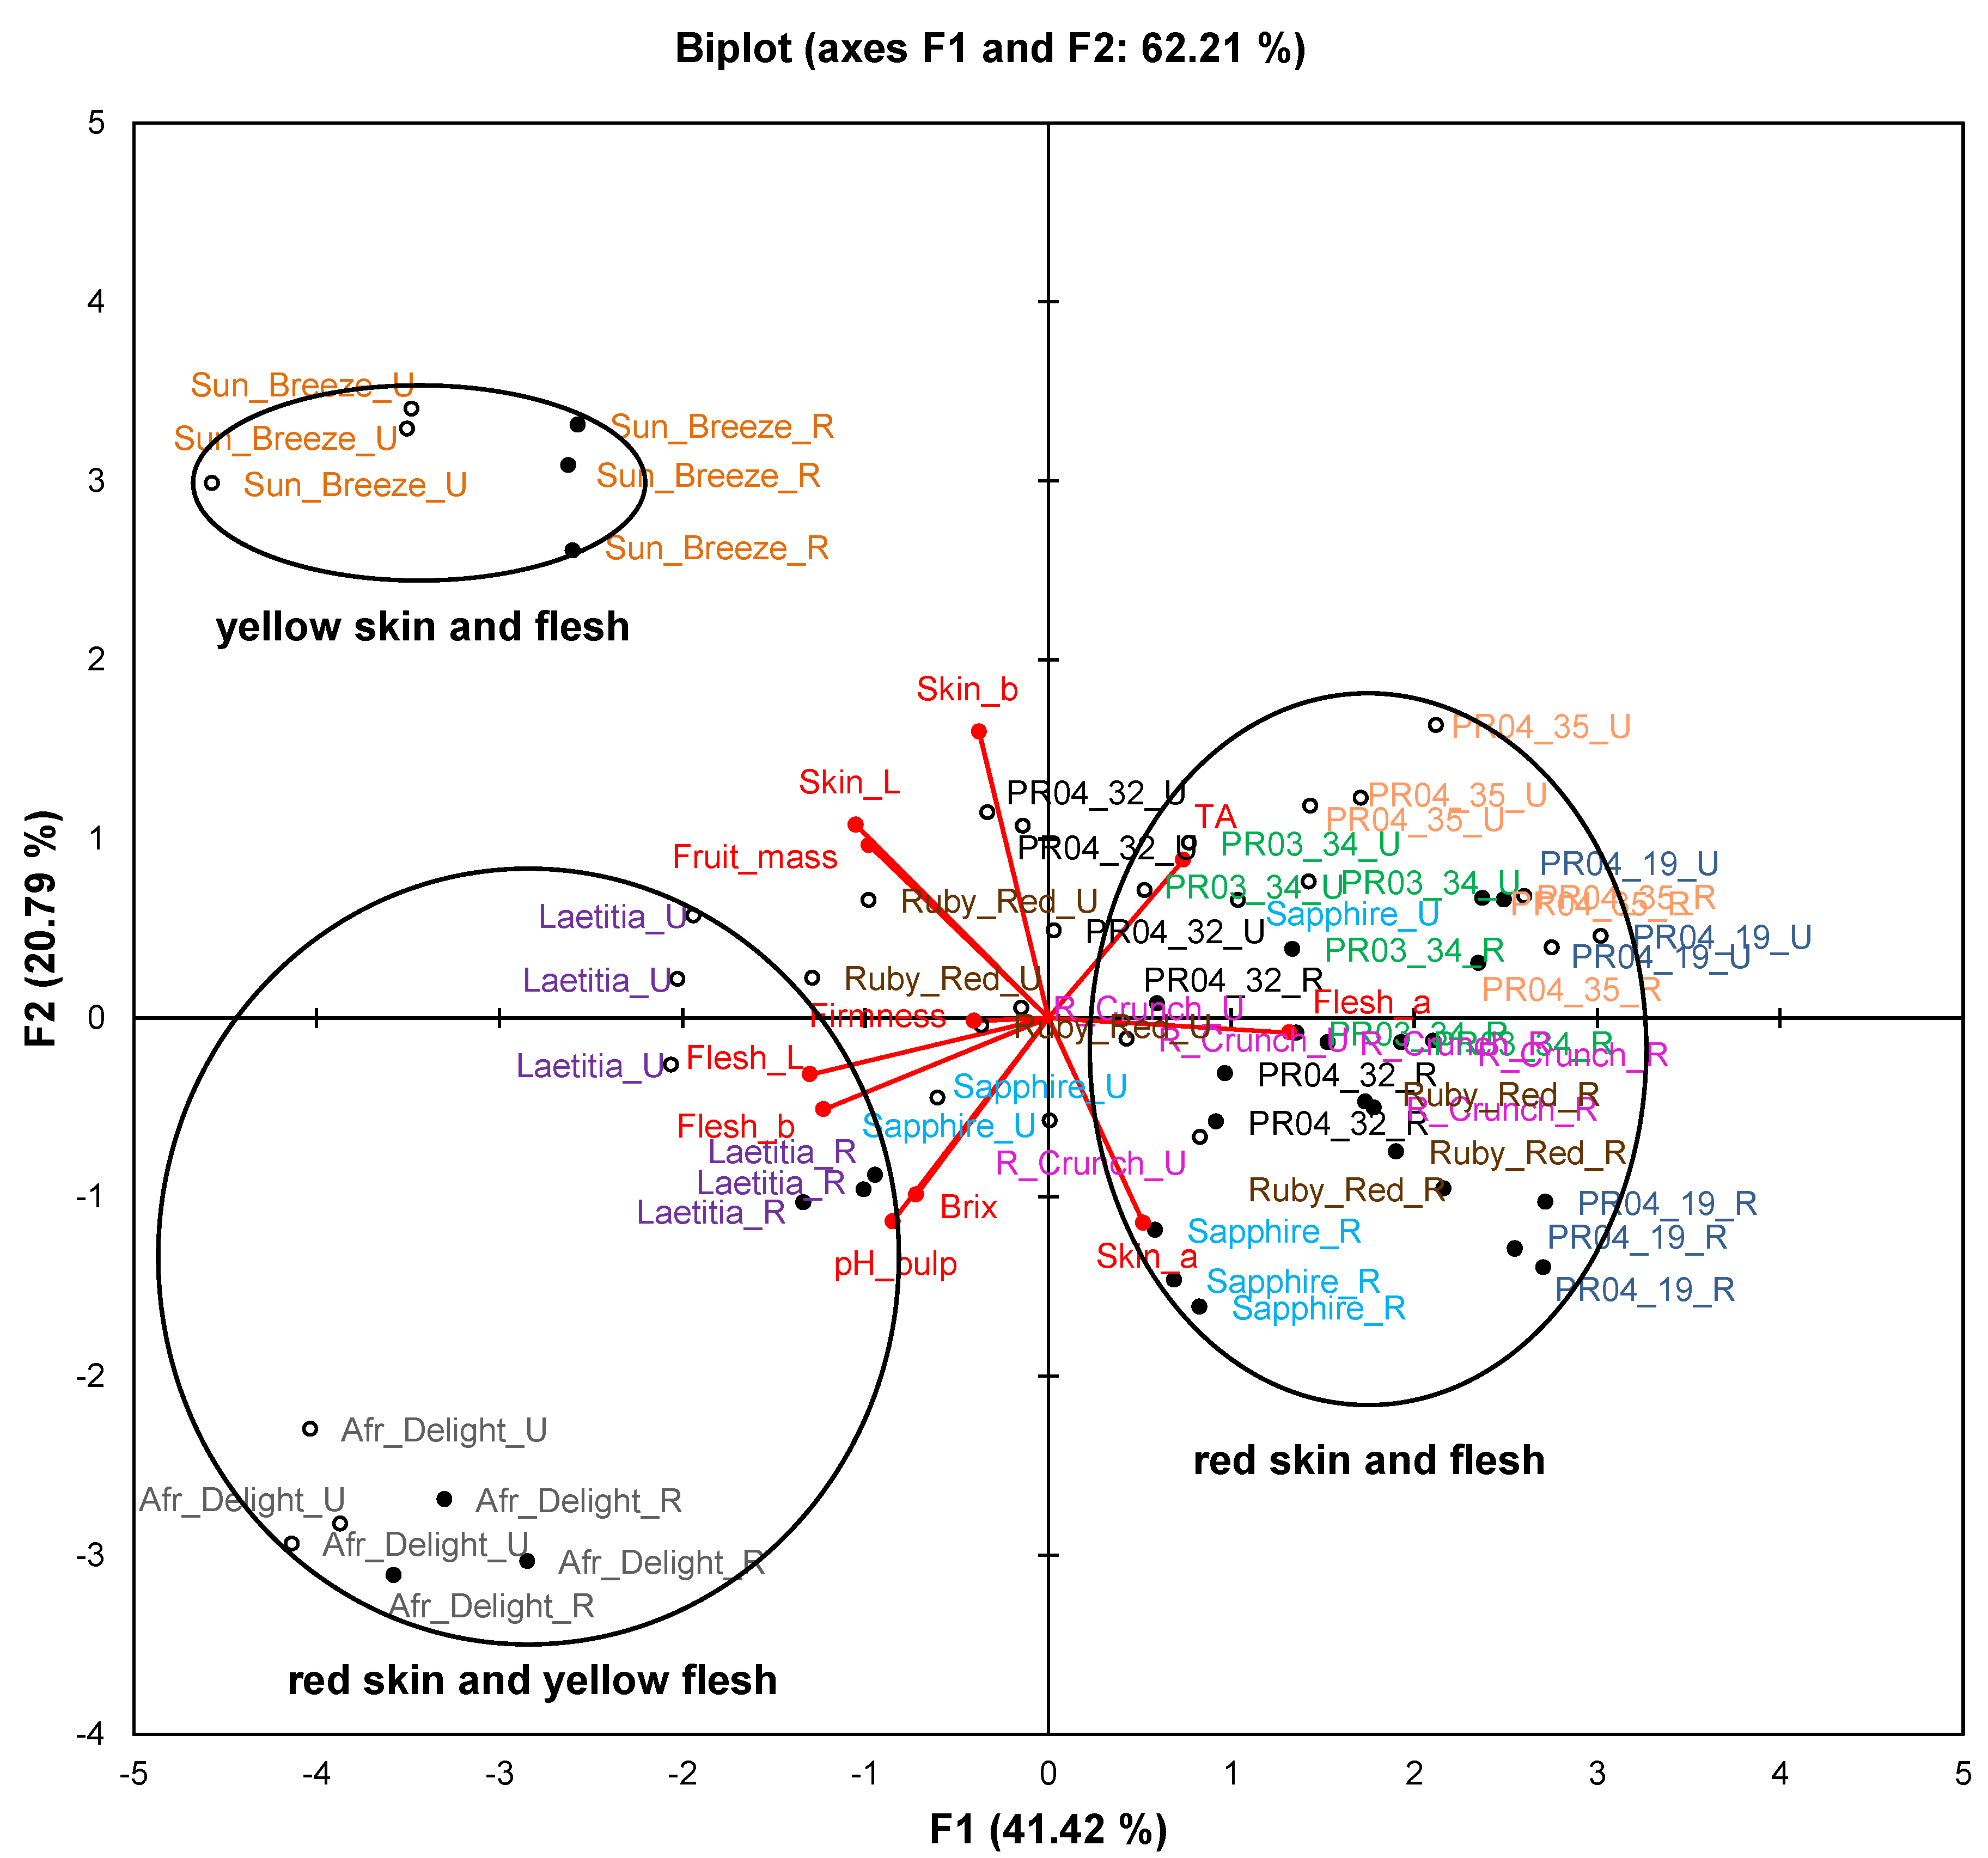
Figure 1.
Principal component biplot of fruit attributes of unripe and ripe fruits from South African plum (Prunus salicina Lindl.) cultivars and selections of the second harvest season.
Figure 1.
Principal component biplot of fruit attributes of unripe and ripe fruits from South African plum (Prunus salicina Lindl.) cultivars and selections of the second harvest season.
Abbreviations: R, ripe fruit (closed circles); TA, titratable acidity; TDS, total dissolved solids; U, unripe fruit (open circles).
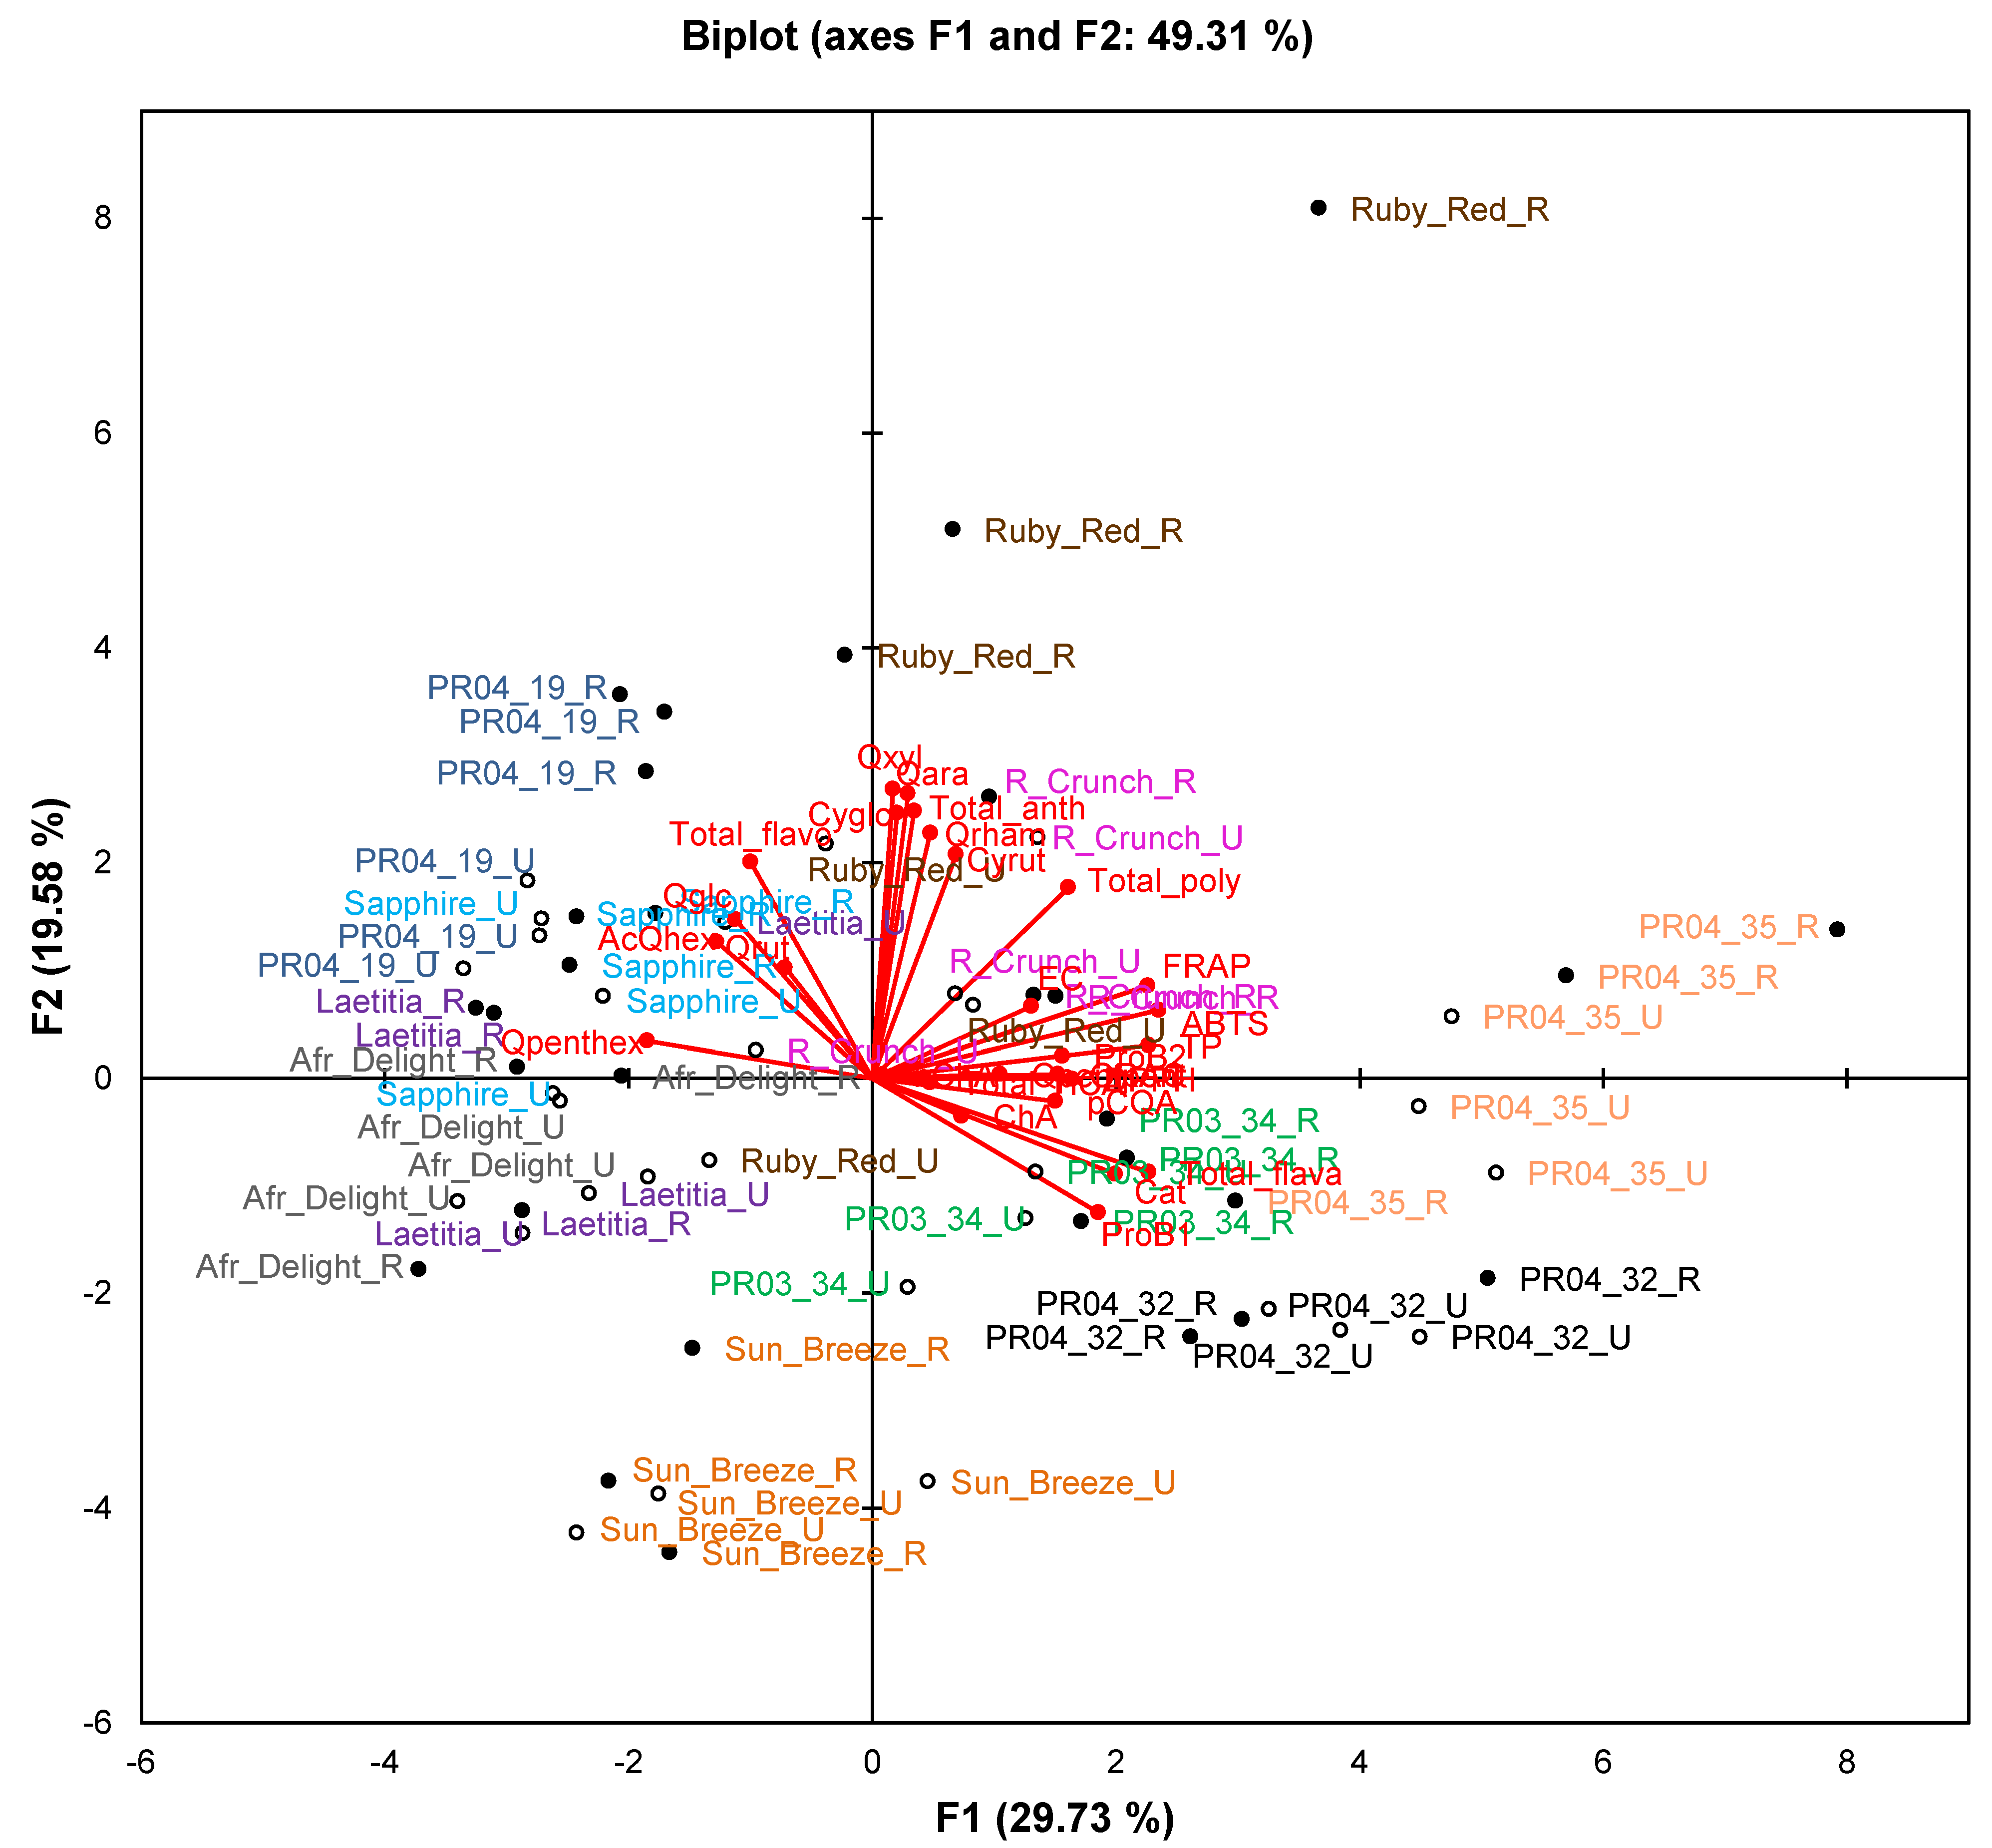
Figure 2.
Principal component biplot of phenolic composition and total antioxidant capacity of unripe and ripe fruits from South African plum (Prunus salicina Lindl.) cultivars and selections of the second harvest season.
Figure 2.
Principal component biplot of phenolic composition and total antioxidant capacity of unripe and ripe fruits from South African plum (Prunus salicina Lindl.) cultivars and selections of the second harvest season.
Abbreviations: AcQhex, quercetin-acetylhexoside; antho, anthocyanin; Cat, (+)-catechin; ChA, chlorogenic acid; Cyrut, cyanidin-3-O-rutinoside; Cyglc, cyanidin-3-O-glucoside; EC, (−)-epicatechin; flavo, flavonol; flava, flavan-3-ol; HCA, hydroxycinnamic acids; NeoChA, neochlorogenic acid; pCoumaroylq, 3-O-p-coumaroylquinic acid; ProB1, procyanidin B1; ProB2, procyanidin B2; Qara, quercetin-3-O-arabinoside; Qglc, quercetin-3-O-glucoside; Qpenthex, quercetin pentosyl-hexoside; Qpentpent, quercetin pentosyl-pentoside; Qrham, quercetin-3-O-rhamnoside; Qrut, quercetin-3-O-rutinoside; Qxyl, quercetin-3-O-xyloside; R, ripe fruit (closed circles); U, unripe fruit (open circles).
Table 2.
Correlations (r) between antioxidant capacity and selected parameters for ripe fruit from the second harvest season.
Table 2.
Correlations (r) between antioxidant capacity and selected parameters for ripe fruit from the second harvest season.
| Variables | ABTS•+a | DPPH• b | FRAP c | ORAC d | TPC e |
|---|
| Fruit mass | −0.521 ** | −0.373 * | −0.545 ** | 0.025 ns | −0.385 * |
| Flesh a* | 0.807 *** | 0.396 * | 0.740 *** | 0.403 * | 0.606 *** |
| Total anthocyanins | 0.370 * | 0.067 ns | 0.397 * | 0.052 ns | 0.149 ns |
| Total hydroxycinnamic acids | 0.132 ns | 0.094 ns | 0.252 ns | 0.102 ns | 0.382 * |
| Total flavan-3-ols | 0.712 *** | 0.542 ** | 0.642 *** | 0.577 ** | 0.723 *** |
| Total flavonols | −0.189 ns | 0.012 ns | −0.057 ns | −0.095 ns | −0.097 ns |
| TPC e | 0.914 *** | 0.724 *** | 0.950 *** | 0.482 ** | - |
Figure 1 represents fruit attributes (fruit mass, total dissolved solids (TDS), titratable acidity (TA), pH, as well as skin and flesh colour) for ripe and unripe fruit collected during the second harvest season. The biplot explains 62.2% of the variation. Samples of Sun Breeze and African Delight formed distinct clusters without any overlap with others, while samples of the other cultivars and selections formed overlapping clusters. Furthermore, observations for ripe and unripe fruit were clearly separated for all cultivars and selections.
The cultivars and selections were mainly separated on the PCA biplot (
Figure 1) along F1 based on their flesh colour and along F2 based on their skin colour. In addition, some observations of unripe fruits from red-fleshed cultivars and selections (notably Ruby Red and Sapphire) were situated in the centre of the plot corresponding to cultivars and selections where flesh colour changed from yellow to red during fruit ripening. A pronounced increase (
p < 0.05) in the flesh a*-value of Ruby Red occurred as a result of ripening, while a more modest increase (
p < 0.05) was observed for Ruby Crunch and Sapphire (
Table 3). Skin and flesh L*-values decreased significantly (
p < 0.05) from unripe to ripe fruits for most cultivars and selections, indicating darker colour (
Table 3).
The PCA biplot based on phenolic composition and TAC of cultivars/selections (
Figure 2) only explains 49.3% of the variation. Observations for selections PR04-32 and PR04-35 formed two separate clusters in the right-hand quadrants of the plot, while observations for Sun Breeze formed a separate cluster in the lower quadrants (mainly lower left) of the plot. Other cultivars and selections generally showed overlapping clusters, except ripe Ruby Red and PR04-19 samples that were also separated from other samples. The TAC measured in the ABTS
•+, DPPH
•, FRAP and ORAC assays and TPC measured in the Folin-Ciocalteau assay associated with each other and with selections PR04-32 and PR04-35. These two selections generally had the highest or among the highest TAC and TPC (
Table 4).
Table 3.
Fruit attributes of unripe and ripe fruits from South African plum (Prunus salicina Lindl.) cultivars and selections of the second harvest season a.
Table 3.
Fruit attributes of unripe and ripe fruits from South African plum (Prunus salicina Lindl.) cultivars and selections of the second harvest season a.
| Cultivar/Selection | Stage of Maturity | Fruit Mass (g) | Firmness (kg) | pH | TA b | TDS (°Brix) c | Skin a* d | Skin b* d | Skin L* d | Flesh a* d | Flesh b* d | Flesh L* d |
|---|
| Sun Breeze | Unripe | 111.3 a | 10.0 ab | 3.91 cd | 23.9 efg | 15.0 ef | −8.7 l | 25.5 a | 58.7 a | −3.0 j | 21.3 d | 47.5 c |
| | Ripe | 105.9 a | 3.0 hi | 3.97 bc | 24.5 defg | 14.3 gh | −0.5 k | 27.3 a | 58.4 a | −0.3 ij | 17.6 ef | 41.7 e |
| African Delight | Unripe | 80.7 cd | 11.1 a | 4.19 a | 14.9 h | 21.0 a | 21.9 c | 4.0 g | 48.9 b | 1.6 hi | 29.2 a | 53.9 a |
| | Ripe | 77.8 cde | 7.9 cde | 4.22 a | 12.5 h | 19.3 b | 18.8 e | −0.04 ij | 42.8 de | 2.3 hi | 27.4 b | 51.5 b |
| Laetitia | Unripe | 85.1 bc | 8.0 cd | 3.93 bcd | 30.8 c | 14.2 gh | 22.1 c | 10.4 e | 49.7 b | 2.1 hi | 26.5 b | 50.5 b |
| | Ripe | 82.9 bc | 2.7 i | 3.99 bc | 22.9 fg | 13.7 h | 21.8 cd | 1.3 hi | 41.4 ef | 4.2 gh | 23.0 c | 48.3 c |
| Ruby Crunch | Unripe | 83.8 bc | 9.0 bc | 3.86 de | 29.8 c | 15.1 ef | 12.4 j | −1.5 jk | 37.2 h | 14.8 e | 17.6 ef | 37.7 f |
| | Ripe | 81.1 bcd | 4.4 gh | 3.91 cd | 30.7 c | 14.0 gh | 12.0 j | −2.6 k | 33.3 ij | 22.0 ab | 13.1 h | 32.5 gh |
| Ruby Red | Unripe | 84.1 bc | 7.9 cd | 3.86 def | 37.8 b | 17.2 c | 19.3 e | 11.9 de | 42.0 ef | 7.0 g | 22.9 c | 44.8 d |
| | Ripe | 78.1 cde | 5.4 fg | 3.84 def | 30.4 c | 16.4 d | 15.0 hi | −1.7 jk | 29.7 kl | 20.5 abc | 12.2 hi | 30.5 ij |
| Sapphire | Unripe | 88.6 b | 3.4 hi | 3.76 ef | 29.6 cd | 15.2 ef | 13.6 ij | 1.7 ghi | 31.7 jk | 10.6 f | 21.4 d | 43.5 d |
| | Ripe | 78.5 cde | 2.4 i | 4.02 b | 20.4 g | 14.1 gh | 19.6 de | 3.2 gh | 28.0 lm | 15.6 de | 18.5 e | 38.1 f |
| PR03-34 e | Unripe | 82.2 bcd | 3.6 hi | 3.84 def | 30.1 c | 16.1 d | 16.2 fgh | 14.3 cd | 44.2 cd | 21.0 ab | 14.6 g | 33.8 g |
| | Ripe | 75.0 def | 2.9 hi | 3.93 bcd | 22.5 fg | 14.6 fg | 25.5 b | 14.5 c | 42.3 de | 20.6 abc | 11.6 i | 29.1 j |
| PR04-19 e | Unripe | 58.4 g | 7.4 cde | 3.75 f | 47.1 a | 15.4 e | 15.8 ghi | 6.9 f | 34.5 i | 21.2 ab | 12.1 hi | 31.9 hi |
| | Ripe | 50.6 h | 6.6 def | 3.98 bc | 24.4 defg | 14.5 fg | 15.2 hi | 2.8 gh | 27.5 m | 15.9 de | 7.2 j | 25.9 k |
| PR04-32 e | Unripe | 78.2 cde | 8.5 bc | 3.92 bcd | 27.6 cdef | 12.8 i | 18.4 ef | 20.2 b | 44.8 c | 18.0 cd | 21.4 d | 40.5 e |
| | Ripe | 75.0 def | 6.3 ef | 3.98 bc | 20.7 g | 12.3 i | 29.2 a | 15.1 c | 40.2 fg | 19.6 bc | 16.6 f | 36.6 f |
| PR04-35 e | Unripe | 71.0 ef | 8.8 bc | 3.77 ef | 36.7 b | 12.8 i | 18.0 efg | 13.6 cd | 43.4 cde | 20.4 abc | 12.7 hi | 33.9 g |
| | Ripe | 68.3 f | 8.9 bc | 3.79 ef | 28.8 cde | 11.4 j | 29.2 a | 13.2 cd | 39.1 gh | 23.2 a | 12.0 hi | 31.6 hi |
Table 4.
Total polyphenol content (TPC) a and total antioxidant capacity (TAC) b of unripe and ripe fruits from South African plum (Prunus salicina Lindl.) cultivars and selections of the second harvest season c.
Table 4.
Total polyphenol content (TPC) a and total antioxidant capacity (TAC) b of unripe and ripe fruits from South African plum (Prunus salicina Lindl.) cultivars and selections of the second harvest season c.
| Cultivar/Selection | Stage of Maturity | TPC a | ABTS•+ b,d | DPPH• b,e | FRAP b,f | ORAC b,g |
|---|
| Sun Breeze | Unripe | 2.56 ghi | 23.4 e | 12.6 ghij | 9.5 gh | 40.2 defg |
| | Ripe | 2.32 hi | 21.9 e | 12.5 hij | 9.0 h | 41.4 cdef |
| African Delight | Unripe | 2.62 efghi | 24.8 e | 16.4 abc | 10.6 efg | 37.5 defg |
| | Ripe | 2.65 efghi | 23.8 e | 16.4 bc | 10.5 efg | 38.4 defg |
| Laetitia | Unripe | 2.76 defgh | 24.5 e | 13.1 fghij | 10.4 efg | 36.7 defg |
| | Ripe | 2.58 fghi | 23.0 e | 12.4 hij | 9.8 gh | 35.4 defg |
| Ruby Crunch | Unripe | 2.68 efgh | 29.3 cd | 13.9 efgh | 11.7 cde | 42.5 cde |
| | Ripe | 3.02 cde | 32.1 bcd | 15.2 cde | 12.6 cd | 50.5 bc |
| Ruby Red | Unripe | 2.40 ghi | 23.2 e | 11.4 i | 9.5 gh | 58.1 ab |
| | Ripe | 2.98 cdef | 29.7 cd | 14.6 cdef | 12.5 cd | 55.4 ab |
| Sapphire | Unripe | 2.25 i | 25.0 e | 12.6 ghij | 9.3 gh | 32.0 g |
| | Ripe | 2.27 hi | 25.0 e | 13.3 fghi | 9.7 gh | 32.6 fg |
| PR03-34 h | Unripe | 2.74 efg | 29.3 cd | 13.8 efghi | 11.3 def | 44.2 cd |
| | Ripe | 2.98 defg | 33.0 bc | 15.5 cde | 12.3 cd | 42.1 cde |
| PR04-19 h | Unripe | 2.31 hi | 25.3 e | 12.0 ij | 10.0 fgh | 31.4 g |
| | Ripe | 2.62 efghi | 29.1 d | 14.4 defg | 11.8 cde | 33.7 efg |
| PR04-32 h | Unripe | 3.21 bc | 33.6 b | 18.2 a | 13.0 bc | 54.7 ab |
| | Ripe | 3.16 bcd | 32.5 bcd | 17.7 ab | 12.5 cd | 62.2 a |
| PR04-35 h | Unripe | 3.48 ab | 37.8 a | 15.8 cd | 14.2 ab | 39.1 defg |
| | Ripe | 3.83 a | 38.0 a | 15.9 bcd | 15.2 a | 44.2 cd |
Table 5.
Individual phenolic compound content (mg/kg fresh weight) of unripe and ripe fruits from South African plum (Prunus salicina Lindl.) cultivars and selections of the second harvest season a.
| Cultivar/Selection | Stage of Maturity | Cyanidin-3-O-glucoside | Cyanidin-3-O-rutinoside | Neochlorogenic Acid | Chlorogenic Acid | 3-O-p-Coumaroyl-quinic Acid | (−)-Epicatechin | (+)-Catechin | Procyanidin B1 | Procyanidin B2 |
|---|
| Sun Breeze | Unripe | ND i | ND i | 224.6 fg | ND c | 11.7 c | 9.2 ij | 81.3 e | 216.1 cd | 18.7 g |
| | Ripe | ND i | ND i | 212.7 g | ND c | 10.7 c | 8.4 ij | 75.5 ef | 204.8 cd | 17.0 gh |
| African Delight | Unripe | 29.7 ghi | 7.9 hi | 376.3 bc | 22.2 a | ND d | 12.6 i | 77.3 ef | 121.8 e | 11.5 gh |
| | Ripe | 69.3 ef | 13.1 hi | 356.0 c | 21.7 a | ND d | 5.0 j | 67.0 efg | 104.4 efg | 9.9 h |
| Laetitia | Unripe | 15.1 hi | 7.0 hi | 434.8 a | ND c | 19.3 bc | 12.7 i | 80.2 e | 115.1 ef | 10.6 gh |
| | Ripe | 52.5 fg | 15.3 h | 376.3 cd | ND c | 15.1 bc | 10.5 ij | 65.5 efg | 99.8 efg | 8.6 h |
| Ruby Crunch | Unripe | 86.3 e | 100.0 c | 56.6 h | ND c | ND d | 42.4 de | 136.3 bcd | 271.8 b | 37.1 e |
| | Ripe | 230.0 b | 120.4 b | 57.5 h | ND c | ND d | 42.4 de | 156.9 abc | 243.9 bc | 34.4 ef |
| Ruby Red | Unripe | 33.1 gh | 19.3 gh | 409.9 ab | ND c | 20.5 bc | 59.5 b | 64.8 efg | 81.2 fg | 62.8 b |
| | Ripe | 474.9 a | 85.0 c | 433.0 a | ND c | 23.4 b | 57.6 b | 56.4 efg | 64.9 gh | 52.6 c |
| Sapphire | Unripe | 177.4 c | 31.3 efg | ND i | ND c | ND d | 48.0 cd | 61.8 efg | 75.8 fgh | 53.7 c |
| | Ripe | 231.6 b | 56.5 d | ND i | ND c | ND d | 51.5 c | 60.9 efg | 73.5 gh | 47.6 cd |
| PR03-34 b | Unripe | 189.6 c | 48.5 de | 237.2 efg | 11.6 b | 113.8 a | 19.0 h | 120.5 d | 199.6 d | 15.6 gh |
| | Ripe | 232.8 b | 55.5 d | 255.6 def | 11.4 b | 115.4 a | 22.4 h | 122.2 cd | 216.6 cd | 16.6 gh |
| PR04-19 b | Unripe | 235.6 b | 118.9 b | 9.1 i | ND c | ND d | 47.5 cd | 43.3 fg | 36.6 hi | 28.2 f |
| | Ripe | 484.7 a | 161.5 a | 8.4 i | ND c | ND d | 43.4 de | 34.1 g | 22.5 i | 17.1 gh |
| PR04-32 b | Unripe | 48.1 fg | 28.9 fg | 83.3 h | ND c | ND d | 101.3 a | 167.8 ab | 199.2 d | 96.6 a |
| | Ripe | 70.4 ef | 33.2 ef | 73.5 h | ND c | ND d | 97.1 a | 154.7 abcd | 194.0 d | 90.3 a |
| PR04-35 b | Unripe | 129.3 d | 95.7 c | 269.1 de | 21.6 a | 109.5 a | 34.4 g | 184.5 a | 270.2 b | 40.3 de |
| | Ripe | 159.9 cd | 95.4 c | 284.5 d | 22.4 a | 117.3 a | 38.8 ef | 133.7 bcd | 328.6 a | 52.3 c |
| Cultivar/Selection | Stage of Maturity | Quercetin-3-O-rutinoside | Quercetin-3-O-glucoside | Quercetin-3-O-arabinoside | Quercetin-3-O-rhamnoside | Quercetin-3-O-xyloside | Quercetin pentosyl-hexoside | Quercetin pentosyl-pentoside | Quercetin-acetylhexoside |
|---|
| Sun Breeze | Unripe | NQ i | 8.9 j | 10.1 j | 3.9 fgh | 2.3 j | 4.7 de | 2.6 cd | ND e |
| | Ripe | NQ i | 13.3 ij | 12.7 j | 5.9 defgh | 3.0 ghij | 4.8 de | 2.4 de | 0.9 de |
| African Delight | Unripe | 65.5 c | 114.3 b | 15.9 ij | 3.6 gh | 2.7 hij | 8.7 bc | 0.9 fg | 20.5 a |
| | Ripe | 70.2 c | 129.4 a | 11.7 j | 3.3 h | 2.6 ij | 8.6 bc | 1.4 f | 18.3 ab |
| Laetitia | Unripe | 49.2 d | 40.6 ef | 28.8 defgh | 9.5 bc | 4.6 defg | 4.9 de | 1.7 ef | 22.3 a |
| | Ripe | 62.6 c | 69.8 d | 26.3 fghi | 8.1 bcde | 4.3 defghi | 4.5 e | 1.4 f | 21.8 a |
| Ruby Crunch | Unripe | 82.8 b | 51.1 e | 40.7 bc | 10.0 bc | 6.7 bc | 6.0 d | NQ h | 4.4 de |
| | Ripe | 92.9 a | 87.8 c | 25.2 ghi | 6.8 cdefg | 4.4 defgh | 4.5 e | NQ h | 3.0 de |
| Ruby Red | Unripe | 15.0 fgh | 20.4 hi | 44.3 ab | 15.4 a | 7.5 ab | ND f | 4.2 ab | 12.6 c |
| | Ripe | 28.8 e | 93.0 c | 52.7 a | 17.0 a | 9.2 a | ND f | 4.2 a | 14.1 bc |
| Sapphire | Unripe | 20.7 efg | 65.6 d | 38.9 bcde | 8.3 bcde | 5.8 bcd | 7.6 c | 3.4 bc | 12.4 c |
| | Ripe | 23.3 ef | 65.8 d | 39.9 bcd | 8.4 bcd | 6.0 bcd | 7.4 c | 3.4 abc | 11.9 c |
| PR03-34 b | Unripe | 10.6 h | 22.4 ghi | 19.9 hij | 4.9 efgh | 3.3 fghij | 5.9 d | 3.0 cd | 4.8 de |
| | Ripe | 11.7 gh | 25.2 gh | 20.3 hij | 5.0 efgh | 3.3 efghij | 5.6 de | 2.8 cd | 5.2 d |
| PR04-19 b | Unripe | 18.7 fgh | 33.0 fg | 36.7 bcdef | 8.0 bcde | 5.3 cd | 10.2 a | 1.1 fg | 11.6 c |
| | Ripe | 22.4 ef | 48.1 e | 34.0 bcdefg | 7.2 cdef | 5.2 cde | 9.3 ab | 0.4 gh | 10.1 c |
| PR04-32 b | Unripe | 9.4 hi | 13.8 hij | 18.2 hij | 3.9 fgh | 2.9 ghij | ND f | 3.4 abc | 5.1 d |
| | Ripe | 9.8 h | 13.6 ij | 19.3 hij | 3.7 gh | 2.9 ghij | ND f | 3.3 cd | 4.5 de |
| PR04-35 b | Unripe | 12.7 gh | 15.1 hij | 28.5 efgh | 10.0 bc | 5.0 cdef | ND f | 3.1 cd | 5.1 d |
| | Ripe | 11.8 gh | 15.1 hij | 32.1 cdefg | 11.1 b | 5.4 cd | ND f | 3.1 cd | 4.9 d |
The TAC and TPC of various
P. salicina and
P. domestica plum cultivars grown outside South Africa have been shown to vary considerably between cultivars and selections [
12,
13,
14,
15,
22]. Similarly, in the current study, large variation was observed between South African cultivars and selections (
Table 4). Values for South African cultivars and selections were in the high range compared to literature values when recalculated to the same units. It was expected that Sun Breeze, a yellow-skinned and -fleshed cultivar, would display lower TAC values and TPC relative to the other cultivars and selections due to the absence of anthocyanins, which make up a large part of the total polyphenols of other plum varieties (
Table 5). Red fruits also display high TPC and TAC values compared with other fruits (e.g., [
4,
5,
22]). Sun Breeze had among the lowest TAC and TPC values, but these values were not significantly lower than those of Laetitia, African Delight, Sapphire and PR04-19 in most cases. Previous studies on plums (
P. domestica) showed that plums with yellow and red skins displayed lower TAC values and TPC than plums with blue or purple skin [
13]. The a*-value of the flesh was positively correlated (
p < 0.01) with TAC determined using the ABTS
•+, DPPH
• and FRAP assays and TPC indicating that red-fleshed plums tend to have higher TAC and TPC, although this was not the case for all cultivars and selections. African Delight (yellow-fleshed) was a notable exception with regard to TAC in the DPPH
• assay, showing similar TAC as red-fleshed cultivars and selections, while unripe fruits of some red-fleshed cultivars and selections had relatively low TAC and TPC. These results highlight the fact that fruit varieties with red flesh, which is often marketed as more “healthy” does not necessarily have higher nutraceutical value, in terms of TAC and TPC, than yellow-fleshed varieties of the same species. Different flavonoid sub-classes may, however, differ in their bioavailability and
in vivo bioactivity. Recently, higher intake of anthocyanin-rich foods was shown to be associated with lower levels of inflammation and improvements in insulin resistance [
23], indicating a possible benefit for intake of fruits with higher anthocyanin content.
Ruby Red and PR04-19 plums showed a significant (
p < 0.05) increase in TAC in the ABTS
•+, DPPH and FRAP assays from unripe to ripe fruit, while the same trend was observed for TPC of only Ruby Red plums (
Table 4). For many other cultivars and selections increases in TAC and TPC from unripe to ripe fruit, although not significant (
p ≥ 0.05), were also observed. According to the literature, the TAC of plums tends to increase during cold storage and/or ripening. Karaman
et al. [
24] found the TAC of plums (
P. salicina) to increase during 28 days of storage at 0 °C according to the ABTS
•+ and FRAP assays. Kevers
et al. [
25] reported that the TAC (ORAC and DPPH
• assays) and TPC of plums increased during the initial 15 days of storage at room temperature which can be related to ripening of the fruit, where after a decrease was observed. The same trend was observed for the TPC. Mihalache Arion
et al. [
26] also observed an increase in TAC (DPPH
• and ORAC assays) and TPC in autumn plum varieties after 10 days of storage at 4 °C. Usenik
et al. [
18] reported no significant changes in TPC during ripening of
P. domestica plums.
Individual phenolic compounds were identified previously by comparing the retention times and UV-Vis spectra of peaks to those of authentic reference standards where available. Compounds for which no authentic reference standards were available were tentatively identified based on UV-Vis, retention time and mass spectrometric data in one sample of each cultivar/selection under investigation [
21].
Cyanidin-3-
O-glucoside and -rutinoside are some of the major polyphenols in plums with red skin and/or flesh [
13,
16]. Cyanidin-3-
O-glucoside was the predominant anthocyanin in South African plums (
Table 5). The cyanidin-3-
O-glucoside content of ripe PR04-19 and Ruby Red fruits was substantially higher (
p < 0.05) than that of the other cultivars and selections. PR04-19 (ripe) had a significantly higher cyanidin-3-
O-rutinoside content (161.5 mg/kg fresh weight (FW)) than other cultivars. Ripe red-fleshed plums tended to have higher anthocyanin content than the ripe red-skinned and yellow-fleshed plums. Notable, however, was ripe PR04-32 fruits, which had relatively low anthocyanin content among the red-fleshed plums. Similar results have been obtained previously for peach and plum genotypes [
12]. Both the cyanidin-3-
O-glucoside and -rutinoside contents of Ruby Red and PR04-19 were substantially (
p < 0.05) higher for ripe fruits compared to unripe fruits, while moderately higher (
p < 0.05) values were observed for cyanidin-3-
O-glucoside content of all cultivars and selections, except Sun Breeze, PR04-32 and PR04-35, and the cyanidin-3-
O-rutinoside content of Sapphire and Ruby Crunch. This can be explained by the accumulation of anthocyanins during ripening as shown in plums [
18,
27] and strawberries [
28]. The accumulation of anthocyanins in plums is related to darker flesh and skin colour (lower flesh and skin L* value) as observed in some cultivars and selections.
Neochlorogenic acid, a hydroxycinnamic acid, is one of the predominant polyphenols in plums [
13], with the highest quantity in the current study present in unripe Laetitia fruits (434.8 mg/kg FW; unripe) (
Table 5). Ruby Red and African Delight fruits also had very high neochlorogenic acid content of more than 350 mg/kg FW. Neochlorogenic acid was not present in Sapphire fruits, while chlorogenic acid was present only in African Delight, PR03-34 and PR04-35 fruits, and at much lower concentrations (<30 mg/kg FW) than neochlorogenic acid. 3-
O-
p-Coumaroylquinic acid was also not ubiquitously present with PR03-34 and PR04-35 fruits having much higher contents (>100 mg/kg FW) than other cultivars and selections (not detected - 23.4 mg/kg FW). The hydroxycinnamic acid content was generally not affected by maturity stage, except that the neochlorogenic acid content of ripe Laetitia plums were lower than that of the unripe fruits.
Plum fruits also contained high levels of flavan-3-ols (
Table 5), namely (+)-catechin, (−)-epicatechin, procyanidin B1 and procyanidin B2, with total flavan-3-ol contents between 100 and 600 mg/kg FW. PR04-32 had significantly (
p < 0.05) higher (−)-epicatechin and procyanidin B2 contents than other cultivars and selections and among the highest (+)-catechin content, while PR04-35 had relatively high (+)-catechin and procyanidin B1 contents. The PCA biplot shows that procyanidin B2 and (−)-epicatechin were closely associated with one another, while procyanidin B1 and (+)-catechin were closely associated. In most cultivars or selections procyanidin B1 and (+)-catechin were present at higher levels than procyanidin B2 and (−)-epicatechin, except for Sapphire, Ruby Red and PR04-19 which had similar levels of these four compounds. Stage of maturity generally did not affect the individual flavan-3-ol contents. However, ripe PR04-35 plums contained significantly (
p < 0.05) more (−)-epicatechin, procyanidin B1 and procyanidin B2 than the unripe fruits, while the opposite trend was observed for procyanidin B2 content of Ruby Red plums.
In the flavonol group, quercetin-3-
O-glucoside was predominant in most cultivars and selections, with African Delight having a significantly (
p < 0.05) higher content than the other cultivars and selections (
Table 5). Ruby Crunch and Ruby Red had the highest (
p < 0.05) quercetin-3-
O-rutinoside and -rhamnoside content, respectively. The quercetin-3-
O-glucoside content was significantly (
p < 0.05) higher in ripe fruits of African Delight, Laetitia, Ruby Red, Ruby Crunch and PR04-19 compared to unripe fruits. However, the content of other flavonol compounds were similar for both ripe and unripe fruits of most cultivars and selections with a few exceptions. Ozturk
et al. [
29] found that the quercetin-3-
O-rutinoside content of Black Amber (
P. salicina) plums increased after 28 days at 0 °C storage. However, flavonol aglycones (quercetin and kaempferol) decreased during the same storage period. Olsson
et al. [
30] found that the quercetin content of strawberries increased with ripening, as well as cold storage at 4 °C.
Generally, large variation in the phenolic composition of the different South African plum cultivars and selections was observed. This was to be expected as a previous study by Mubarak
et al. [
14], comparing 29 Australian plum selections, found great variation regarding the contents of neochlorogenic acid, chlorogenic acid, quercetin-3-
O-rutinoside and (-)-epicatechin between selections.
The Pearson’s correlation matrix showed some interesting correlations between TAC and other measured parameters (
Table 2). Significant (
p < 0.05) negative correlations (
r from −0.376 to −0.545) were observed between the fruit mass and TAC, except for the ORAC assay (
r = 0.025;
p ≥ 0.05). A possible reason for the greater TAC of smaller fruit is the higher skin-to-flesh ratio. Phenolic compounds are more concentrated in the skin of plum fruit [
31,
32] and would thus provide a greater contribution to the TAC of smaller fruit. The total flavan-3-ol content was significantly (
p < 0.01) correlated (
r from 0.542 to 0.712) with TAC in all the assays, while the total anthocyanin content significantly (
p < 0.05) correlated with TAC in the ABTS
•+ and FRAP assays. No significant (
p ≥ 0.05) correlations were observed for total flavonols and hydroxycinnamic acid contents with TAC. Flavan-3-ols were shown to contribute greatly to the antioxidant capacity of plum fruits using on-line antioxidant assays [
21]. The high TAC displayed by PR04-32 and PR04-35 are likely explained by their relatively high flavan-3-ol content.
The high contribution of flavan-3-ols to the TAC of plum fruits can be explained based on their structural features. The structure of phenolic compounds greatly affects their ability to act as antioxidants. For example, the flavonoids are known to be effective radical scavengers due to presence of the catechol group [
33], while hydroxycinnamic acids act as radical scavengers through hydrogen donation from the carboxyl side-chain (as reviewed by El–Seedi
et al. [
34]). Structural features conferring high antioxidant activity to flavan-3-ols include the catechol group on the B-ring and unobstructed 3-OH group. Tsao
et al. [
35] used the FRAP assay to compare antioxidant activity of various phenolic compounds and found that procyanidin B1, procyanidin B2 and (−)-epicatechin exhibited a higher TAC than quercetin-3-
O-glycosides and chlorogenic acid. Tabart
et al [
36] found that phenolic acids exhibited lower TAC than flavonols, flavan-3-ols and anthocyanins as determined with the ORAC assay, and lower than flavan-3-ols with the DPPH
• assay. Differences observed between assays can be attributed to the fact that antioxidants have a multifunctional nature and the assays are based on different mechanisms. The DPPH
• and ABTS
•+ assays are based on the ability of the antioxidant to scavenge a synthetic radical, and the ORAC assay measures the ability of an antioxidant to act against peroxyl radicals [
37]. Although the DPPH
• and ABTS
•+ assays are both based on radical scavenging, the DPPH
• assay is based on electron transfer, while ABTS
•+ is based on hydrogen donation [
37].
2.2. Comparison of Harvest Seasons
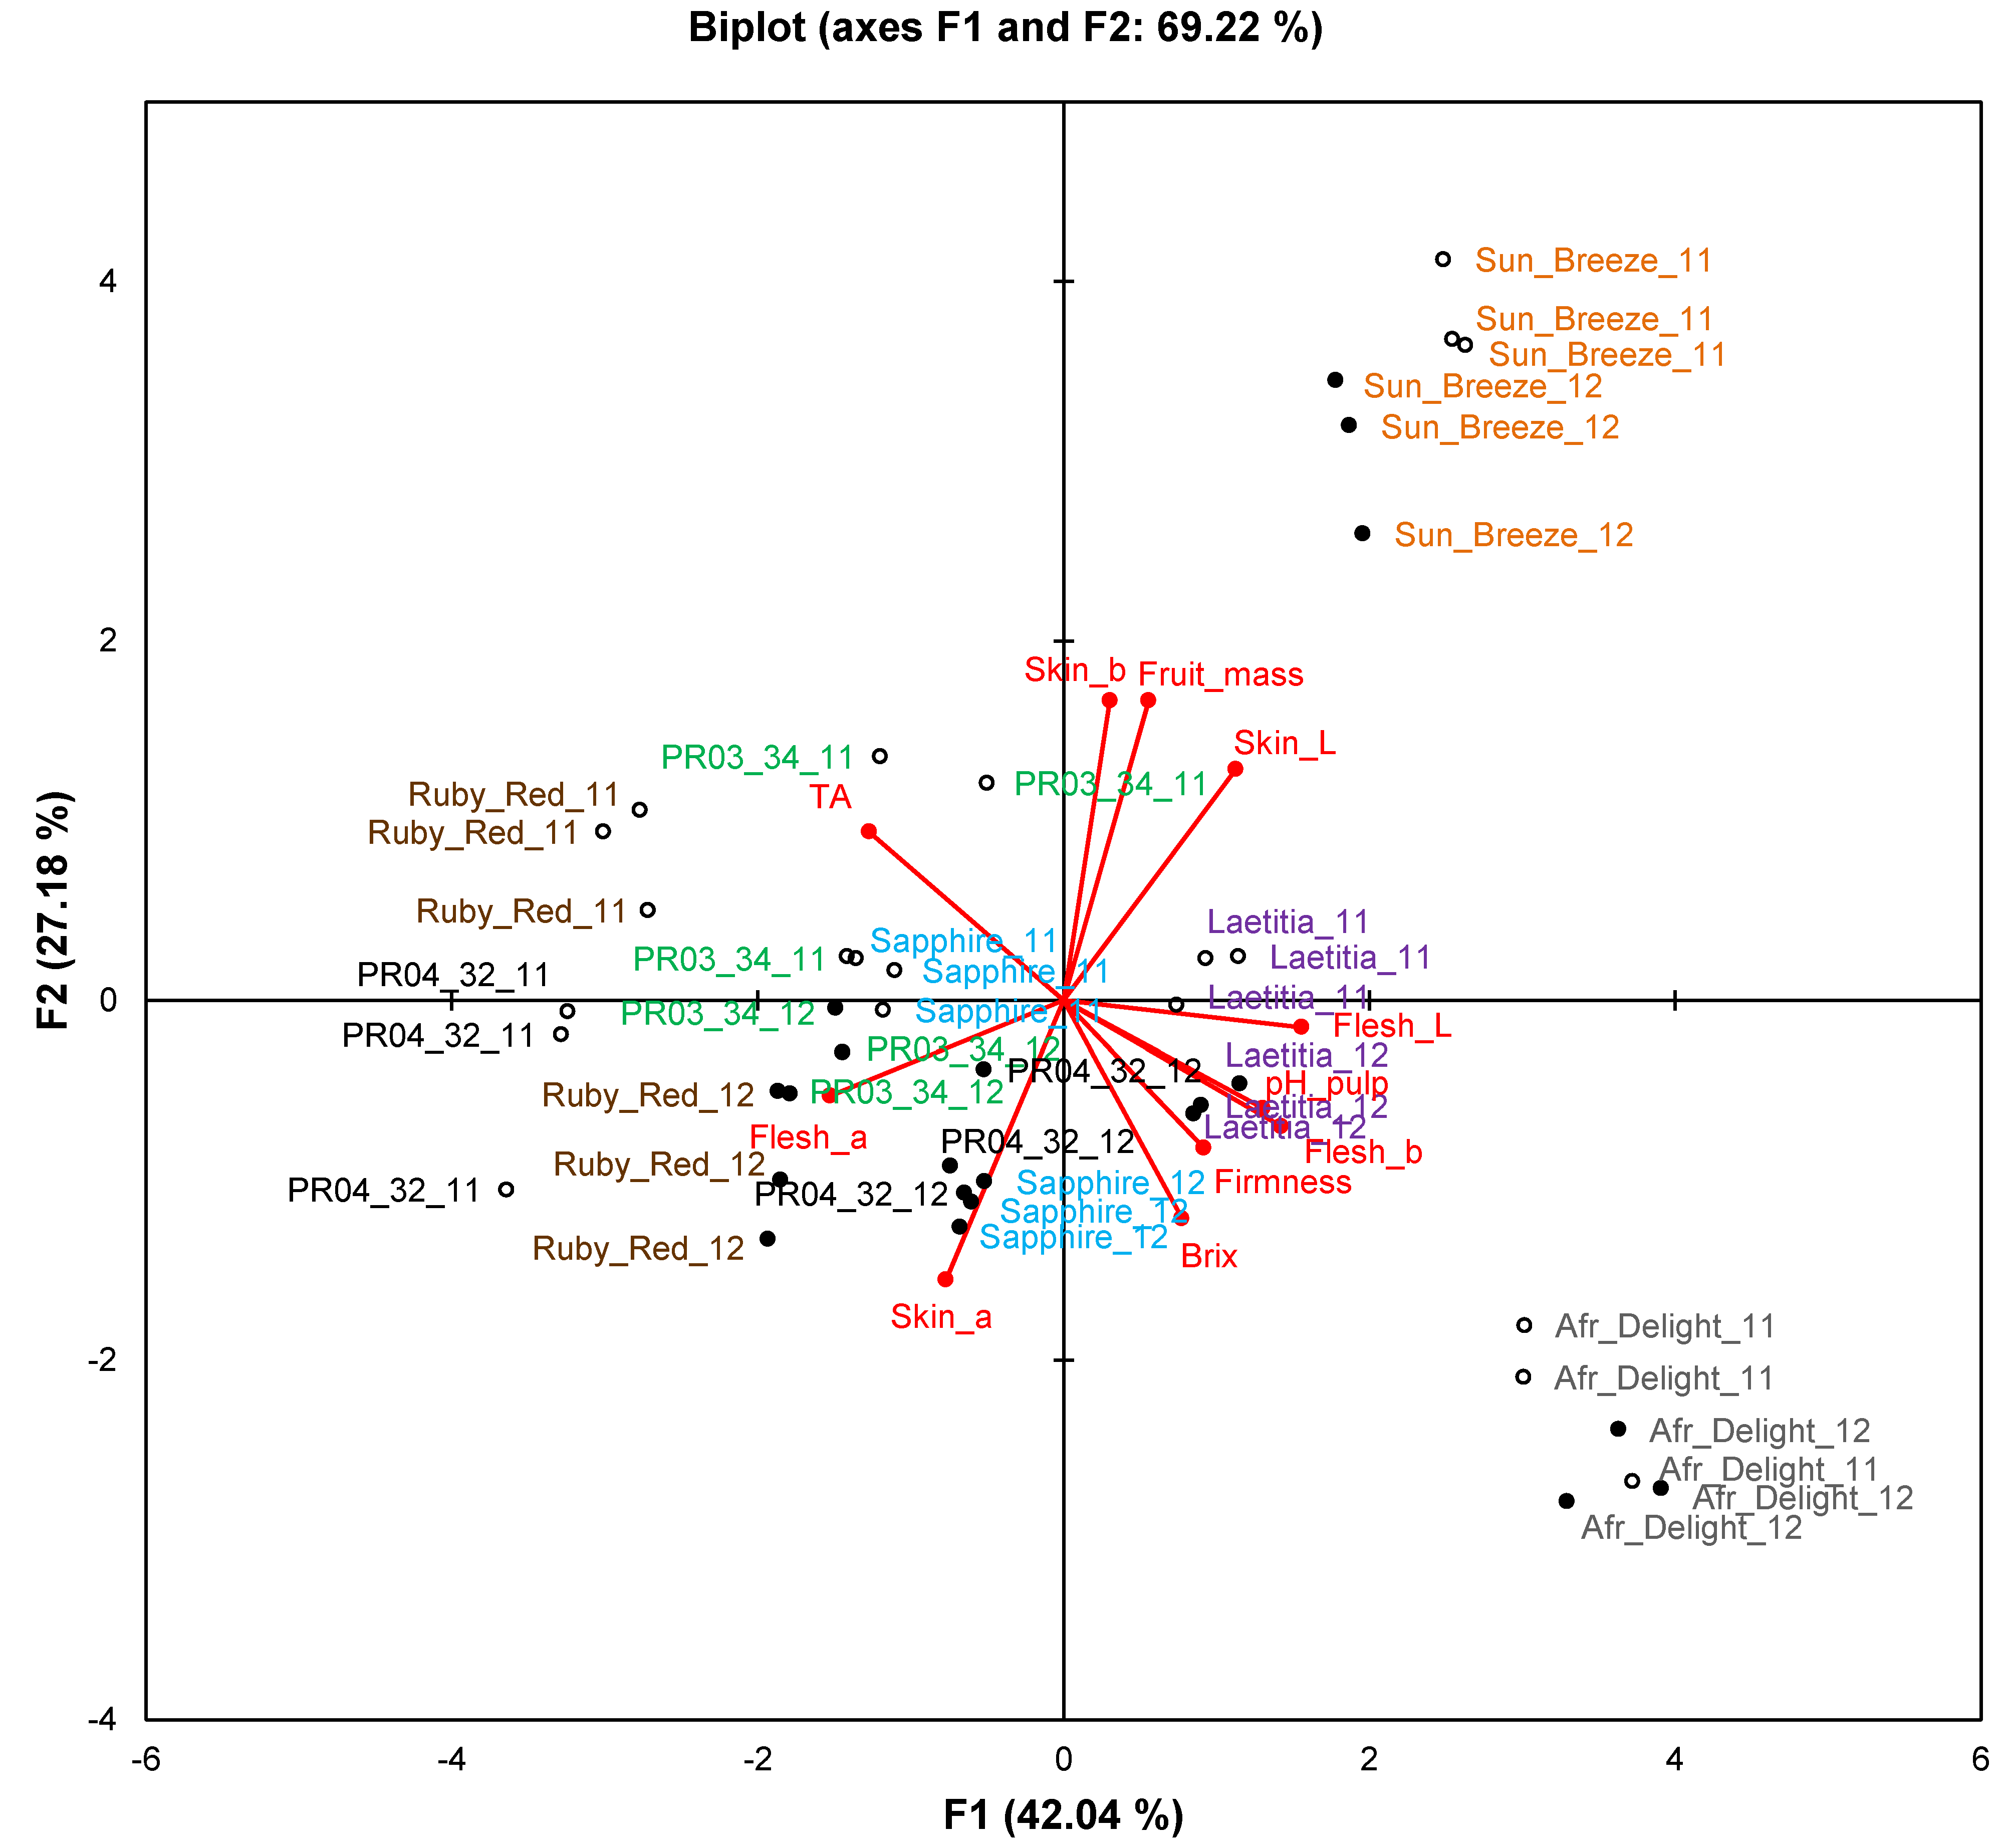
Only data for ripe fruits will be discussed in this section to compare the two consecutive harvest seasons. The biplot for fruit attributes (
Figure 3) explains 69.2% of the variation. Observations formed separate clusters for the respective seasons, indicating that the two seasons differed from one another in terms of fruit attributes. Overlap between seasons was only observed for African Delight. No single fruit attribute was responsible for this phenomenon as evidenced by ANOVA results (
Table 6). Fruit mass was generally similar between harvest seasons with only Laetitia, Ruby Red and PR03-34 having a significantly (
p < 0.05) higher fruit mass in the first harvest season. The pH of Sun Breeze, Sapphire, Ruby Red and PR04-32 fruits were significantly (
p < 0.05) higher in the second harvest season, while the TA of African Delight and Laetitia was significantly (
p < 0.05) higher and that of Sapphire, Ruby Red and PR04-32 was significantly (
p < 0.05) lower in the second harvest season. The TDS of Sun Breeze, Ruby Red and PR04-32 was significantly (
p < 0.05) higher in the second harvest season. Trends for fruit colour attributes were cultivar-dependent with that of African Delight, Laetitia and Ruby Red not significantly (
p ≥ 0.05) affected by harvest season.
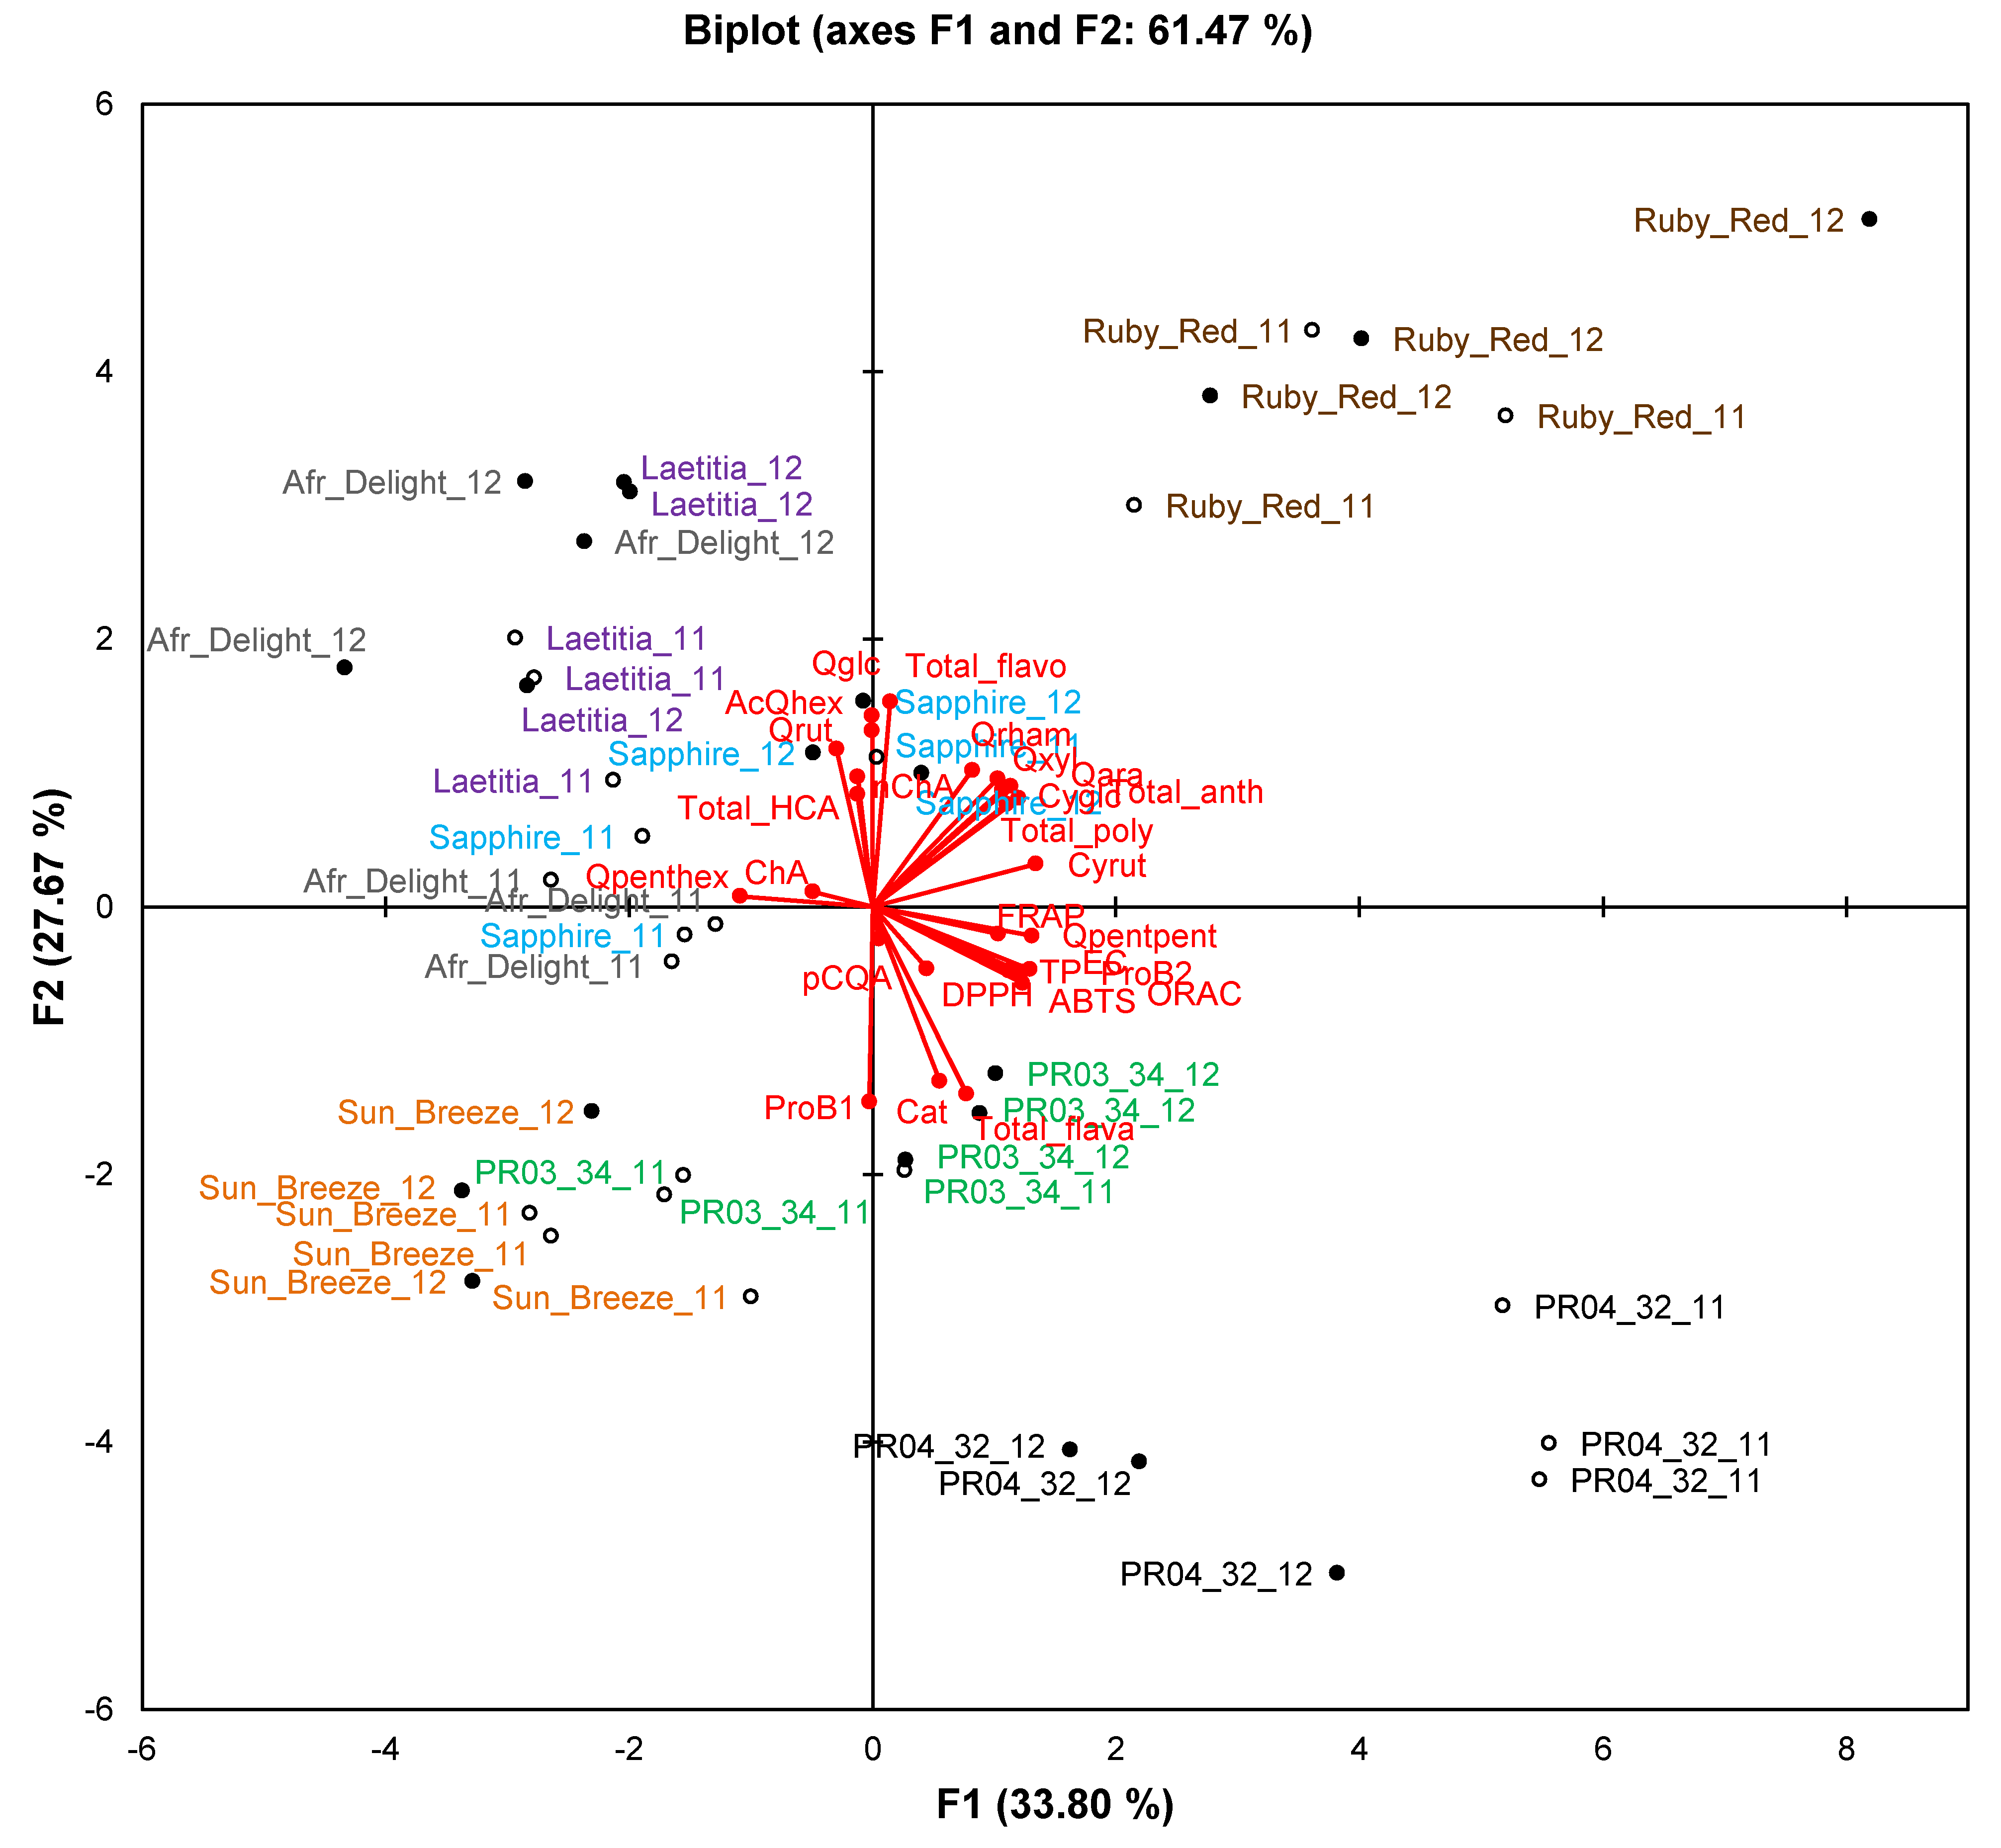
On the PCA biplot for phenolic composition and TAC (61.5% of variation explained), clear separation between seasons was seen only for African Delight and PR04-32 (
Figure 4). Clusters for a specific cultivar retained their general spatial distribution on the biplot, indicating that seasonal effects did not obscure cultivar differences.
Among the TAC assays, the ORAC assay showed no significant (
p ≥ 0.05) effect for harvest season, while all values obtained using the DPPH
• assay in the first harvest season were higher than in the second harvest season (
Table 7). TAC values obtained using the ABTS
•+ and FRAP assays were generally not affected by harvest season except that PR03-34 and PR04-32 showed higher and lower values, respectively, for the second harvest season. The TPC obtained using the Folin-Ciocalteau assay showed a trend similar to that of the ORAC assay.
The phenolic composition of fruits was affected by harvest season, but trends were specific to each cultivar (
Table 8). Generally, few significant changes were observed for the anthocyanin content between harvest seasons. The only exceptions were PR03-34, for which cyanidin-3-
O-glucoside showed a significant increase (
p < 0.05) from the first to the second season, and PR04-32 for which the content of both anthocyanins decreased significantly (
p < 0.05). Among the hydroxycinnamic acids, the chlorogenic and 3-
O-
p-coumaroylquinic acid contents of PR03-34 were significantly (
p < 0.05) higher in the second harvest season, while the same trend was observed for neochlorogenic acid content of Ruby Red. The content of some individual flavan-3-ols were significantly (
p < 0.05) lower in the second harvest season for Sun Breeze ((+)-catechin), African Delight ((−)-epicatechin, (+)-catechin and procyanidin B1), Laetitia ((+)-catechin) and PR04-32 ((−)-epicatechin and (+)-catechin). Overall, the individual flavonol content of cultivars and selections was either unaffected by season, or was significantly (
p < 0.05) higher in the second harvest season, except in the case of Ruby Red and PR04-32. For both, the quercetin-3-
O-rutinoside content was significantly (
p < 0.05) lower in the second harvest season, while the same trend was observed for quercetin-acetylhexoside content of PR04-32.
Figure 3.
Principal component biplot of fruit attributes of ripe fruits from South African plum (Prunus salicina Lindl.) cultivars and selections of two consecutive harvest seasons.
Figure 3.
Principal component biplot of fruit attributes of ripe fruits from South African plum (Prunus salicina Lindl.) cultivars and selections of two consecutive harvest seasons.
Abbreviations: 11, first harvest season (2010/2011; open circles); 12, second harvest season (2011/2012; closed circles); Refer to
Figure 1 for other abbreviations.
By comparing two harvest seasons it is evident that season affects the composition of fruit, but that it does not obscure cultivar differences. Due to the diversity of fruit attributes, phenolic content and TAC, specific trends could not be assigned for changes from one season to the next. In a study by Kim
et al. [
20], plum cultivars (
P. domestica) grown in New York were compared in terms of phenolic composition over two harvest seasons. They showed that the content of various phenolic compounds differs between cultivars, as well as from one harvest season to the following.
Table 6.
Fruit attributes for ripe fruits from South African plum (Prunus salicina Lindl.) cultivars and selections harvested during two consecutive harvest seasons a.
Table 6.
Fruit attributes for ripe fruits from South African plum (Prunus salicina Lindl.) cultivars and selections harvested during two consecutive harvest seasons a.
| Cultivar/Selection | Harvest Season | Fruit Mass (g) | Firmness (kg) | pH | TA b | TDS (°Brix) c | Skin a *,d | Skin b *,d | Skin L *,d | Flesh a *,d | Flesh b*,d | Flesh L *,d |
|---|
| Sun Breeze | First | 113.4 a | 3.8 c | 3.90 f | 22.0 de | 12.6 gh | -3.4 f | 35.0 a | 59.3 a | −1.1 h | 19.7 de | 48.0 a |
| | Second | 105.9 ab | 3.0 cd | 3.97 cd | 24.5 cd | 25.3 cde | -0.5 f | 27.3 b | 58.4 a | −0.3 h | 17.6 ef | 41.7 b |
| African Delight | First | 83.4 de | 5.4 b | 4.24 a | 9.9 h | 18.6 a | 18.0 d | −0.5 f | 42.7 c | 3.5 fg | 25.7 a | 49.0 a |
| | Second | 77.8 ef | 7.9 a | 4.22 a | 12.5 g | 19.3 a | 18.8 d | 0.0 ef | 42.8 c | 2.3 g | 27.4 a | 51.5 a |
| Laetitia | First | 98.1 bc | 0.2 e | 3.95 cde | 19.1 f | 13.2 efgh | 20.6 cd | 0.8 ef | 41.7 c | 4.7 f | 22.1 bc | 48.3 a |
| | Second | 82.9 de | 2.7 cd | 3.98 bc | 22.9 cde | 13.7 defg | 21.8 c | 1.3 ef | 41.4 c | 4.2 fg | 23.0 b | 48.3 a |
| Ruby Red | First | 101.3 abc | 0.2 e | 3.77 h | 33.8 a | 15.0 c | 13.8 e | −2.0 f | 29.8 de | 18.8 c | 10.0 j | 27.6 f |
| | Second | 78.1 ef | 5.4 b | 3.86 g | 30.4 b | 16.4 b | 15.0 e | −1.7 f | 29.7 de | 20.5 bc | 12.2 ij | 30.5 ef |
| Sapphire | First | 85.8 de | 0.0 e | 3.53 i | 24.7 c | 13.0 fgh | 19.3 cd | 3.0 e | 30.0 de | 8.9 e | 20.1 cd | 41.3 bc |
| | Second | 78.5 ef | 2.4 d | 4.02 b | 20.4 ef | 14.1 cdef | 19.6 cd | 3.1 e | 28.0 e | 15.6 d | 18.5 def | 38.1 cd |
| PR03-34 e | First | 93.1 cd | 2.8 cd | 3.93 def | 23.3 cd | 12.7 gh | 20.1 cd | 16.4 c | 46.2 b | 21.3 b | 14.0 hi | 33.0 e |
| | Second | 75.0 ef | 2.9 cd | 3.93 ef | 22.5 cde | 14.6 cd | 25.5 b | 14.5 c | 42.3 c | 20.6 bc | 11.6 j | 29.1 f |
| PR04-32 e | First | 66.6 f | 0.9 e | 3.39 j | 24.6 cd | 12.5 h | 28.9 a | 10.8 d | 32.6 d | 25.8 a | 15.1 gh | 30.2 ef |
| | Second | 75.0 ef | 6.3 b | 3.97 c | 20.7 ef | 12.3 h | 29.2 a | 15.1 c | 40.2 c | 19.6 bc | 16.6 fg | 36.6 d |
Figure 4.
Principal component biplot of phenolic composition and total antioxidant capacity of ripe fruits from South African plum (Prunus salicina Lindl.) cultivars and selections of two consecutive harvest seasons.
Figure 4.
Principal component biplot of phenolic composition and total antioxidant capacity of ripe fruits from South African plum (Prunus salicina Lindl.) cultivars and selections of two consecutive harvest seasons.


