LC-MS/MS Determination and Pharmacokinetic Study of Dehydrocorydaline in Rat Plasma after Oral Administration of Dehydrocorydaline and Corydalis yanhusuo Extract

Abstract
:1. Introduction


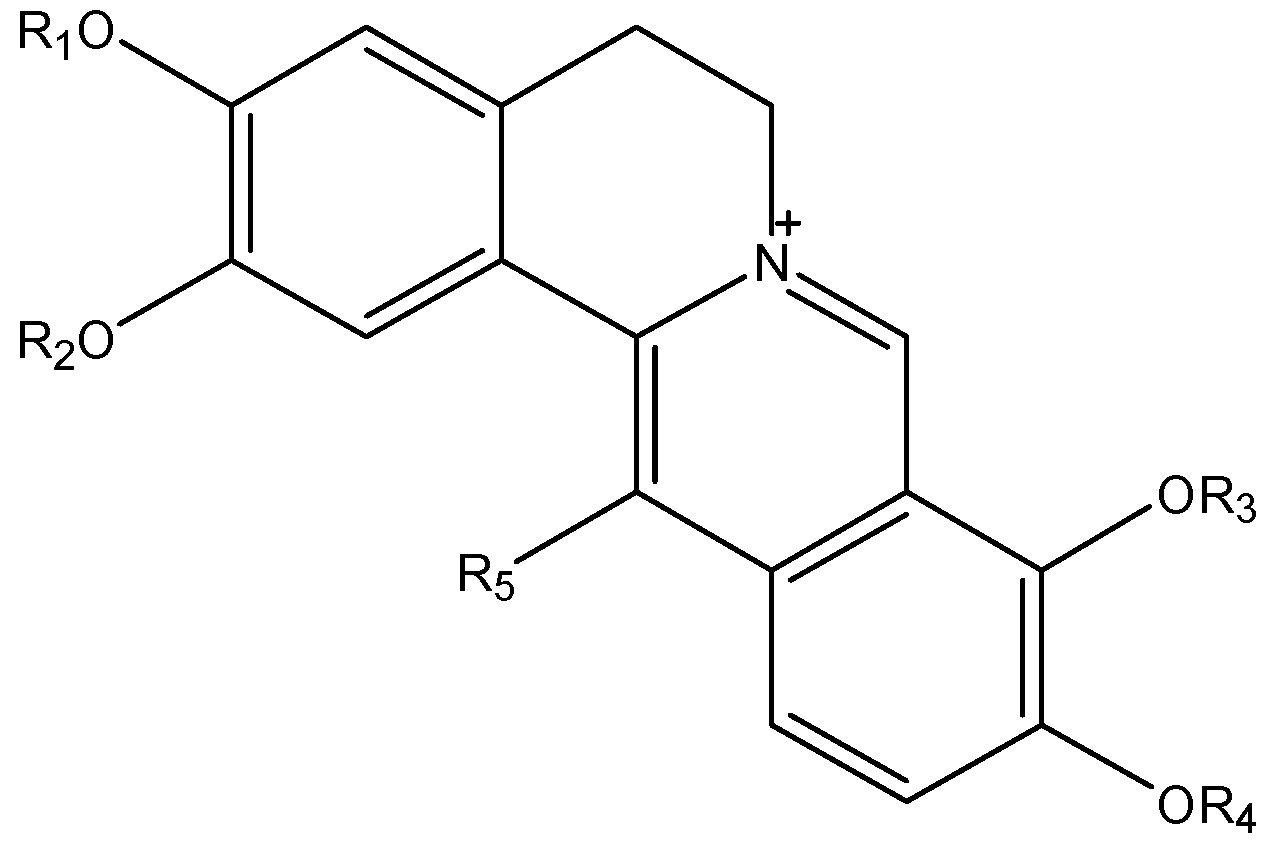
| Quaternary Alkaloids | R1 | R2 | R3 | R4 | R5 |
|---|---|---|---|---|---|
| 13-methyl-palmatrubine | CH3 | CH3 | H | CH3 | CH3 |
| 13-methyl-dehydrocorydalmine | CH3 | CH3 | CH3 | H | CH3 |
| dehydrocorydaline | CH3 | CH3 | CH3 | CH3 | CH3 |
| dehydrocorybulbine | CH3 | H | CH3 | CH3 | CH3 |
| columbamine | CH3 | H | CH3 | CH3 | H |
| coptisine | -CH2- | -CH2- | H | ||
| berberine | -CH2- | CH3 | CH3 | H | |
| palmatine | CH3 | CH3 | CH3 | CH3 | H |
2. Results and Discussion
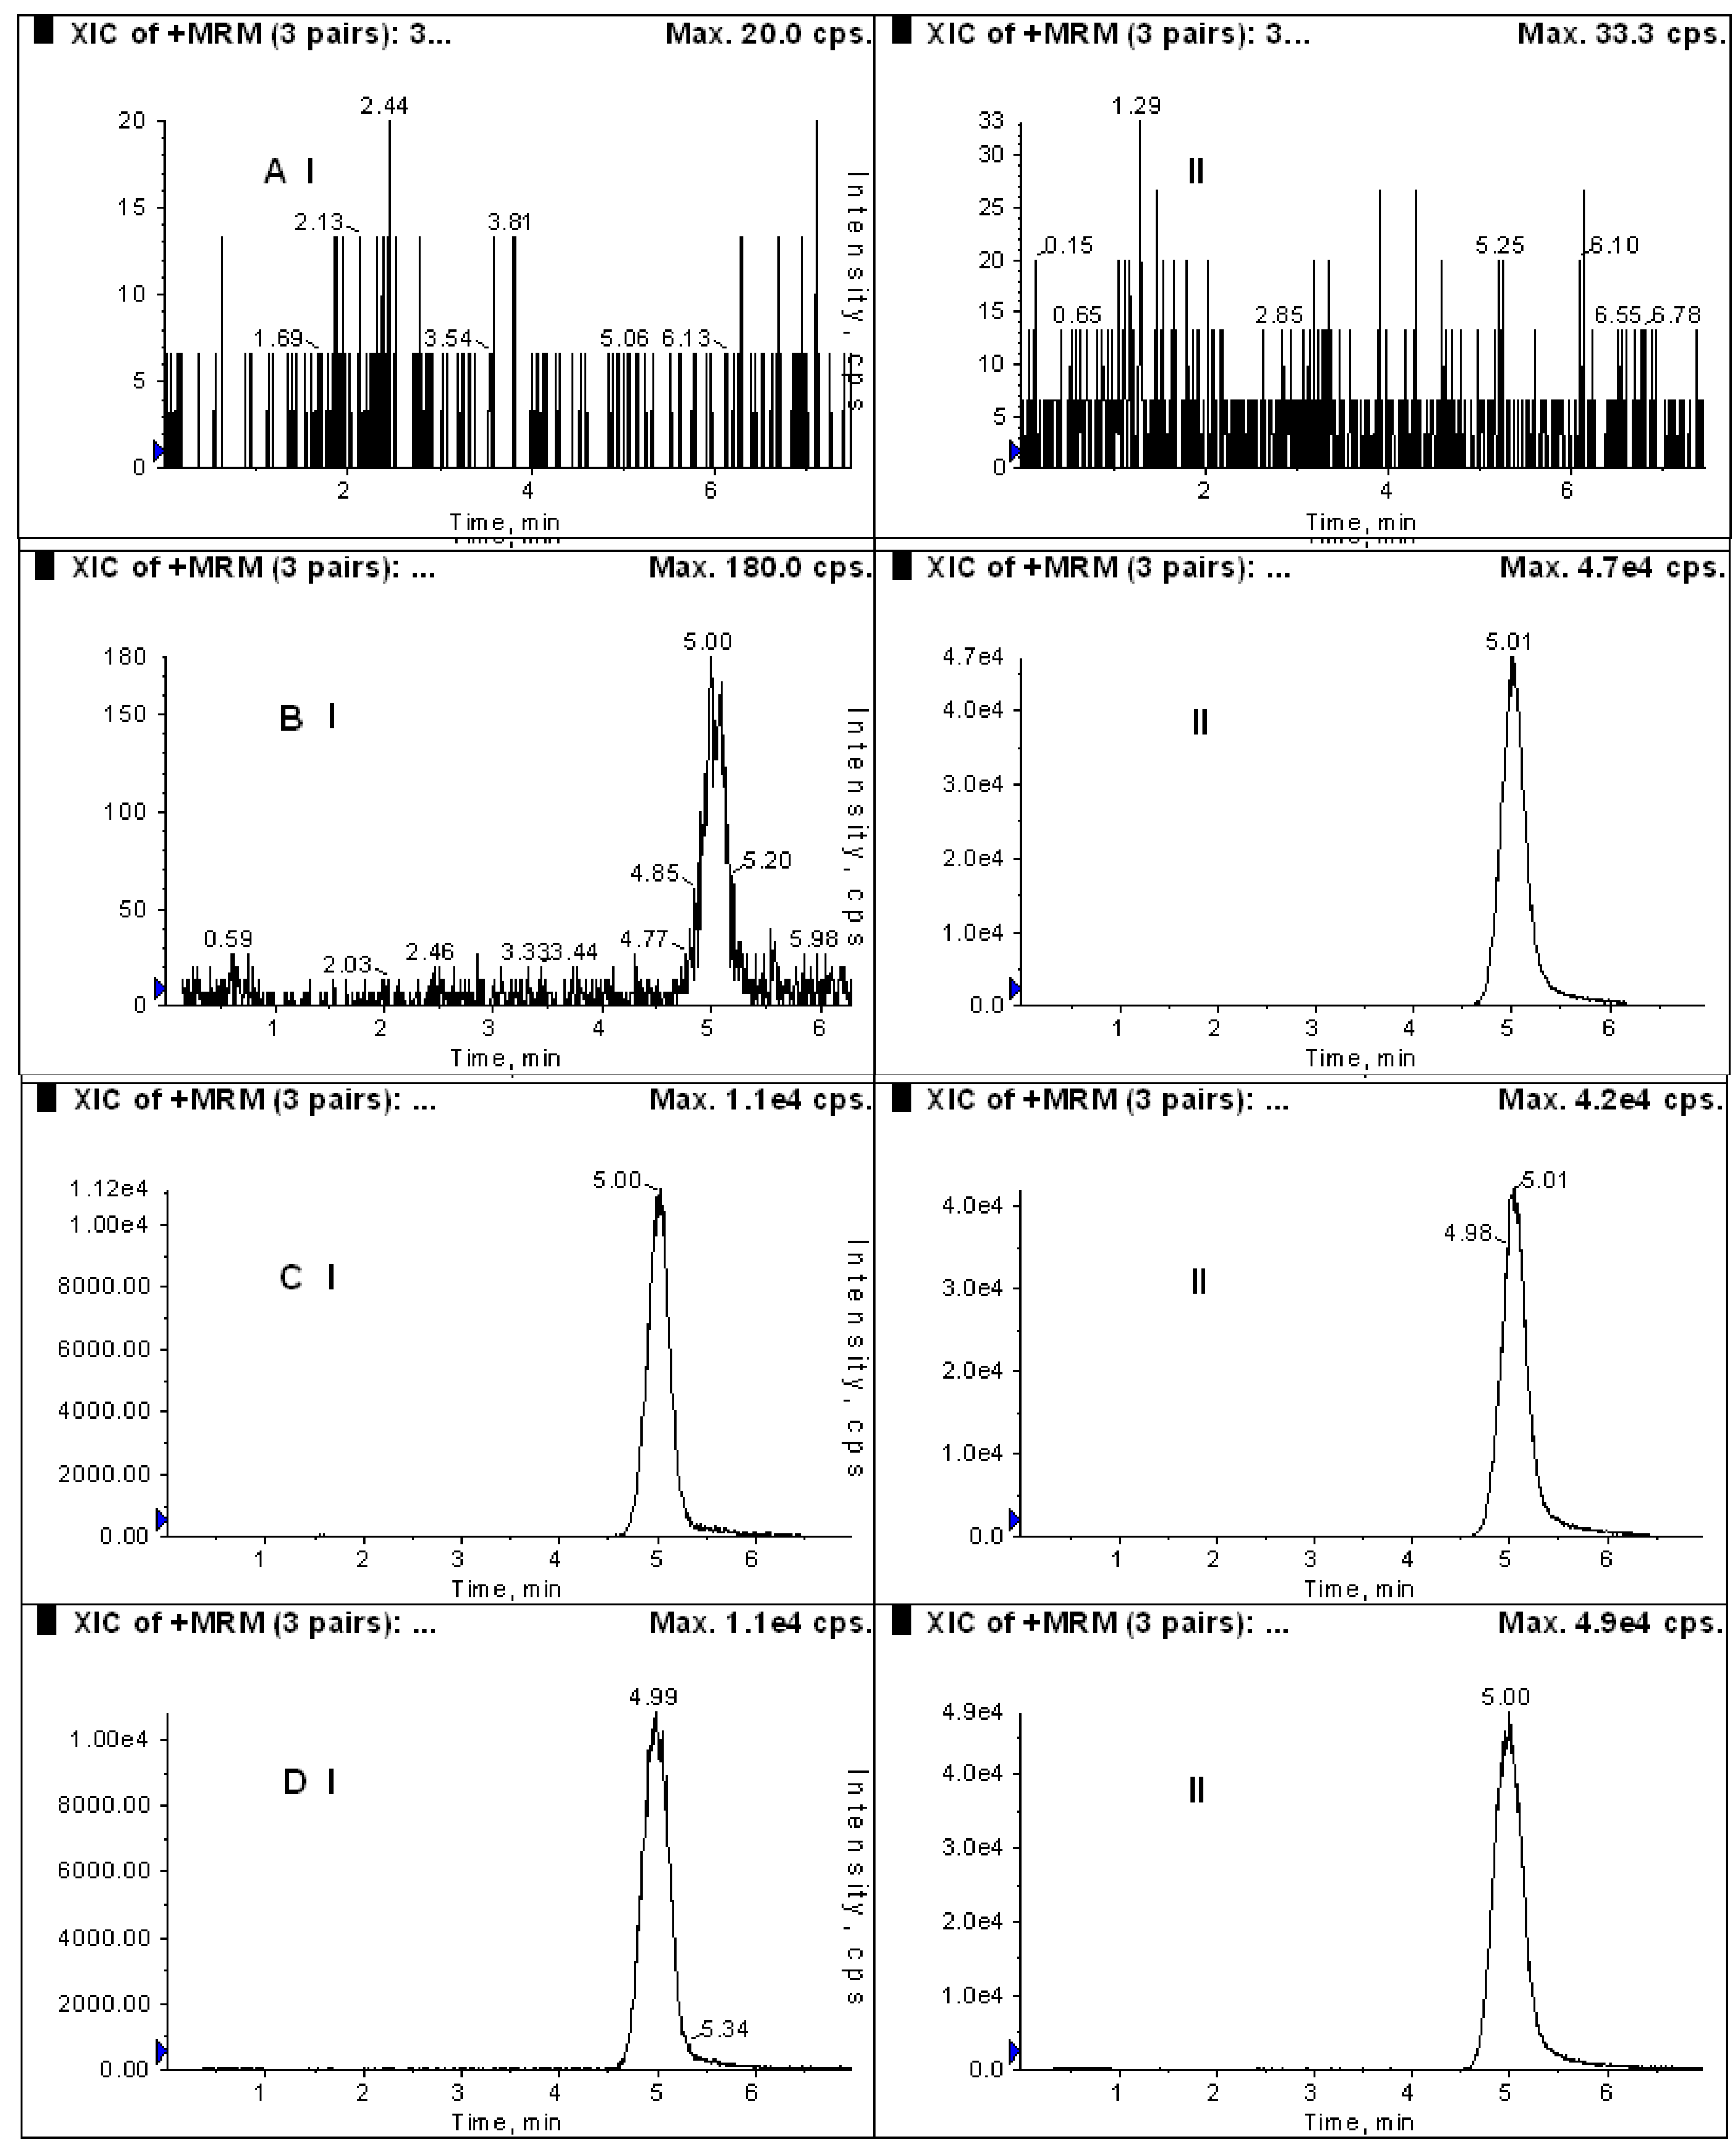
2.1. Method Validation of DHC in Rat Plasma

| Cnom (ng/mL) | Cdet (ng/mL) | Precision (RSD%) | Accuracy (RE%) | |
|---|---|---|---|---|
| Intra-day | Inter-day | |||
| 0.625 | 0.664 | 8.45 | - | 6.24 |
| 1.25 | 1.2 | 3.29 | 13.68 | −6.89 |
| 25 | 23.7 | 4.06 | 7.07 | −5.29 |
| 250 | 258.1 | 3.27 | 7.39 | 3.22 |
| Concentration (ng/mL) | Recovery (%) (mean ± SD) | |
|---|---|---|
| DHC | IS | |
| 1.25 | 107 ± 2.31 | |
| 25 | 92.08 ± 3.82 | 74.56 ± 4.05 |
| 250 | 99.65 ± 4.07 | |
| Storage | Cnom (ng/mL) | Cdec (ng/mL) (mean ± S.D.) | Relative Error (%) | RSD (%) |
|---|---|---|---|---|
| Postpreparative stability (24 h) | 1.25 | 1.18 ± 0.06 | −5.47 | 5.26 |
| 25 | 26.2 ± 0.86 | 4.8 | 8.13 | |
| 250 | 270.33 ± 9.42 | 8.14 | 3.48 | |
| Stability after three freeze-thaw cycles | 1.25 | 1.25 ± 0.1 | −0.27 | 9.86 |
| 25 | 27.5 ± 0.87 | 10 | 3.17 | |
| 250 | 272.67 ± 8.14 | 9.07 | 2.99 | |
| Short-term temperature stability (12 h) | 1.25 | 1.2 ± 0.1 | −3.87 | 8.14 |
| 25 | 21.97 ± 0.51 | −12.13 | 2.33 | |
| 250 | 230.67 ± 15.96 | −7.73 | 6.92 |
| Matrix Effect (%) (mean ± S.D.) | RSD (%) | |
|---|---|---|
| DHC | 89.40 ± 0.03 | 3.1 |
| IS | 92.3 ± 0.04 | 4.1 |
2.2. Method Validation of DHC in Bile and Urine Samples
2.3. Application
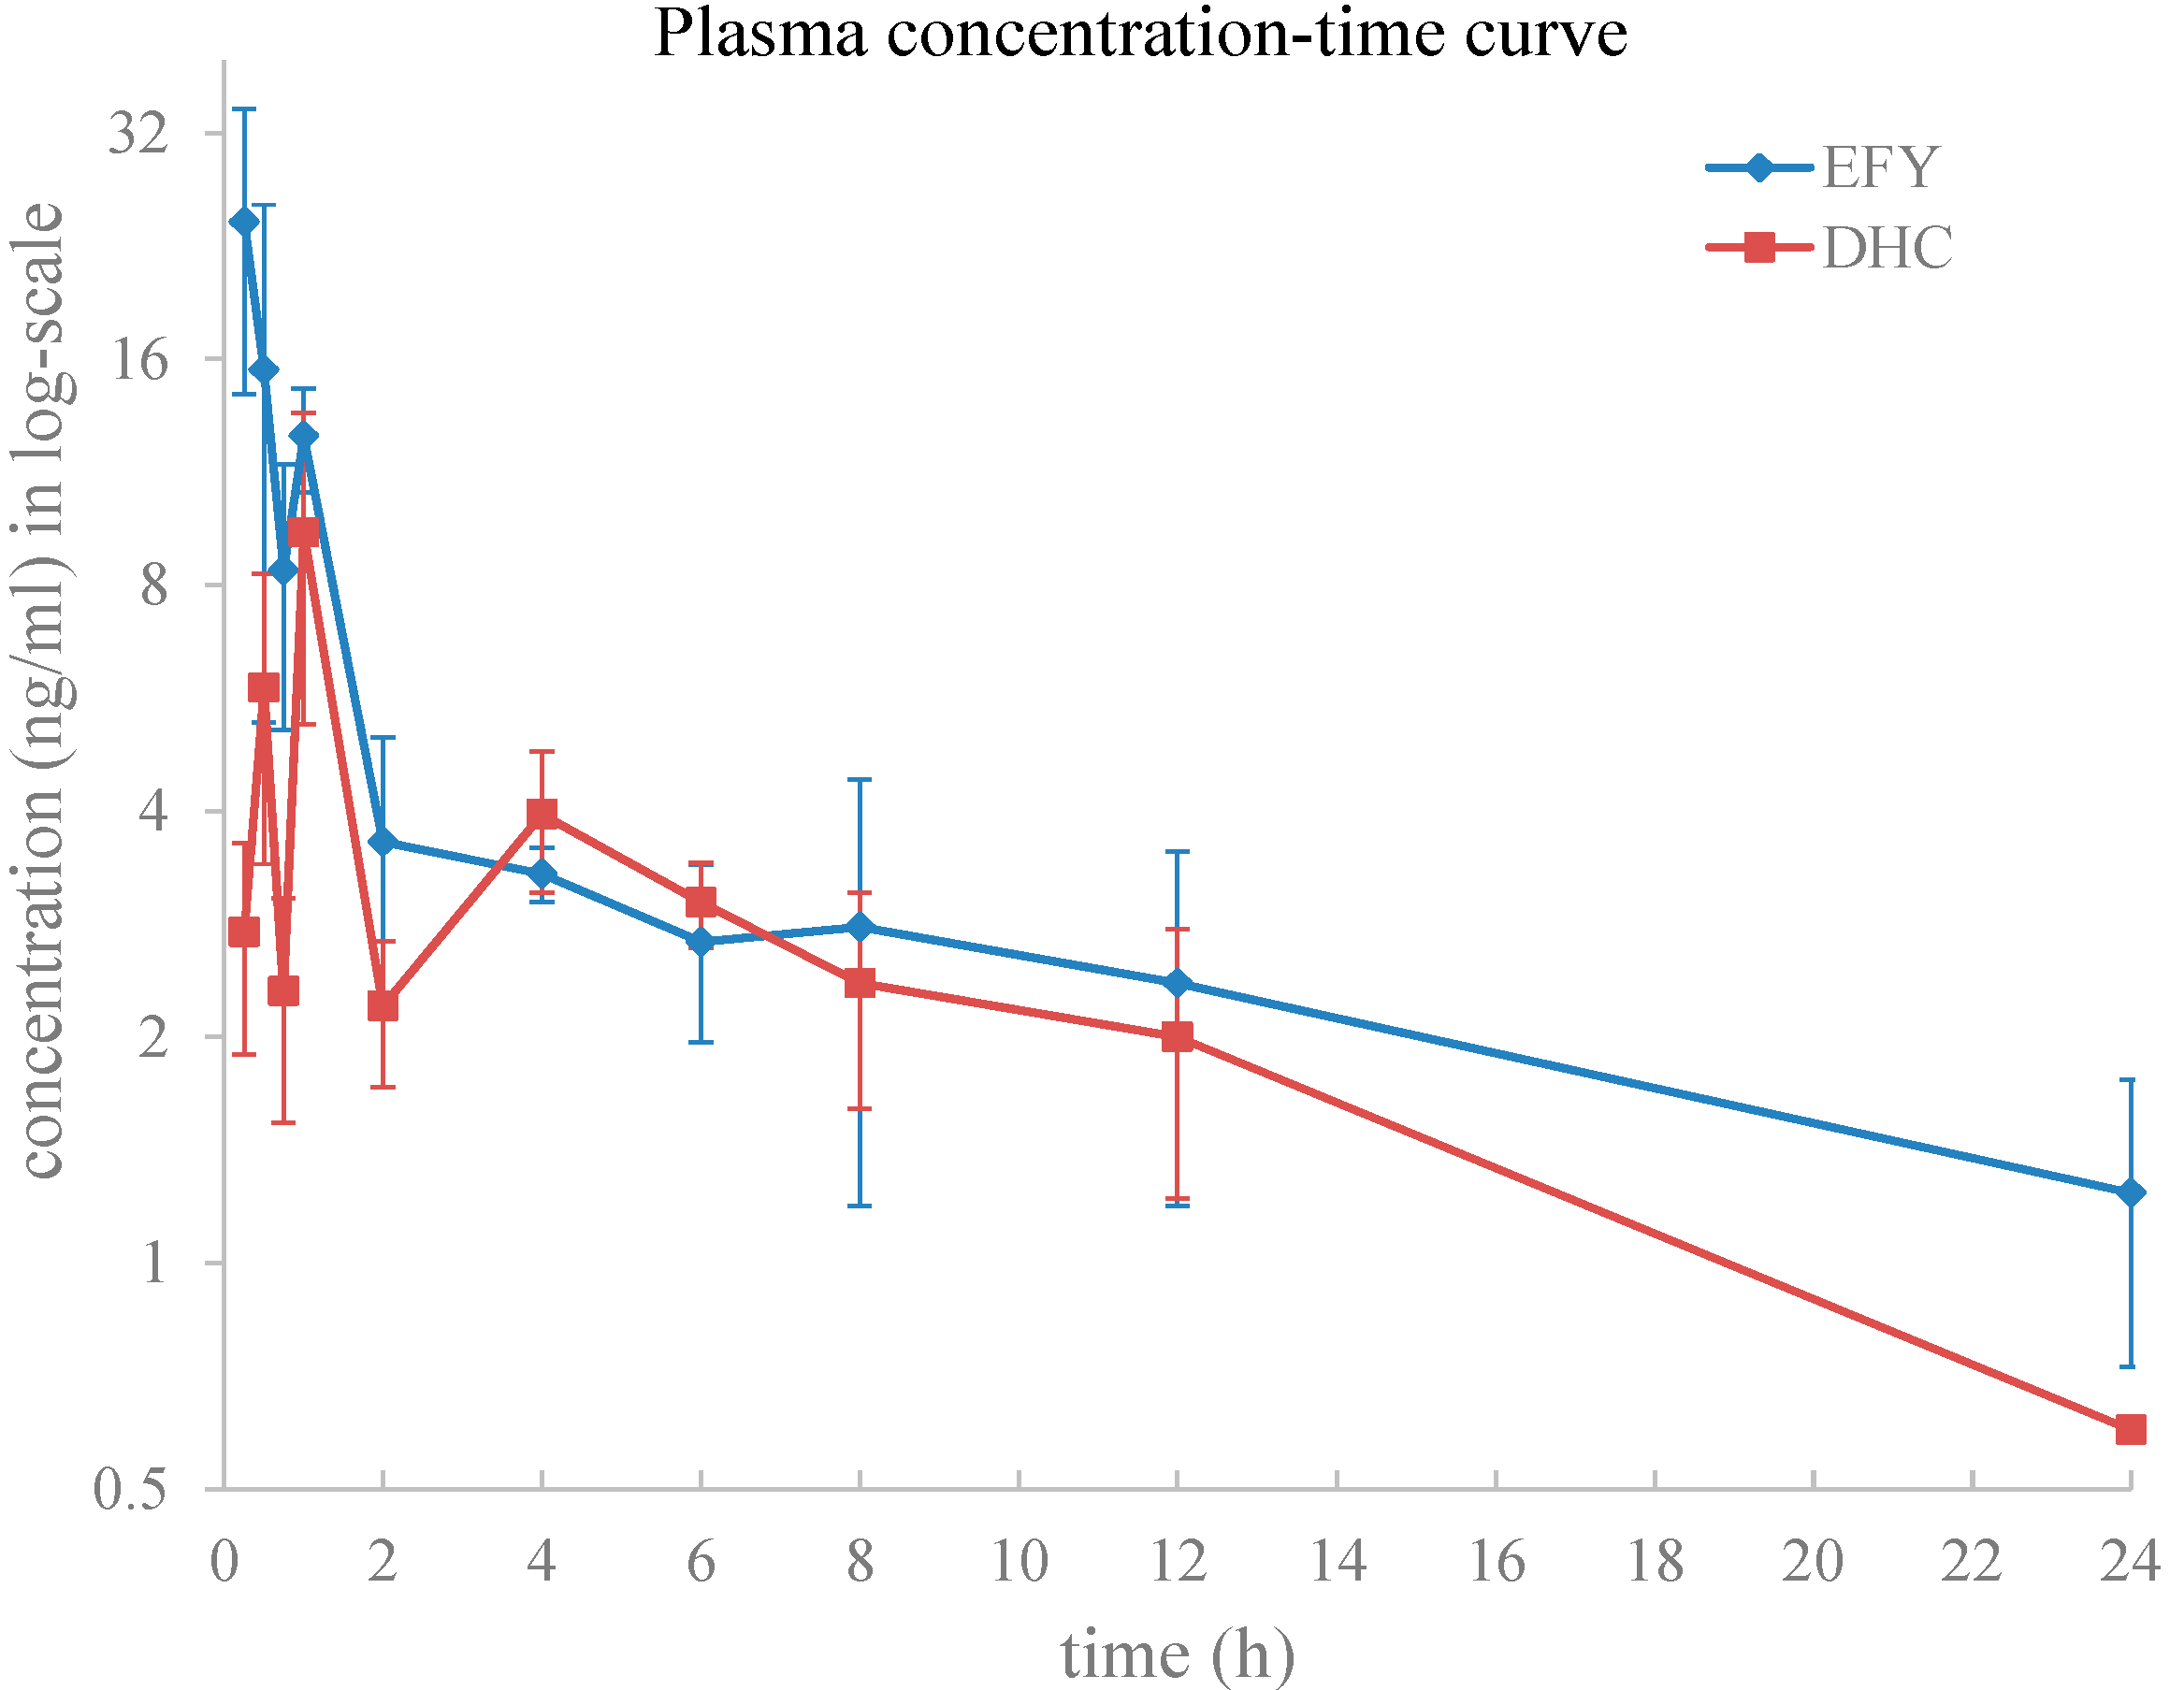
2.3.1. Plasma Pharmacokinetics
| Parameter | Dosage Forms | p Value | |
|---|---|---|---|
| EFY | DHC | ||
| Cmax (ng/mL) | 28.7 ± 6.92 | 9.40 ± 4.18 | 0.001 |
| Tmax (h) | 0.31 ± 0.13 | 1.00 ± 0.00 | 0.000 |
| AUC0-t (ng∙h/mL) | 71.92 ± 14.79 | 52.39 ± 12.82 | 0.056 |
| AUC0-∞ (ng∙h/mL) | 115.12 ± 34.12 | 59.08 ± 11.53 | 0.008 |
| T1/2 (h) | 21.71 ± 12.35 | 7.93 ± 1.34 | 0.038 |
| Ke (1/h) | 0.05 ± 0.03 | 0.09 ± 0.02 | 0.023 |
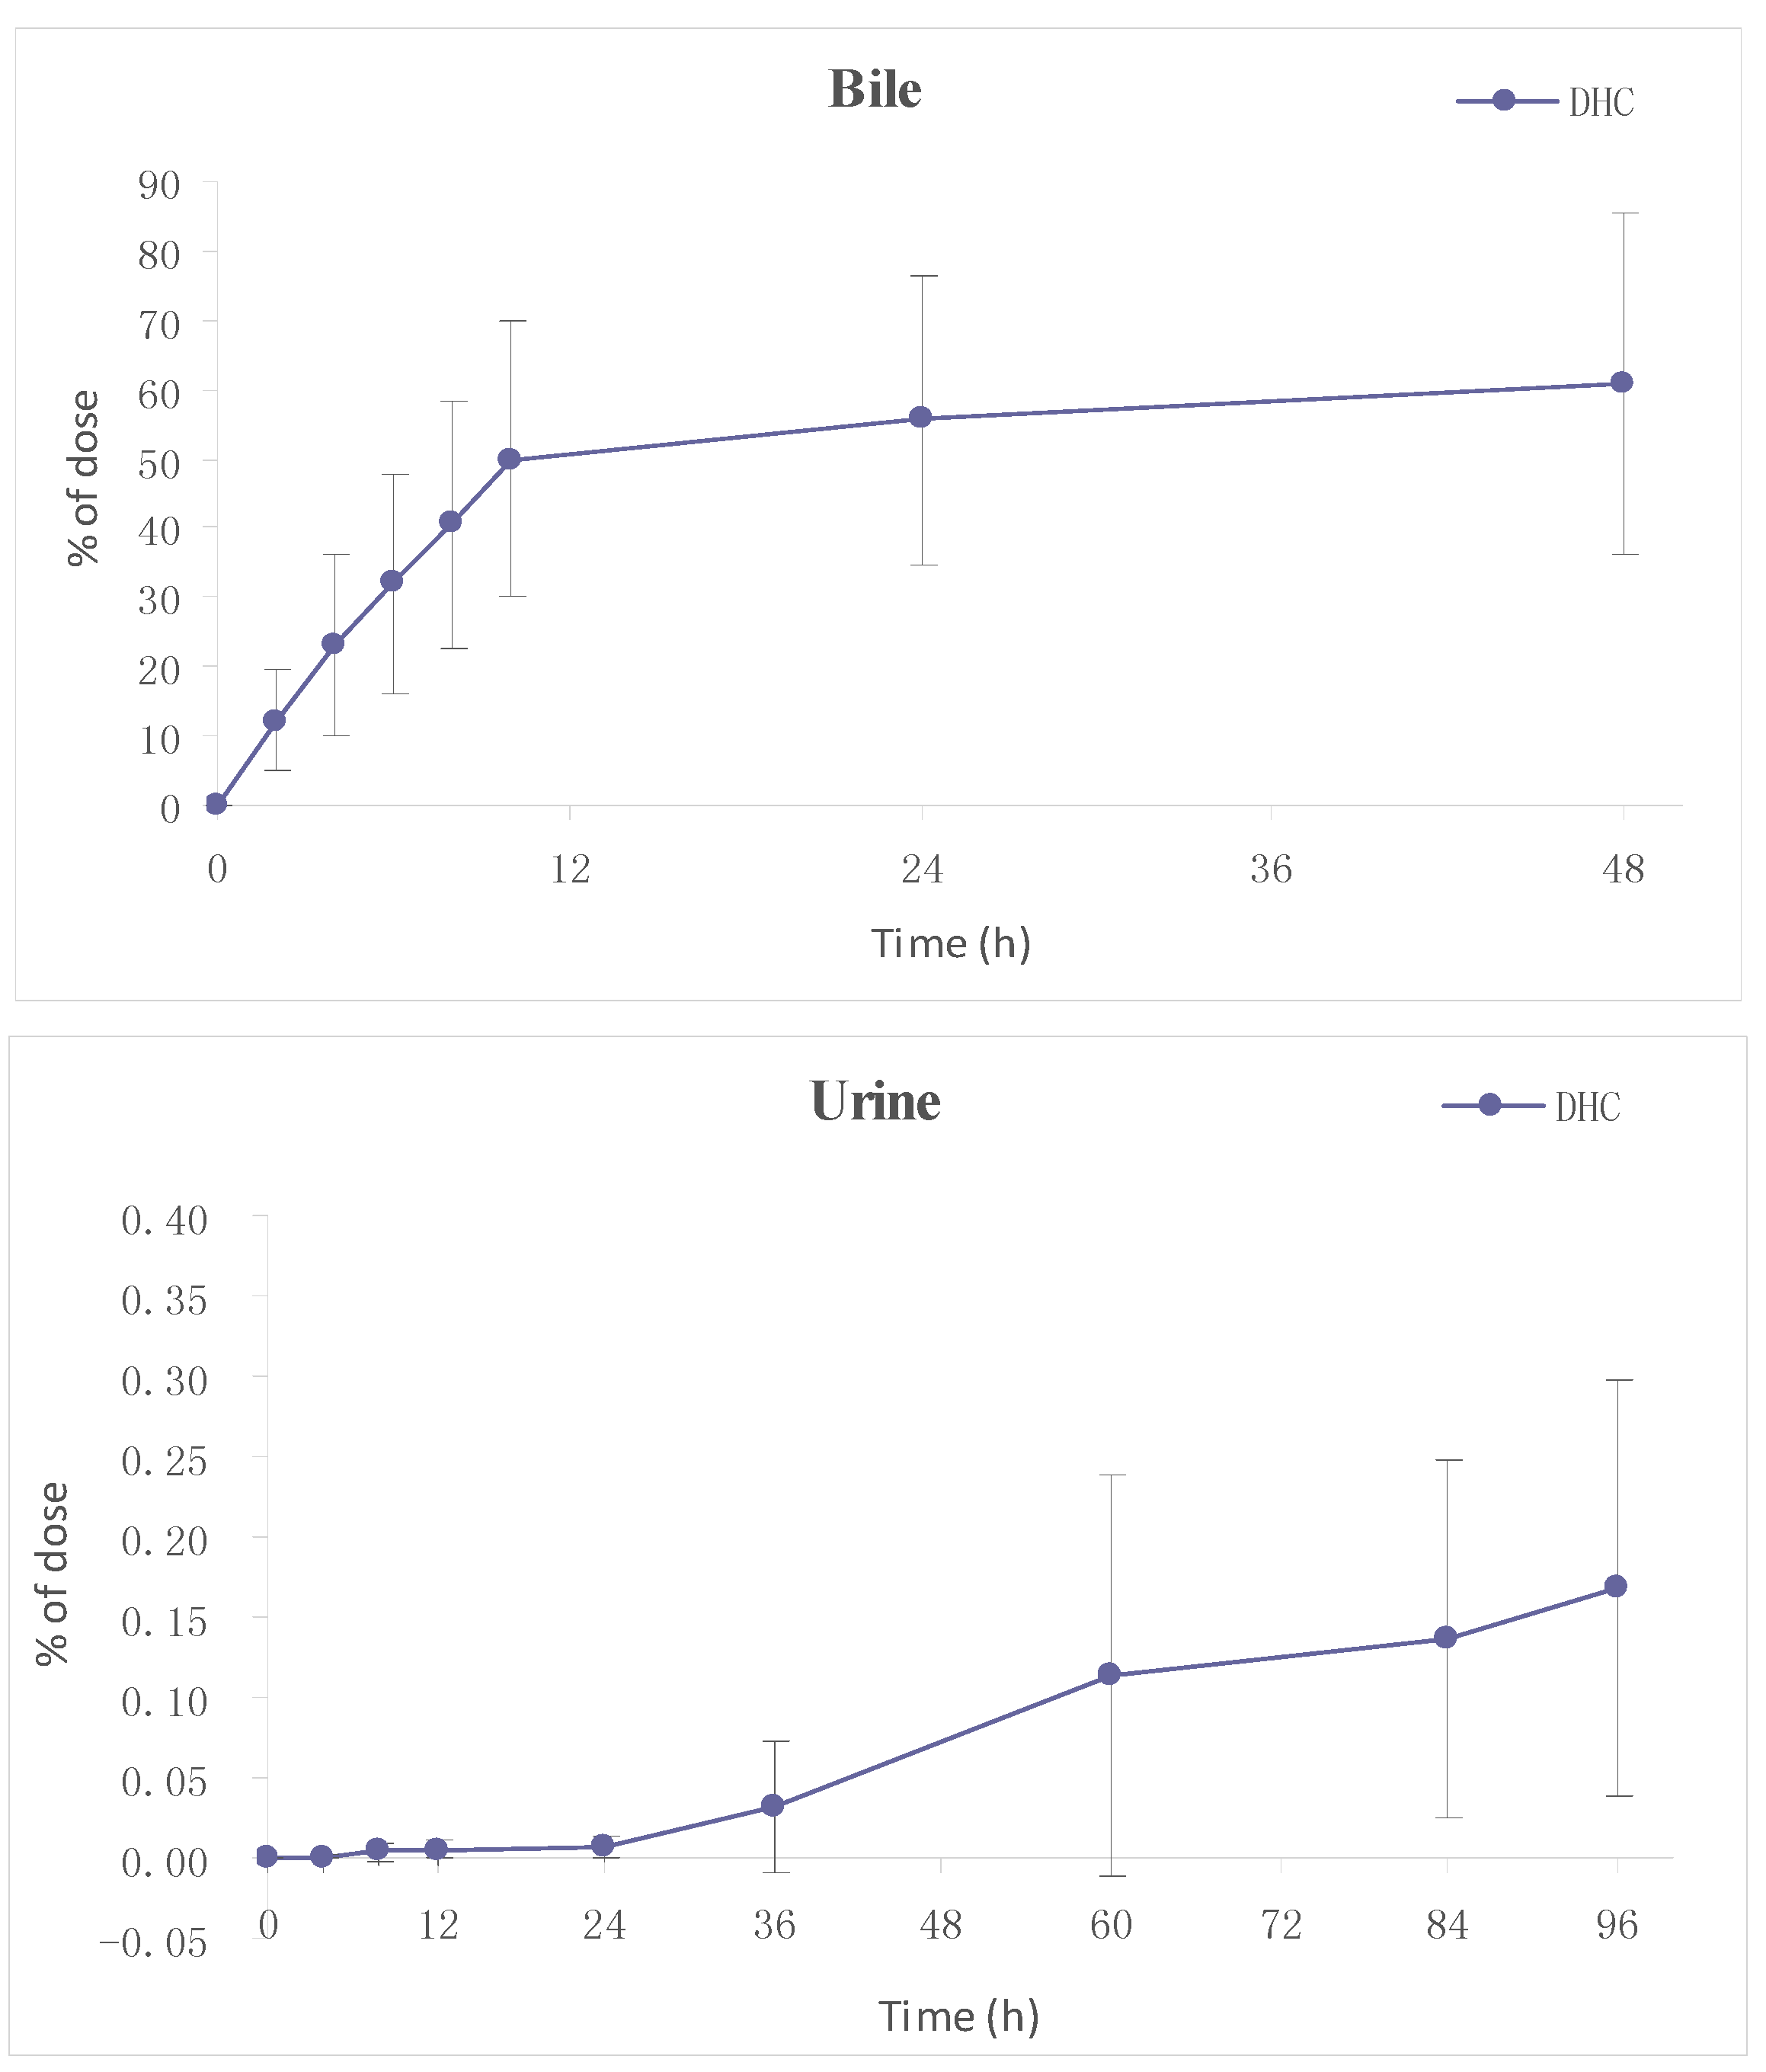
2.3.2. Excretion
3. Experimental Section
3.1. Chemicals and Reagents
3.2. Animals and Doses
3.3. Preparation of Calibration Standards and Quality Control Samples
3.4. Sample Preparation
3.5. LC-MS/MS Condition
3.6. Method Validation
3.6.1. Calibration Linearity and Low Quantification Limits
3.6.2. Precision, Accuracy and Extraction Recovery
3.6.3. Stability
3.6.4. Matrix Effects
3.7. Pharmacokinetic Study
4. Conclusions
Acknowledgments
Author Contributions
Conflicts of Interest
References
- Tang, F.Y.; Nie, A.G. Overview of studies on Corydalis yanhusuo. J. Clin. Exp. Med. 2006, 5, 185–186. [Google Scholar]
- Ou, J.J.; Kong, L.; Pan, C.S.; Su, X.Y.; Lei, X.Y.; Zou, H.F.J. Determination of DL-tetrahydropalmatine in Corydalis yanhusuo by L-tetrahydropalmatine imprinted monolithic column coupling with reversed-phase high performance liquid chromatography. J. Chromatogr. A 2006, 1117, 163–169. [Google Scholar]
- Ling, H.Y.; Wu, L.M.; Li, L.D. Corydalis yanhusuo rhizoma extract reduces infarct size and improves heart function during myocardial ischemia/reperfusion by inhibiting apoptosis in rats. Phytother. Res. 2006, 20, 448–453. [Google Scholar]
- Wu, L.M.; Ling, H.Y.; Li, L.D.; Jiang, L.X.; He, M.L. Beneficial effects of the extract from Corydalis yanhusuo in rats with heart failure following myocardial infarction. J. Pharm. Pharmacol. 2007, 59, 695–701. [Google Scholar]
- Wen, C.P.; Wu, L.M.; Ling, H.Y.; Li, L.D. Salutary effects of Corydalis yanhusuo extract on cardiac hypertrophy due to pressure overload in rats. J. Pharm. Pharmacol. 2007, 59, 1159–1165. [Google Scholar]
- Zhang, J.; Jin, Y.; Dong, J.; Xiao, Y.S.; Feng, J.T.; Xue, X.Y.; Zhang, X.L.; Liang, X.M. Systematic screening and characterization of tertiary and quaternary alkaloids from corydalis yanhusuo W.T. Wang using ultra-performance liquid chromatography-quadrupole-time-of-flight mass spectrometry. Talanta 2009, 78, 513–522. [Google Scholar]
- Yang, X.B.; Yang, X.W.; Liu, J.X. Study on material base of Corydalis Rhizoma. China J. Chin. Mater. Med. 2014, 39, 20–27. [Google Scholar]
- Qin, Y.Q.; Yang, Q.Z. Studies on chemical constituents for the treatment of coronary heart disease (CHD) effective components of Corydalis yanhusuo. Tianjin Med. J. 1978, 10, 450–453. [Google Scholar]
- Jiang, X.R.; Wu, Q.X.; Shi, H.L.; Chen, W.P.; Chang, S.Q.; Zhao, S.Y.; Tian, X.Y.; Zhou, L.F.; Guo, S.M.; Li, Y.J. Pharmacological actions of dehydrocorydaline cardiovascular system. Acta Pharm. Sin. 1982, 17, 61–64. [Google Scholar]
- Li, P.; Ren, J.G.; Duan, C.L.; Lin, C.R.; Liu, J.X. Effects of four components of Rhizoma Corydalis on anoxia and peroxidation injuries in neonatal cardiomyocytes. Chin. J. Chin. Mater. Med. 2010, 35, 84–87. [Google Scholar]
- Cheng, X.Y.; Shi, Y.; Zheng, S.L.; Jin, W.; Sun, H. Two new protoberberine quaternary alkaloids from Corydalis yanhusuo. J. Asian Nat. Prod. Res. 2008, 10, 1117–1121. [Google Scholar]
- Cheng, X.Y.; Shi, Y.; Zheng, S.L.; Sun, H.; Jin, W. Studies on chemical constituents in the anti-myocardial ischemia effective fraction of Corydalis yanhusuo. Chin. Med. Mat. 2008, 31, 1656–1658. [Google Scholar]
- Cheng, X.Y.; Shi, Y. Analysis of chemical constituents of anti-myocardial ischemia fraction of Corydalis yanhusuo. Chin. J. Chin. Mater. Med. 2008, 33, 1717–1719. [Google Scholar]
- Cheng, X.Y.; Shi, Y.; Sun, H.; Jin, W.; Zheng, S.L.; Li, K.T.; Yang, S. Identification and analysis of absorbed components in rat plasma after oral administration of active fraction of Corydalis yanhusuo by LC-MS/MS. Acta Pharm. Sin. 2009, 44, 167–174. [Google Scholar]
- Cheng, X.Y.; Shi, Y.; Zheng, S.L.; Sun, H.; Jin, W. HPLC-MS Analysis of the Ethanol Extract of Corydalis yanhusuo and Simultaneous Determination of Eight Protoberberine Quaternary Alkaloids in it by HPLC-DAD. J. Chromatogr. Sci. 2010, 48, 441–444. [Google Scholar]
- Li, K.T.; Xing, D.M.; Jin, W.; Sun, H.; Shi, Y. Chemical fingerprint and metabolic fingerprint analysis of the medical extract of Corydalis yanhusuo by HPLC-UV and HPLC-MS methods. Asian J. Chem. 2011, 23, 723–728. [Google Scholar]
- Li, Q.Y.; Cheng, X.Y.; Wang, J.F.; Yan, L.L.; Shi, Y. Absorption and transportation of quaternary alkaloids in Corydalis yanhusuo across Caco-2 cell monolayer model. Chin. Hosp. Pharm. J. 2013, 33, 89–92. [Google Scholar]
- Lin, L.; Liu, J.X.; Zhang, Y.; Lin, C.R.; Duan, C.L. Pharmacokinetic studies of tetrahydropalmatine and dehydrocorydaline in rat after oral administration of Yanhusuo extraction by LC-MS /MS method. Acta Pharm. Sin. 2008, 43, 1123–1127. [Google Scholar]
- Zuo, F.; Nakamura, N.; Akao, T.; Hattori, M. Pharmacokinetics of berberine and its main metabolites in conventional and pseudo germ-free rats determined by liquid chromatography/Ion trap mass spectrometry. Drug Metab. Dispos. 2006, 34, 2064–2072. [Google Scholar]
- Tsai, P.L.; Tsai, T.H. Hepatobiliary excretion of berberine. Drug Metab. Dispos. 2004, 32, 405–412. [Google Scholar]
- Li, H.L.; Zhang, W.D.; Zhang, C.; Liu, R.H.; Wang, X.W.; Wang, X.L.; Zhu, J.B.; Chen, C.L. Bioavailabilty and pharmacokinetics of four active alkaloids of traditional Chinese medicine Yanhuanglian in rats following intravenous and oral administration. J. Pharm. Biomed. Anal. 2006, 41, 1342–1346. [Google Scholar]
- Gao, Y.; Hu, S.; Zhang, M.; Li, L.L.; Lin, Y.N. Simultaneous determination of four alkaloids in mice plasma and brain by LC-MS/MS for pharmacokinetic studies after administration of Corydalis Rhizoma and Yuanhu Zhitong extracts. J. Pharm. Biomed. Anal. 2014, 92, 6–12. [Google Scholar]
- Pan, G.Y.; Wang, G.J.; Liu, X.D.; Fawcett, J.P.; Xie, Y.Y. The Involvement of P-glycoprotein in berberine absorption. Pharmacol. Toxicol. 2002, 91, 193–197. [Google Scholar]
- Maeng, H.J.; Yoo, H.J.; Kim, I.W.; Song, I.S.; Chung, S.J.; Shim, C.K. P-glycoprotein-mediated transport of berberine across Caco-2 cell monolayers. J. Pharm. Sci. 2002, 91, 2614–2621. [Google Scholar]
- Wu, X.; Li, Q.; Xin, H.; Yu, A.; Zhong, M. Effects of berberine on the blood concentration of cyclosporin A in renal transplanted recipients: clinical and pharmacokinetic study. Eur. J. Clin. Pharmacol. 2005, 61, 567–572. [Google Scholar]
- Liang, M.; Zhang, W.; Hu, J.; Liu, R.H.; Zhang, C. Simultaneous analysis of alkaloids from Zanthoxylum nitidum by high performance liquid chromatography-diode array detector-electrospray tandem mass spectrometry. J. Pharm. Biomed. Anal. 2006, 42, 178–183. [Google Scholar]
- Cai, M. Studies on the Chemical Constituents and Analysis Methods for Several Traditional Chinese Medicines. Ph.D. Thesis, Chengdu Institute of Biology, Chinese Academy of Sciences, Chengdu, China, May 2007. [Google Scholar]
- Jia, C.P.; Huang, X.L.; Li, Y.; Feng, F. Analysis of alkaloids in Zanthoxylum nitidum by HPLC-DAD/ESI-Q-TOF-MS. Chin. J. Chin. Mater. Med. 2013, 38, 1198–1202. [Google Scholar]
- Matuszewski, B.K.; Constanzer, M.L.; Chavez-Eng, C.M. Strategies for the assessment of matrix effect in quantitative bioanalytical methods based on HPLC-MS/MS. Anal. Chem. 2003, 75, 3019–3030. [Google Scholar]
- Sample Availability: Samples of Dehydrocorydaline (DHC) and the effective fraction of Corydalis yanhusuo (EFY) are available from the authors.
© 2014 by the authors. Licensee MDPI, Basel, Switzerland. This article is an open access article distributed under the terms and conditions of the Creative Commons Attribution license ( http://creativecommons.org/licenses/by/4.0/).
Share and Cite
Li, Q.-Y.; Li, K.-T.; Sun, H.; Jin, W.; Shi, J.-W.; Shi, Y. LC-MS/MS Determination and Pharmacokinetic Study of Dehydrocorydaline in Rat Plasma after Oral Administration of Dehydrocorydaline and Corydalis yanhusuo Extract. Molecules 2014, 19, 16312-16326. https://doi.org/10.3390/molecules191016312
Li Q-Y, Li K-T, Sun H, Jin W, Shi J-W, Shi Y. LC-MS/MS Determination and Pharmacokinetic Study of Dehydrocorydaline in Rat Plasma after Oral Administration of Dehydrocorydaline and Corydalis yanhusuo Extract. Molecules. 2014; 19(10):16312-16326. https://doi.org/10.3390/molecules191016312
Chicago/Turabian StyleLi, Qiu-Yue, Kai-Tong Li, Hong Sun, Wen Jin, Jia-Wen Shi, and Yue Shi. 2014. "LC-MS/MS Determination and Pharmacokinetic Study of Dehydrocorydaline in Rat Plasma after Oral Administration of Dehydrocorydaline and Corydalis yanhusuo Extract" Molecules 19, no. 10: 16312-16326. https://doi.org/10.3390/molecules191016312
APA StyleLi, Q.-Y., Li, K.-T., Sun, H., Jin, W., Shi, J.-W., & Shi, Y. (2014). LC-MS/MS Determination and Pharmacokinetic Study of Dehydrocorydaline in Rat Plasma after Oral Administration of Dehydrocorydaline and Corydalis yanhusuo Extract. Molecules, 19(10), 16312-16326. https://doi.org/10.3390/molecules191016312