1. Introduction
Acanthopanax species (Araliaceae) are shrubs found mainly in China, Korea, and Japan.
Acanthopanax sessiliflorus (Rupr. et Maxim) Seem. is known to be one of the most abundant species, and the pharmacology research has demonstrated that the fruits of
Acanthopanax have many biological functions, including antitumor [
1,
2], immunostimulating [
2], antithrombosis [
3], antiplatelet activities [
4,
5], pancreatic lipase-inhibiting properties [
6] and effects on lipopolysaccharide-induced nitric oxide production [
7]. To further investigate the constituents and screen the bioactive compounds from
A.
sessiliflorus fruits, a phytochemical study was performed. From the ethanolic extract of
A. sessiliflorus fruits, three new monoterpenes, (2
E)-3,7-dimethylocta-2,6-dienoate-6-
O-
α-
l-arabinopyranosyl-(1→6)-
β-
d-glucopyranoside (
1), (3
Z,6
E)-3,7-dimethyl-3,6-octadiene-1,2,8-triol (
2) and (6
E)-7-methyl-3-methylene-6-octene-1,2,8-triol (
3), were isolated and identified along with the known compounds kenposide A (
4) [
8], sacranoside B (
5) [
9] and 1-
O-[(
S)-oleuropeyl]-
β-
d-glucopyranose (
6) [
10], on the basis of spectral analysis, including MS,
1H-NMR,
13C-NMR, DEPT, HMBC, HMQC and NOESY experiments (
Figure 1). In the present report, we describe the structural elucidation of compounds
1~
3.
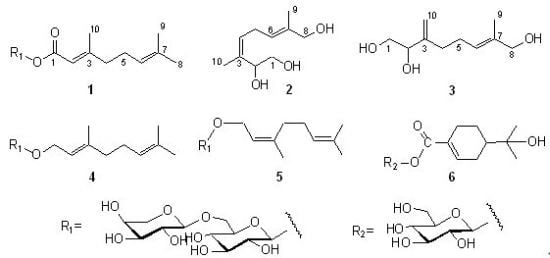
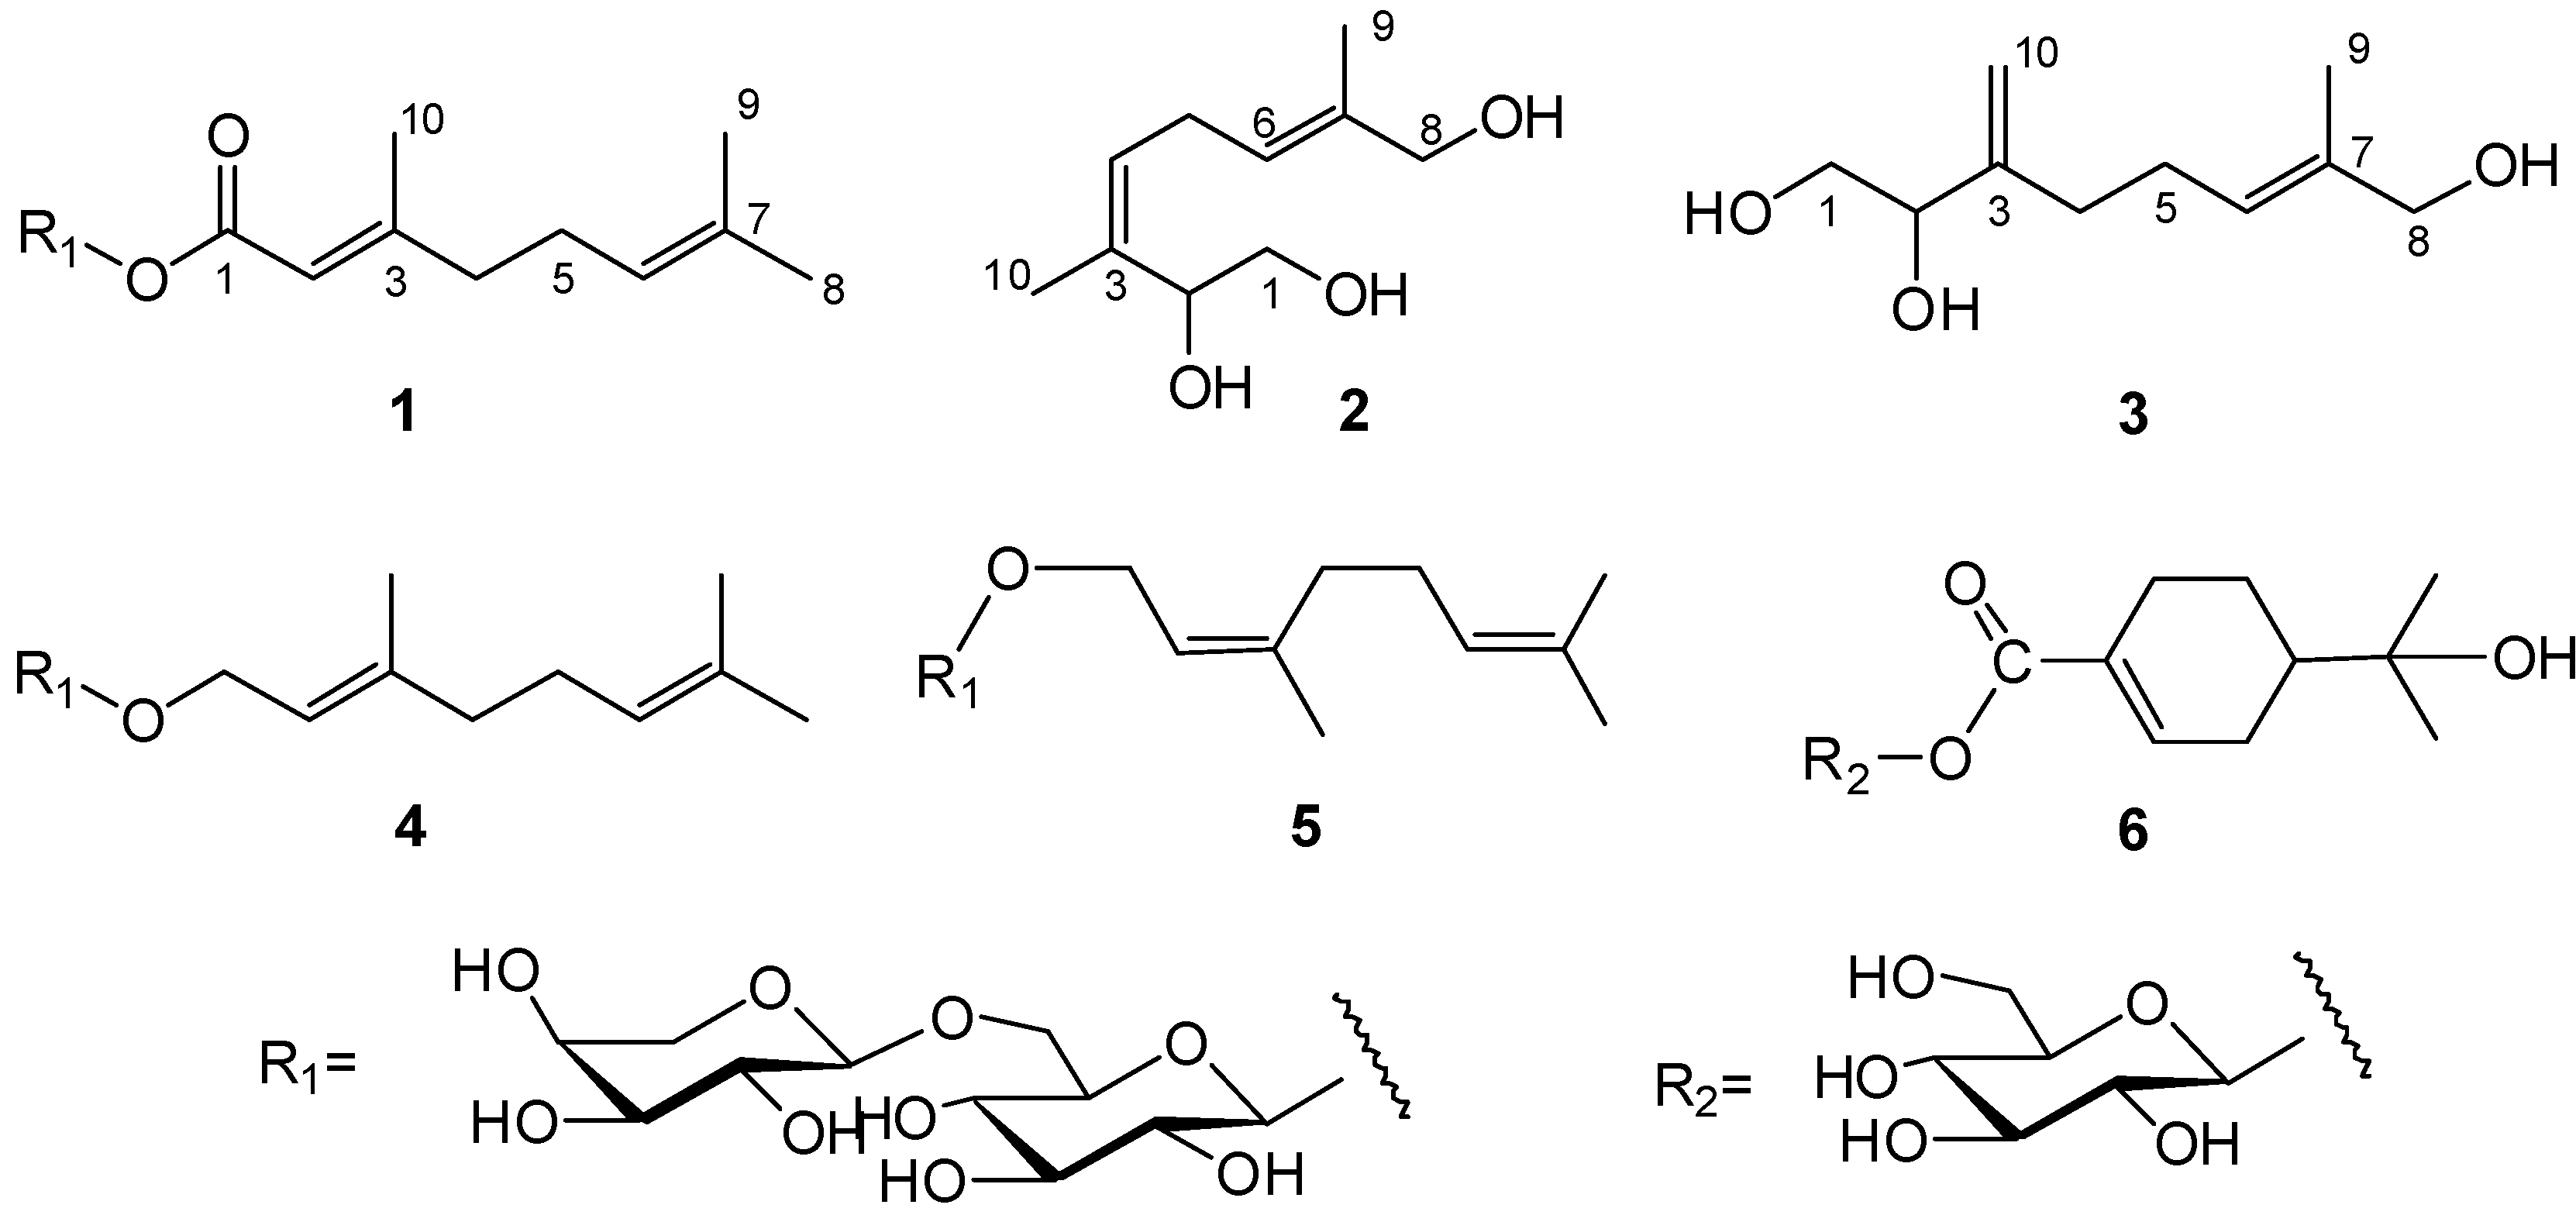
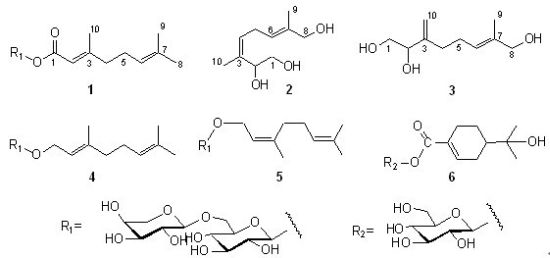
Figure 1.
Structures of compounds 1–6.
Figure 1.
Structures of compounds 1–6.
2. Results and Discussion
Compound
1 was obtained as a colorless amorphous powder.
−31.0 (
c 0.3, MeOH); UV max (MeOH): 221 (log
ε 3.95) nm. The IR spectrum of compound
1 showed absorption bands at 3410, 1715, 1645, 1423, 1385, and 1073 cm
−1 assignable to hydroxyl, ester carbonyl, olefin and ether functions. The molecular formula C
21H
34O
11 was defined by HRESIMS (
m/z: 485.1995 [
M+Na]
+, calc. for C
21H
34O
11Na 485.1999). Acid hydrolysis of
1 liberated
d-glucose and
l-arabinose, which were identified by GC analysis using a hydrogen flame detector after treatment with
l-cysteine methyl ester hydrochloride in pyridine [
4,
11].
1H-NMR and
13C-NMR spectra of
1 (
Table 1) showed the presence of three vinyl methyls [
δ 1.68 (s, 3H, H-8)], [
δ 1.62 (s, 3H, H-9)], [
δ 2.18 (s, 3H, H-10)], two trisubstituted alkenes [
δ 5.10 (dd, 1H,
J = 6.6, 6.9 Hz, H-6),
δ 5.74 (s, 1H, H-2)], and two anomeric protons [
δ 5.47 (d, 1H,
J = 8.2 Hz, H-1')], [
δ 4.27 (d, 1H,
J = 6.2 Hz, H-1'')].
1H-
1H correlations were observed between the following protons pairs:
δ 2.20 (H-4) and
δ 2.21 (H-5);
δ 2.21 (H-5) and
δ 5.10 (H-6), suggesting a –CH
2CH
2CH– fragment. Two anomeric proton signals were assigned to two anomeric carbon signals at
δ 95.2 (C-1') and 104.8 (C-1'') respectively, in the HMQC experiment. By comparing coupling constants and the chemical shifts of the sugar signals with those reported [
12,
13], the two sugars were deduced to be of
β-configuration for glucose and
α for arabinose. In the HMBC spectrum, long-range correlations between the methyl proton signals at
δ 2.18 (H-10) and the carbon signals at
δ 115.9 (C-2), 164.4 (C-3) and 42.0 (C-4) could be identified. Moreover, the long-range correlations were observed between the following protons and carbons:
δ 5.74 (H-2) and
δ 166.5 (C-1), 164.4 (C-3), 42.0 (C-4), 19.3 (C-10);
δ 2.21 (H-5) and
δ 42.0 (C-4), 124.1 (C-6), 133.6 (C-7);
δ 1.62 (H-9) and
δ 124.1 (C-6), 133.6 (C-7) , 25.9 (C-8);
δ 5.47 (H-1') and
δ 166.5 (C-1);
δ 4.27 (H-1'') and
δ 69.2 (C-6'). In the NOESY spectrum, NoE correlations were observed between the following protons and protons:
δ 5.74 (H-2) and
δ 2.20 (H-4), which indicated a trisubstituted alkene with the
trans-configuration in the 2 position. Thus, the structure of compound
1 could be elucidated as (2
E)-3,7-dimethylocta-2,6-dienoate-6-
O-
α-
l-arabinopyranosyl-(1→6)-
β-
d-glucopyranoside.
Table 1.
1H- and 13C-NMR data for 1 (600 and 150 MHz, CD3OD, J in Hertz and δ in ppm).
Table 1.
1H- and 13C-NMR data for 1 (600 and 150 MHz, CD3OD, J in Hertz and δ in ppm).
| Position | δH | δC | HMBC (from H to C) | NOESY |
|---|
| 1 | | 166.5 | | |
| 2 | 5.74 (s, 1H) | 115.9 | C-1, C-3, C-4, C-10 | H-4 |
| 3 | | 164.4 | | |
| 4 | 2.20 (m, 2H) | 42.0 | C-2, C-3, C-5, C-6, C-10 | H-2 |
| 5 | 2.21 (m, 2H) | 27.1 | C-3, C-4, C-6, C-7 | H-9 |
| 6 | 5.10 (dd, 1H, J = 6.6, 6.9) | 124.1 | C-4, C-5, C-8, C-9 | H-8 |
| 7 | | 133.6 | | |
| 8 | 1.68 (s, 3H) | 25.9 | C-6, C-7, C-9 | H-6 |
| 9 | 1.62 (s, 3H) | 17.8 | C-6, C-7, C-8 | H-5 |
| 10 | 2.18 (s, 3H) | 19.3 | C-2, C-3, C-4 | |
| 1' | 5.47 (d, 1H, J = 8.2) | 95.2 | C-1, C-5' | |
| 2' | 3.54 (overlapped) | 77.9 | | |
| 3' | 3.43 (dd, 1H, J = 8.9, 8.9) | 77.7 | | |
| 4' | 3.52 (overlapped) | 73.9 | | |
| 5' | 3.39 (m, 1H) | 71.2 | | |
| 6' | 3.72 (dd, 1H, J = 5.5, 11.0) | 69.2 | | |
| 4.10 (dd, 1H, J = 2.1, 11.0) | | | |
| 1'' | 4.27 (d, 1H, J = 6.2) | 104.8 | C-6', C-5'' | |
| 2'' | 3.57 (dd, 1H, J = 6.2, 8.2) | 72.4 | | |
| 3'' | 3.34 (dd, 1H, J = 8.2, 8.9) | 74.2 | | |
| 4'' | 3.78 (m, 1H) | 69.6 | | |
| 5'' | 3.51 (dd, 1H, J = 5.5, 12.4) | 66.7 | | |
| | 3.85 (dd, 1H, J = 2.8, 12.4) |
Compound
2 was obtained as a yellow oil.
+15.0 (
c 0.3, MeOH); The molecular formula C
10H
18O
3 was defined by HRESIMS (
m/z: 209.1153 [
M+Na]
+, calc. for C
10H
18O
3Na 209.1154). The
1H-NMR and
13C-NMR spectra of
2 (
Table 2) showed the presence of two methyls [
δ 1.68 (s, 3H, H-10), 1.67 (s, 3H, H-9)], two methylenes bearing an oxygen function [
δ 3.55 (dd, 1H,
J = 11.0, 8.3 Hz, H-1a), 3.46 (dd, 1H,
J = 11.0, 5.5 Hz, H-1b), 3.91 (s, 2H, H-8)], a methylene [
δ 2.87 (m 1H, H-5a), 2.79 (m 1H, H-5b), two alkene methines [
δ 5.29 (dd, 1H,
J = 7.6, 6.8 Hz, H-4), 5.38 (dd, 1H,
J = 7.6, 6.8 Hz, H-6)] and a methine [
δ 4.61 (dd, 1H,
J = 8.3, 5.5, H-2)].
The
1H-
1H COSY spectrum showed correlations between
δ 3.46 (H-1a), 3.55 (H-1b) and
δ 4.61 (H-2), suggesting a –CHOHCH
2OH fragment.
1H-
1H correlations were observed between the following proton pairs:
δ 5.29 (H-4) and
δ 2.87 (H-5a);
δ 2.87 (H-5a) and
δ 5.38 (H-6), suggesting a –CHCH
2CH– fragment. Moreover, in the HMBC spectrum, long-range correlations between the methyl proton signals at
δ 1.68 (H-10) and the carbon signals at
δ 71.6 (C-2), 136.3 (C-3) and 127.6 (C-4) could be identified. Correlations were also observed between the methyl proton signals at
δ 1.67 (H-9) and the carbon signals at
δ 125.2 (C-6), 136.2 (C-7) and 68.9 (C-8) (
Figure 2).
Table 2.
1H- and 13C-NMR data for 2 and 3 (600 and 150 MHz, CD3OD, J in Hertz and δ in ppm).
Table 2.
1H- and 13C-NMR data for 2 and 3 (600 and 150 MHz, CD3OD, J in Hertz and δ in ppm).
| Position | 2 | 3 |
|---|
| δH | δC | δH | δC |
|---|
| 1 | 3.46 (1H, dd, J = 11.0, 5.5) | 65.6 | 3.59 (1H, dd, J = 11.0, 3.7) | 66.5 |
| | 3.55 (1H, dd, J = 11.0, 8.3) | | 3.47 (1H, dd, J = 11.0, 7.0) | |
| 2 | 4.61 (1H, dd, J = 8.3, 5.5) | 71.6 | 4.09 (1H, dd, J = 7.0, 3.7) | 76.6 |
| 3 | | 136.3 | | 150.3 |
| 4 | 5.29 (1H, dd, J = 7.6, 6.8) | 127.6 | 2.07 (1H, m), 2.16 (1H, m) | 33.1 |
| 5 | 2.87 (1H, m), 2.79 (1H, m) | 27.0 | 2.24 (2H, m) | 27.2 |
| 6 | 5.38 (1H, dd, J = 7.6, 6.8) | 125.2 | 5.43 (1H, dd, J = 6.8, 6.9) | 126.3 |
| 7 | | 136.2 | | 136.3 |
| 8 | 3.91 (2H, s) | 68.9 | 3.91 (2H, s) | 68.9 |
| 9 | 1.67 (3H, s) | 13.8 | 1.66 (3H, s) | 13.8 |
| 10 | 1.68 (3H, s) | 18.5 | 4.93 (1H, d, J = 1.4) | 111.3 |
| | | | 5.11 (1H, d, J = 1.4) | |
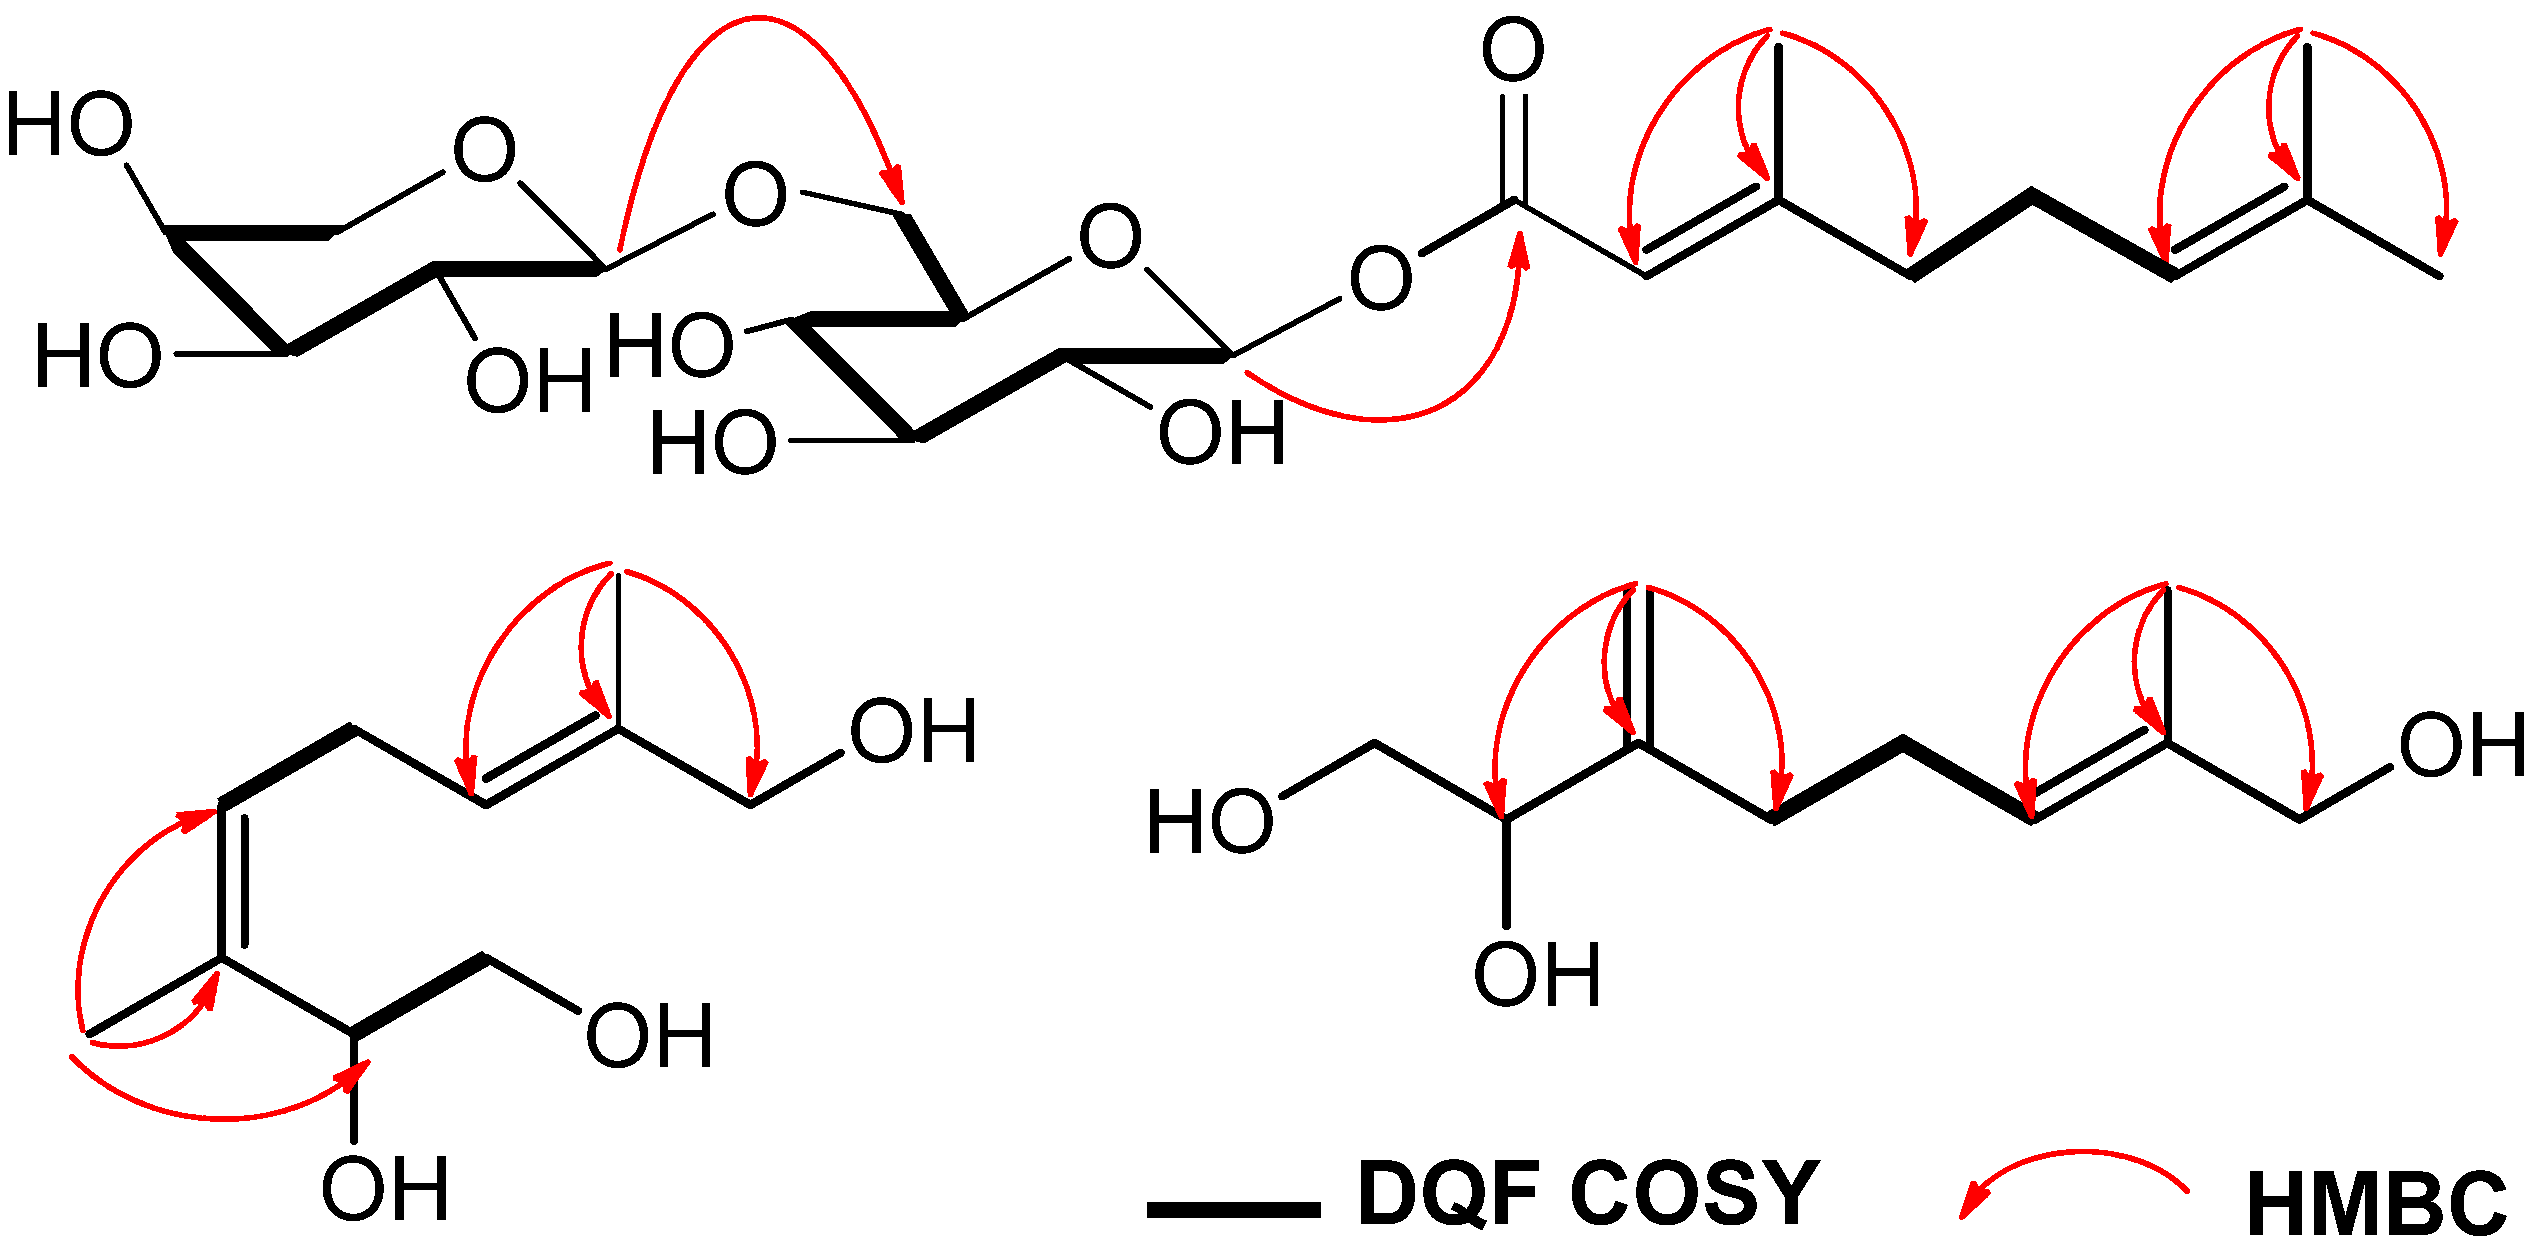
Figure 2.
Key HMBC and 1H-1H COSY correlations of 1–3.
Figure 2.
Key HMBC and 1H-1H COSY correlations of 1–3.
In the NOESY spectrum, NOE correlations were observed between the following proton pairs: δ 1.68 (H-10) and δ 5.29 (H-4); δ 5.38 (H-6) and δ 3.91 (H-8), which indicated a trisubstituted alkene with the cis-configuration in the 3 position and another alkene with the trans-configuration in the 6 position. Thus, the structure of compound 2 could be elucidated as (3Z,6E)-3,7-dimethyl-3,6-octadiene-1,2,8-triol.
Compound
3 was isolated as a yellow oil.
+30.0 (
c 0.3, MeOH). The molecular formula C
10H
18O
3 was defined by HRESIMS (
m/z: 209.1150 [
M+Na]
+, calc. for C
10H
18O
3Na 209.1154). The NMR data (
Table 2) showed an alkene methylene [
δ 4.93 (1H, d,
J = 1.4 Hz, H-10a), 5.11(1H, d,
J = 1.4 Hz, H-10b)], a methyl [
δ 1.66 (3H, s, H-9)] and a methine [
δ 5.43 (dd, 1H,
J = 6.8, 6.9 Hz, H-6)]. The structure of
3 was subsequently assigned by HMQC, DQF COSY and HMBC. In the HMBC spectrum (
Figure 2), the long-range correlations were observed between the following protons and carbons:
δ 4.93 (H-10a) and
δ 76.6 (C-2), 150.3 (C-3), 33.1 (C-4);
δ 1.66 (H-9) and
δ 126.3 (C-6), 136.3 (C-7), 68.9 (C-8). Finally, the configuration of the trisubstituted alkene was clarified by a difference NOE experiment. The irradiation of
δ 3.91 (H-8) resulted in an enhancement at
δ 5.43 (H-6), suggesting the
trans-configuration at the 6 position, Therefore, compound
3 was identified as (6
E)-7-methyl-3-methylene-6-octene-1,2,8-triol.
3. Experimental
3.1. General
Open column chromatography was carried out using silica gel (200–300 mesh, Qingdao Marine Chemical Co., Qingdao, China) or octadecyl silica gel (ODS, 25–40 μm, Fuji, Tokyo, Japan) as stationary phase. TLC employed precoated silica gel plates (5–7 μm, Qingdao Marine). Preparative HPLC was carried out on a Waters 600 instrument equipped with a Waters RID-2414 detector. A Waters Sunfire prep C18 OBD (19 × 250 mm i.d.; Waters, Milford, MA, USA) column was used for preparative purpose. The IR spectra were recorded as KBr pellets on a Jasco 302-A spectrometer (Jasco, Tokyo, Japan). The UV spectra were recorded on a Shimadzu UV-2450 spectrophotometer (Shimadzu, Kyoto, Japan). Optical rotation was recorded on a Jasco P-2000 polarimeter. HRESIMS were measured on a FTMS-7 instrument (Bruker Daltonics, Karlsruhe, Germany). The 1H, 13C and 2D (1H-1H COSY, HMQC, HMBC, NOESY) NMR spectra were recorded on a JNM-ECA600 spectrometer (JEOL, Tokyo, Japan) using standard pulse sequence. Chemical shifts were reported in ppm (δ), and scalar coupling were reported in Hz. GC analyses were carried out using a Fuli 9790 instrument, DM-5 column (0.25 μm, 30 m × 0.25 mm, Dikma, China).
3.2. Plant
The fruits of A. sessiliflorus (Rupr. et Maxim.) Seem. were collected from WuJia Agriculture Sci-Tech Co. Ltd. of Dandong, Liaoning Province, China in October, 2009 and identified by Professor Jincai Lu of School of Traditional Chinese Materia Medica of Shenyang Pharmaceutical University, China.
3.3. Extraction and Isolation
The dried and powdered fruits (12 kg) of A. sessiliflorus (Rupr. et Maxim.) Seem. were extracted with 70% EtOH (3 × 32 L) under reflux (1 h). The combined extract was concentrated under vacuum yielding a residue (2.2 kg) which was dissolved in water, loaded on a D101 macroporous adsorption resin column and eluted successively with H2O, 30% EtOH, 60% EtOH and 95% EtOH.
The 30% EtOH fraction (100.0 g) was subjected to silica gel column chromatography with a stepwise gradient CHCl
3–MeOH (10:1, 5:1, 3:1, 2:1, 1:1
v/v), and finally with MeOH alone, to give five fractions 1–6. Fraction 4 (9.7 g) was subjected to reversed-phase silica gel column chromatography [200 g, MeOH–H
2O (10:90→20:80→30:70→40:60→50:50,
v/v)→MeOH] to afford six fractions [Fr. 4.1 (3.0 g), Fr. 4.2 (506 mg), Fr. 4.3 (755 mg), Fr. 4.4 (321 mg), Fr. 4.5 (612 mg), Fr. 4.6 (538 mg)]. Fr. 4.2 (506 mg) was separated by HPLC [MeCN–H
2O (7: 93,
v/v)] to give
2 (10.6 mg) and
3 (11.2 mg). Fraction 4.3 (755 mg) was separated by HPLC [MeOH–H
2O (20:80,
v/v)] to give
6 (15.8 mg). Fraction 5 (15.1 g) was subjected to reversed-phase silica gel column chromatography [300 g, MeOH–H
2O (10:90→20:80→30:70→50:50→60:40,
v/v)→MeOH] to afford ten fractions [Fr. 5.1 (1.45 g), Fr. 5.2 (1.61 g), Fr. 5.3 (168 mg), Fr. 5.4 (995 mg), Fr. 5.5 (217 mg), Fr. 5.6 (1.1 g), Fr. 5.7 (121 mg), Fr. 5.8 (674 mg), Fr. 5.9 (2.0 g), Fr. 5–10 (197 mg)]. Fraction 5.2 (533 mg) was separated by HPLC [MeOH–H
2O (35:65,
v/v)] to give
1 (20.1 mg). Fraction 5.3 (197 mg) was separated by HPLC [MeOH–H
2O (35:65,
v/v)] to give
4 (15.3 mg). Fraction 5.4 (426 mg) was separated by HPLC [MeOH–H
2O (40:60,
v/v)] to give
5 (8.5 mg). The known compounds kenposide A (
4) [
8], sacranoside B (
5) [
9] and 1-
O-[(
S)-oleuropeyl]-
β-
d-glucopyranose (
6) [
10] were identified by comparison of their analytical data ([α]
D,
1H-NMR,
13C-NMR, MS) with those reported.
(2E)-3,7-Dimethylocta-2,6-dienoate-6-O-α-l-arabinopyranosyl-(1→6)-β-d-glucopyranoside (
1).
–31.0 (
c 0.3, MeOH). HR-ESI-MS
m/z 485.1995 [
M+Na]
+ (calc. C
21H
34O
11Na, 485.1999); UV max (MeOH) 221 nm; IR (KBr) 3410, 1715, 1645, 1423, 1385, and 1073 cm
−1;
1H- and
13C-NMR (CD
3OD) data, see
Table 1.
(3Z,6E)-3,7-Dimethyl-3,6-octadiene-1,2,8-triol (
2).
+15.0 (
c 0.3, MeOH). HR-ESI-MS
m/z 209.1153 [
M+Na]
+ (calc. C
10H
18O
3Na, 209.1154); UV max (MeOH): 205 nm; IR (KBr) 3355, 2971, 1717 and 1160 cm
−1;
1H- and
13C-NMR (CD
3OD) data, see
Table 2.
(6E)-7-Methyl-3-methylene-6-octene-1,2,8-triol (
3).
+30.0 (
c 0.3, MeOH). HR-ESI-MS
m/z 209.1150 [
M+Na]
+ (calc. C
10H
18O
3Na, 209.1154); UV max (MeOH): 202 nm; IR(KBr) 3903, 2965, 1668 and 1055 cm
−1;
1H- and
13C-NMR (CD
3OD) data, see
Table 2.
3.4. Acid Hydrolysis of and Determination of the Absolute Configuration of the Monosaccharides
Compound 1 (3.03 mg) was hydrolyzed with 1 M HCl (1.0 mL) for 2 h at 85 °C. The reaction mixture was cooled and partitioned between CHCl3 (2.0 mL) and H2O (2.0 mL). The aqueous layer was washed with CHCl3 (3.0 mL × 3), neutralized with Ba(OH)2, filtered, and evaporated under reduced pressure. The residue was dissolved in pyridine (1.0 mL) and 0.1 M L-cysteine methyl ester hydrochloride in pyridine (2.0 mL) was added. The mixture was heated at 60 °C for 1 h. An equal volume of Ac2O was added with heating continued 1 h. The acetylated thiazolidine derivatives were analyzed by GC using a DM-5 Column (30 m × 0.25 mm, 0.25 μm). Temperatures of injector and detector were 280 °C for both. A temperature gradient system was used for the oven; starting at 160 °C and increasing up to 195 °C at a rate of 5 °C/min. Peaks of the hydrolysate were detected by comparison with retention time of authentic samples of d-glucose (10.08 min) and l-arabinose (6.55 min) after treatment with l-cysteine methyl ester hydrochloride in pyridine.

 ,
, 

