1. Introduction
The pineal hormone, melatonin (
N-acetyl-5-methoxytryptamine, MLT), is a neurohormone primarily synthesized and released by vertebrates pineal gland in a circadian fashion at night. MLT has been shown to be an important hormone in modulation of several endocrinological, neurophysiological, and behavioral functions [
1,
2,
3]. These effects result from the activation of at least two high-affinity G-protein coupled receptors, designated as MT
1 and MT
2, localized in the central nervous system and in peripheral tissues [
4]. In human beings, MLT has been shown to be applicable in the treatment of sleep disorders to improve sleep quality [
5], alleviate jet lag [
1], and as an effective free radical scavenger and anti-oxidant [
6].
MLT administration (15 mg/day) to cancer patients for four weeks has led to induction of eosinophilia [
7,
8]. It has been documented that three different commercial MLT preparations contain six contaminants structurally related to those found in contaminated L-tryptophan (Trp) preparations [
9]. MLT contaminants are present in amounts of 0.1–0.5% of the parent MLT in the investigated commercial MLT preparations based on both UV and MS responses [
9]. Contaminants in Trp preparations are responsible for the 1989 outbreak of eosinophilia-myalgia syndrome (EMS), which affected about 1,500 people and led to about 30 deaths in the United States [
10]. Two contaminants in commercial MLT preparations were identified to be hydroxymelatonin isomers with
m/
z [M+H]
+ = 249 whereas, other four contaminants were identified as melatonin-formaldehyde condensation products with
m/
z [M+H]
+ = 477 [
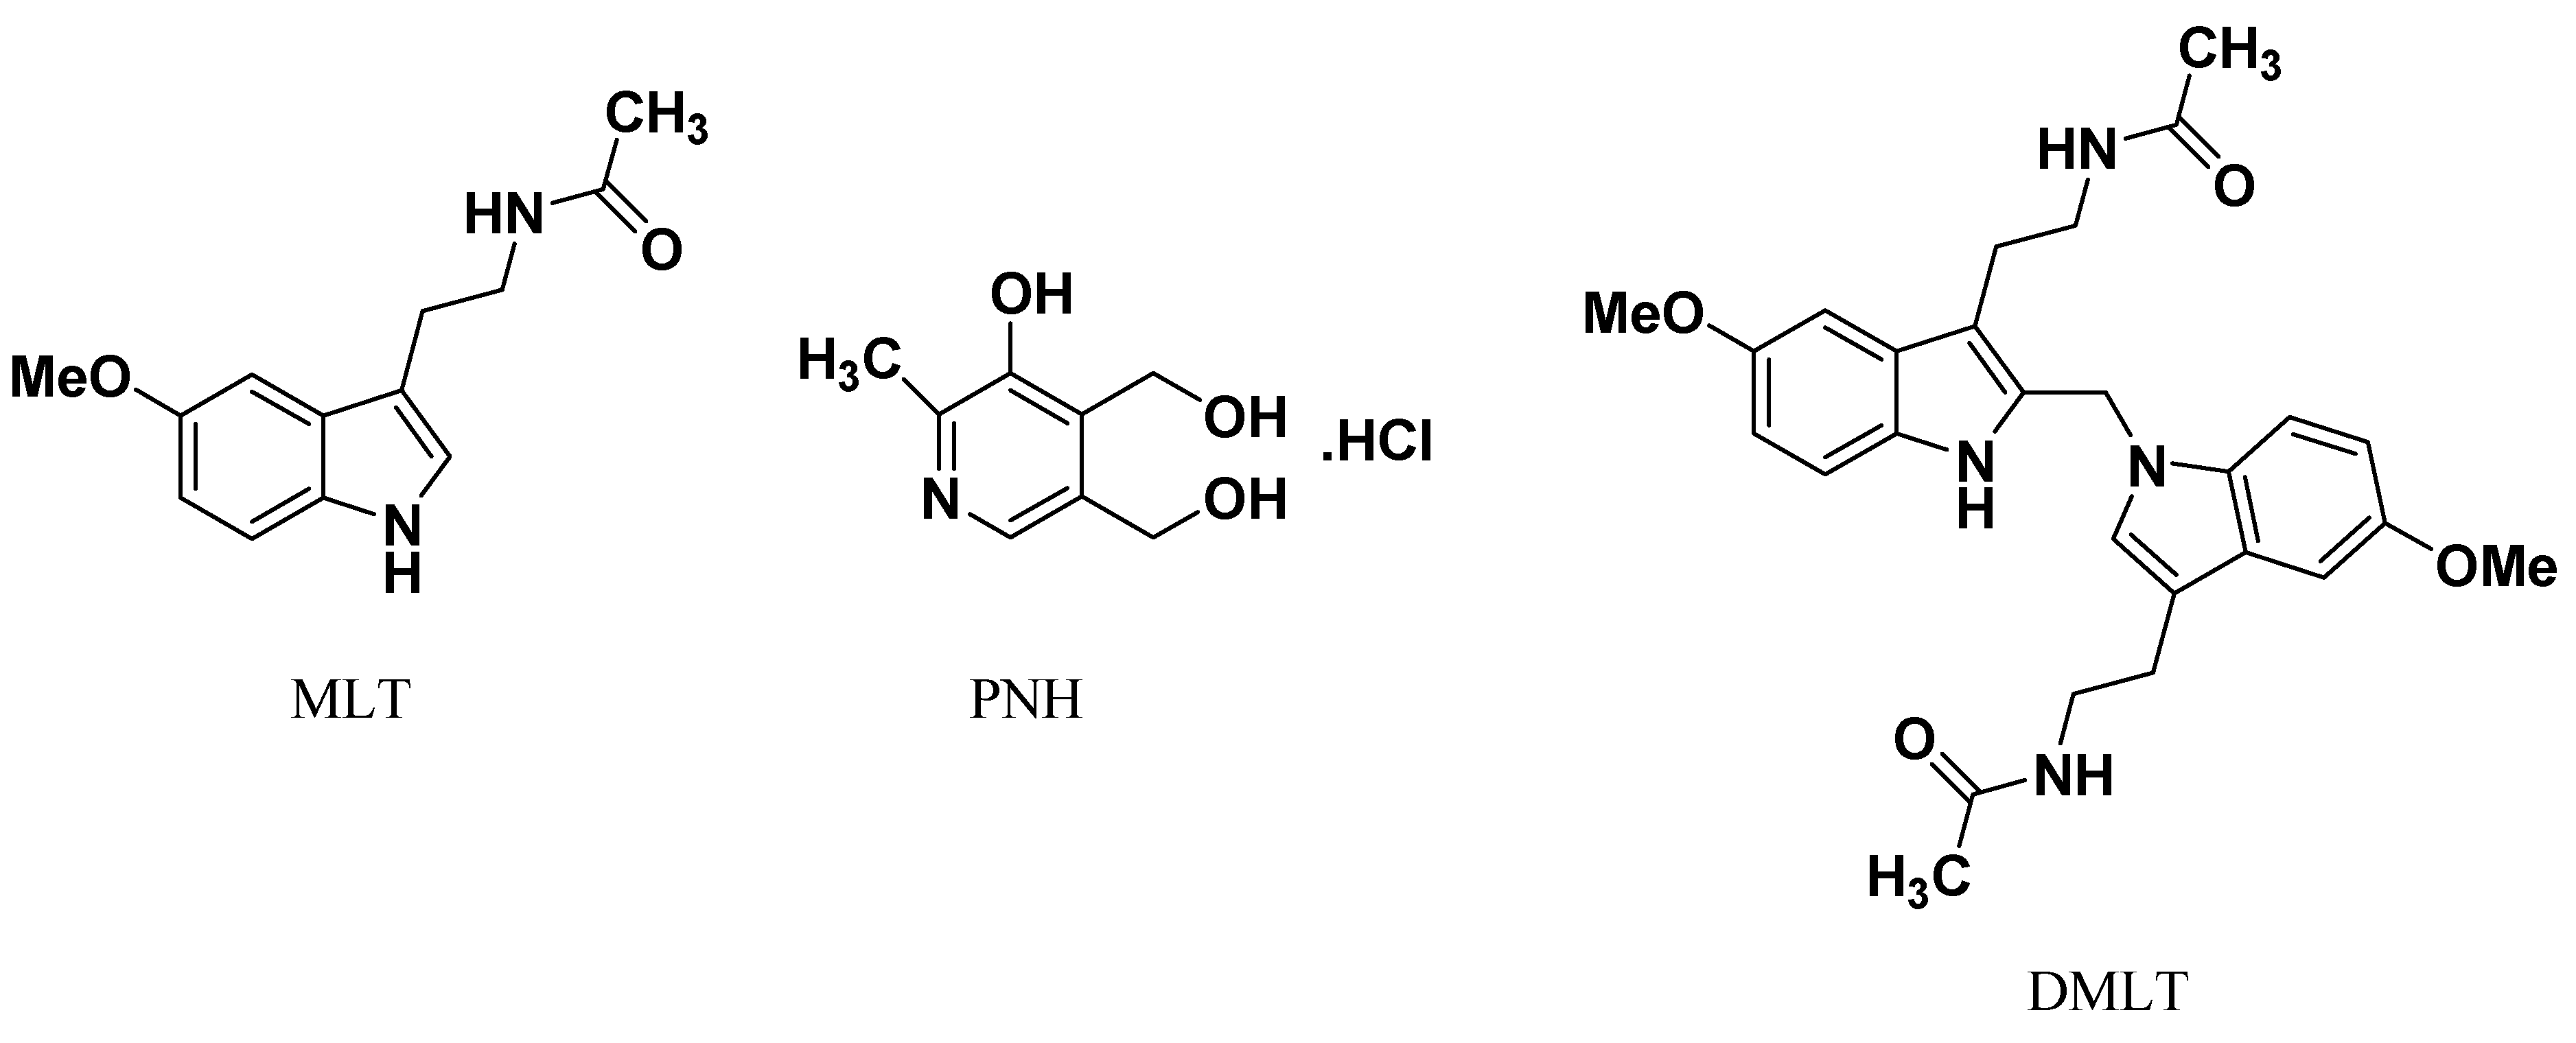
9]. DMLT (
Figure 1) is the most abundant regioisomer among the four melatonin-formaldehyde condensation contaminants that were found in the commercial preparations of MLT [
9].
Pyridoxine hydrochloride (PNH,
Figure 1), as one form of vitamin B
6, is an essential vitamin for humans. PNH is a water soluble vitamin and involved principally in amino acid, carbohydrate and fat metabolism. It is required for the formation of hemoglobin as well as many different physiological properties [
11,
12]. Additionally, PNH is co-formulated with MLT in many dietary supplements for health-care purposes and sold over-the-counter in the United States.
An evaluation of the literature revealed that a HPLC/tandem mass spectrometry (LC/MS/MS) method [
9] in addition to our spectrofluorimetric methods [
13] have been published for the determination of only MLT in the presence of DMLT. Other studies showed that MLT alone was determined by liquid chromatography (LC) with electrochemical detection [
14,
15,
16,
17,
18], fluorometric detection [
16,
19,
20,
21,
22] and mass spectrometric detection [
23]. Moreover, gas chromatography [
24], radioimmunoassy (RIA) [
25] and anodic stripping voltammetry [
26] were also found in the literature for the analysis of MLT. The aforementioned techniques were utilized to analyze MLT in biological matrices such as blood, urine, pineal glands,
etc. Additionally, a number of reports about the analytical methods for PNH were mainly LC [
27,
28,
29] and capillary electrophoresis [
30,
31,
32] based. There are few methods available for simultaneous measurements of MLT and PNH, such as gas chromatography-mass spectrometry [
33], capillary electrophoresis with electrochemical detection [
34] and zero-crossing derivative spectrophotometry [
35], but they suffer from sophistication, laborious treatments and lower sensitivity, respectively. Examination of the literature exposed two chemometric methods for simultaneous determination of MLT and PNH [
36,
37].
A sizable number of MLT dietary supplement tablets contain PNH as a co-formulated ingredient and are sold over-the-counter. The association of MLT with PNH in many pharmaceutical preparations is probably due to the synergetic effect in the therapy of some diseases [
36]. A spectrofluorimetric method for determination of MLT in the presence of its main impurity, DMLT, was recently reported [
13]. An examination of the literature revealed that there are no reports of analysis of MLT and PNH in the presence of DMLT. Therefore, development of simple, accurate, and sensitive methods for the routine analysis of MLT and PNH in the presence of DMLT is of invaluable importance as daily intake of MLT is not established yet. That necessitated the development of simple and fast procedures that could be applied in quality control laboratories for the determination of MLT in presence of PNH and DMLT. So far, we have not found any reports on the simultaneous determination of MLT in presence of PNH and DMLT in dosage forms. Multivariate calibration methods such as partial least squares (PLS) and artificial neural networks (ANNs) are useful means of resolving different overlapping spectra and eliminating matrix interference in the assay of various multi-component mixtures [
38,
39]. The principle advantages of applying these methods to spectrofluorimetric data are; the improvement of sensitivity and selectivity as well as the significant economic advantages over other sophisticated instrumental techniques such as HPLC/tandem mass spectrometry. According to the aforementioned premises and as a continuation of our effort to develop new spectrofluorimetric methods for determination of MLT in the presence of DMLT, we report herein novel analytical methods for determination of MLT and its co-formulated interferent, PNH, in the presence of DMLT.
1.1. Overview of Multivariate Calibration Methods
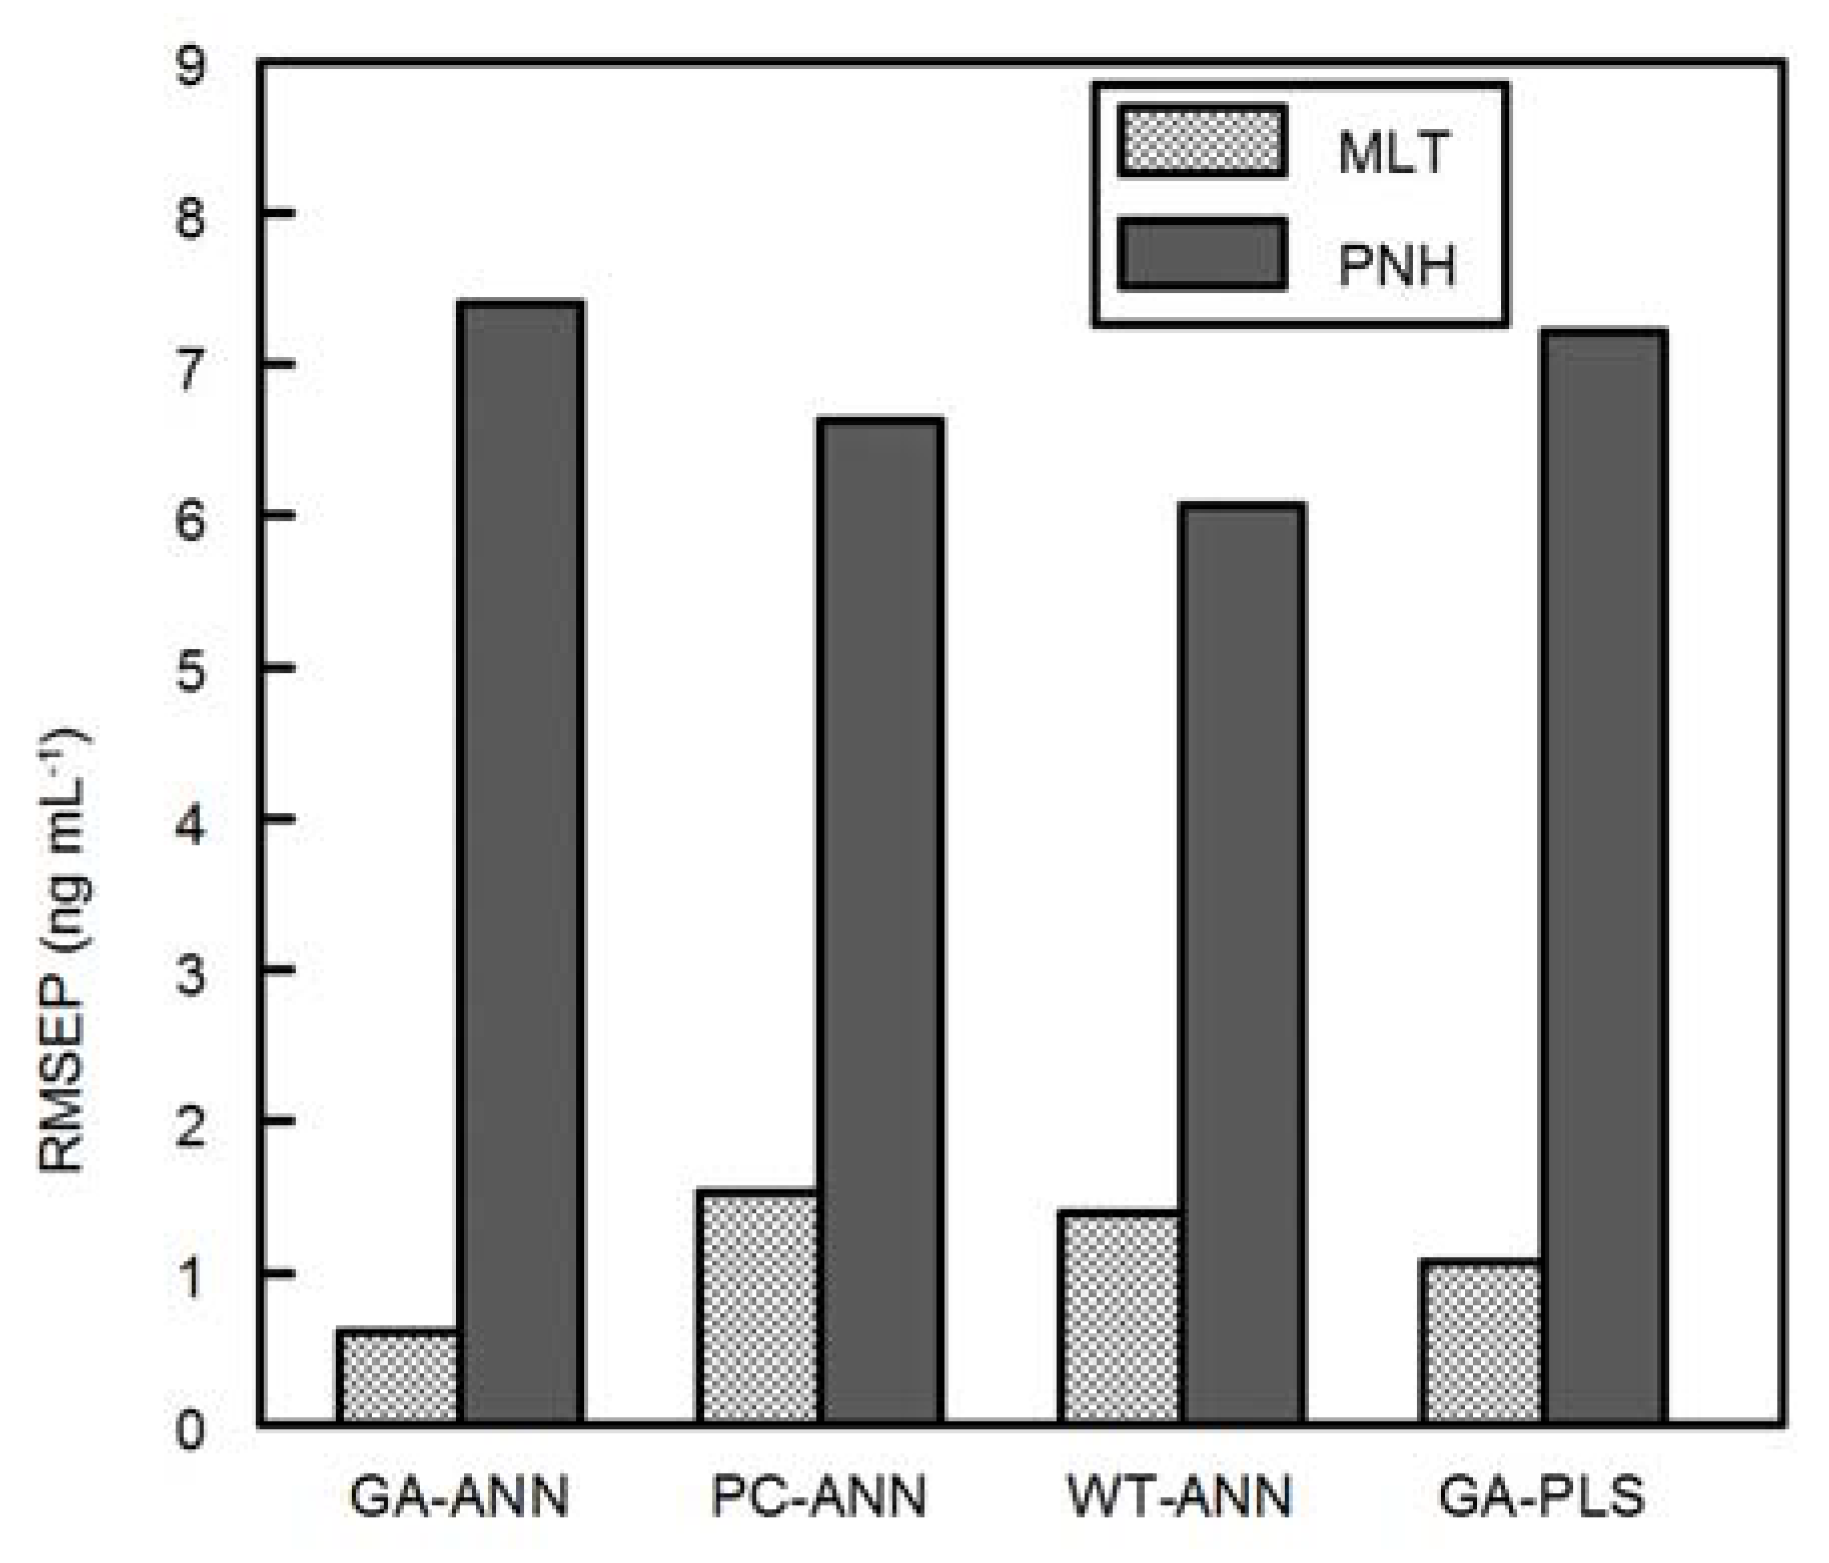
Four chemometric methods, namely artificial neural network preceded by genetic algorithm (GA-ANN), principal component analysis (PCA-ANN) and wavelet transform procedures (WT-ANN) as well as partial least squares preceded by genetic algorithm (GA-PLS) were applied in this study. In general, this study was primarily designed to promote the proposed multivariate methods as attractive candidates for usual univariate calibration methods for fluorescence spectral data. Secondly, to make a comparative study between different variable selection and data compression procedures and their effect on increasing predictive power of PLS and ANN models. Finally, to analyze MLT and PNH in the presence of DMLT in pharmaceutical preparations since all articles, to the best of our knowledge, analyze only MLT and PNH.
1.1.1. Pre-Processing Procedures
1.1.1.1. Genetic Algorithm
Genetic algorithms (GA) [
40,
41,
42,
43] have been used to solve difficult problems with objective functions that do not possess ‘nice’ properties such as continuity, differentiability,
etc. These algorithms maintain and manipulate a family, or population, of solutions and implement a ‘survival of fittest’ strategy in their search for better solutions.
Optimisation of Genetic Algorithm Parameters
A critical issue of successful GA performance is the adjustment of GA parameters. The parameters are: the maximum number of generations, the number of wavelengths in a window, percent genes included at initiation, the mutation rate, breeding cross over rule and percent of population the same at convergence. Other parameters to be chosen by the user are: maximum number of latent variables for the PLS, cross validation type random or contiguous blocks, number of subsets to divide data for cross validation, number of iterations for cross validation at each generation.
1.1.1.2. Wavelet Transform
WT is a recent signal processing technique [
44]. Many applications of WT in chemistry appeared in the literature such as resolution of overlapped chromatographic peaks [
45], signal denoising [
46] and multivariate calibration [
47,
48].
Theory and Algorithm
Wavelet transform (WT) represents a windowing technique with variable-sized regions. It is similar to Short-Time Fourier Transform (STFT) in that both techniques analyze an input signal in blocks by translation (movement) of a basis function. This basis function in STFT is sine wave and it is called wavelet in WT. Wavelet analysis is the breaking up of a signal into shifted and scaled versions of the original (or mother) wavelet. Scaling a wavelet simply means stretching (or compressing) it and shifting a wavelet simply means delaying (or hastening) its onset. The WT is expressed as:
where
WT ab (t) is the transformed signal,
x (t) is the original signal,
ψ is the mother wavelet, t is time (or any pseudo-index, e.g., wavelength in spectroscopy),
a is the scale parameter and
b is the translation parameter. The transformed signal is a function of two variables,
b and
a, the translation and the scale parameters, respectively. The term translation is related to the location of the window, as the window is shifted through the signal. The translation term corresponds to time information in the transform domain. The scale parameter is defined as 1/frequency. Low frequencies (high scale) correspond to a global information of a signal (that usually spans the entire signal), where high frequencies (low scales) correspond to a detailed information of a hidden pattern in the signal (that usually lasts a relatively short time) [
49].
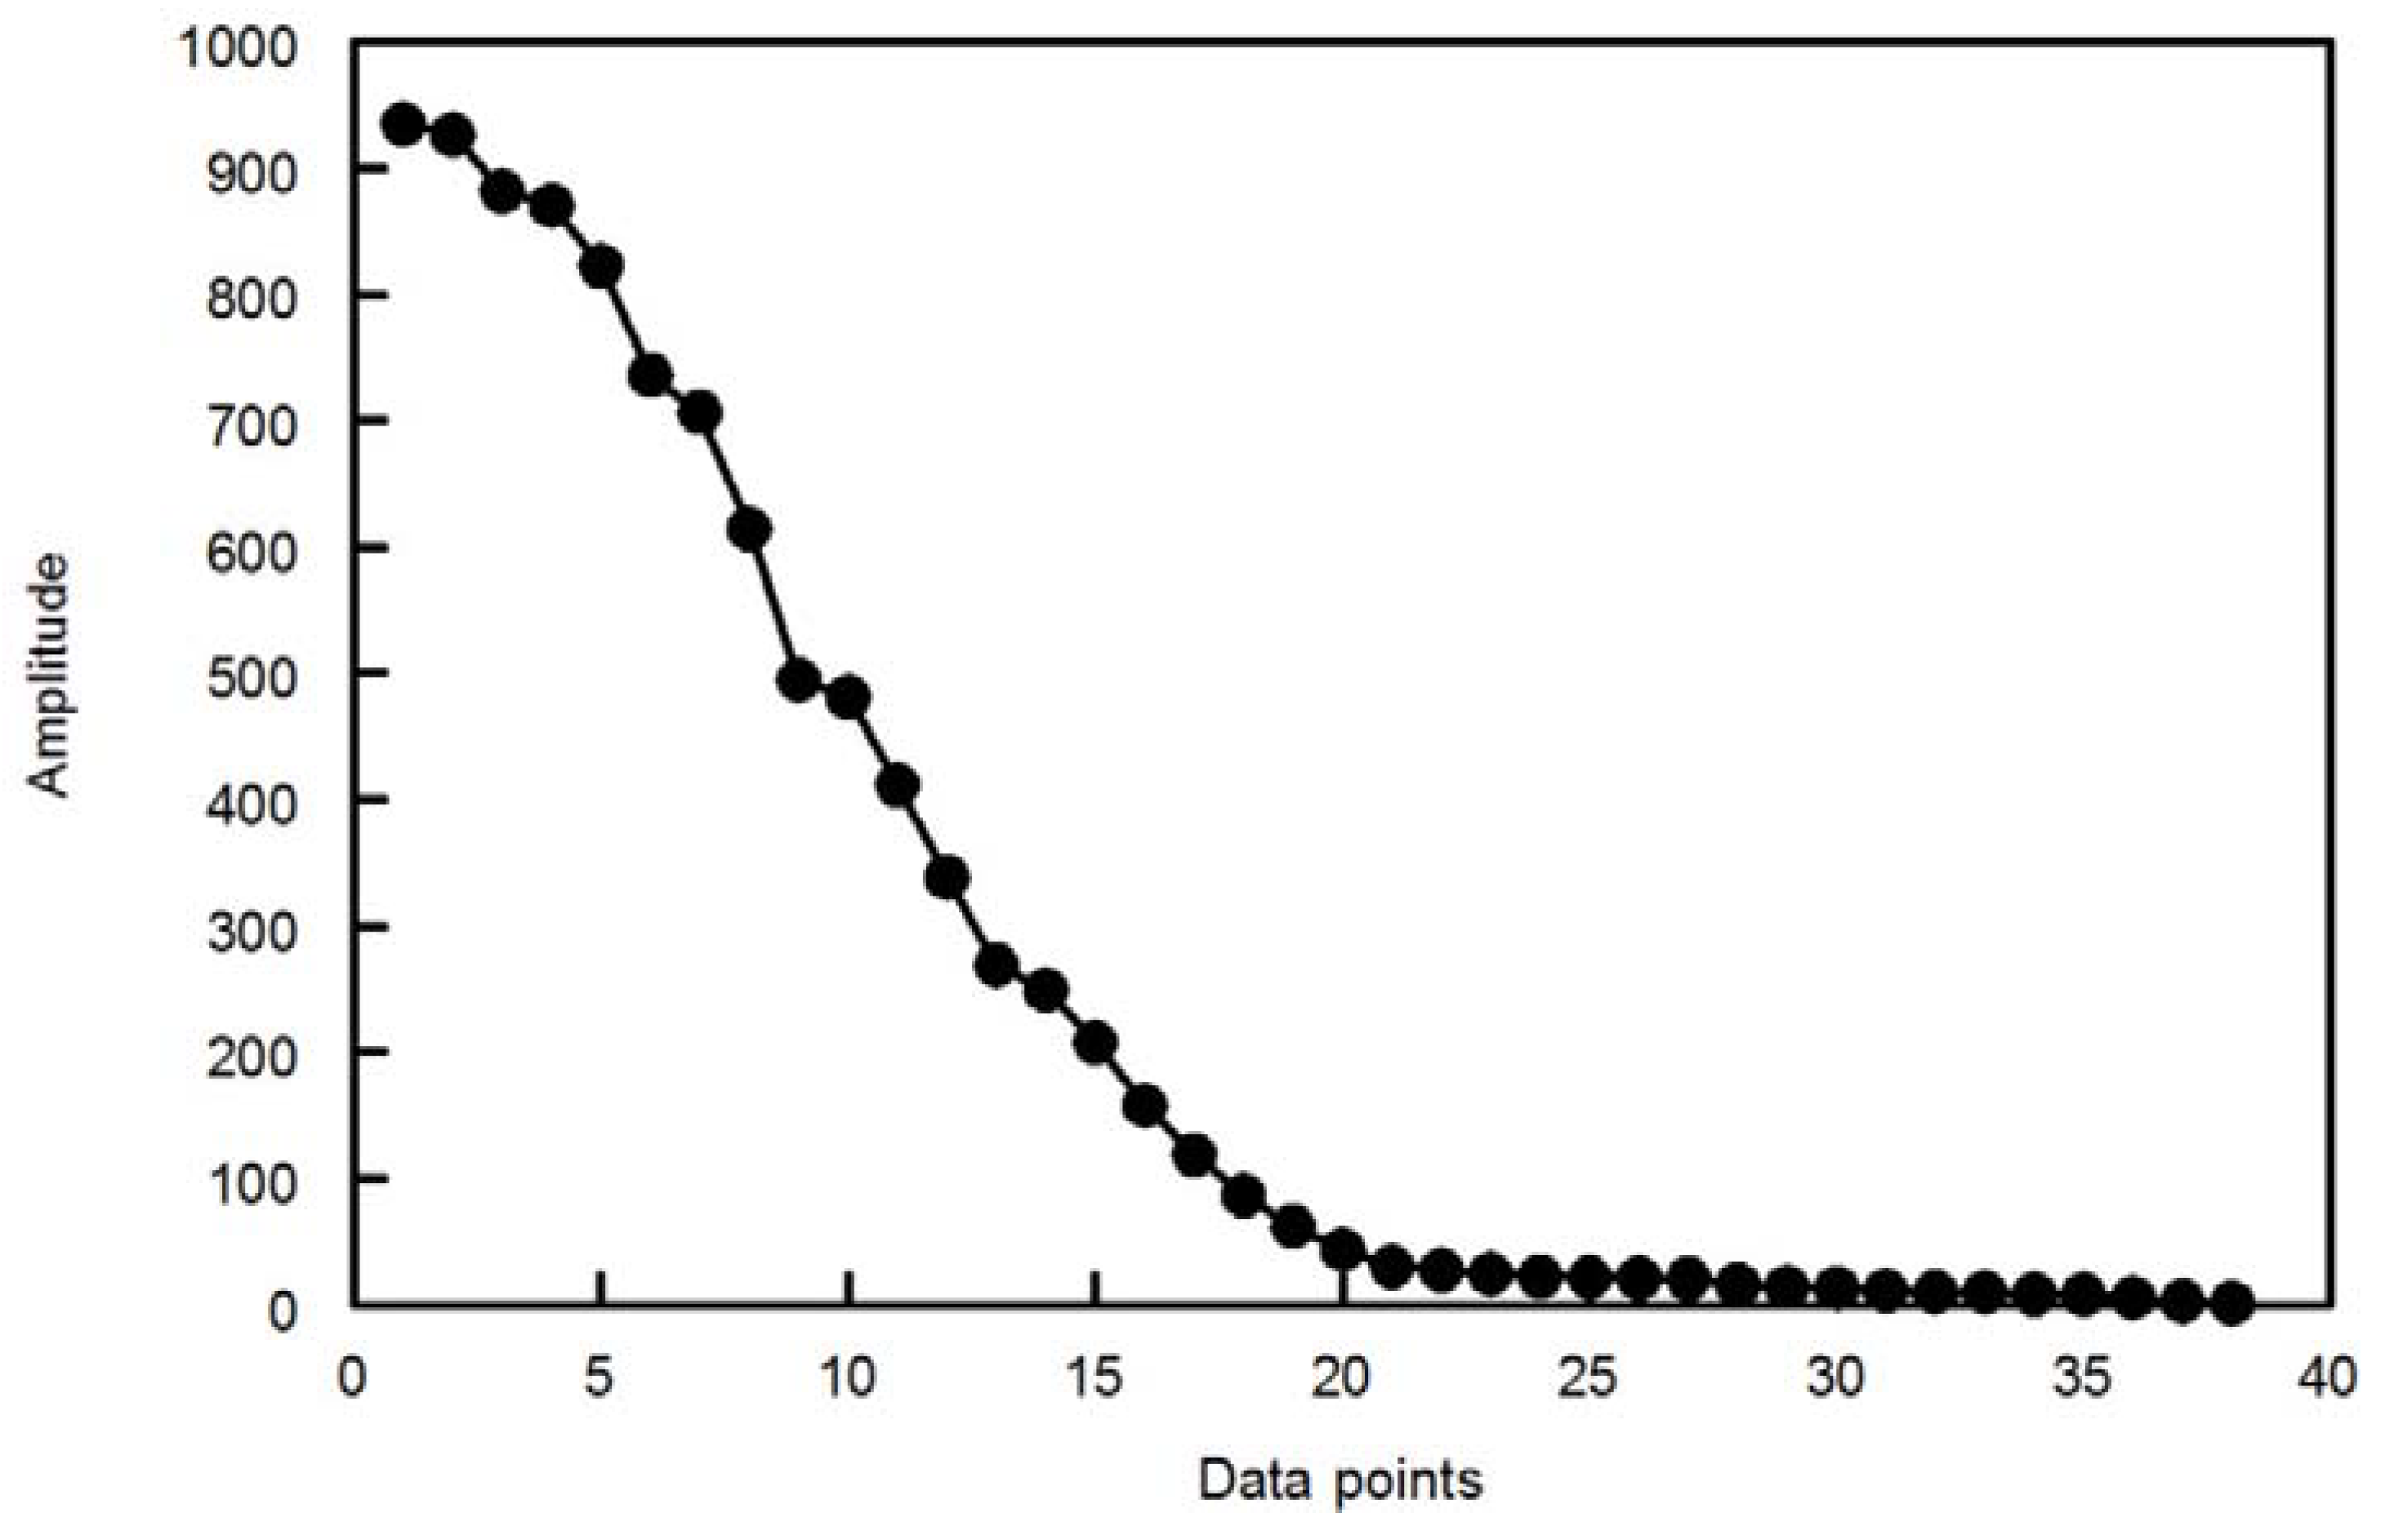
The discrete wavelet transform (DWT) is easier to implement than the continuous wavelet transform (CWT). The CWT is computed at every possible scale while in DWT, the scale is chosen based on powers of two so called dyadic scales. An efficient way to implement DWT is the Mallat algorithm. In this algorithm, at each scale, the signal is passed through a series of high pass filters to analyze the high frequency components and passed through a series of low pass filters to analyze the low frequency components. The output from the high pass filter at each scale is recorded as the wavelet coefficients. The low pass filter extracts the low frequency components which are subjected, in the next scale; to a new set of high and low pass filters. This operation will divide the input signal into two parts, the approximation and details. The approximations are the high scale, low frequency components of the signal. The details are the low scale, high frequency components (mostly noise) that can be discarded without any major loss of the information, allowing signal compression. At each successive scale (n-1) the length of the vector upon which the filters operate is halved; this is referred to as decimation.
Many of the detailed coefficients are very small in amplitude and can be removed without major loss in the information content of the signal. There are many methods to determine the threshold value below which the wavelet coefficients can be removed safely [
49]. The threshold defined by the root mean square error (RMSE) of the reconstructed signal is the most commonly used method because RMSE is a measure of the quality of compression [
49]. A large error means that a significant portion of the useful information of the signal is lost after compression, while an excessively small error will affect the compression efficiency. In order to obtain optimal filter and resolution level
j for the spectrum, the RMSE between the original measured spectrum and reconstructed signal by different wavelet filters and different resolution level
j were investigated.
1.1.2. Multivariate Calibration Models
1.1.2.1. Partial least squares regression (PLS)
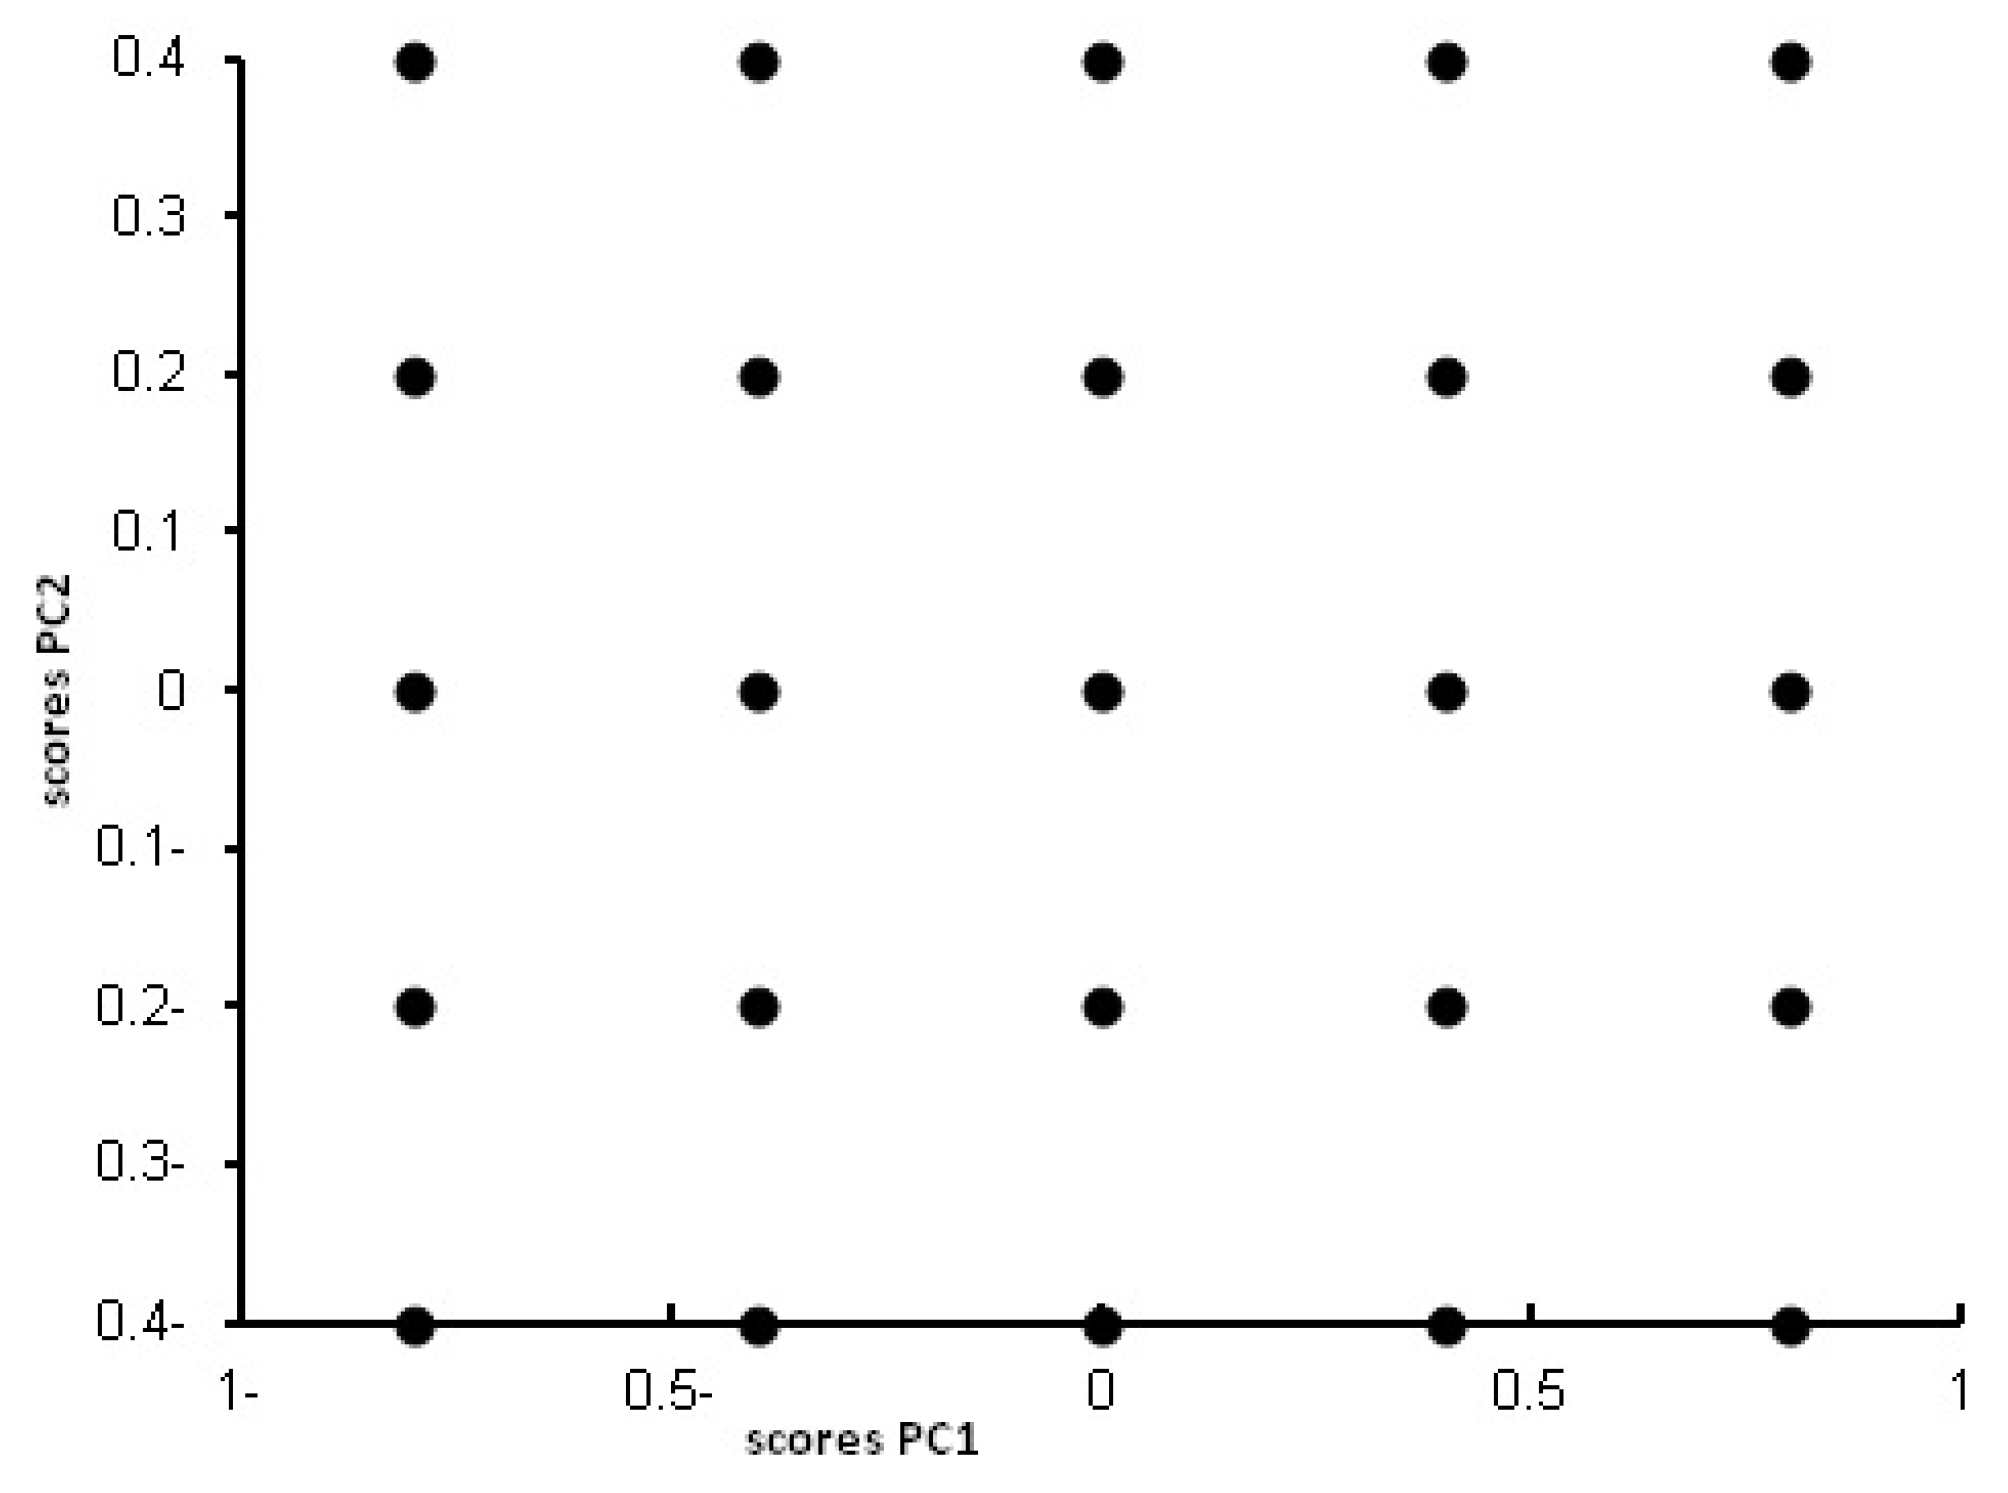
PLS method involves the decomposition of the experimental data, such as spectrofluorimetric data in our case, into systematic variations (latent variables) that explain the observed variance in data. The purpose of PLS method is to build a calibration model between the concentration of the analytes under study (MLT and PNH in our case) and the latent variables of the data matrix. PLS performs the decomposition using both spectrum data matrix and analyte concentration [
50]. Including extra latent variables in the model increases the possibility of the known problem of overfitting. Therefore optimization of number of the latent variables is a critical issue in the PLS method.
Optimisation of Number of Latent Variables for PLS Model
Cross validation (CV) [
51] is applied to predict how many are the optimum number of PLS latent variables. CV involves repeatedly dividing the data into two sets, a training set used to determine a model and a test set to determine how well the model performs so that each sample (or portion of the data) is left out of the training set once only.
Leave one out (LOO) CV is used in our study for optimizing the number of PLS components, by building the model using I-1 samples set (training set consisting of 14 samples) to predict the one sample left (validation sample). The root mean square error of CV (RMSECV) is calculated as:
where
I is the number of objects in the calibration set,
ci is the known concentration for sample
i and
is the predicted concentration of sample
i using
A components. Mean centering is performed on the training set each time successive samples are left out. In this study, PLS model preceded by genetic algorithm as variable selection procedure is applied.
1.1.2.2. Neural Networks
Artificial neural network (ANN) is a type of artificial intelligence method that resembles the biological nervous system in having the ability to find the relationship between inputs and outputs. ANN is composed of elements called artificial neurons that are interconnected by connections called weights. Commonly neural networks are trained, so that a particular input leads to a specific target output. The network is adjusted, based on a comparison of the output and the target, until the network output matches the target. Typically many input/target pairs are used to train a network [
52]. ANN has greater superiority over other classical multivariate methods in modeling linear and non-linear relationship between variables [
53,
54,
55].
The type of ANN used in this paper is the feed-forward model which is trained with the back propagation of errors learning algorithm. The back-propagation ANN is used in signal processing, data reduction and optimization, interpretation and prediction of spectra and calibration [
53]. It is composed of three layers, an input layer in which the input data are introduced (e.g., FI in spectroflourometry). These inputs are passed to second hidden layer in which inputs are corrected and adjusted by weights and then finally passed to outer most layer (output layer) to give outputs (e.g., concentrations). The connections (weights) between layers are passed forward (from input to output layer), so it is called feed-forward ANN. The outputs (predicted concentrations) are compared with targets (actual concentrations) and the difference between them is called the error which is back propagated (and so called feed-forward ANN with the back propagation of errors learning algorithm) to the network once more to be minimized through further adjustment of weights. ANN is iterated several times in such a way till the error reaches a minimum value. In this study, ANN model preceded by genetic algorithm, principal component analysis and wavelet transform as input data reduction procedures are applied.
Optimization of the ANN model parameters
For proper training of the ANN model, several parameters have to be optimized. There are two transfer functions used in ANN, one between input and output of a node in the hidden layer and the other is applied in output layer. The use of these functions depends on relationship between the inputs and outputs. Tan sigmoid followed by purelin are commonly used for non-linear systems while purelin-purelin transfer functions are used for linear one (as in our case).
Among other ANN parameters, the hidden neurons number (HNN) is related to the converging performance of the output error function during the learning process. The learning coefficient (Lc) controls the degree at which connection weights are modified during the learning phase. The learning coefficient decrease (Lcd) and learning coefficient increase (Lci) control the variation of Lc value. It varies as a function of performance of the ANN (the Lc decreases or increases with the mean square error).
3. Experimental
3.1. Apparatus
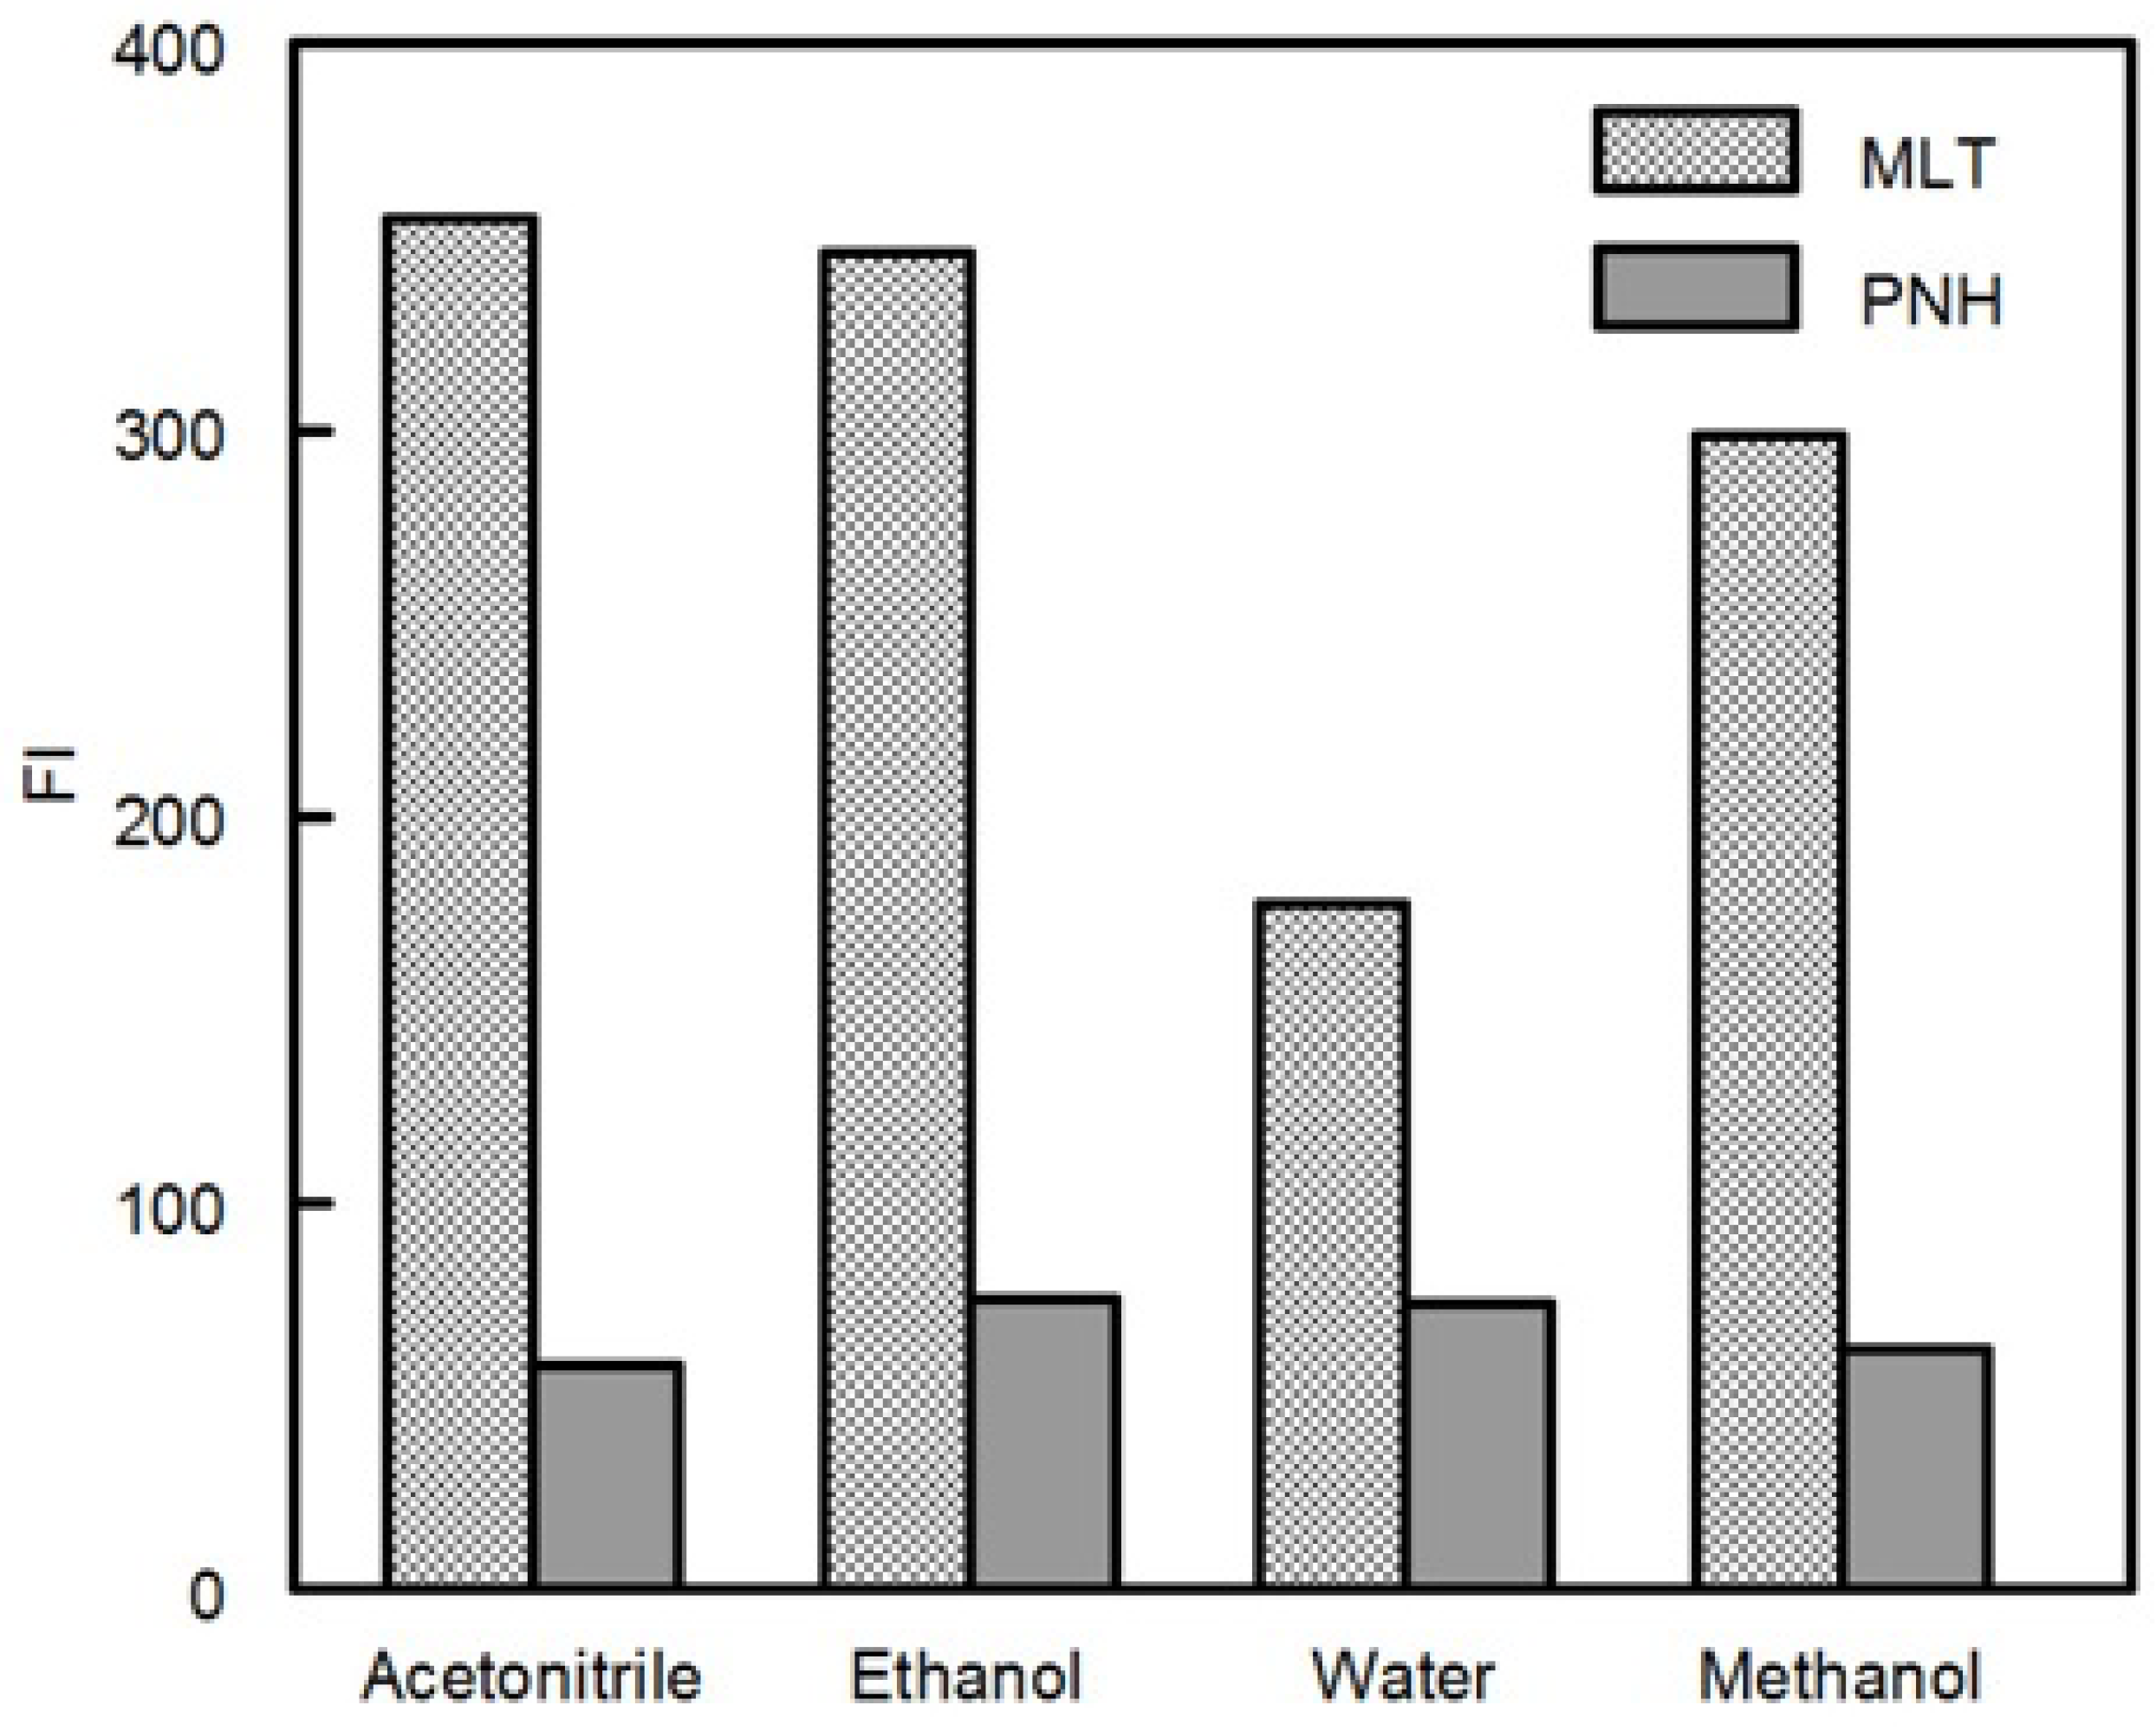
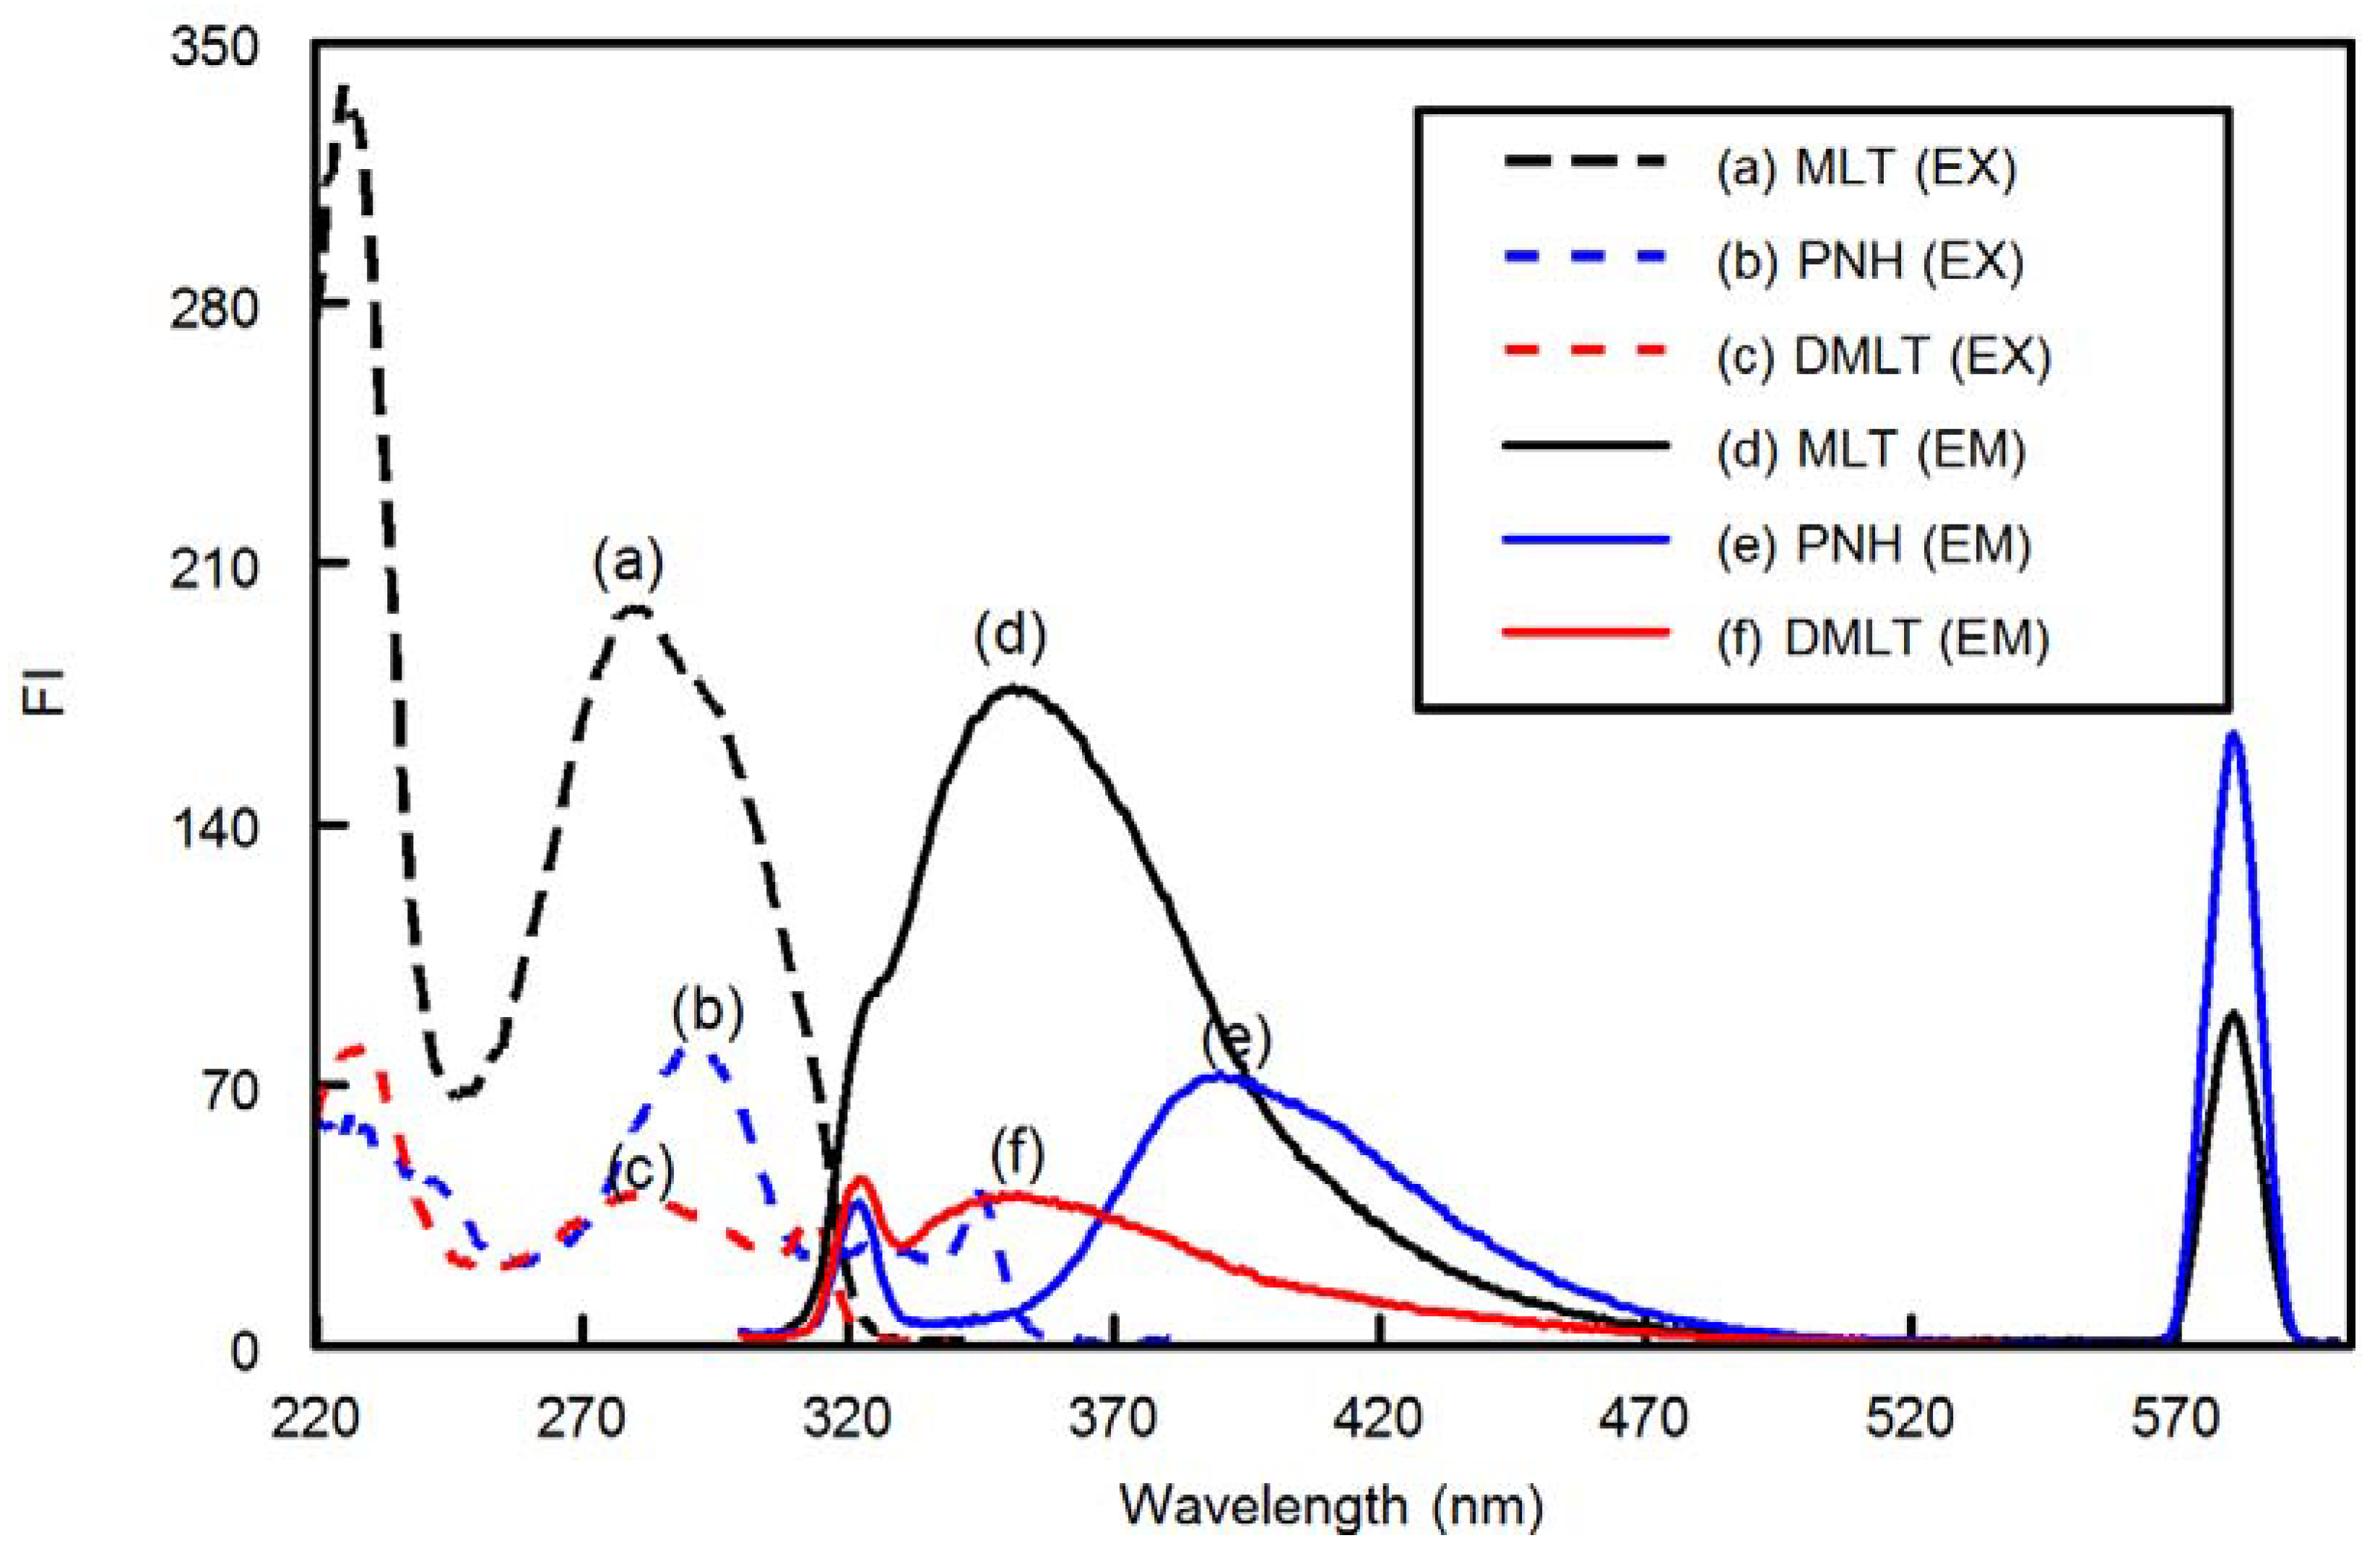
Fluorescence measurements were carried out on a RF-3501 version 3.0 spectrofluorimeter (Shimadzu Corporation, Kyoto, Japan) equipped with a 150 W xenon lamp and 1 cm quartz cells. The slit widths for both the excitation and emission monochromators were set at 5.0 nm. The calibration and linearity of the instrument were frequently checked with standard quinine sulphate (0.01 µg mL─1). Wavelength calibration was performed by measuring λ excitation at 275 nm and λ emission at 430 nm; no variation in the wavelength was observed. All recorded spectra converted to ASCII format by RFPC software. Hanna pH-Meter (Cluj-Napoca, Romania) was used for pH adjustments.
3.2. Software
All multivariate calibration methods were implemented in Matlab® 7.1.0.246 (R14). GA-PLS, GA-ANN, PCA-ANN and WT-ANN were carried out by using PLS toolbox software version 2.1 in conjunction with Neural Network toolbox. The t test, F test were performed using Microsoft® Excel. All calculations were performed using intel® core™ i5-2400, 3.10 GHz, 4.00GB of RAM under Microsoft Windows 7.
3.3. Materials
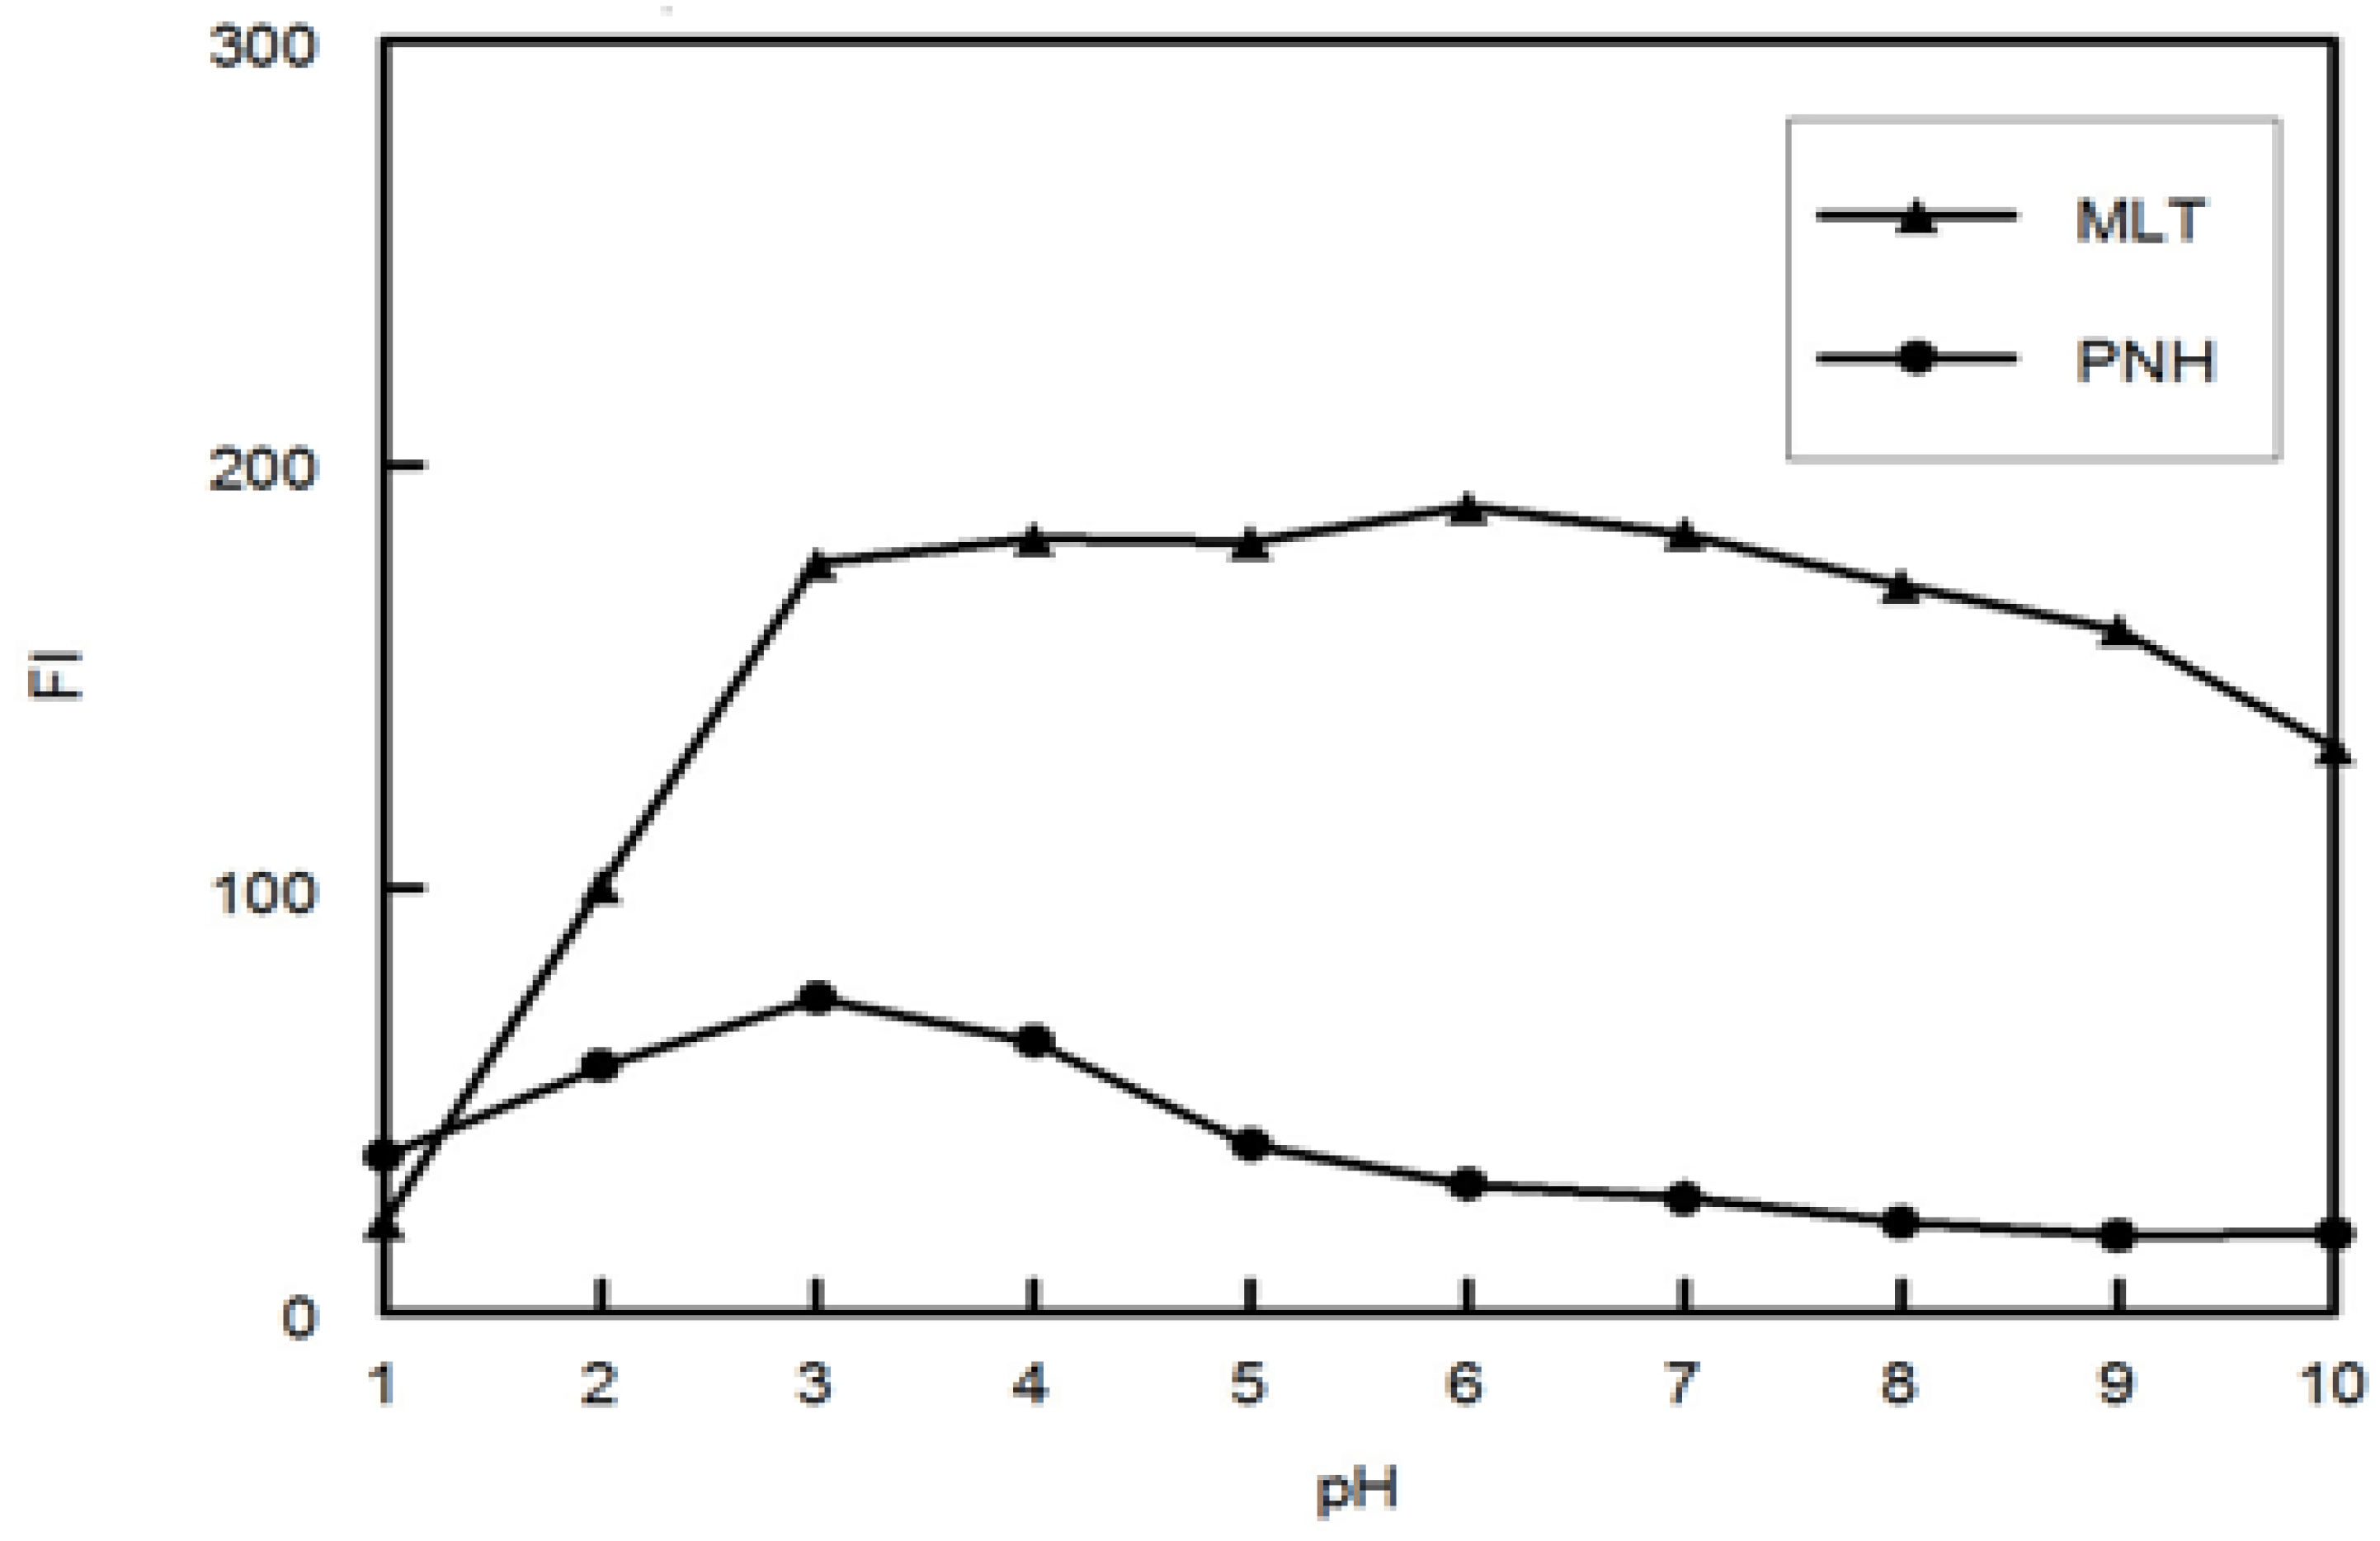
MLT was obtained from AK Scientific Inc. (Union City, CA, USA). PNH was kindly donated by the Saudi Food and Drug Administration (SFDA). The purities of MLT and PNH were 99.5%. Melatonin® tablets (MasoN company, Miami Lakes, FL, USA) labeled to contain 3 mg of MLT and 1 mg of PNH (Lot No: 9151J). Double distilled water was obtained through WSC-8S water purification system (Hamilton Laboratory Glass Ltd., Kent, UK) and used throughout the work. A phosphate buffer solution (pH 3, 0.1 M) was employed for pH adjustment. All solvents and materials used throughout this study were of analytical grade.
3.4. Synthesis
Synthesis and characterization of
N-{2-[1-({3-[2-(acetylamino)ethyl]-5-methoxy-1
H-indol-2-yl}methyl)-5-methoxy-1
H-indol-3-yl]ethyl}acetamide (DMLT) and its intermediates were previously reported [
13].
3.5. Preparation of Standard Solutions
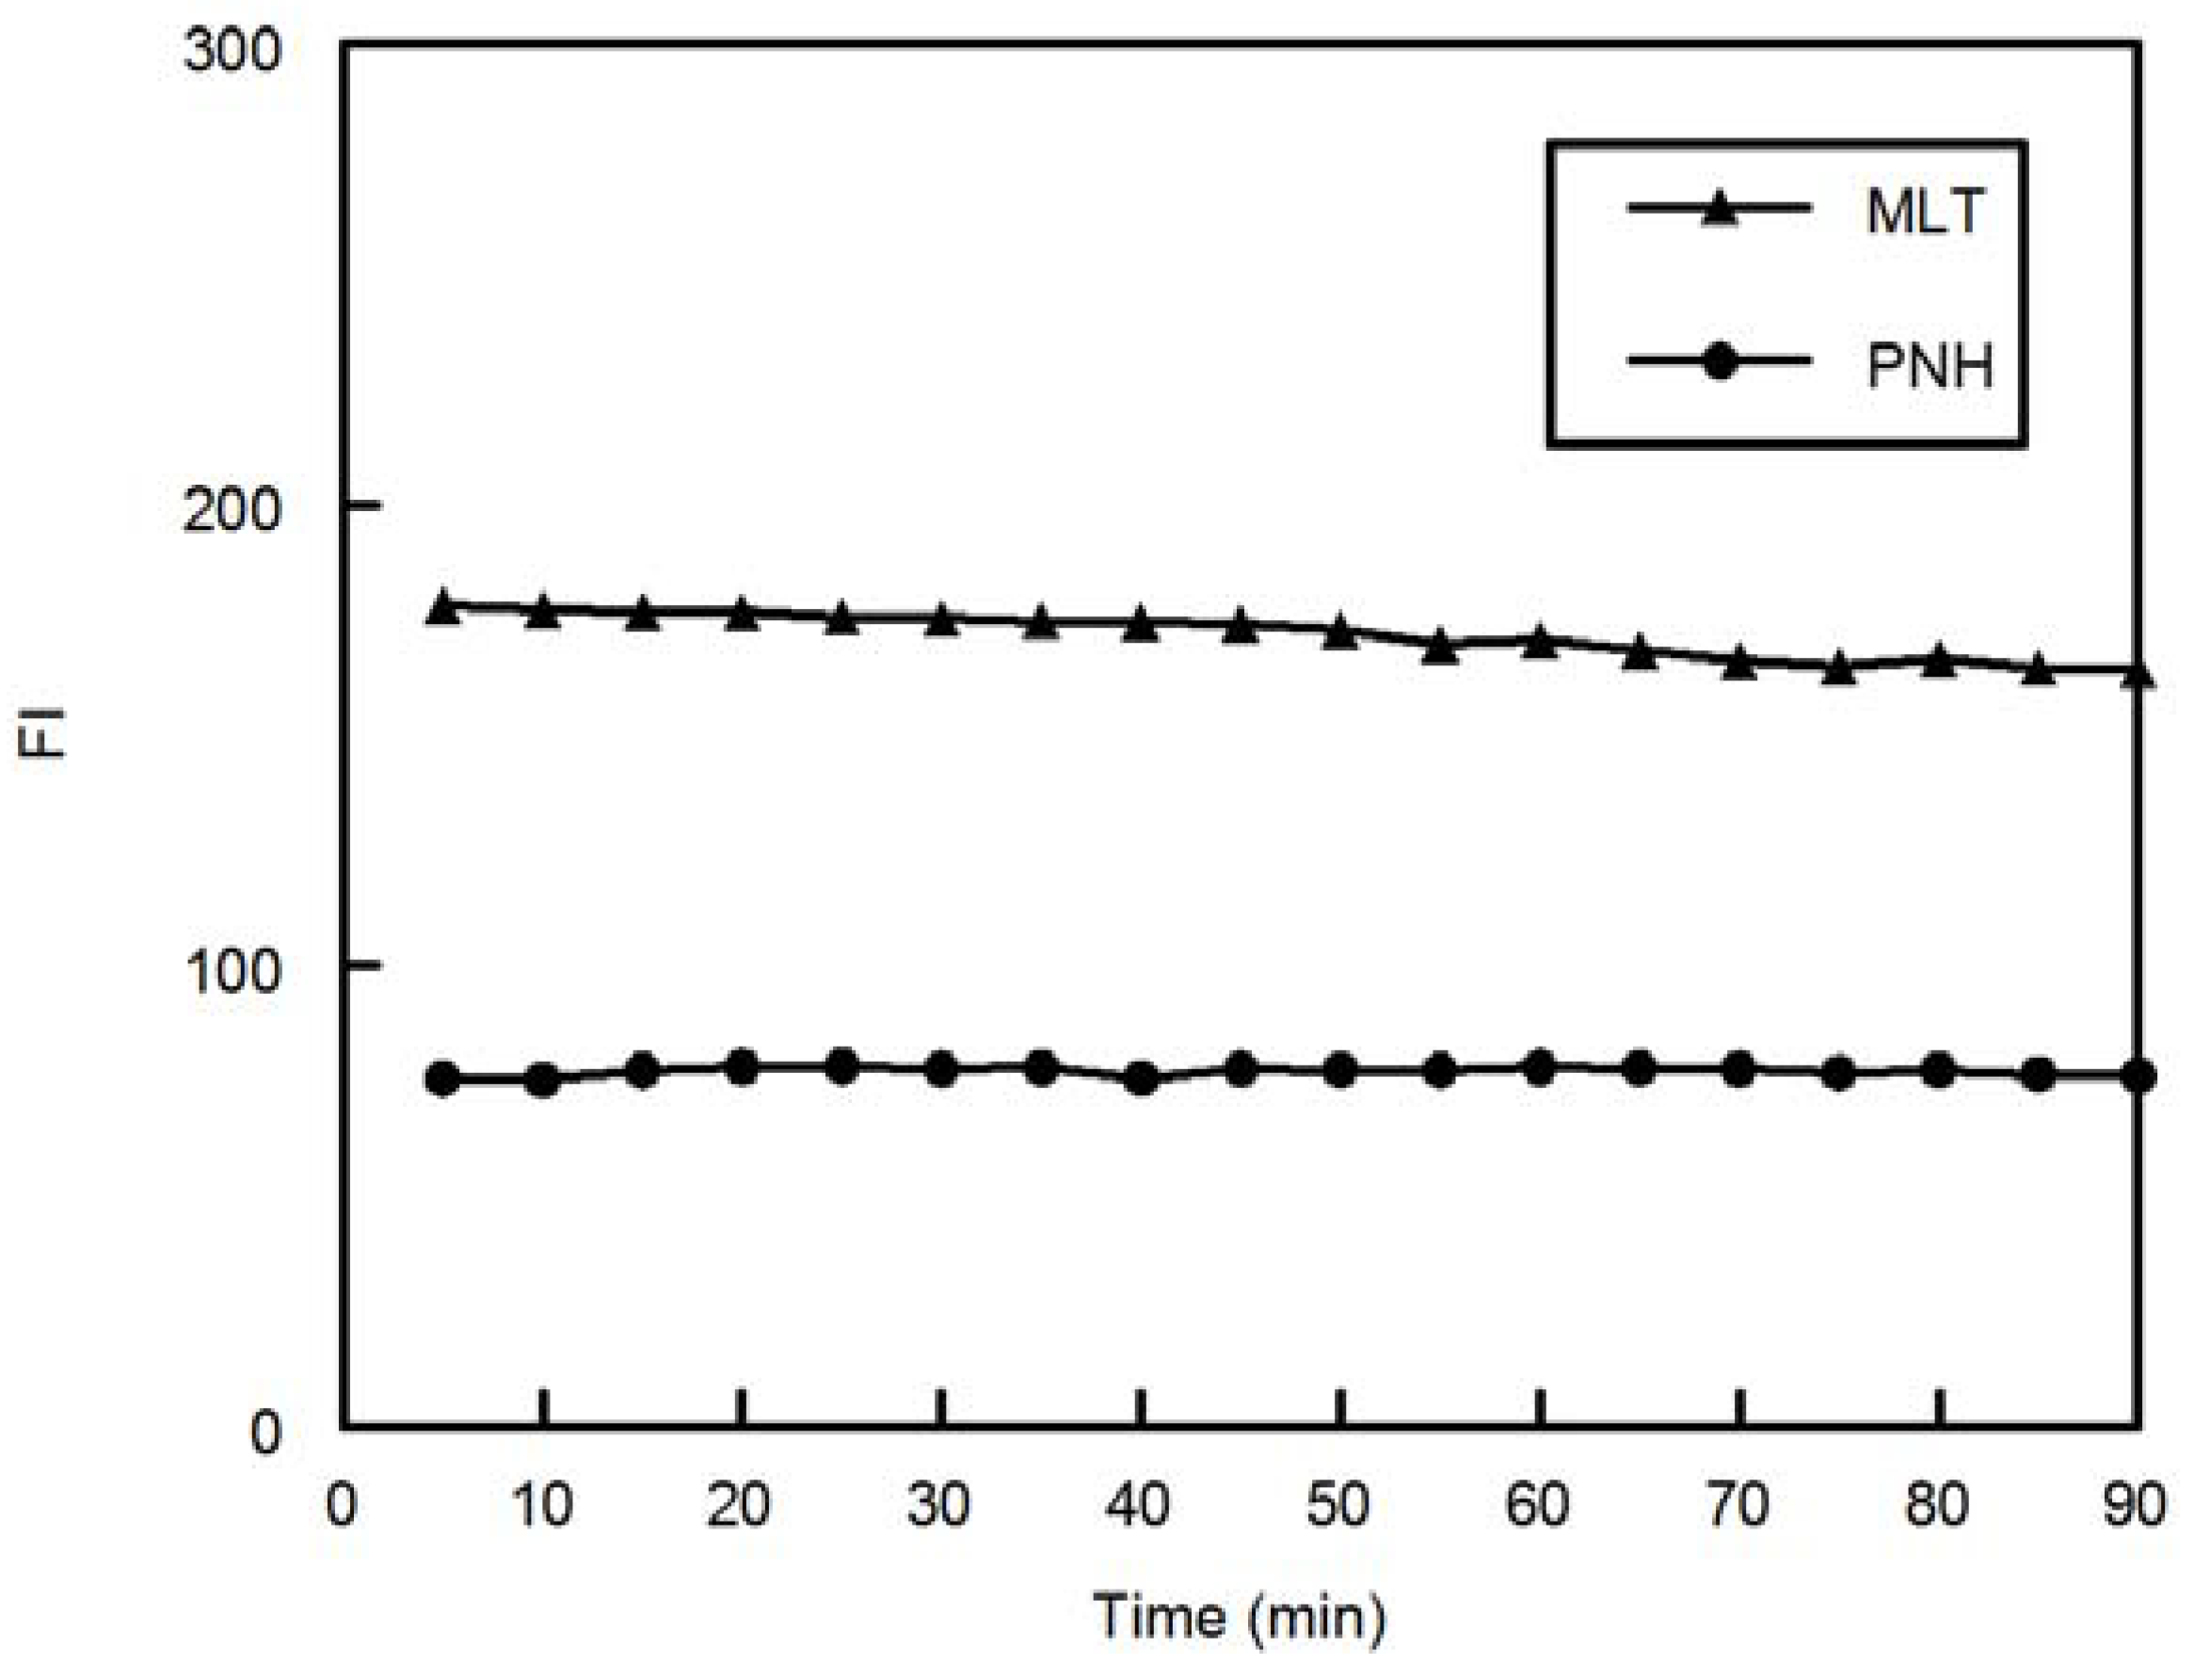
Stock solutions of MLT (200 μg mL−1), PNH (200 μg mL−1) and DMLT (100 μg mL−1) were prepared by dissolving 20 mg of each of MLT and PNH in 100 mL water and 10 mg of DMLT, in 100 mL methanol. Appropriate volumes of these stock solutions were diluted with water to give working solutions of 5 μg mL−1 for each of MLT and PNH as well as 100 ng mL −1 for DMLT. Stock and working solutions were stable for at least two weeks when stored refrigerated at 4 °C.
3.6. Preparation of Pharmaceutical Tablets Sample Solutions
Ten tablets of Melatonin® (MasoN company) were weighed and finely powdered. An accurately weighed portion of the powder equivalent to 3 mg of MLT and 1 mg of PNH was extracted with hot water (250 mL, 80 °C for 1 h) and the extract was filtered. Aliquots of the filtrate were diluted with buffer to obtain final concentrations of 300 and 100 ng mL−1 for MLT and PNH, respectively, and the samples were subjected to the analysis.
3.7. Calibration Procedures
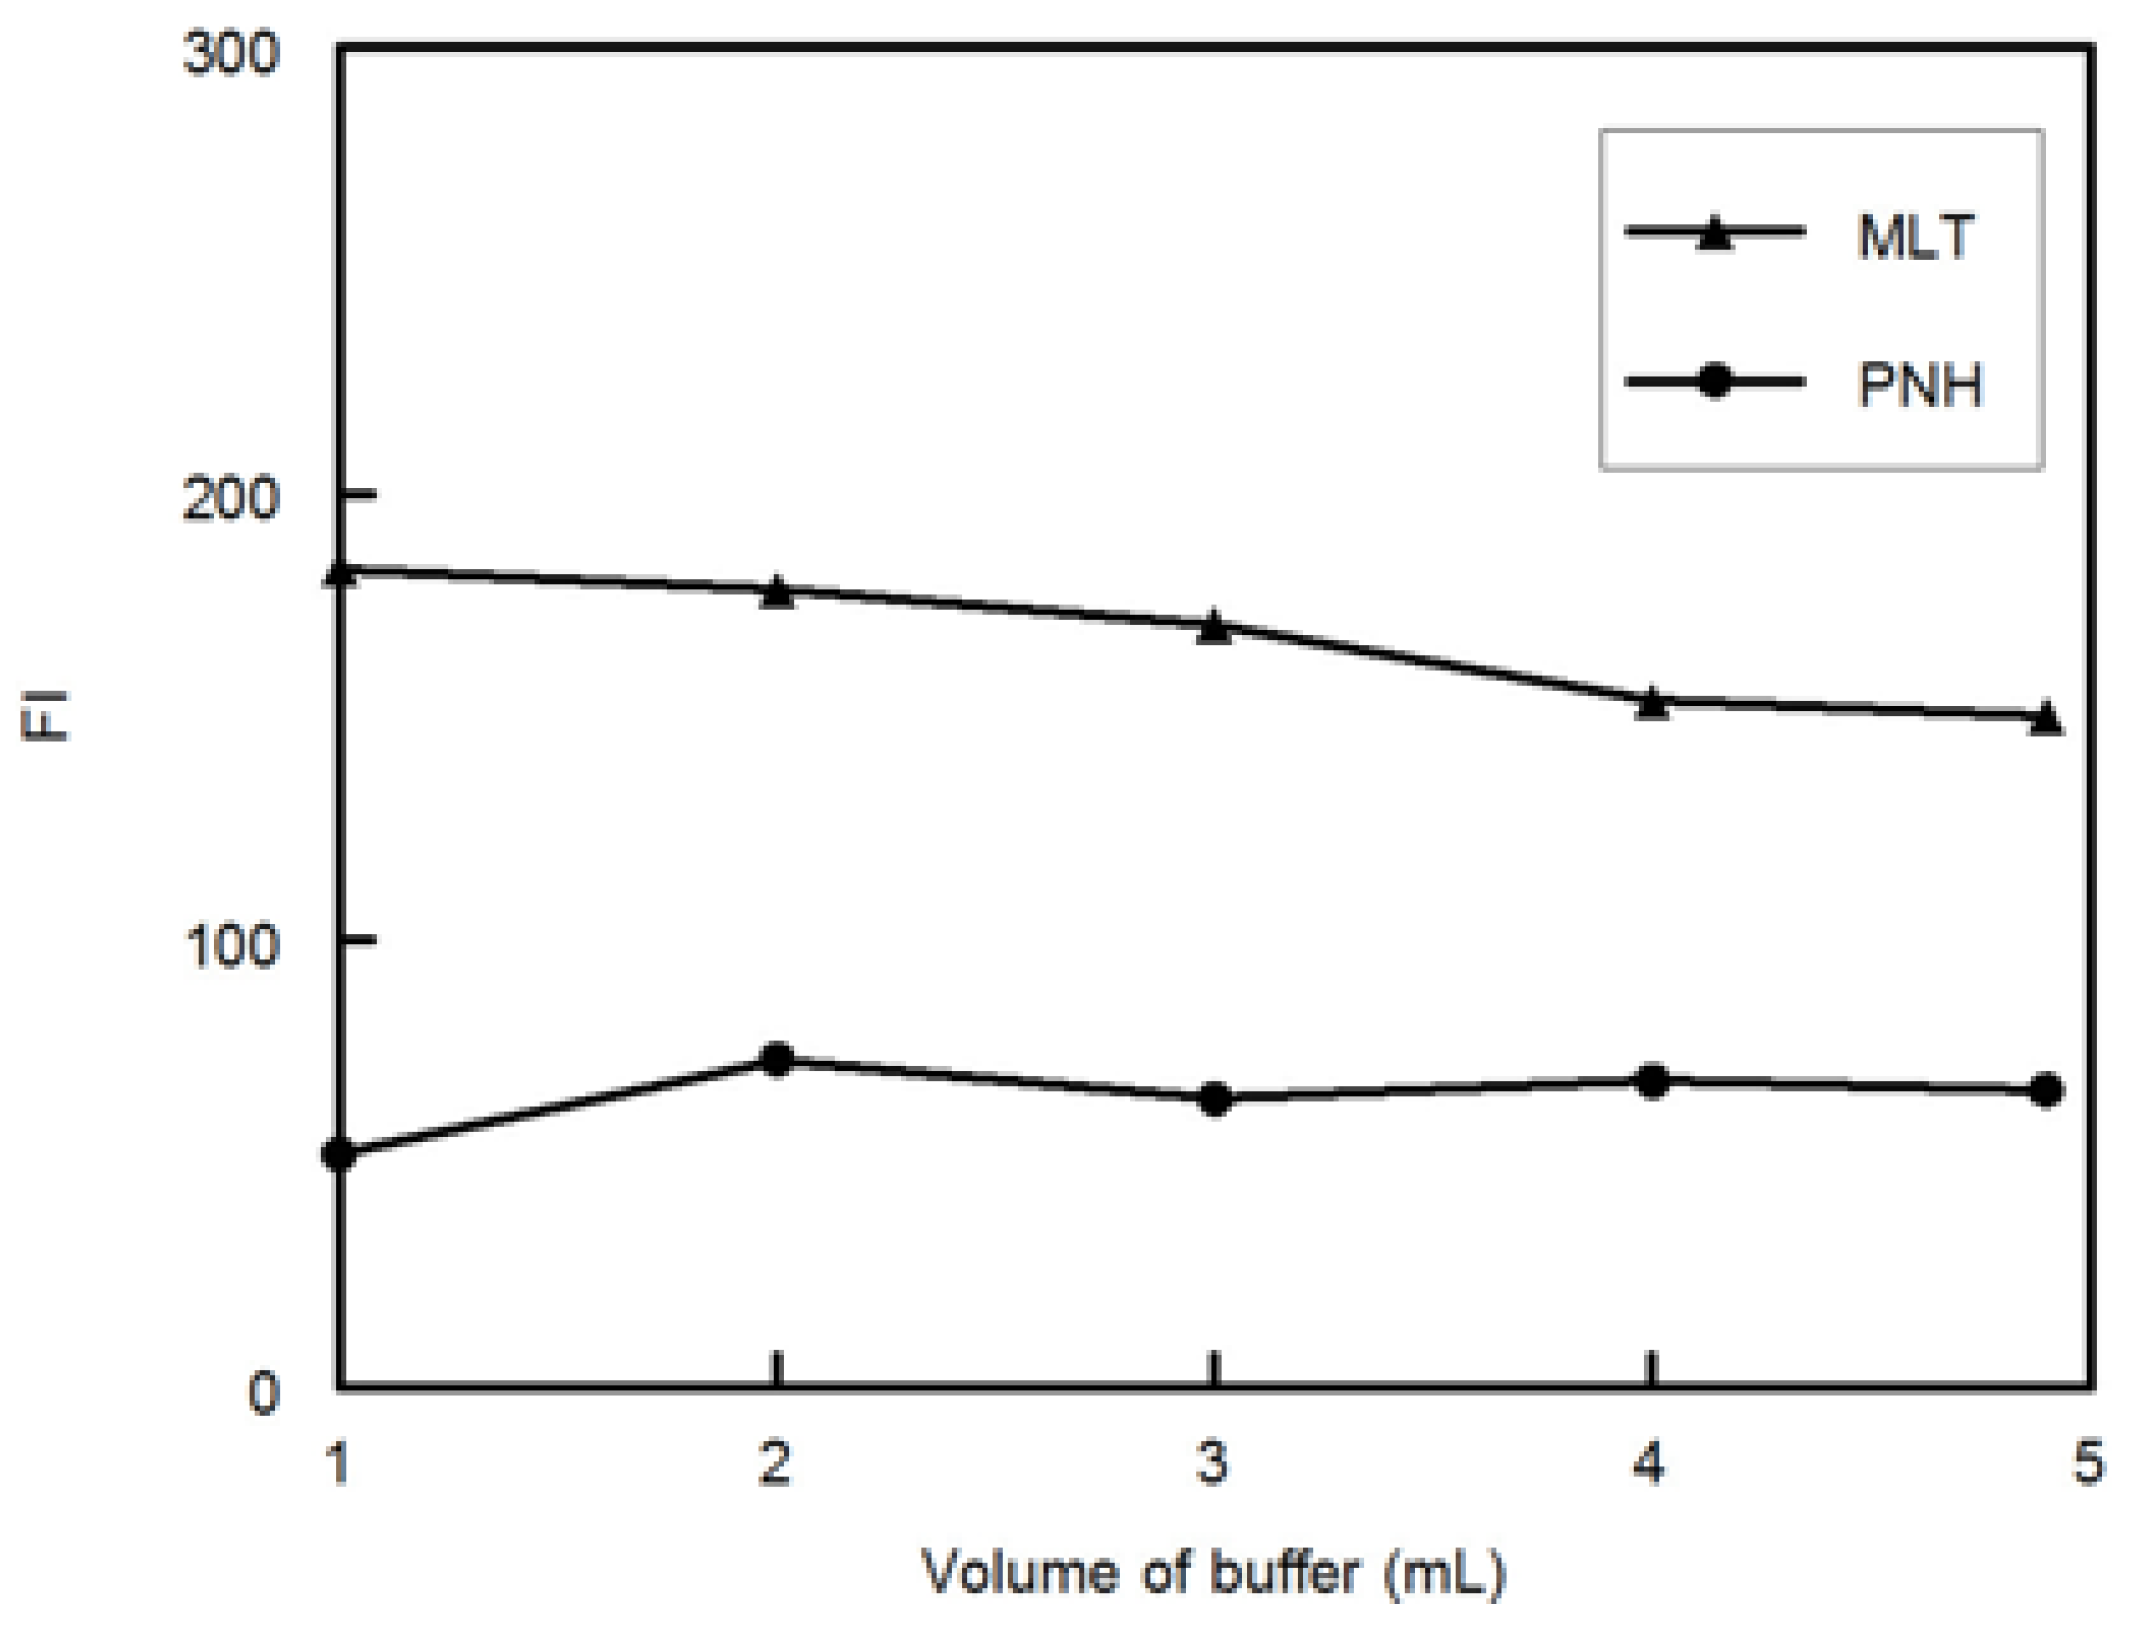
Preparation of the 25 samples was carried out by transferring different volumes of MLT, PNH and DMLT from their standard working solutions into 5-mL volumetric flasks then two mL of phosphate buffer (pH 3.0, 0.1 M) was added and the solutions were diluted to the volume with water and mixed well (
Table 1).
4. Conclusions
Simultaneous determination of MLT and PNH in the presence of melatonin’s main impurity (DMLT) has not been reported yet. This paper shows the successful application of different multivariate calibration models for spectrofluorimetric determination of MLT and PNH in the presence of DMLT in their ternary mixtures. The multivariate methods that have been assayed are the GA-PLS, GA-ANN, PCA-ANN and WT-ANN methods. These methods are considered powerful alternatives to traditional univariate methods, especially in handling spectrofluorimetric data. Variable selection procedures (e.g., GA) as a pre-processing step showed higher efficiency than variable compression procedures (e.g., WT and PC) in increasing the predictive power of ANN. Additionally, ANN preceded by GA achieved more accuracy and precision than GA-PLS.
The proposed methods combine the rapidness and simplicity advantages of traditional spectrometric methods together with other important analytical merits, such as accuracy and specificity. The suggested methods were validated and can be applied for routine quality control analysis of MLT and PNH in their combined dosage form without prior separation and with no interference from DMLT. Additionally, sophistication and/or laborious treatments hinder the application of the other previously reported techniques, such as chromatography and capillary electrophoresis, in the routine quality control analysis for simultaneous determination of MLT and PNH in commercial preparations.

 ,
, 
