Preparation and Preliminary Biological Evaluation of Novel 99mTc-Labelled Thymidine Analogs as Tumor Imaging Agents

Abstract
:1. Introduction
2. Results and Discussion
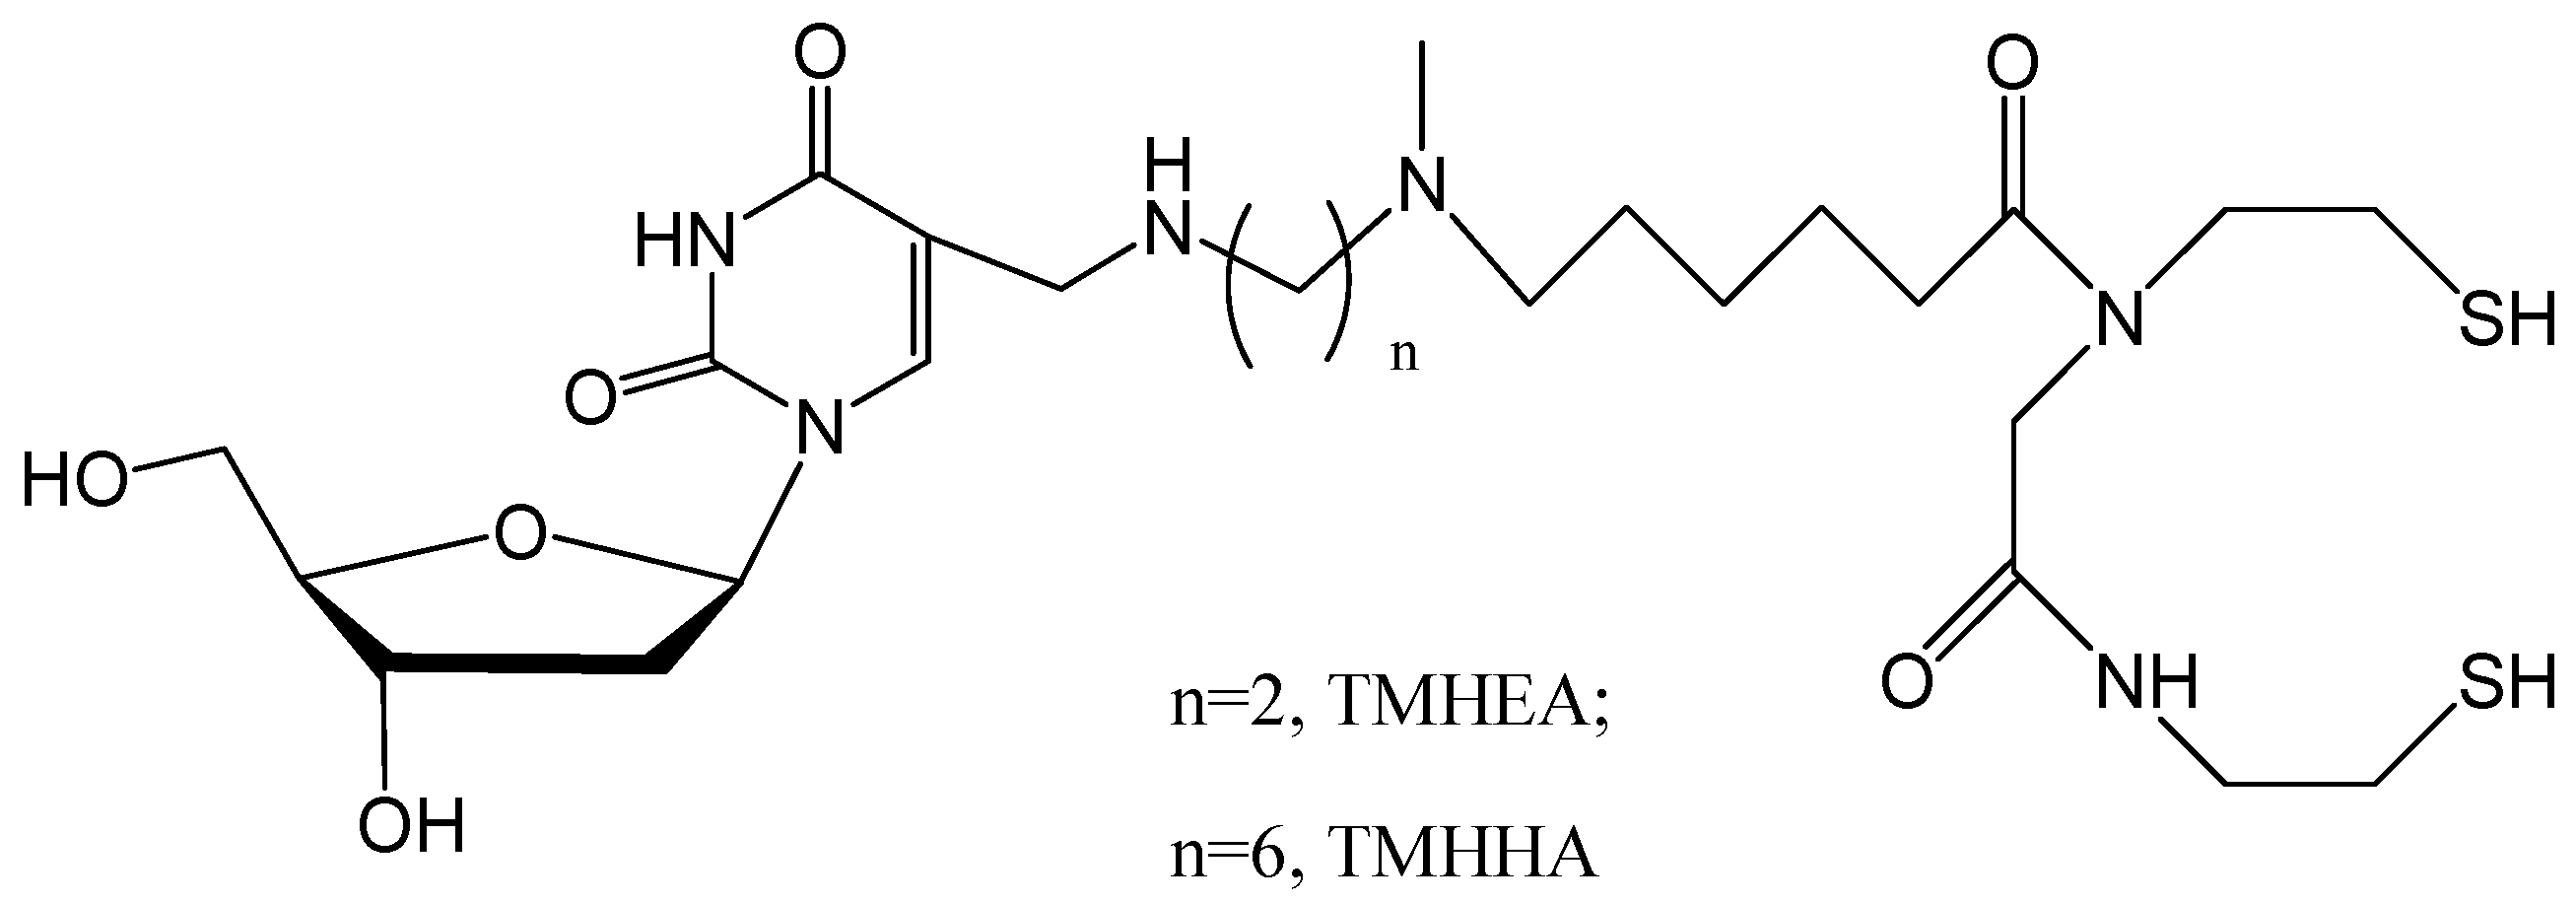
2.1. Chemistry and Radiolabeling
2.2. In vitro Stability and Octanol-Water Partition Coefficient

| Constituent | pH = 7.0 | pH = 7.4 |
|---|---|---|
| 99mTc-TMHEA | 1.01 ± 0.03 | 1.06 ± 0.02 |
| 99mTc-TMHHA | 0.99 ± 0.01 | 1.02 ± 0.03 |
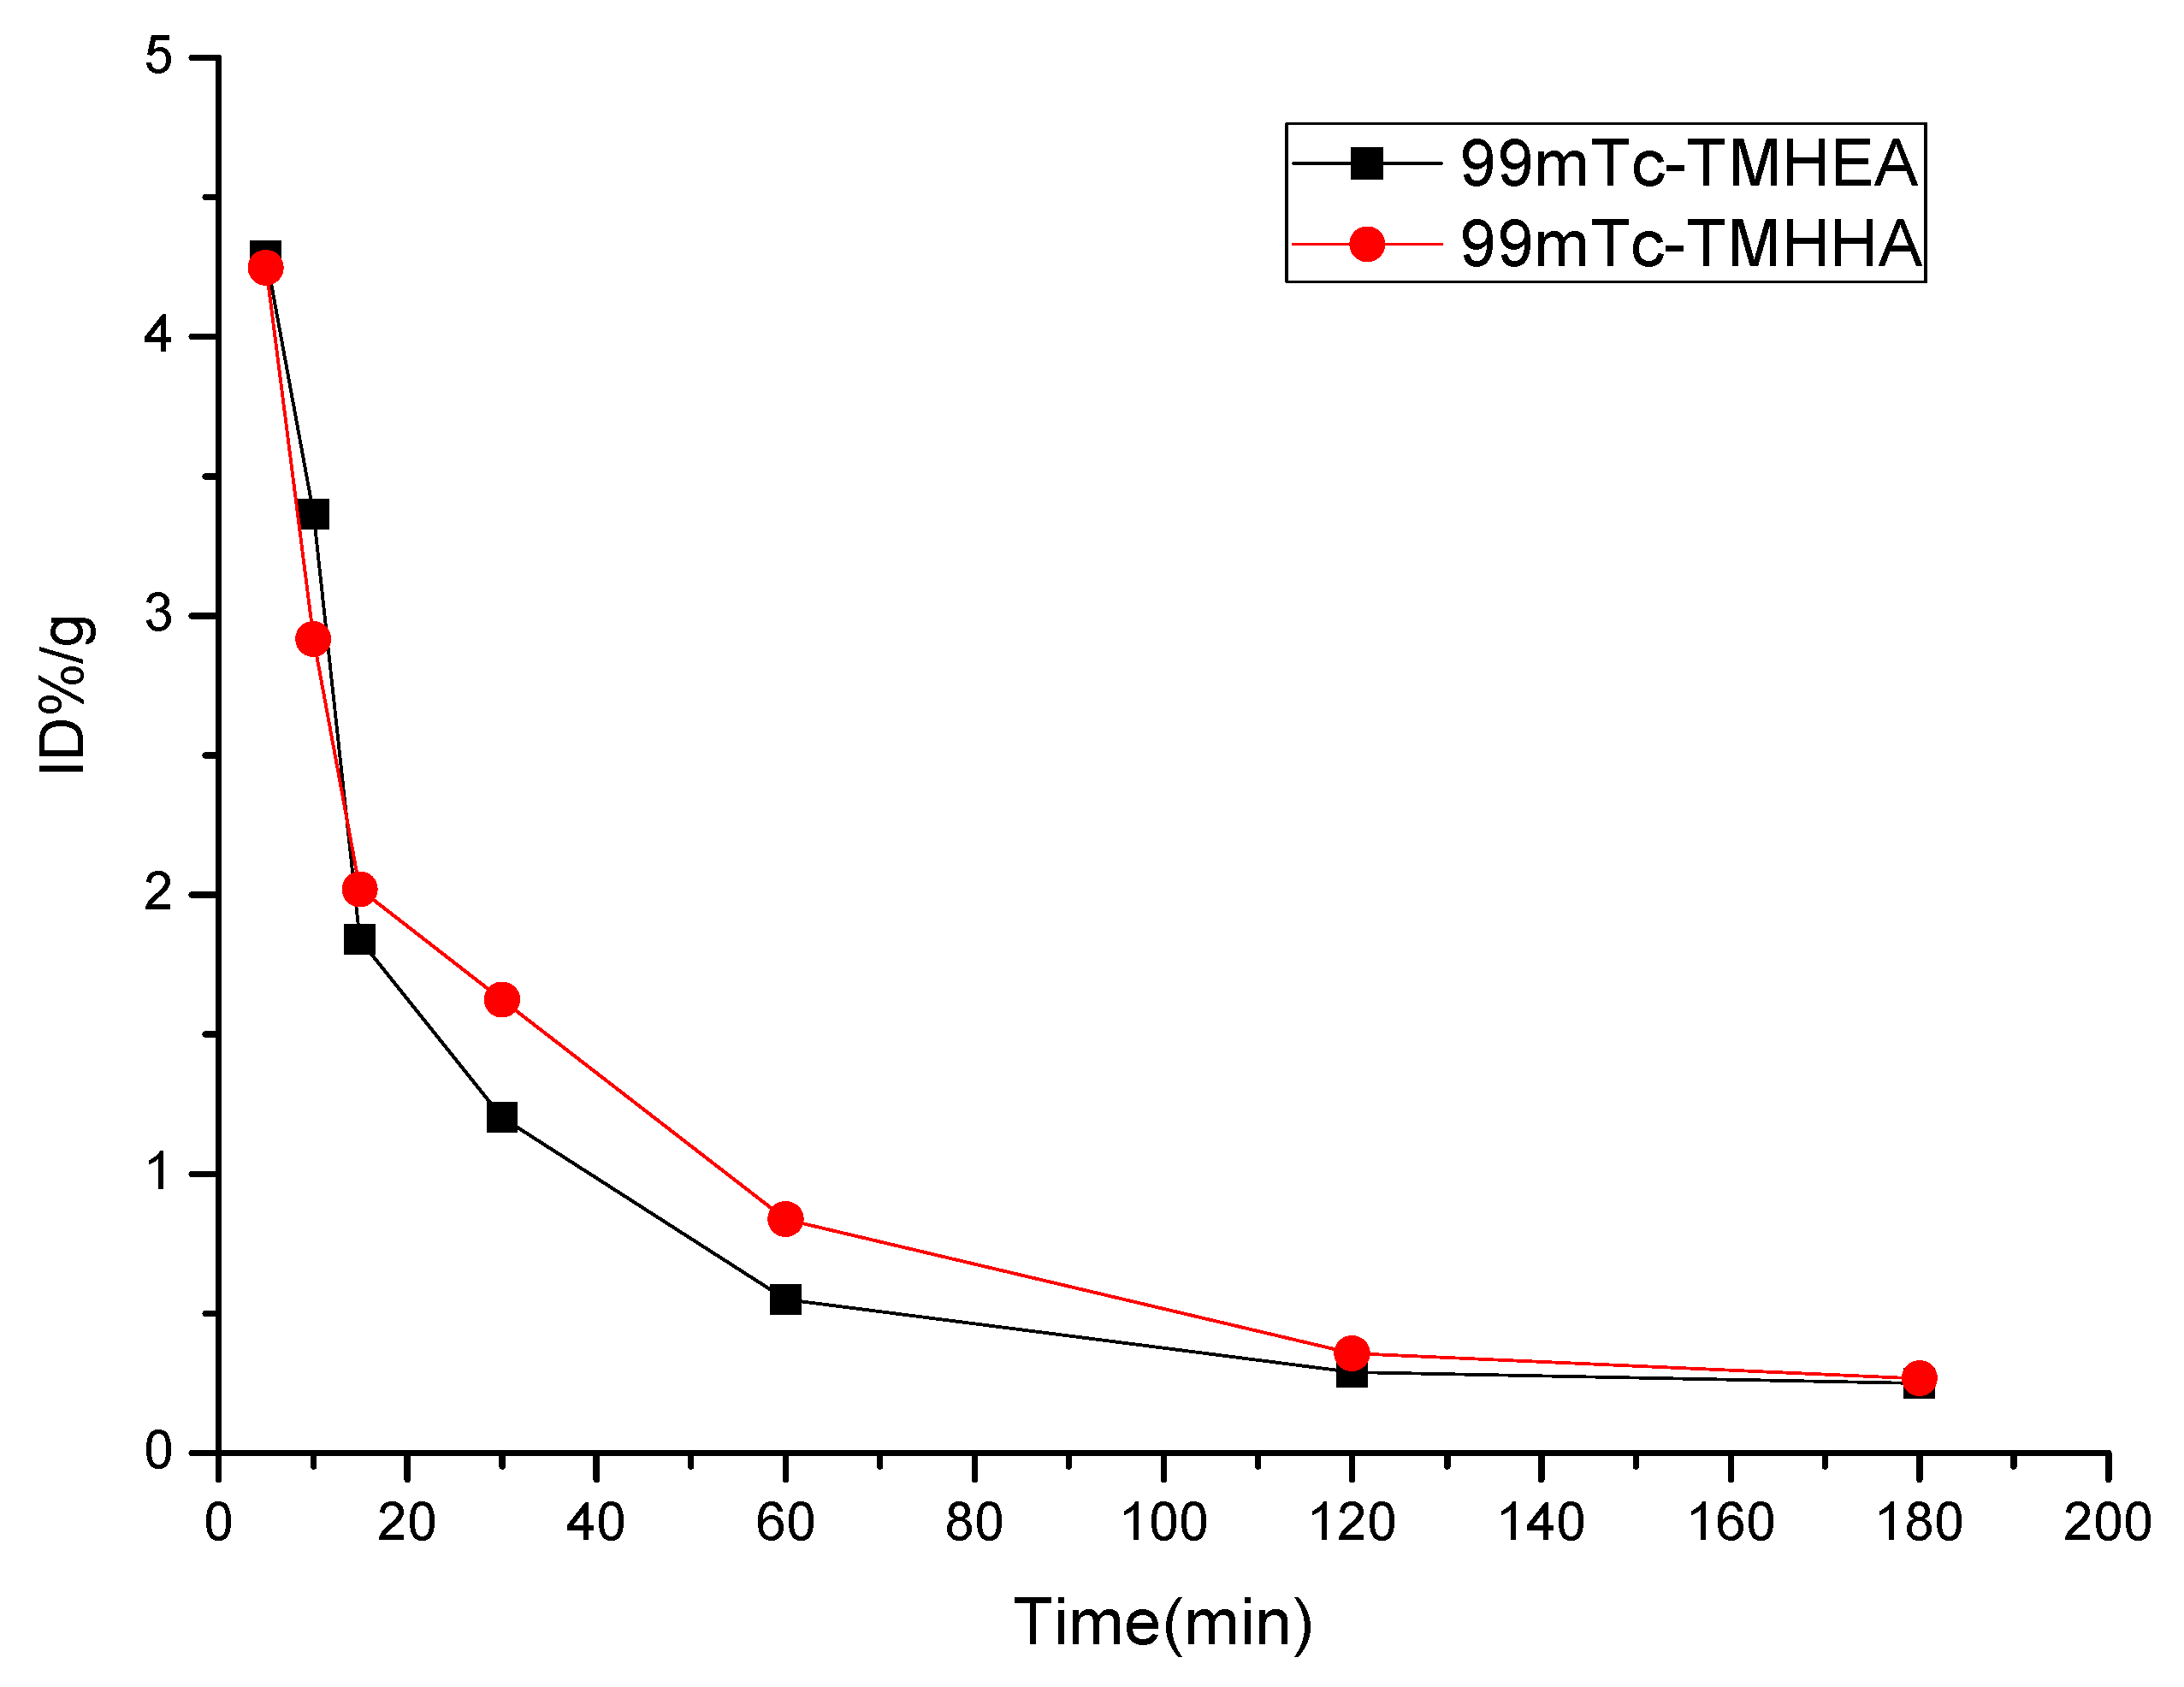
2.3. Blood Kinetics Studies
| Parameters | 99mTc-TMHEA | 99mTc-TMHHA |
|---|---|---|
| K12 (min−1) | 0.033 | 0.101 |
| K21 (min−1) | 0.035 | 0.082 |
| Ke (min−1) | 0.032 | 0.035 |
| CL (%ID/g/min) | 0.098 | 0.086 |
| T1/2α (min) | 6.785 | 3.234 |
| T1/2β (min) | 36.029 | 33.448 |
| AUC (%ID/g/min) | 162.658 | 186.894 |
2.4. Biodistribution Studies
| Tissue | Time (min) | ||||||
|---|---|---|---|---|---|---|---|
| 5 | 10 | 15 | 30 | 60 | 120 | 180 | |
| 99mTc-TMHEA | |||||||
| Brain | 0.27 ± 0.01 | 0.24 ± 0.07 | 0.20 ± 0.04 | 0.13 ± 0.07 | 0.04 ± 0.01 | 0.02 ± 0.01 | 0.02 ± 0.00 |
| Heart | 3.61 ± 0.14 | 2.32 ± 0.63 | 2.04 ± 0.11 | 1.01 ± 0.46 | 0.42±0.07 | 0.23 ± 0.04 | 0.18 ± 0.03 |
| Liver | 5.71 ± 0.81 | 4.83±0.87 | 5.22 ± 0.86 | 4.25 ± 0.36 | 4.17 ± 0.19 | 2.72 ± 0.44 | 3.27 ± 0.18 |
| Spleen | 2.42 ± 0.03 | 1.69 ± 0.59 | 1.62 ± 0.09 | 1.06 ± 0.34 | 0.79 ± 0.15 | 0.81 ± 0.30 | 0.79 ± 0.21 |
| Lung | 5.59 ± 0.73 | 4.15 ± 0.48 | 4.53 ± 0.95 | 2.30 ± 0.66 | 1.45 ± 0.20 | 1.50 ± 0.46 | 0.95 ± 0.22 |
| Kidney | 23.99 ± 0.79 | 15.50 ± 0.42 | 14.20 ± 0.50 | 12.45 ± 0.81 | 10.22 ± 0.74 | 8.87 ± 0.44 | 9.32 ± 0.24 |
| Tumor | 2.51 ± 0.28 | 2.00 ± 0.53 | 1.94 ± 0.31 | 1.34 ± 0.24 | 0.62 ± 0.12 | 0.51 ± 0.05 | 0.48 ± 0.07 |
| Stomach | 1.57 ± 0.58 | 1.17 ± 0.37 | 1.35 ± 0.24 | 0.73 ± 0.12 | 0.47 ± 0.12 | 1.82 ± 0.79 | 1.17 ± 0.29 |
| S. intestines | 3.82 ± 0.99 | 3.16 ± 0.57 | 2.90 ± 0.10 | 2.45 ± 0.36 | 2.36 ± 0.41 | 2.31 ± 0.03 | 1.98 ± 0.28 |
| Bladder | 14.18 ± 0.87 | 12.29 ± 0.52 | 10.51 ± 0.55 | 7.09 ± 0.04 | 4.24 ± 0.38 | 1.56 ± 0.62 | 1.17 ± 0.87 |
| Muscle | 1.93 ± 0.16 | 1.31 ± 0.41 | 1.55 ± 0.56 | 0.66 ± 0.15 | 0.38 ± 0.06 | 0.22 ± 0.08 | 0.14 ± 0.05 |
| Bone | 2.02 ± 0.14 | 1.30 ± 0.48 | 1.57 ± 0.52 | 0.87 ± 0.16 | 0.63 ± 0.23 | 0.51 ± 0.17 | 0.33 ± 0.15 |
| Blood | 3.86 ± 0.60 | 2.77 ± 0.91 | 2.48 ± 0.73 | 1.02 ± 0.25 | 0.48 ± 0.09 | 0.29 ± 0.05 | 0.29 ± 0.06 |
| Tumor/Muscle | 1.30 ± 0.04 | 1.54 ± 0.08 | 1.56 ± 0.02 | 1.98 ± 0.21 | 1.85 ± 0.02 | 2.84 ± 0.76 | 2.98 ± 0.37 |
| Tumor/Bone | 1.24 ± 0.06 | 1.59 ± 0.22 | 1.51 ± 0.03 | 1.46 ± 0.17 | 1.14 ± 0.12 | 1.27 ± 0.20 | 1.62 ± 0.18 |
| Tumor/Blood | 0.65 ± 0.03 | 0.78 ± 0.12 | 0.93 ± 0.01 | 1.21 ± 0.07 | 1.27 ± 0.22 | 1.87 ± 0.02 | 1.80 ± 0.41 |
| 99mTc-TMHHA | |||||||
| Brain | 0.27 ± 0.02 | 0.25 ± 0.03 | 0.20 ± 0.04 | 0.13 ± 0.04 | 0.11 ± 0.04 | 0.03 ± 0.00 | 0.03 ± 0.00 |
| Heart | 3.01 ± 0.29 | 2.44 ± 0.10 | 1.79 ± 0.42 | 1.10 ± 0.30 | 0.96 ± 0.09 | 0.25 ± 0.05 | 0.23 ± 0.03 |
| Liver | 8.79 ± 0.60 | 8.21 ± 0.30 | 8.08 ± 0.66 | 5.43 ± 0.01 | 5.39 ± 0.28 | 4.43 ± 0.83 | 4.13 ± 0.34 |
| Spleen | 2.41 ± 0.30 | 2.13 ± 0.47 | 1.84 ± 0.43 | 1.42 ± 0.17 | 1.19 ± 0.20 | 0.83 ± 0.17 | 0.90 ± 0.13 |
| Lung | 4.55 ± 0.77 | 4.42 ± 0.04 | 2.96 ± 0.43 | 2.04 ± 0.48 | 1.76 ± 0.55 | 0.86 ± 0.15 | 0.75 ± 0.34 |
| Kidney | 15.38 ± 0.52 | 14.14 ± 0.95 | 9.46 ± 0.19 | 7.65 ± 0.39 | 5.83 ± 0.45 | 3.00 ± 0.74 | 3.27 ± 0.36 |
| Tumor | 2.38 ± 0.41 | 2.23 ± 0.60 | 1.43 ± 0.20 | 1.26 ± 0.12 | 0.88 ± 0.22 | 0.42 ± 0.12 | 0.41 ± 0.10 |
| Stomach | 1.55 ± 0.32 | 1.52 ± 0.43 | 0.81 ± 0.20 | 0.80 ± 0.16 | 0.62 ± 0.18 | 0.50 ± 0.20 | 0.46 ± 0.08 |
| S. intestines | 5.97 ± 0.79 | 5.73 ± 0.01 | 4.32 ± 0.42 | 4.00 ± 0.19 | 2.06 ± 0.21 | 0.89 ± 0.35 | 0.85 ± 0.17 |
| Bladder | 16.05 ± 0.95 | 14.47 ± 0.32 | 8.66 ± 0.98 | 4.95 ± 0.27 | 2.82 ± 0.56 | 1.43 ± 0.35 | 1.05 ± 0.06 |
| Muscle | 1.75 ± 0.21 | 1.67 ± 0.43 | 1.00 ± 0.23 | 0.65 ± 0.17 | 0.49 ± 0.20 | 0.17 ± 0.04 | 0.14 ± 0.02 |
| Bone | 2.27 ± 0.67 | 2.20 ± 0.53 | 1.71 ± 0.65 | 0.99 ± 0.21 | 0.79 ± 0.14 | 0.47 ± 0.14 | 0.52 ± 0.05 |
| Blood | 3.81 ± 0.47 | 3.37 ± 0.14 | 2.12 ± 0.52 | 1.14 ± 0.31 | 0.83 ± 0.22 | 0.31 ± 0.06 | 0.27 ± 0.03 |
| Tumor/Muscle | 1.36 ± 0.15 | 1.35 ± 0.18 | 1.34 ± 0.21 | 1.60 ± 0.08 | 1.62 ± 0.12 | 2.42 ± 0.33 | 2.46 ± 0.24 |
| Tumor/Bone | 1.09 ± 0.20 | 1.07 ± 0.12 | 1.06 ± 0.11 | 1.03 ± 0.06 | 0.98 ± 0.05 | 0.90 ± 0.16 | 0.81 ± 0.28 |
| Tumor/Blood | 0.72 ± 0.10 | 0.74 ± 0.09 | 0.67 ± 0.12 | 0.96 ± 0.04 | 1.07 ± 0.05 | 1.28 ± 0.22 | 1.34 ± 0.08 |
2.5. Abnormal Toxicity Test
3. Experimental
3.1. General
3.2. Synthesis of 99mTc-TMHEA and 99mTc-TMHHA
3.2.1. General Procedure for the Preparation of Compounds 1a and 1b

3.2.2. General Procedure for the Preparation of Compounds 2a and 2b
3.2.3. General Procedure for the Preparation of Compounds 3a and 3b
3.2.4. General Procedure for the Preparation of Compounds 4a and 4b
3.2.5. General Procedure for the preparation of compounds 5a and 5b
3.2.6. General Procedure for the Preparation of Compounds 6a and 6b
3.2.7. General Procedure for the Preparation of Compounds 7a and 7b
3.3. Radiochemical Syntheses of 99mTc-TMHEA (8a) and 99mTc-TMHHA (8b)
3.4. Quality Control of 99mTc-TMHEA and 99mTc-TMHHA
3.4.1. TLC
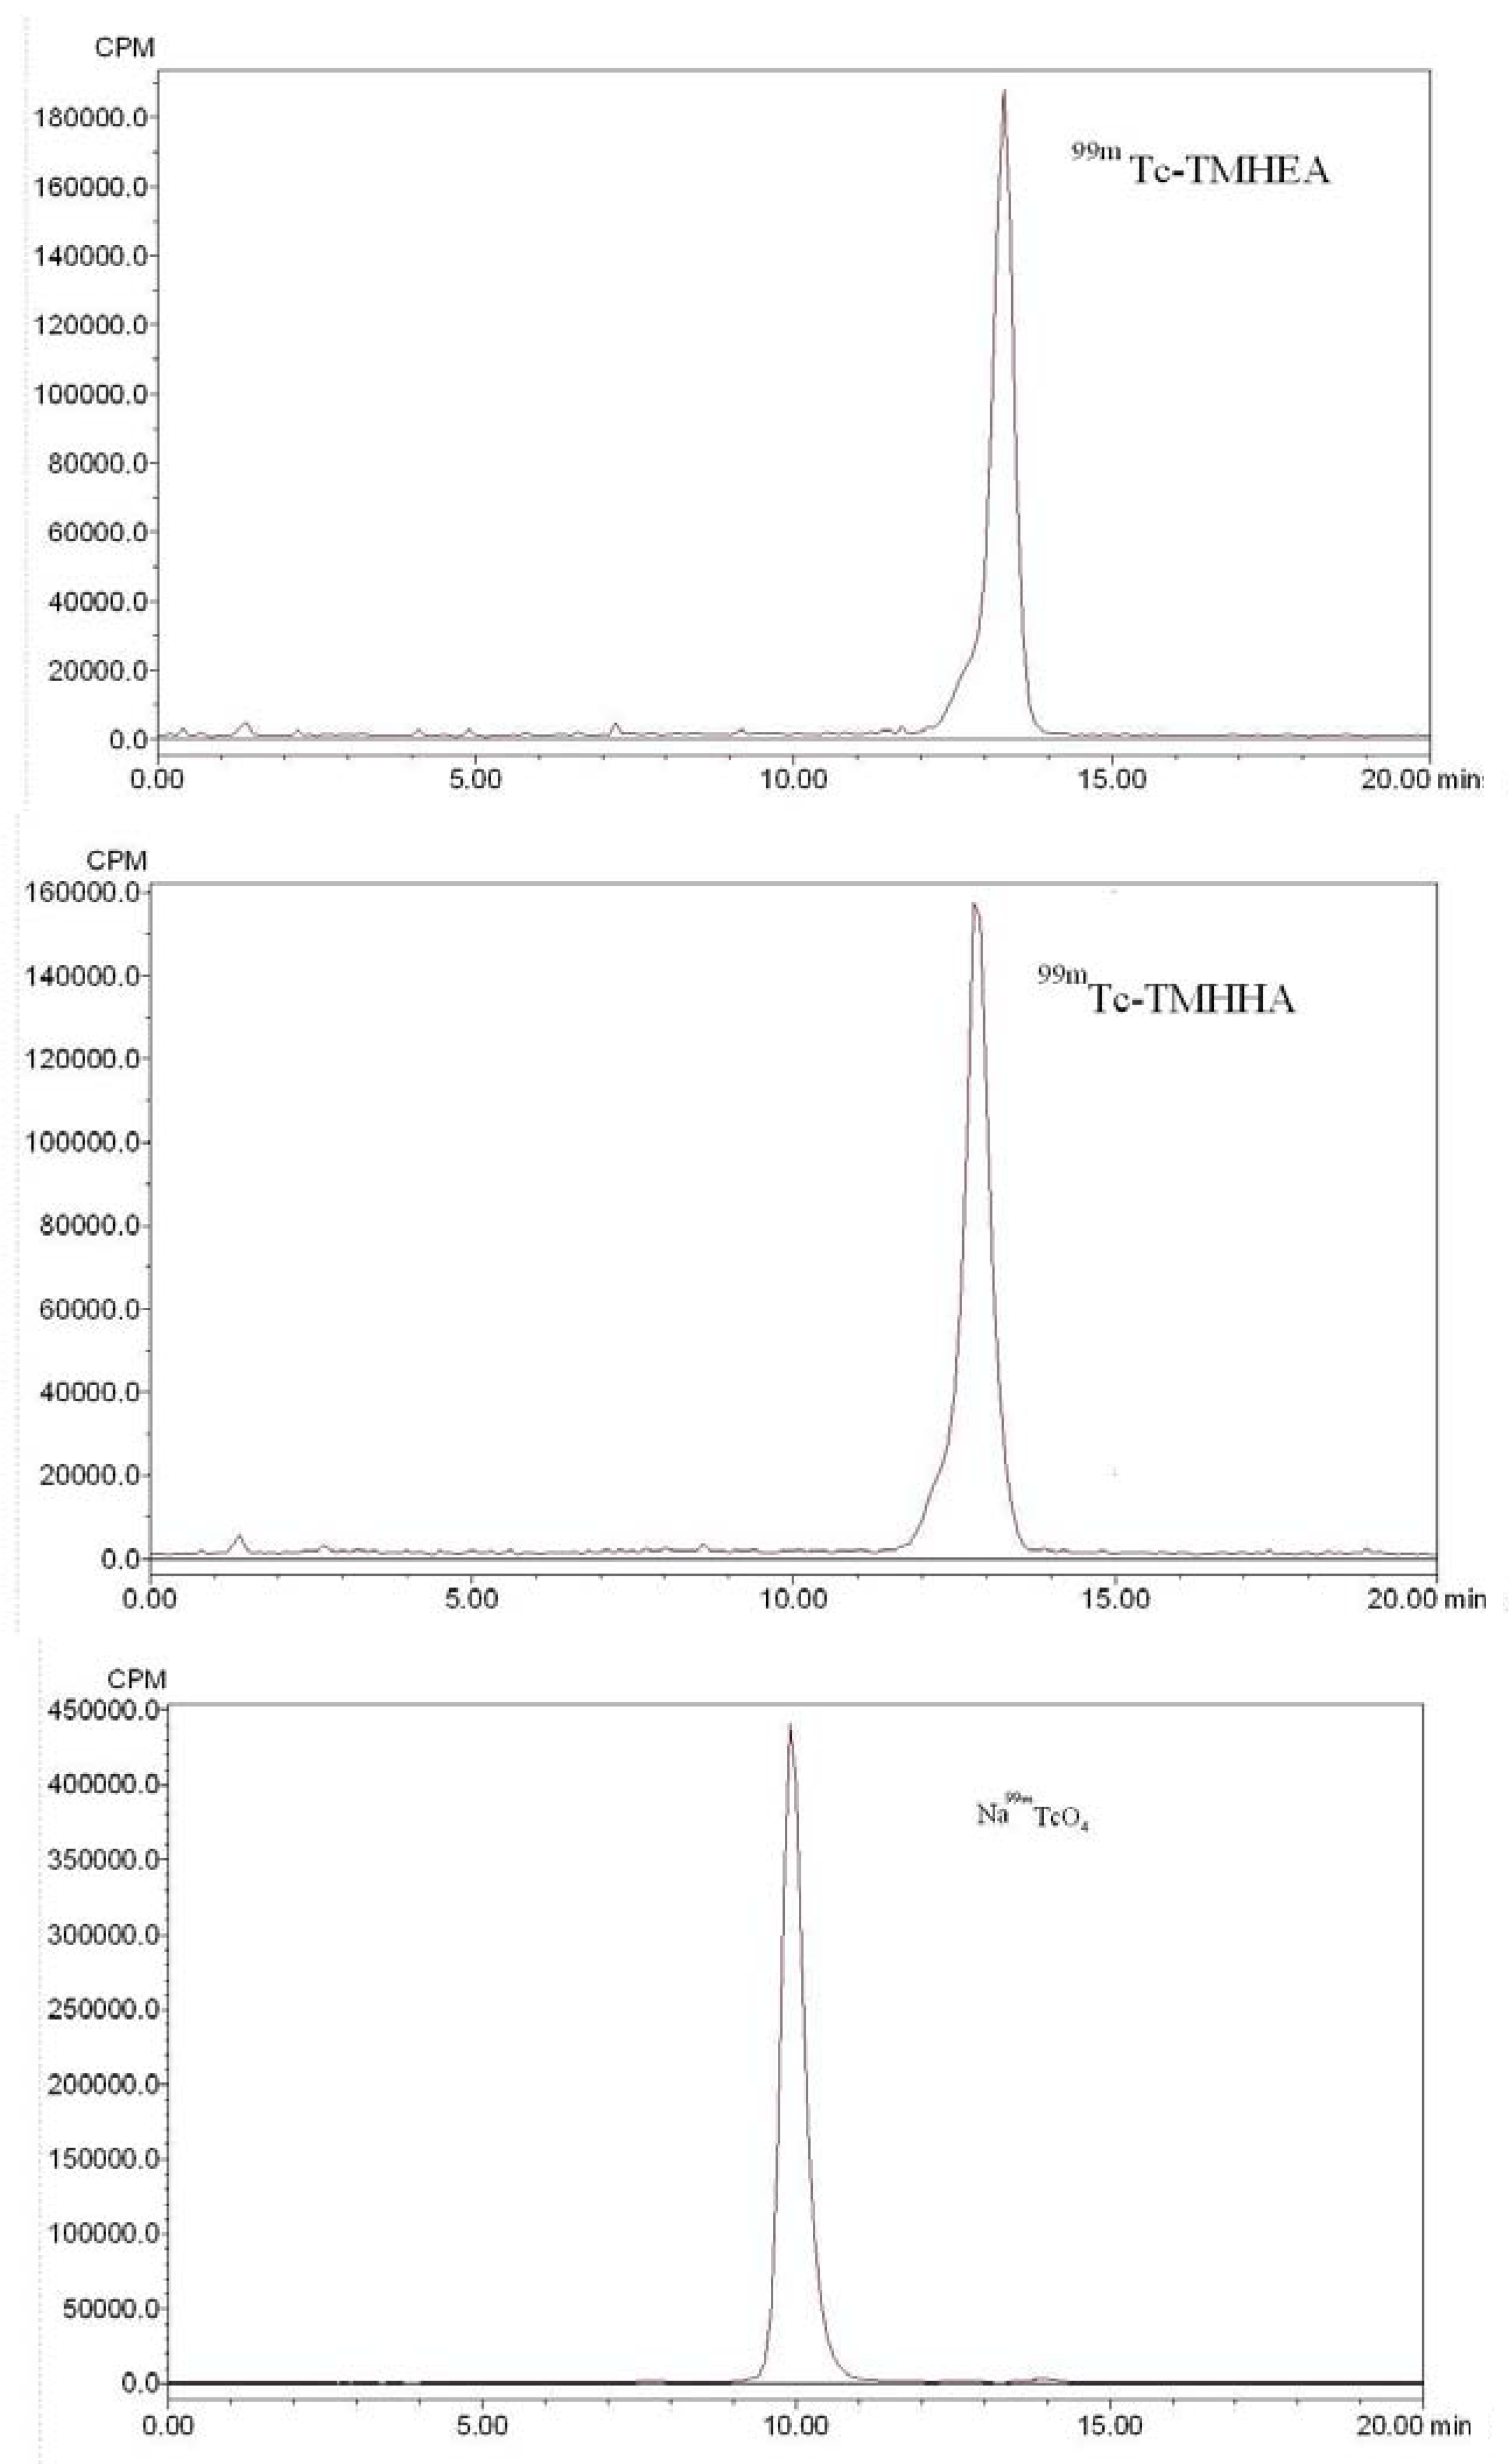
3.4.2. HPLC
3.5. In Vitro Stability of 99mTc-TMHEA and 99mTc-TMHHA
3.6. Octanol-Water Partition Coefficients of 99mTc-TMHEA and 99mTc-TMHHA
3.7. Tumor Models
3.8. Biodistribution in Tumor-Bearing Mice of 99mTc-TMHEA and 99mTc-TMHHA
4. Conclusions
Acknowledgments
References
- Shields, A.F.; Grierson, J.R.; Dohmen, B.M.; Machulla, H.J.; Stayanoff, J.C.; Lawhorn-Crews, J.M.; Obradovich, J.E.; Muzik, O.; Mangner, T.J. Imaging proliferation in vivo with F-18 FLT and positron emission tomography. Nat. Med. 1998, 4, 1334–1336. [Google Scholar]
- Kubota, R.; Yamada, S.; Kubota, K.; Ishiwata, K.; Tamahashi, N.I.T. Intratumoral distribution of fluorine-18-fluorodeoxyglucose in vivo: High accumulation in macrophages and granulation tissues studied by microautoradiography. J. Nucl. Med. 1992, 33, 1972–1980. [Google Scholar]
- Lu, L.; Samuelsson, L.; Bergstrom, M.; Sato, K.; Fasth, K.J.; Langstrom, B. Rat studies comparing11C-FMAU, 18F-FLT, and 76Br-BFU as proliferation markers. J. Nucl. Med. 2002, 43, 1688–1698. [Google Scholar]
- Shields, A.F. PET imaging with 18F-FLT and thymidine analogs: Promise and pitfalls. J. Nucl. Med. 2003, 44, 1432–1434. [Google Scholar]
- Barthel, H.; Perumal, M.; Latigo, J.; He, Q.; Brady, F.; Luthra, S.K.; Price, P.M.; Aboagye, E.O. The uptake of 3'-deoxy-3'-[18F]fluorothymidine into L5178Y tumours in vivo is dependent on thymidine kinase 1 protein levels. Eur. J. Nucl. Med. Mol. Imaging 2005, 32, 257–263. [Google Scholar] [CrossRef]
- Barthel, H.; Cleij, M.C.; Collingridge, D.R.; Hutchinson, O.C.; Osman, S.; He, Q.; Luthra, S.K.; Brady, F.; Price, P.M.; Aboagye, E.O. 3'-Deoxy-3'-[18F]fluorothymidine as a new marker for monitoring tumor response to antiproliferative therapy in vivo with positron emission tomography. Cancer Res. 2003, 63, 3791–3798. [Google Scholar]
- Chen, W.; Cloughesy, T.; Kamdar, N.; Satyamurthy, N.; Bergsneider, M.; Liau, L.; Mischel, P.; Czernin, J.; Phelps, M.E.; Silverman, D.H. Imaging proliferation in brain tumors with 18F-FLT PET: Comparison with 18F-FDG. J. Nucl. Med. 2005, 46, 945–952. [Google Scholar]
- Sun, H.; Sloan, A.; Mangner, T.J.; Vaishampayan, U.; Muzik, O.; Collins, J.M.; Douglas, K.; Shields, A.F. Imaging DNA synthesis with [18F]FMAU and positron emission tomography in patients with cancer. Eur. J. Nucl. Med. Mol. Imaging 2005, 32, 15–22. [Google Scholar]
- Zhang, Y.; Dai, X.; Kallmes, D.F.; Pan, D. Synthesis of a technetium-99m-labeled thymidine analog: A potential HSV1-TK substrate for non-invasive reporter gene expression imaging. Tetrahedron Lett. 2004, 45, 8673–8676. [Google Scholar] [CrossRef]
- Celen, S.; de Groot, T.; Balzarini, J.; Vunckx, K.; Terwinghe, C.; Vermaelen, P.; Van Berckelaer, L.; Vanbilloen, H.; Nuyts, J.; Mortelmans, L.; et al. Synthesis and evaluation of a 99mTc-MAMA-propyl-thymidine complex as a potential probe for in vivo visualization of tumor cell proliferation with SPECT. Nucl. Med. Biol. 2007, 34, 283–291. [Google Scholar]
- Teng, B.; Bai, Y.; Chang, Y.; Chen, S.; Li, Z. Technetium-99m-labeling and synthesis of thymidine analogs: Potential candidates for tumor imaging. Bioorg. Med. Chem. Lett. 2007, 17, 3440–3444. [Google Scholar]
- Lu, C.; Jiang, Q.; Yu, H.; Wang, S.; Li, X.; Wang, Z. Preparation and preliminary biological evaluation of (99m)Tc-ANMdU. Nucl. Sci. Tech. 2010, 21, 106–109. [Google Scholar]
- Lu, C.X.; Wang, Z.W.; Jiang, Q.F.; Tang, J.; Tan, C.; Zhang, J.K. Synthesis and preliminary biological evaluation of a technetium-99m labeled thymidine analog. Chin. Chem. Lett. 2011, 22, 1309–1312. [Google Scholar] [CrossRef]
- Valko, K. Application of high-performance liquid chromatography based measurements of lipophilicity to model biological distribution. J. Chromatogr. A 2004, 1037, 299–310. [Google Scholar]
- Sample Availability: Samples of the TMHEA and TMHHA are available from the authors.
© 2012 by the authors; licensee MDPI, Basel, Switzerland. This article is an open-access article distributed under the terms and conditions of the Creative Commons Attribution license (http://creativecommons.org/licenses/by/3.0/).
Share and Cite
Lu, C.; Jiang, Q.; Tan, C.; Tang, J.; Zhang, J. Preparation and Preliminary Biological Evaluation of Novel 99mTc-Labelled Thymidine Analogs as Tumor Imaging Agents. Molecules 2012, 17, 8518-8532. https://doi.org/10.3390/molecules17078518
Lu C, Jiang Q, Tan C, Tang J, Zhang J. Preparation and Preliminary Biological Evaluation of Novel 99mTc-Labelled Thymidine Analogs as Tumor Imaging Agents. Molecules. 2012; 17(7):8518-8532. https://doi.org/10.3390/molecules17078518
Chicago/Turabian StyleLu, Chunxiong, Quanfu Jiang, Cheng Tan, Jie Tang, and Jiankang Zhang. 2012. "Preparation and Preliminary Biological Evaluation of Novel 99mTc-Labelled Thymidine Analogs as Tumor Imaging Agents" Molecules 17, no. 7: 8518-8532. https://doi.org/10.3390/molecules17078518