1. Introduction
In the past twenty years, ®-® semiconductor nanoparticles (so called “quantum dots” or “QDs”) have attracted considerable attention because of their unique optical properties [
1,
2,
3,
4]. Among these, colloidal CdSe nanoparticles are among the most widely investigated semiconductor nanoparticles mainly due to their well-tuned emission process and relatively mature synthetic approach [
5,
6]. Up to now, numerous methods have been reported for the preparation of CdSe nanoparticles, including molecular beam epitaxy [
7], metal organic vapor chemical deposition [
8], solvothermal [
9] and hydro- thermal methods [
10]. However, there are only a few methods that can be utilized to synthesize CdSe nanocrystals with satisfactory size and size distributions. For example, an organometallic approach has been widely adopted to prepare CdSe colloid nanocrystals with high quality morphology, high quantum yields as well as good optical quality. However, to inhibit the growth of the particles, a high temperature (200–350 °C) is usually employed in the annealing process, which makes the synthetic procedure for the preparation of CdSe nanocrystals uncontrollable [
11,
12].
Recently, water-based synthesis of semiconductor nanoparticles with thiols as capping ligands has provided an interesting and alternative method to prepare semiconductor nanoparticles [
13]. Compared with the organic system, the aqueous approach is environmentally benign and very economic. Along this line, Pan
et al. developed an excellent method for the synthesis of high quality CdSe quantum dots under mild reaction conditions, by the use of a two phase water-toluene system [
14]. Despite this success, this method suffers from the narrow range of controllable fluorescence owing to the limited Cd precursors [
11]. Therefore, it is highly desirable to develop efficient as well as operationally simple methods allowing access to CdSe quantum dots with high quality and controllable fluorescence under mild conditions.
Herein we report an effective synthesis of CdSe quantum dots based on a freezing temperature method. For this synthesis process, CdCl
2 and Se power are chosen as precursors, and thioglycolic acid (TGA) is used as the capping ligand. Compared to the hot injection and room-temperature injection process, the freezing temperature injection method offers a longer time for the nuclei reactions, and more importantly, the growth of the CdSe crystals could be easily controlled [
15].
2. Results and Discussion
Initially, we investigated the influence of reaction temperature on CdSe quantum dot fluorescence intensity. As illustrated in
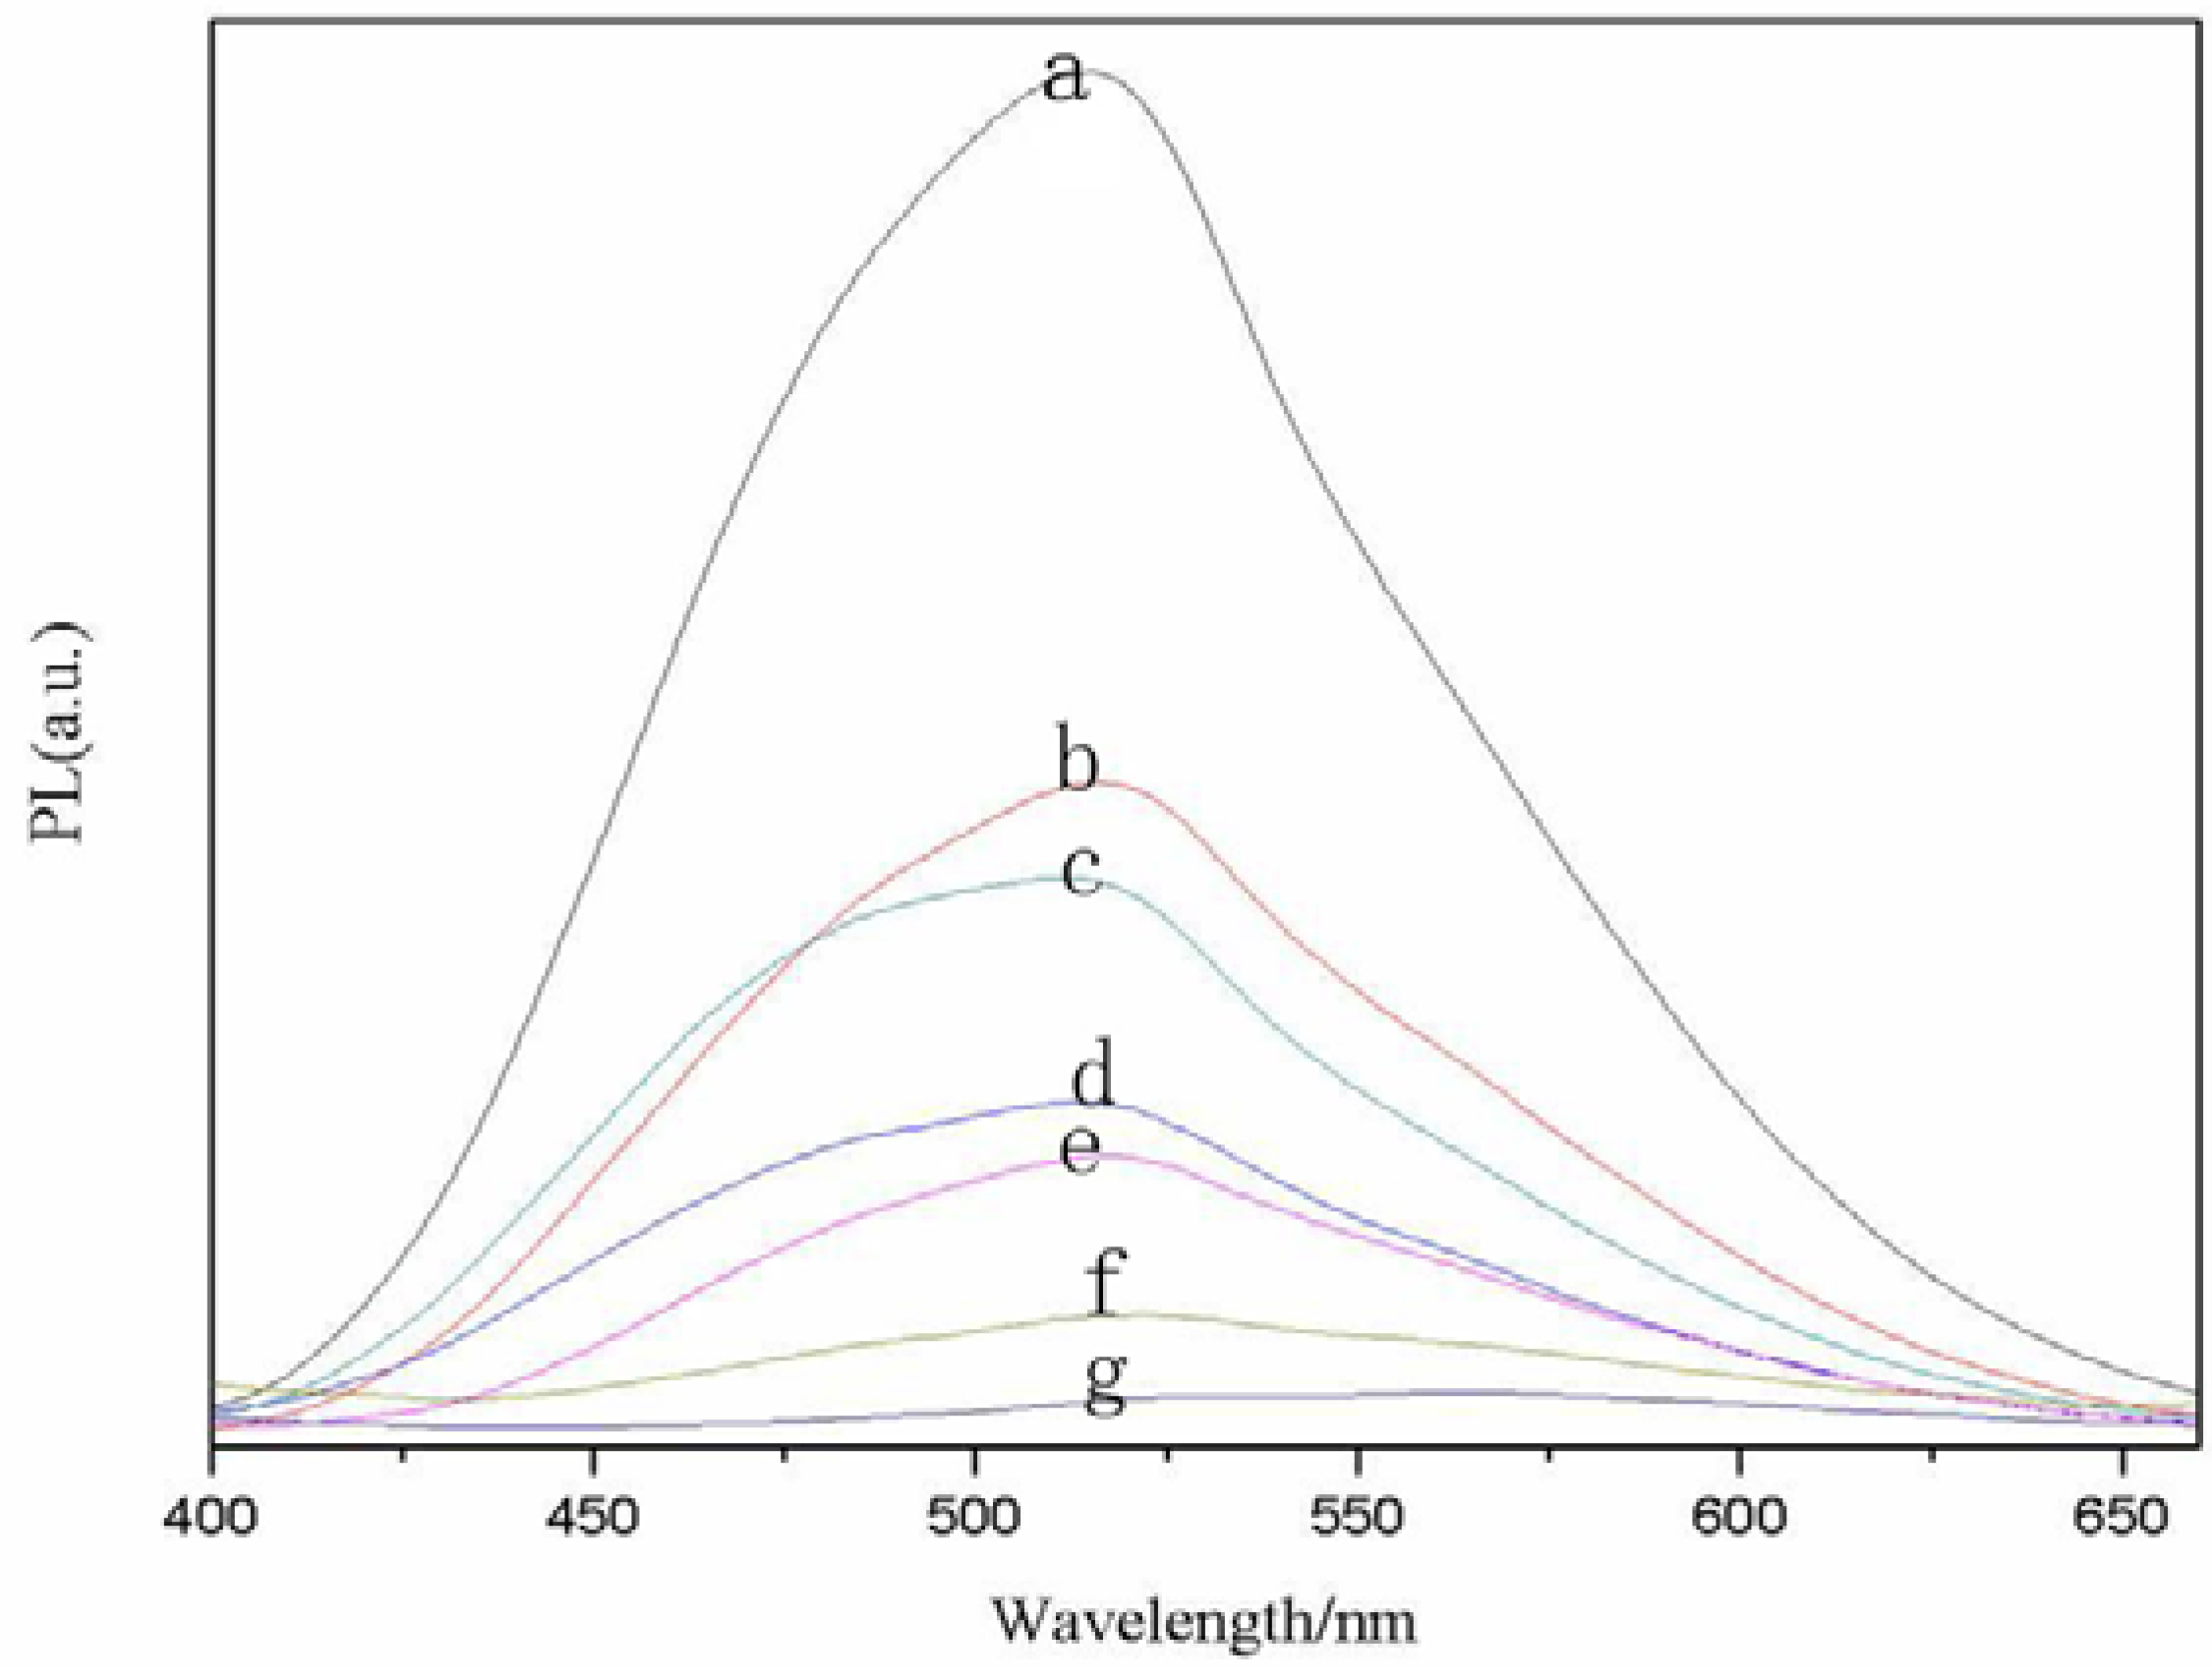
Figure 1, the highest fluorescence intensity of the CdSe QDs is obtained at the freezing temperature, while that of CdSe QDs synthesized at room temperature clearly decreases.
Figure 1.
PL spectra of the CdSe quantum dots at different temperatures (a, 0 °C; b, 10 °C; c, 20 °C; d, 40 °C; e, 60 °C; f, 80 °C; g, 100 °C).
Figure 1.
PL spectra of the CdSe quantum dots at different temperatures (a, 0 °C; b, 10 °C; c, 20 °C; d, 40 °C; e, 60 °C; f, 80 °C; g, 100 °C).
The increase of molecular kinetic energy at higher temperature will boost the collisions between molecules, thus resulting in more excited state fluorescent molecules through the collision between the molecules or energy transfer between molecules. Non-fluorescence emission forms and leads to quenched fluorescence and lower quantum yield as well as weaker fluorescence intensity.
Figure 1 also illustrates that the half peak width of emission spectrum becomes broader with increasing reaction temperature, indicating that the QD size distribution gradually become wider, which can be explained by the Ostwald maturation mechanism. The higher reaction temperature results in a faster monomer deposition. Furthermore, owing to the lower reaction temperature, the lower reaction speed and the higher free monomer concentration of mixtures, the monomer sedimentation processes need more time, and form nanoclusters in the earlier reaction, so the wide emission related to defects will prolong the duration, which results in size distribution attains minimum value.
Capping ligands attached to the surface of nanocrystals are found to be important to the formation of the nanocrystals. They can not only prevent the aggregation of small crystals, but also influence the morphology of the nanocrystals because of their different complexation to the crystal. As such, to study the effect of molar ratio on fluorescence intensity, the molar ratio of TGA/Se was varied from 2.0 to 2.6 while keeping the reaction time at 30 min. The FL spectra of a series of CdSe QDs at different molar ratio of TGA/Se are presented in
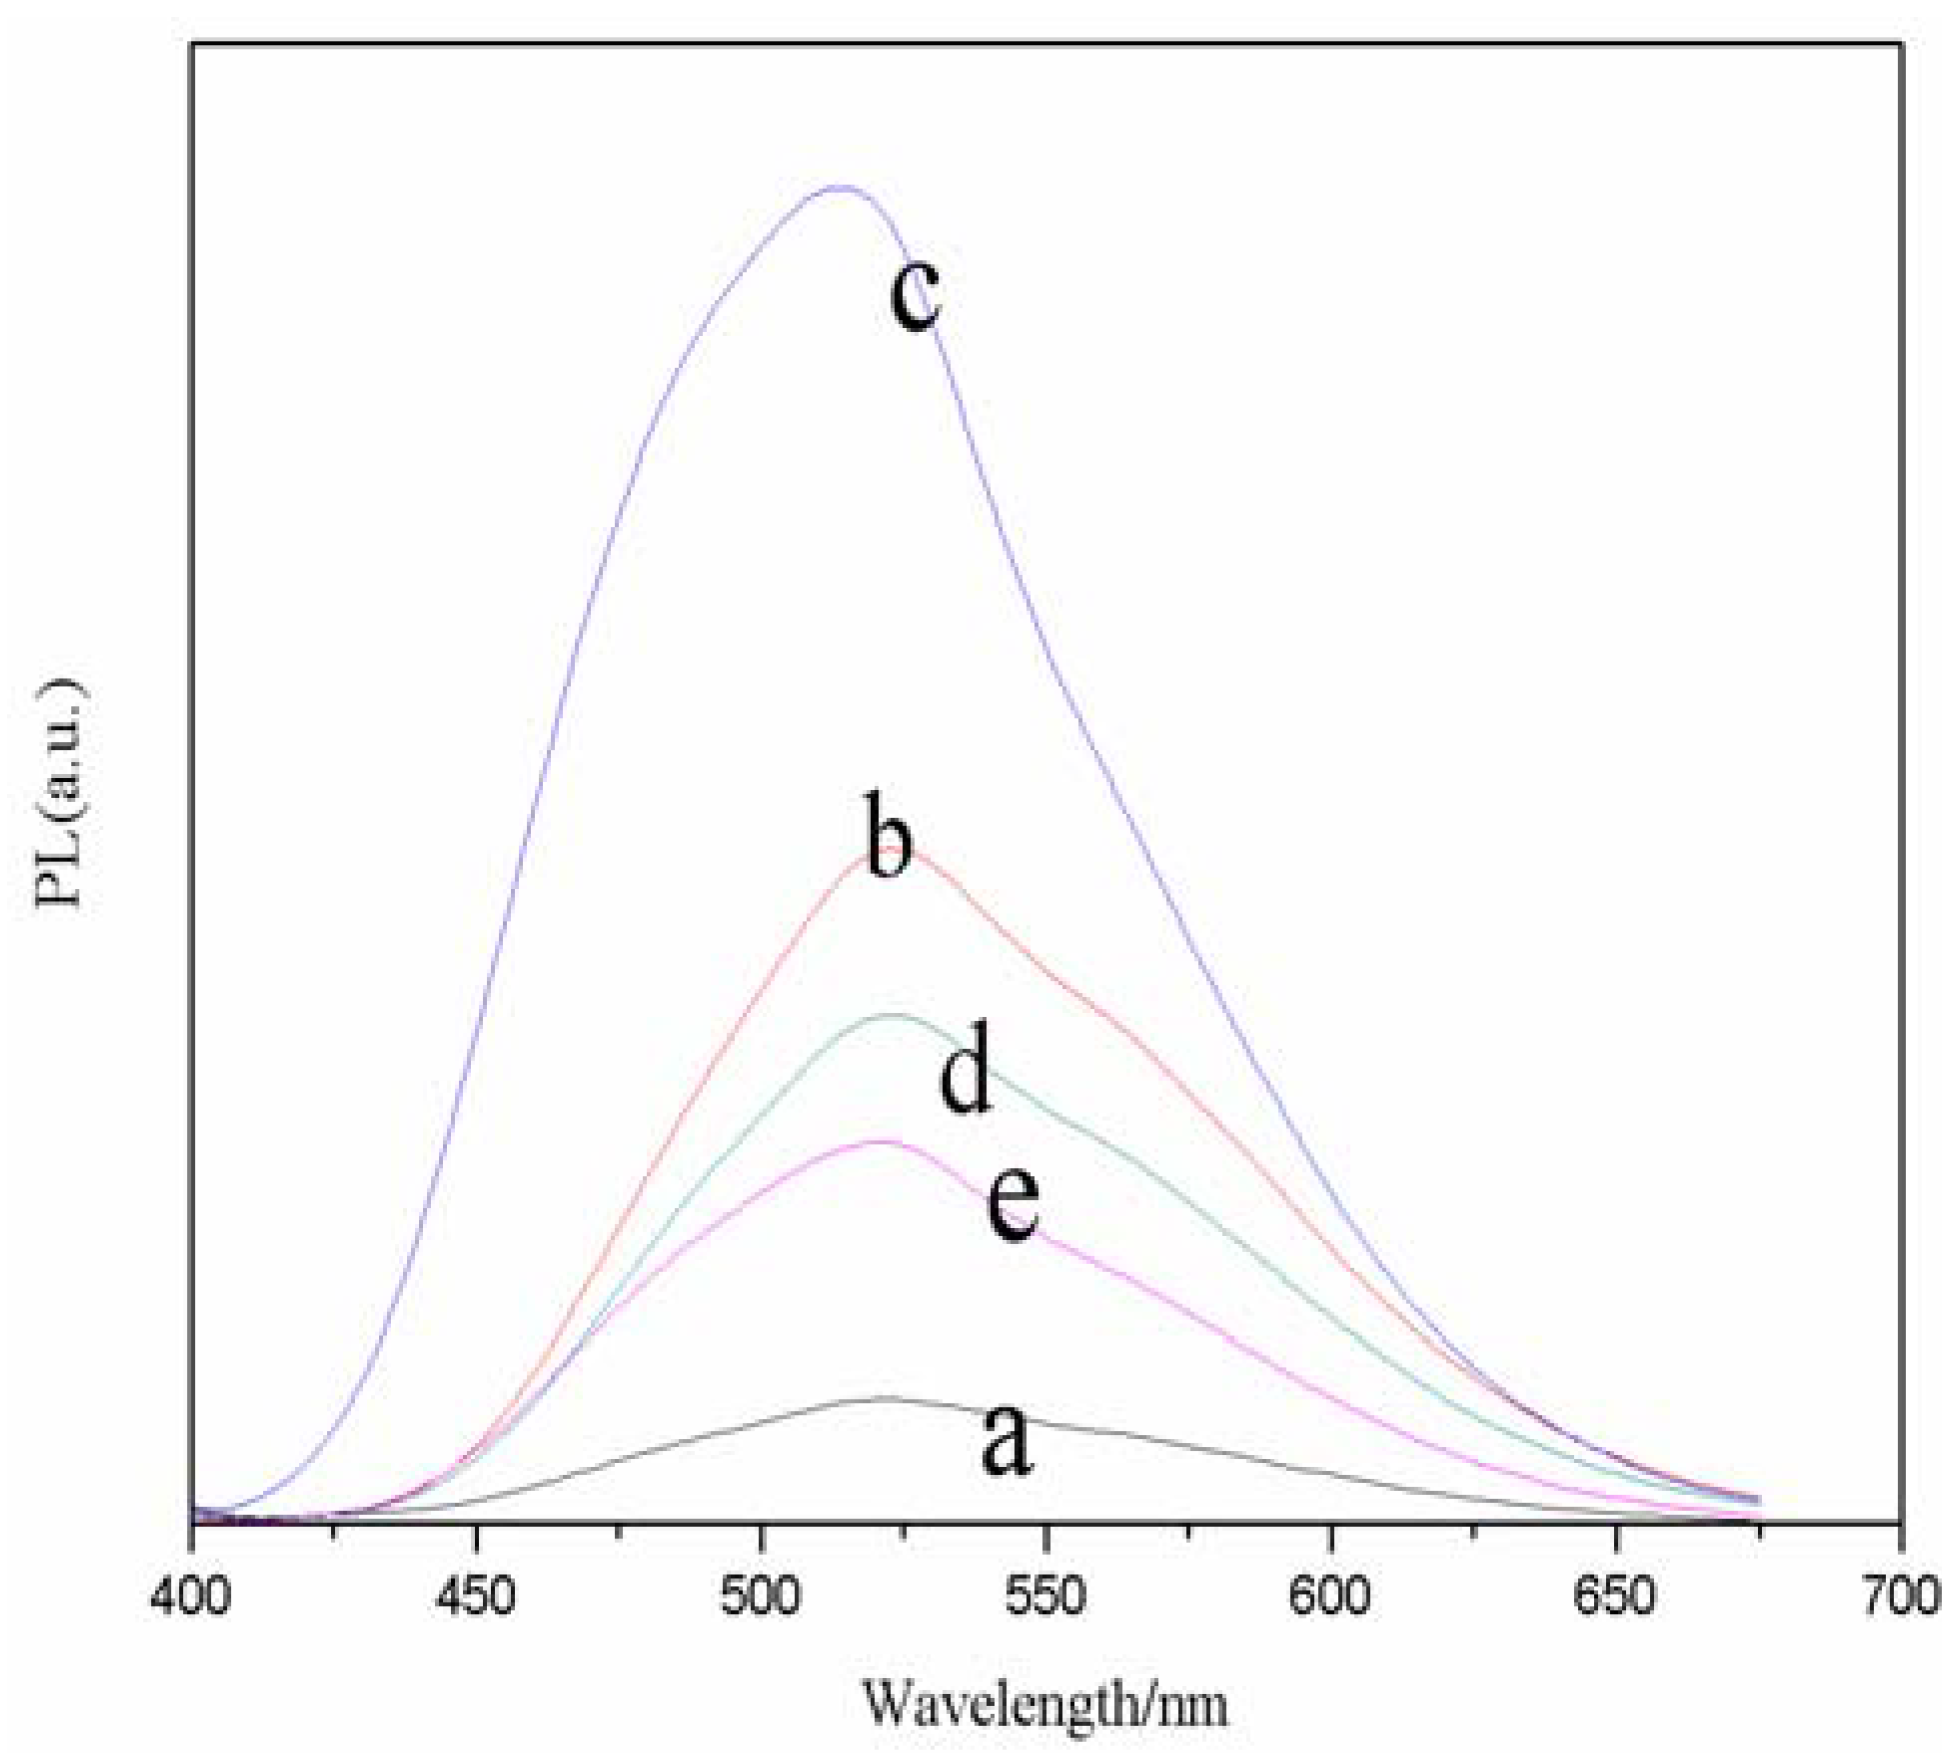
Figure 2. The corresponding samples exhibit emission peaks at about 520 nm. From sample a to c, the emission peak gradually increased with the addition of TGA, while from c to e the emission peak reduced gradually. It turned out that the sample c has a wide full width at half-maximum (FWHM, 50 nm), and the fluorescence intensity of sample c is the strongest. Therefore, the molar ratio of TGA/Se of 2.2 was chosen for further reactions.
Figure 2.
Effects of TGA/Se molar ratios on normalized FL spectra of TGA-capped CdSe QDs at freezing temperature. The reaction time was 30 min (a, 2.0; b, 2.1; c, 2.2; d, 2.3; e, 2.6).
Figure 2.
Effects of TGA/Se molar ratios on normalized FL spectra of TGA-capped CdSe QDs at freezing temperature. The reaction time was 30 min (a, 2.0; b, 2.1; c, 2.2; d, 2.3; e, 2.6).
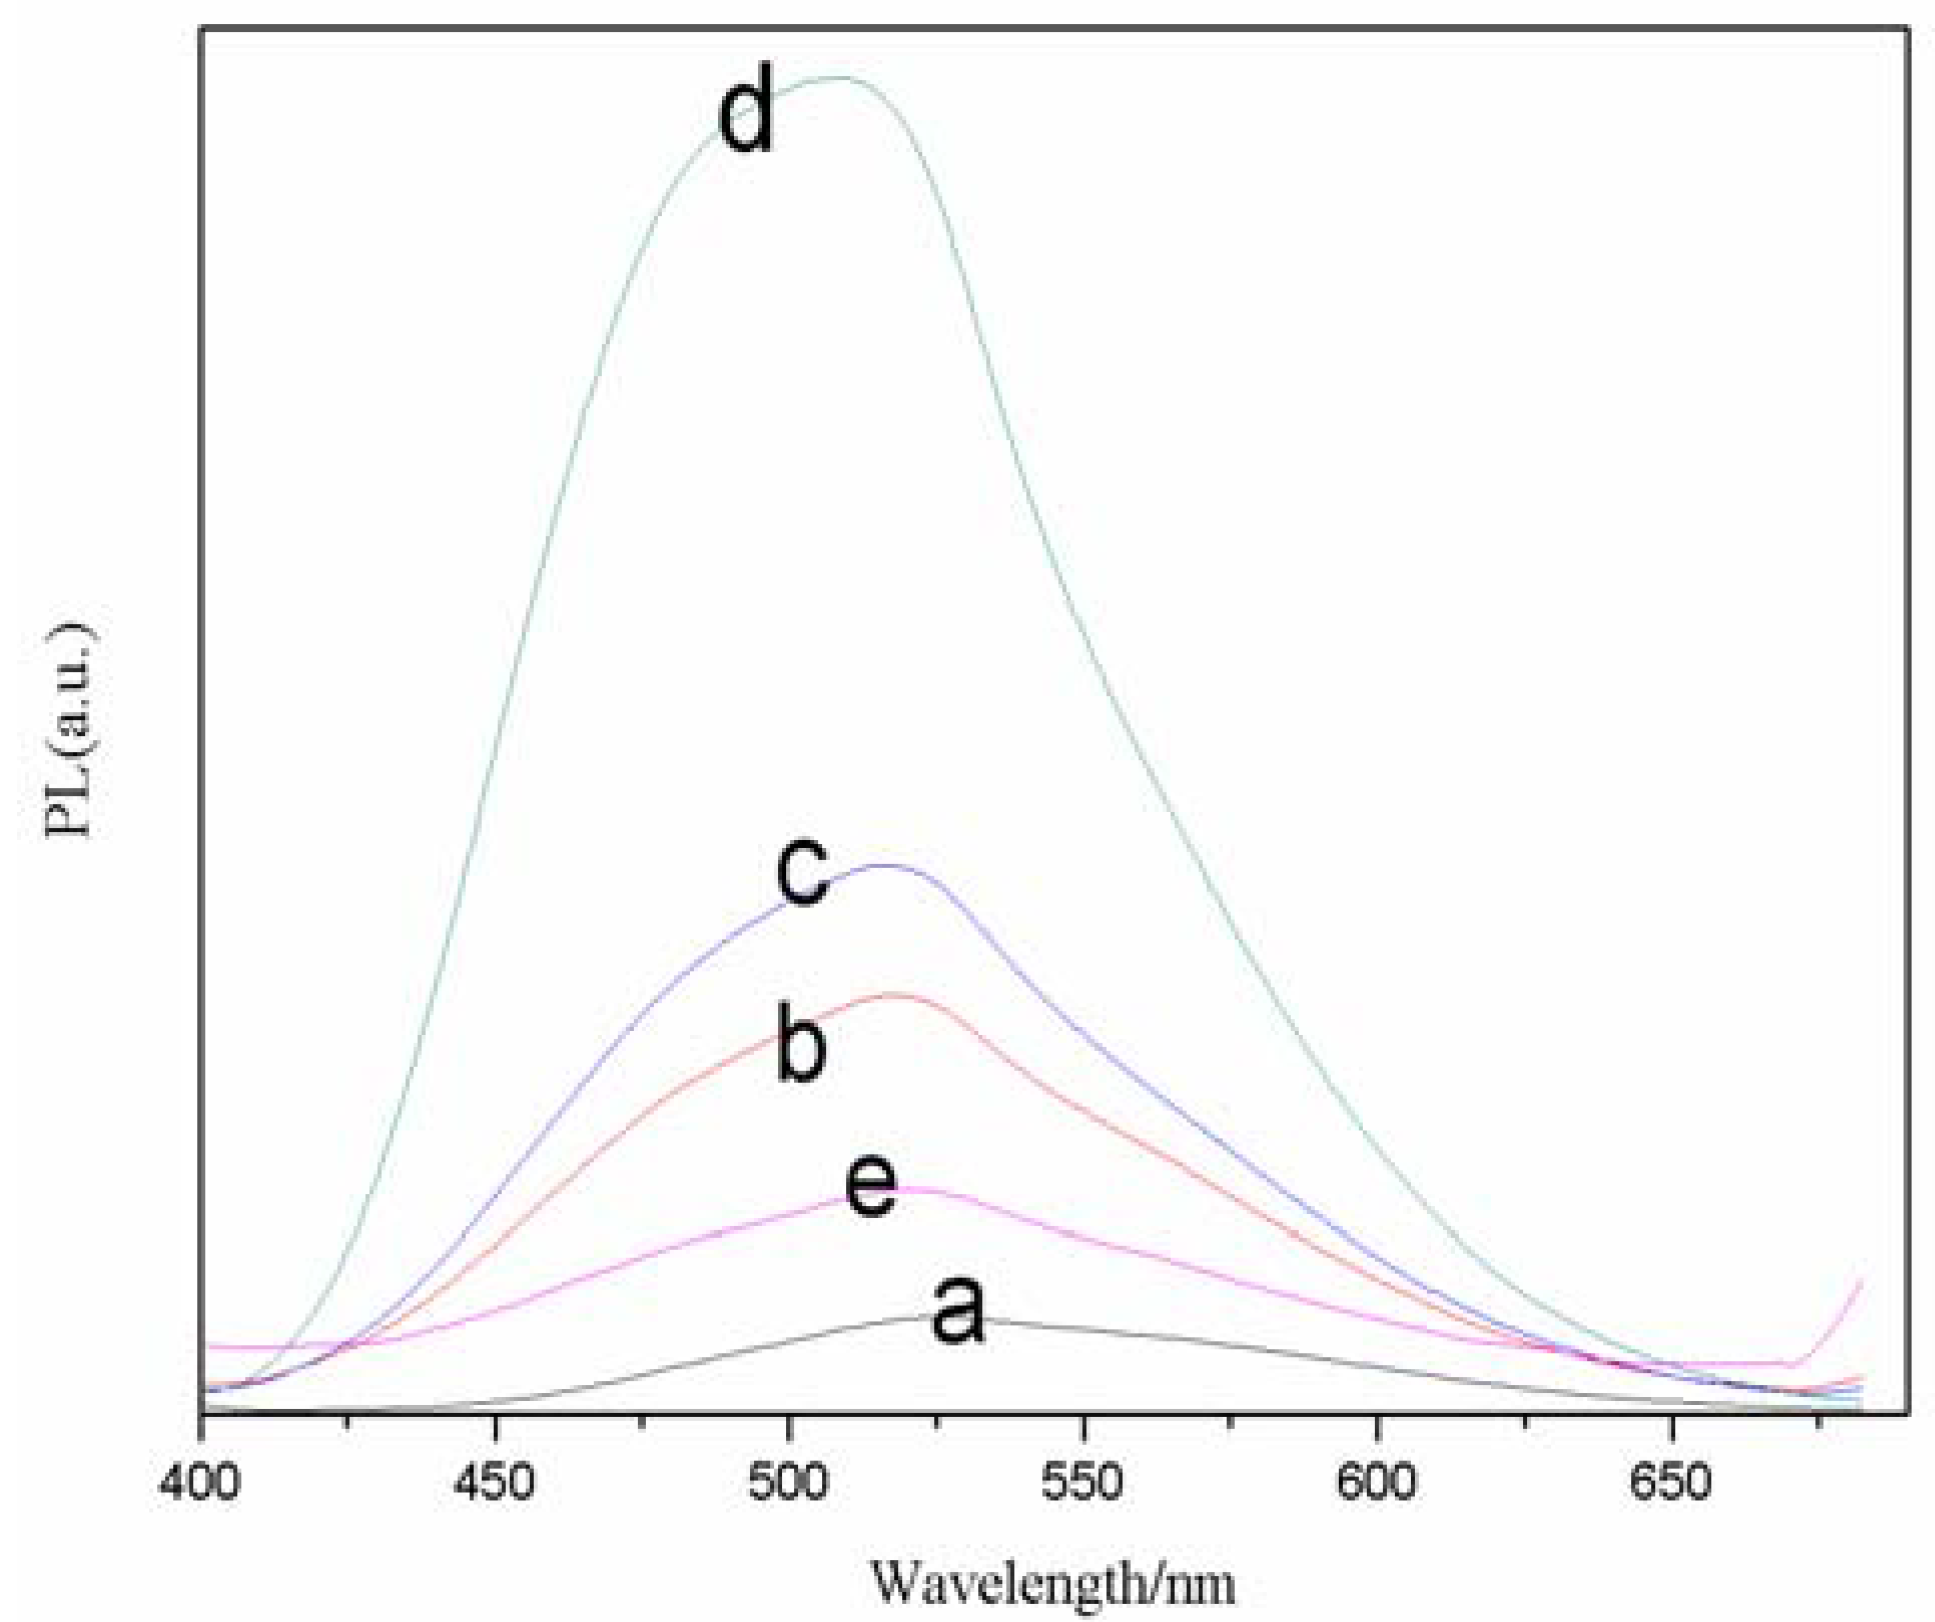
The effect of Cd/Se feed molar ratios on the FL spectra of TGA-Capped CdSe QDs is summarized in
Figure 3, where the emission peak was collected at 520 nm. From sample a to d, the peak intensity faded with increasing Cd
2+ concentrations. It was obvious that the full width at half-maximum was more than 95 nm and the best molar radio of Cd/Se was 3.5. Therefore, we chose a TGA/Se molar ratio of 3.5 for future reactions. The reasons for the change can be interpreted that with the increase of Cd molar weight, the concentration of Se precursor compound becomes lower and nucleation is less, so there will be a lot of Cd
2+ monomers participating in the nanocrystal surface arrangement and reconstruction during the growth of nanocrystal.
Figure 3.
Effects of different molar ratios of Cd/Se on normalized FL spectra of TGA-capped CdSe QDs at freezing temperature. The reaction time was 30 min (a, 1.5; b, 2.5; c, 3.0; d, 3.5; e, 4.0).
Figure 3.
Effects of different molar ratios of Cd/Se on normalized FL spectra of TGA-capped CdSe QDs at freezing temperature. The reaction time was 30 min (a, 1.5; b, 2.5; c, 3.0; d, 3.5; e, 4.0).
As for the pH value,
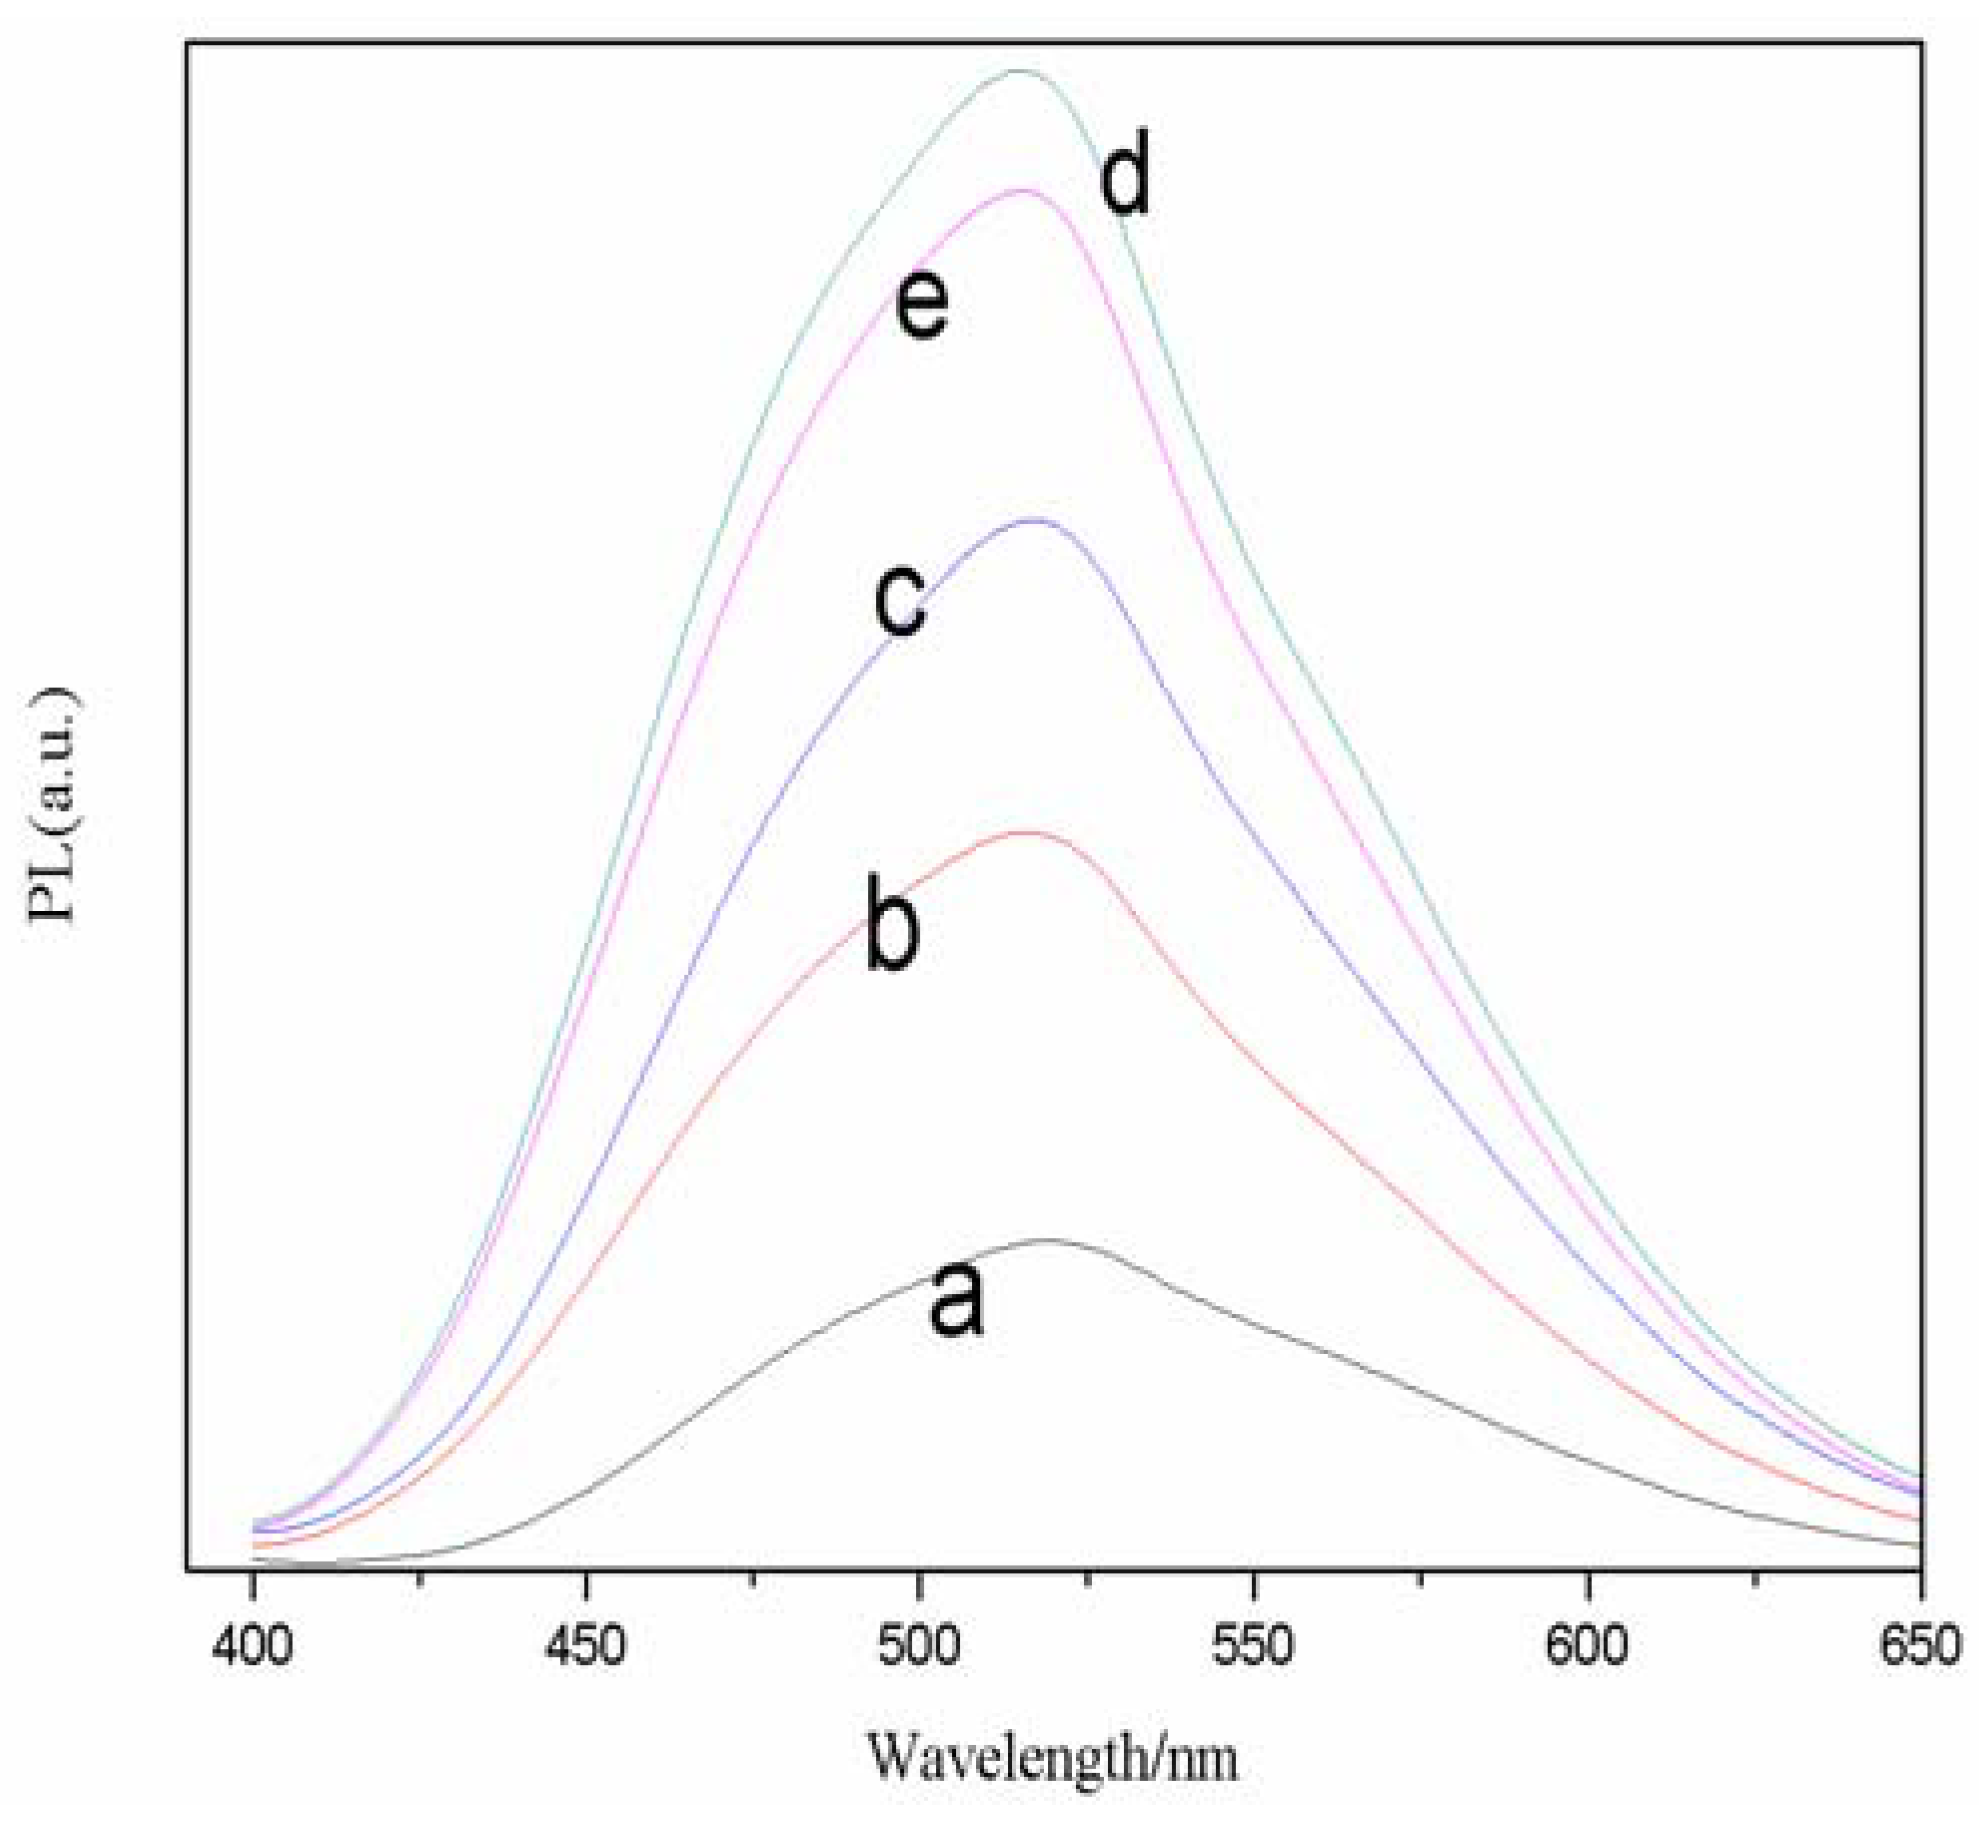
Figure 4 reflects the relationship of fluorescence spectrogram of CdSe QDs with different pH values, such as 8.5, 9.5, 10.0, 10.5 and 11.0. Although the pH value increases, its emission peak still stands around 520 nm. On the other hand, the fluorescence intensity of CdSe QDs changes obviously and it reaches the highest when the pH is 10.5, but a further increase of pH to 11.0 results in a decline in the intensity.
Figure 4.
Effects of different pH on normalized FL spectra of TGA-capped CdSe QDs at freezing temperature. Cd/Se/TGA = 3.5:1:2.2. The reaction time was 30 min (a, 8.0; b, 9.0; c, 10.0; d, 10.5; e, 11.0).
Figure 4.
Effects of different pH on normalized FL spectra of TGA-capped CdSe QDs at freezing temperature. Cd/Se/TGA = 3.5:1:2.2. The reaction time was 30 min (a, 8.0; b, 9.0; c, 10.0; d, 10.5; e, 11.0).
This phenomenon indicates that the pH value may modify the surface structure of the semiconductor nanocrystals. Reaction systems at different pH values will lead to differences in the combination of stabilizer and Cd
2+, the combination of OH
− and Cd
2+, the reaction of Se
2− and Cd
2+, as well as the size and structure of the QDs,
etc. For example, the increase of pH value will lead to the formation of a Cd(OH)
2 shell around the CdSe QDs, and decrease the surface defects, as well as filling the surface cavity of Se
2− with OH
−. Consequently, it compels the electrons’ return to the nuclear eigenstate and eliminates a mass of surface localized states. Elimination of surface dangling bonds brings about an enhanced exciton launch. The CdSe QDs formed by competing reactions have some differences in surface structure. From
Figure 4 we also can find that, too strong alkaline conditions (pH = 11) make Se
2− defeated in the competition, thus resulting in the reduction of quantum dots, and the decline of fluorescence intensity. The mechanism for the synthesis of CdSe QDs is proposed as follows:
![Molecules 17 08430 i001]()
![Molecules 17 08430 i002]()
![Molecules 17 08430 i003]()
![Molecules 17 08430 i004]()
![Molecules 17 08430 i005]()
Equation (1) and Equation (4) demonstrate that the slightly basic solution is good for the formation of Cd(TGA)2+ complex, while the presence of stronger base leads to the formation of Cd(OH)2. Here Cd2+, Se2− and TGA instantly formed CdSe (TGA) nuclei as indicated in Equation (7):
Under the optimum conditions, the prepared CdSe QDs was 14% through the following formula:
The reason for such high fluorescence quantum yield was that the peak breadth of fluorescence spectrum is so wide that the integral area was very large.
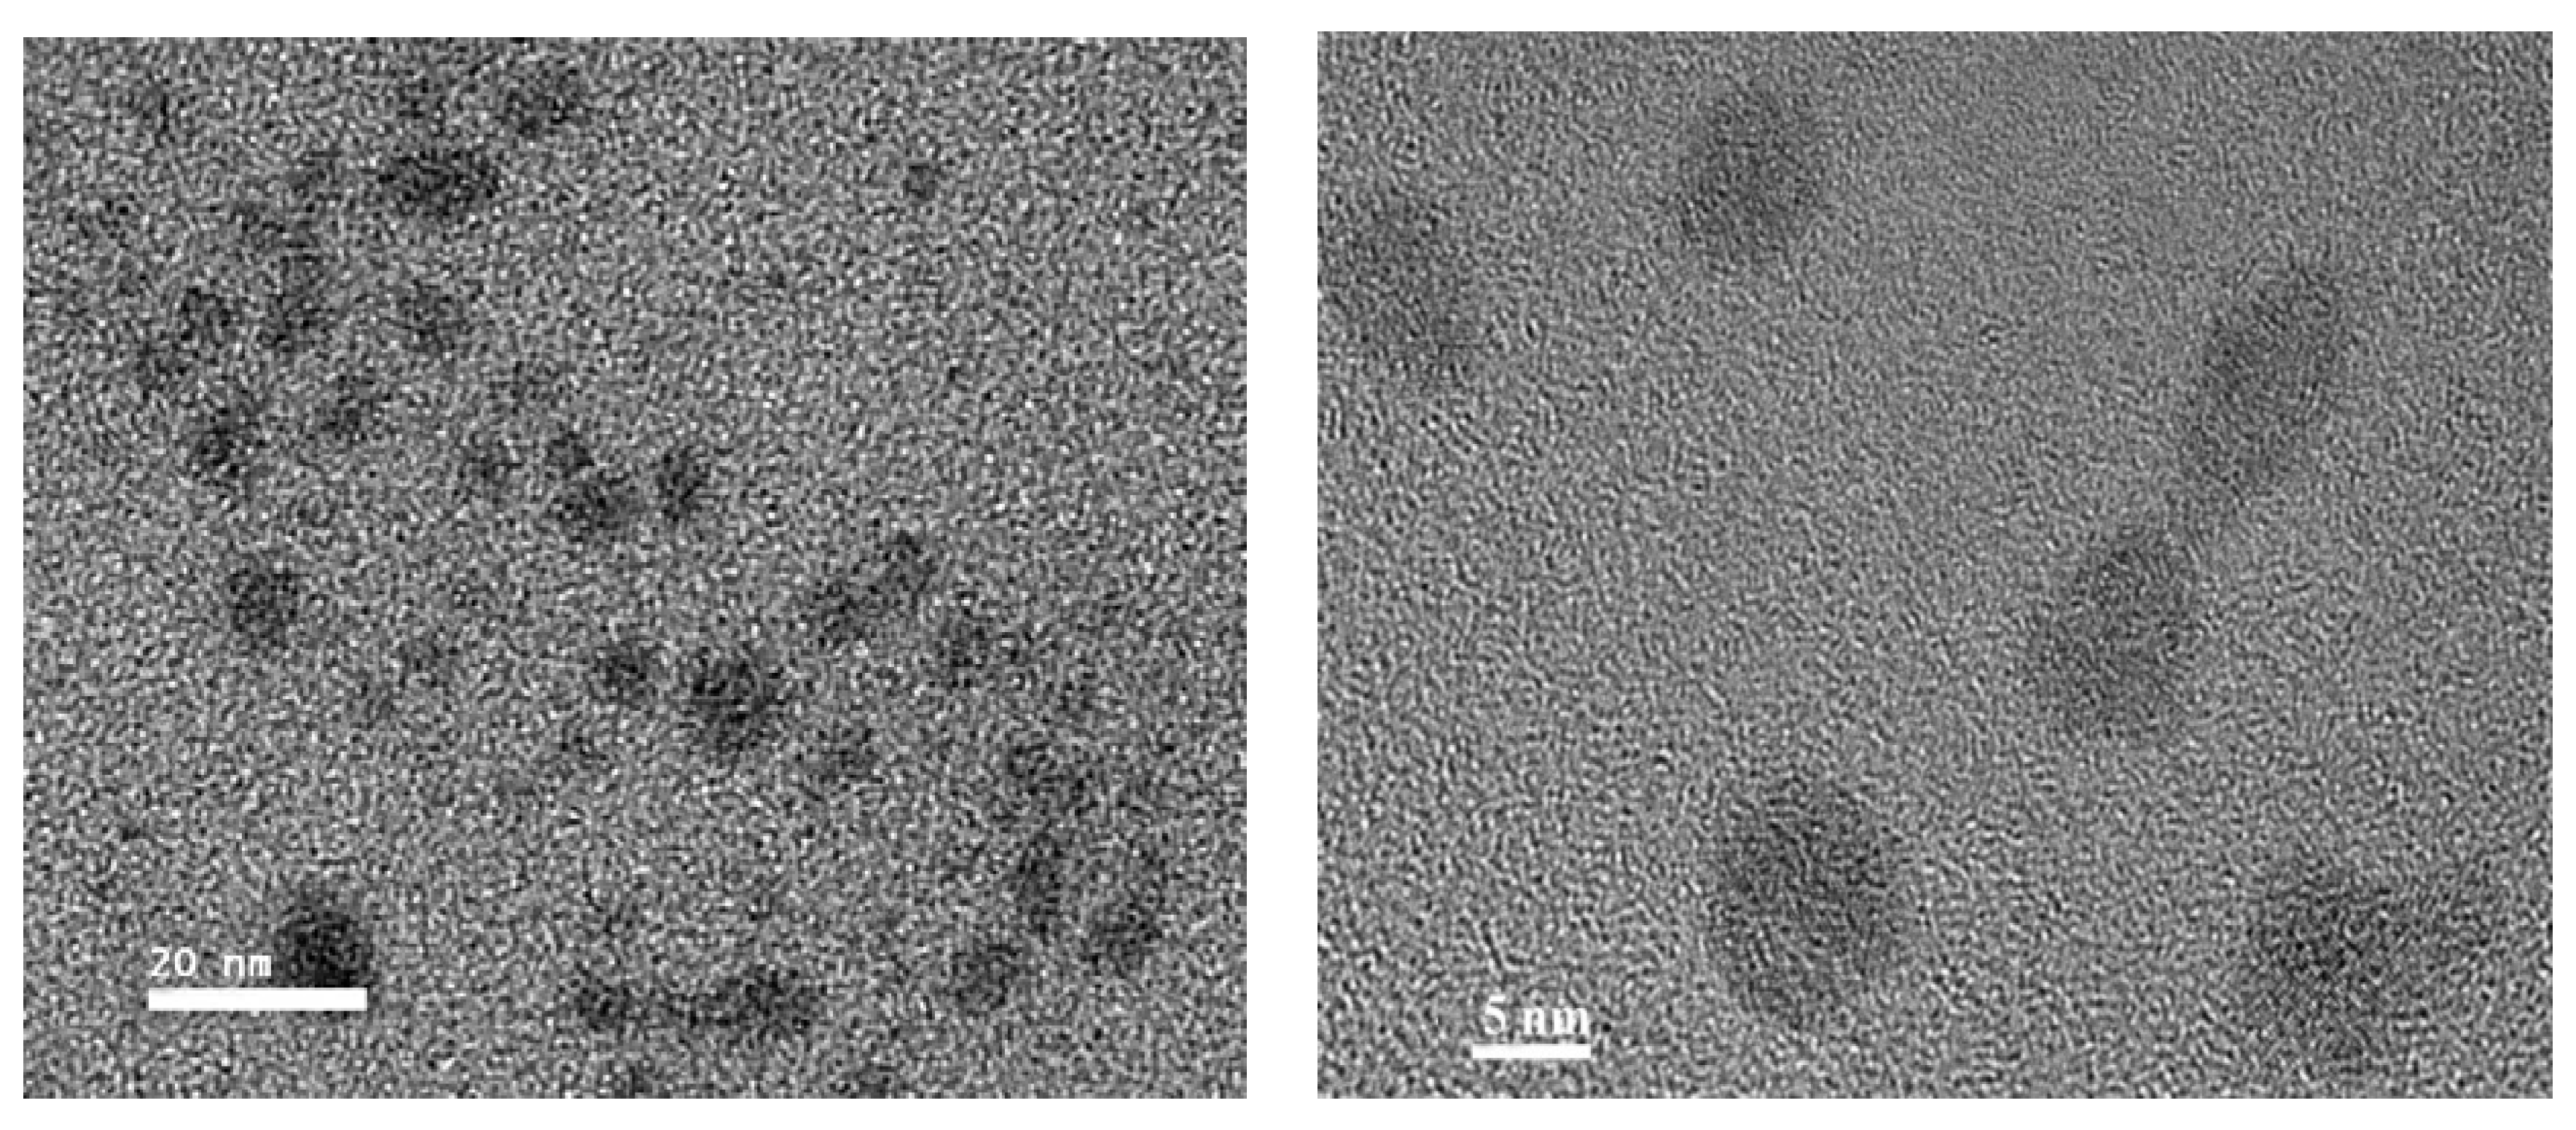
The morphology of the synthesized TGA-capped CdSe QDs was examined by TEM. The data in
Figure 5 were collected with the molar ratio of Cd/Se at 3.5 and the reaction time set at 30 min. The typical TEM image of these CdSe QDs showed that QDs was close to spherical, with diameters of about 3–10 nm. The nearly mono-dispersed nanocrystals form long-ranged, well-ordered two dimensional superlattices, which demonstrate that the size and shape of the particles are not very consistent. This result was also in agreement with the fluorescence spectrum.
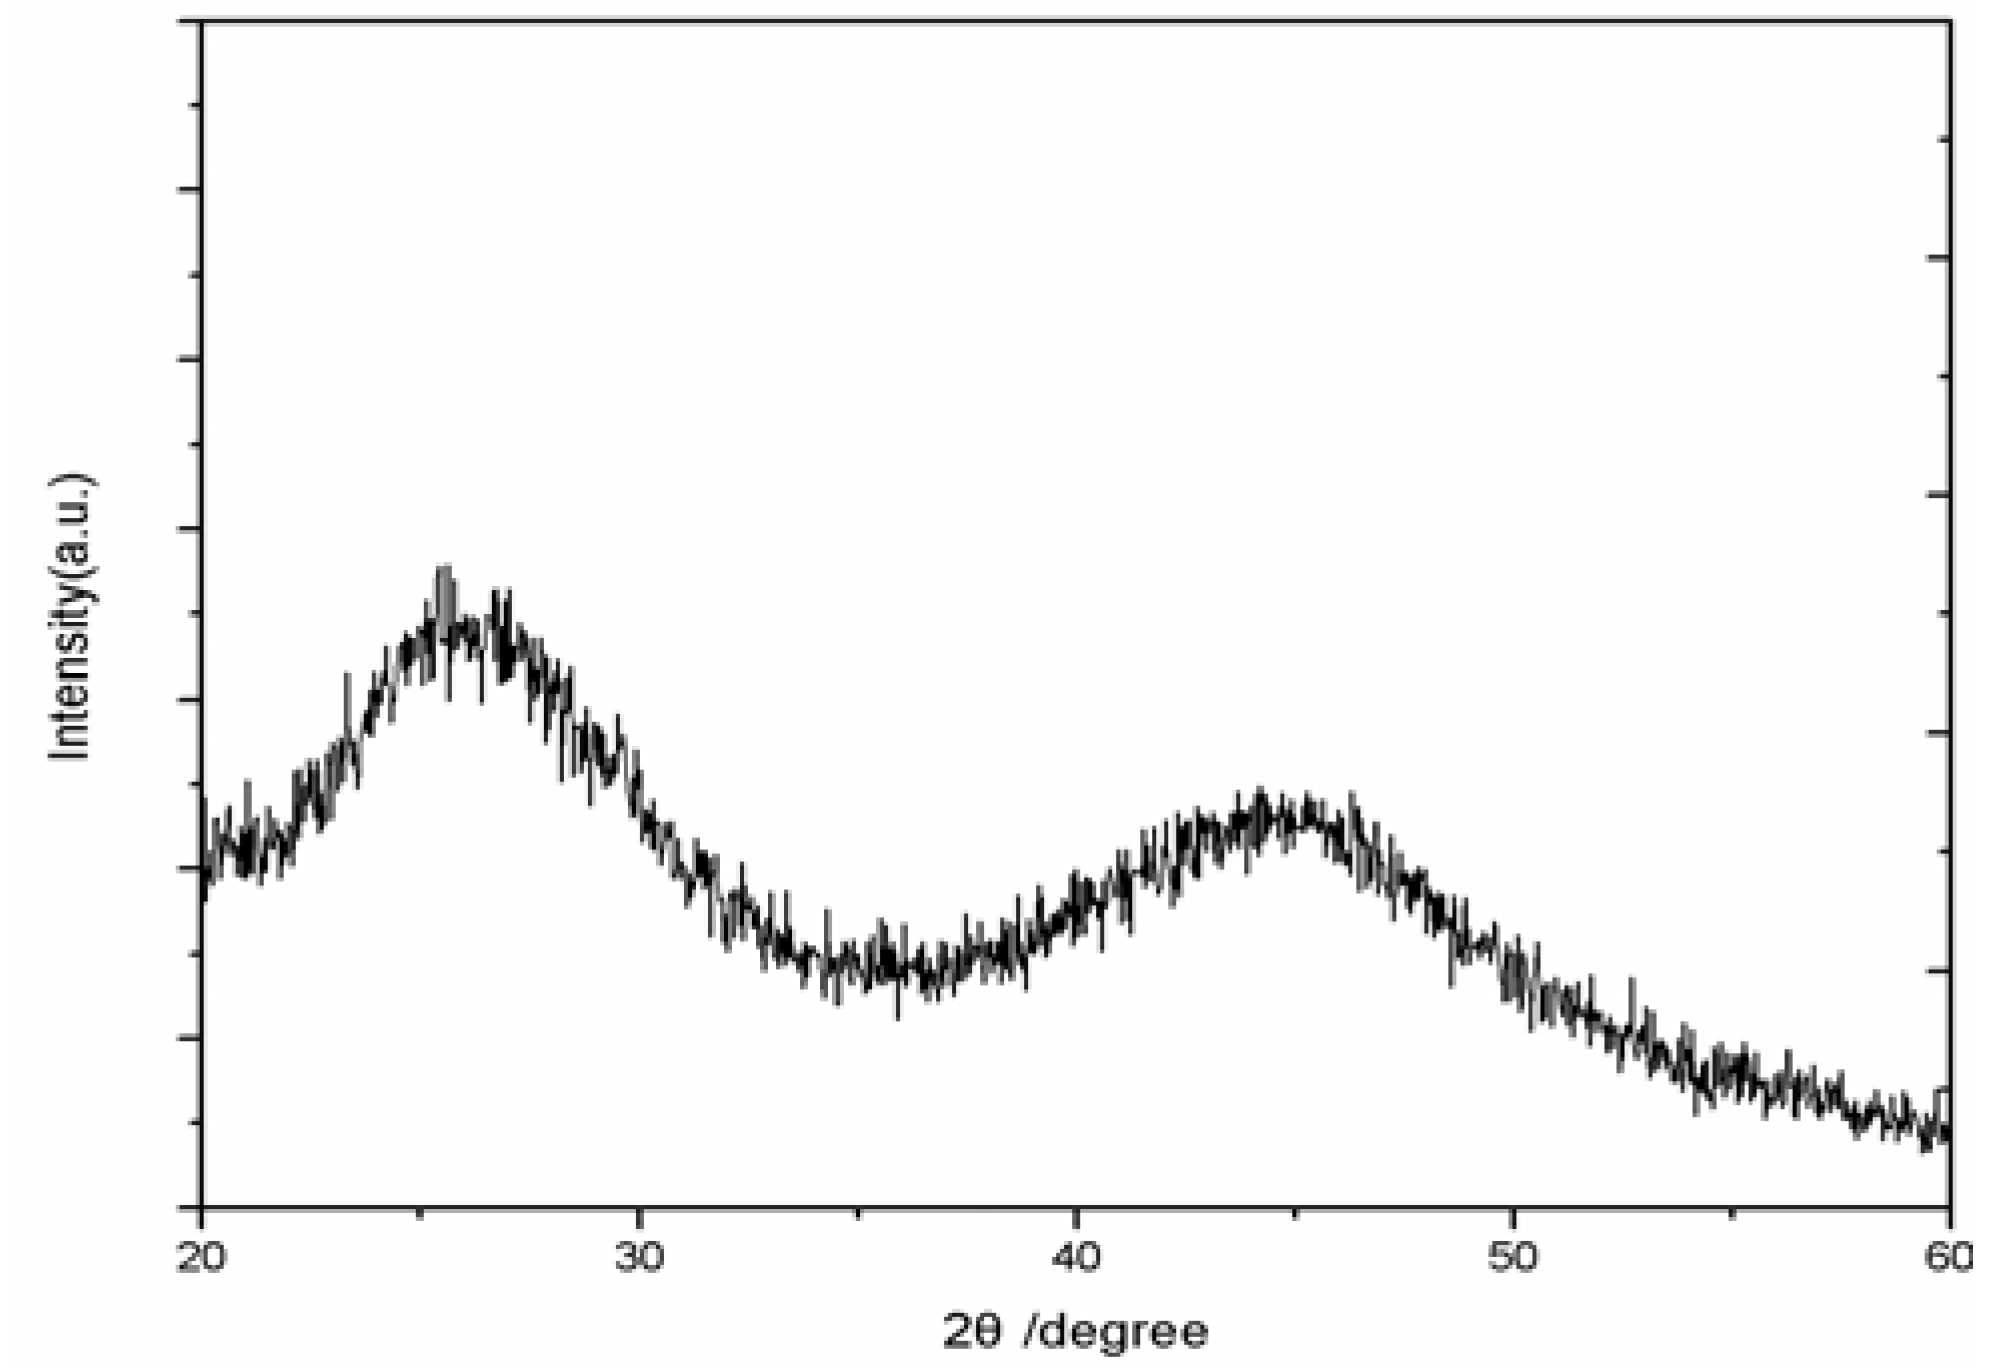
Figure 6 shows the XRD pattern of the CdSe QDs synthesized using the freezing temperature method. The broad peaks imply that the CdSe QDs are very small. The quantum dots belong to cubic phase structure. The main strong peaks are observed are for 111, which clearly matches for CdSe bulk material [
16]. No peaks corresponding to impurities were detected, indicating the high purity of the product. The nanocrystals obtained at freezing temperature have less crystallization structure. The completely crystallized structure may not be easy to oxidize due to the compact structure.
Figure 5.
TEM images of synthesized TGA-capped CdSe QDs.
Figure 5.
TEM images of synthesized TGA-capped CdSe QDs.
Figure 6.
XRD pattern of the CdSe quantum dots synthesized at freezing temperature.
Figure 6.
XRD pattern of the CdSe quantum dots synthesized at freezing temperature.


