2.1. Characterization of the Isolated hMSCs
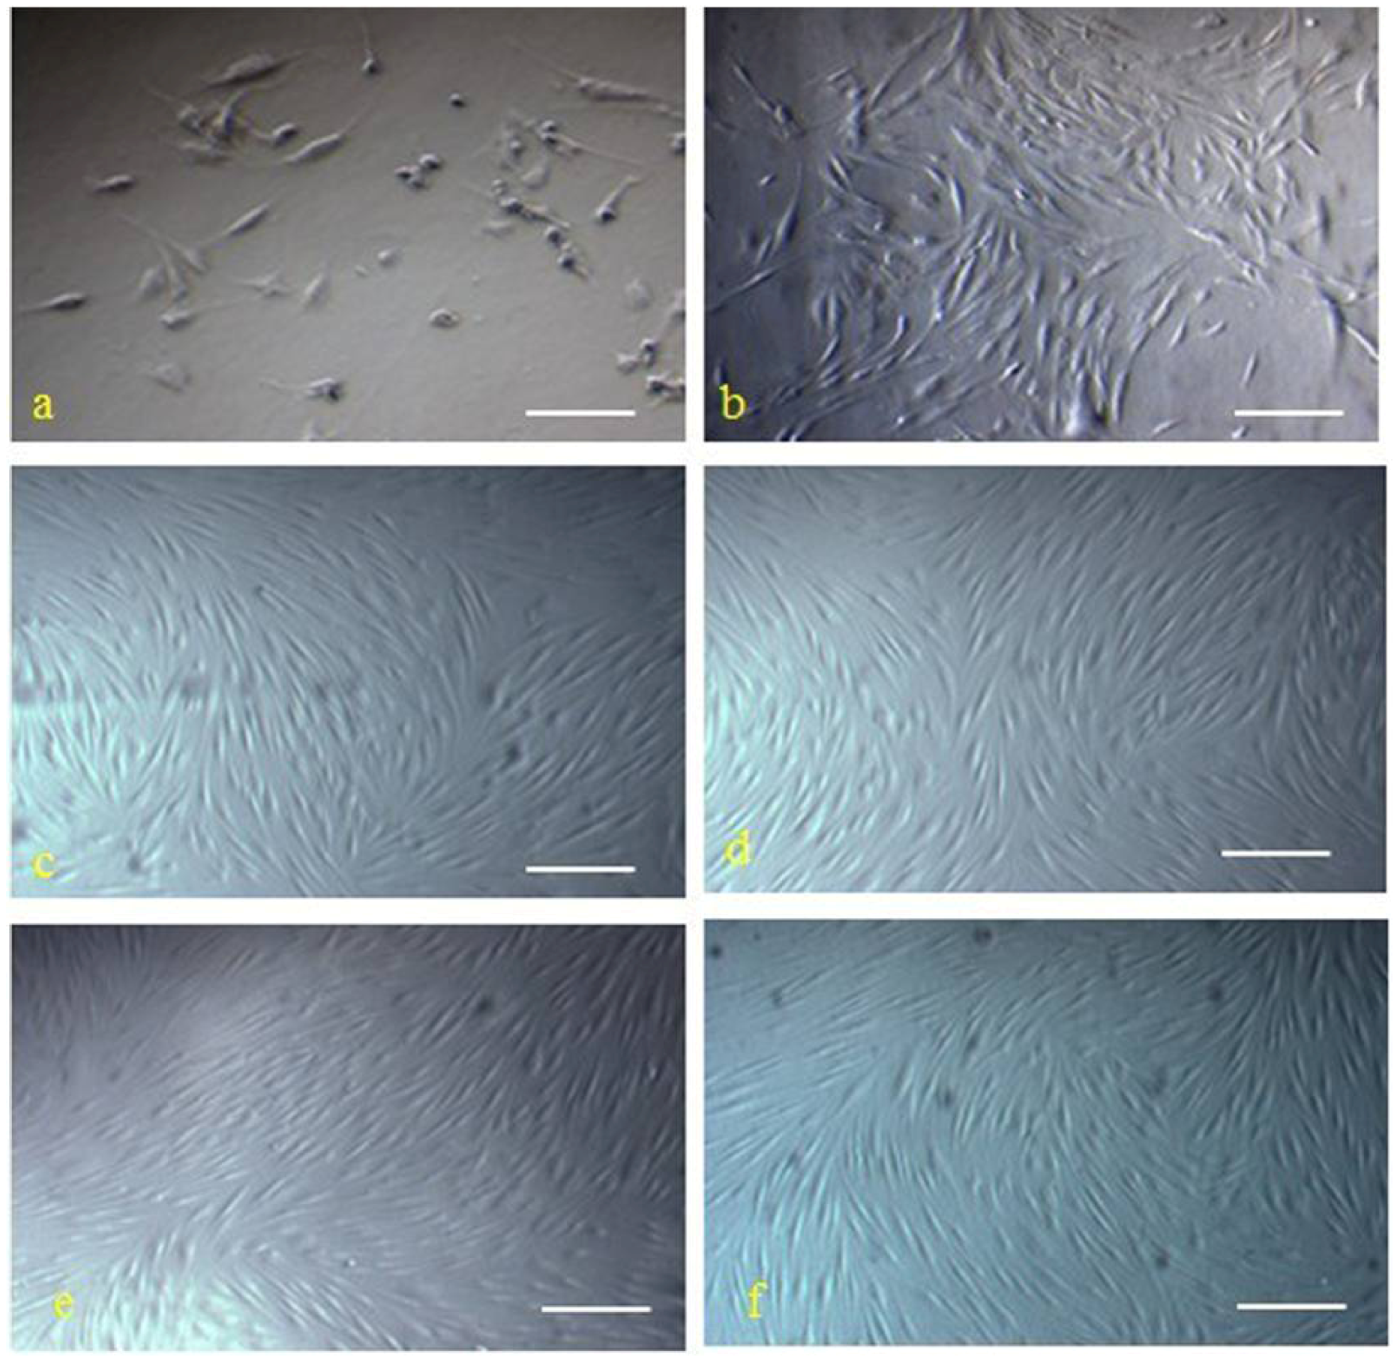
The hMSCs were successful isolated from human marrow blood by density gradient centrifugation, selecting for adhering cells and sparsely distributed single adherent cells. These hMSCs were observable at 48 h after seeding, and the morphology of hMSCs was fibroblast-like and spindle-shaped (
Figure 1a). The medium was changed every 3 days. At days 7 to 10, single cell-derived colonies started to form and were further cultured. By days 13 to 20, cells from the individual clones grew to approximately 90% confluence. These cells maintained their long spindle shape, attached well to the tissue culture dish, and clustered in an orderly fashion into shoal or whirlpool shapes (
Figure 1b). These cell clones were passaged at a 1:3 ratio, and they preserved a fibroblast-like morphology and a constant growth rate until passage 12 (
Figure 1c–f). The indicated cell surface markers of the isolated hMSCs were detected by immunofluorescence staining (
Figure 2A), immunocytochemical staining (
Figure 2B), and flow cytometric analysis (
Figure 2C). Notably, these cells were positive for specific hMSCs markers, such as CD29, CD73, CD105, CD106, and mesenchymal cell marker CD166, but were negative for hematopoietic stem/progenitor and endothelial cell marker CD34 and white blood cell marker CD45. The growth curves of hMSCs are shown in
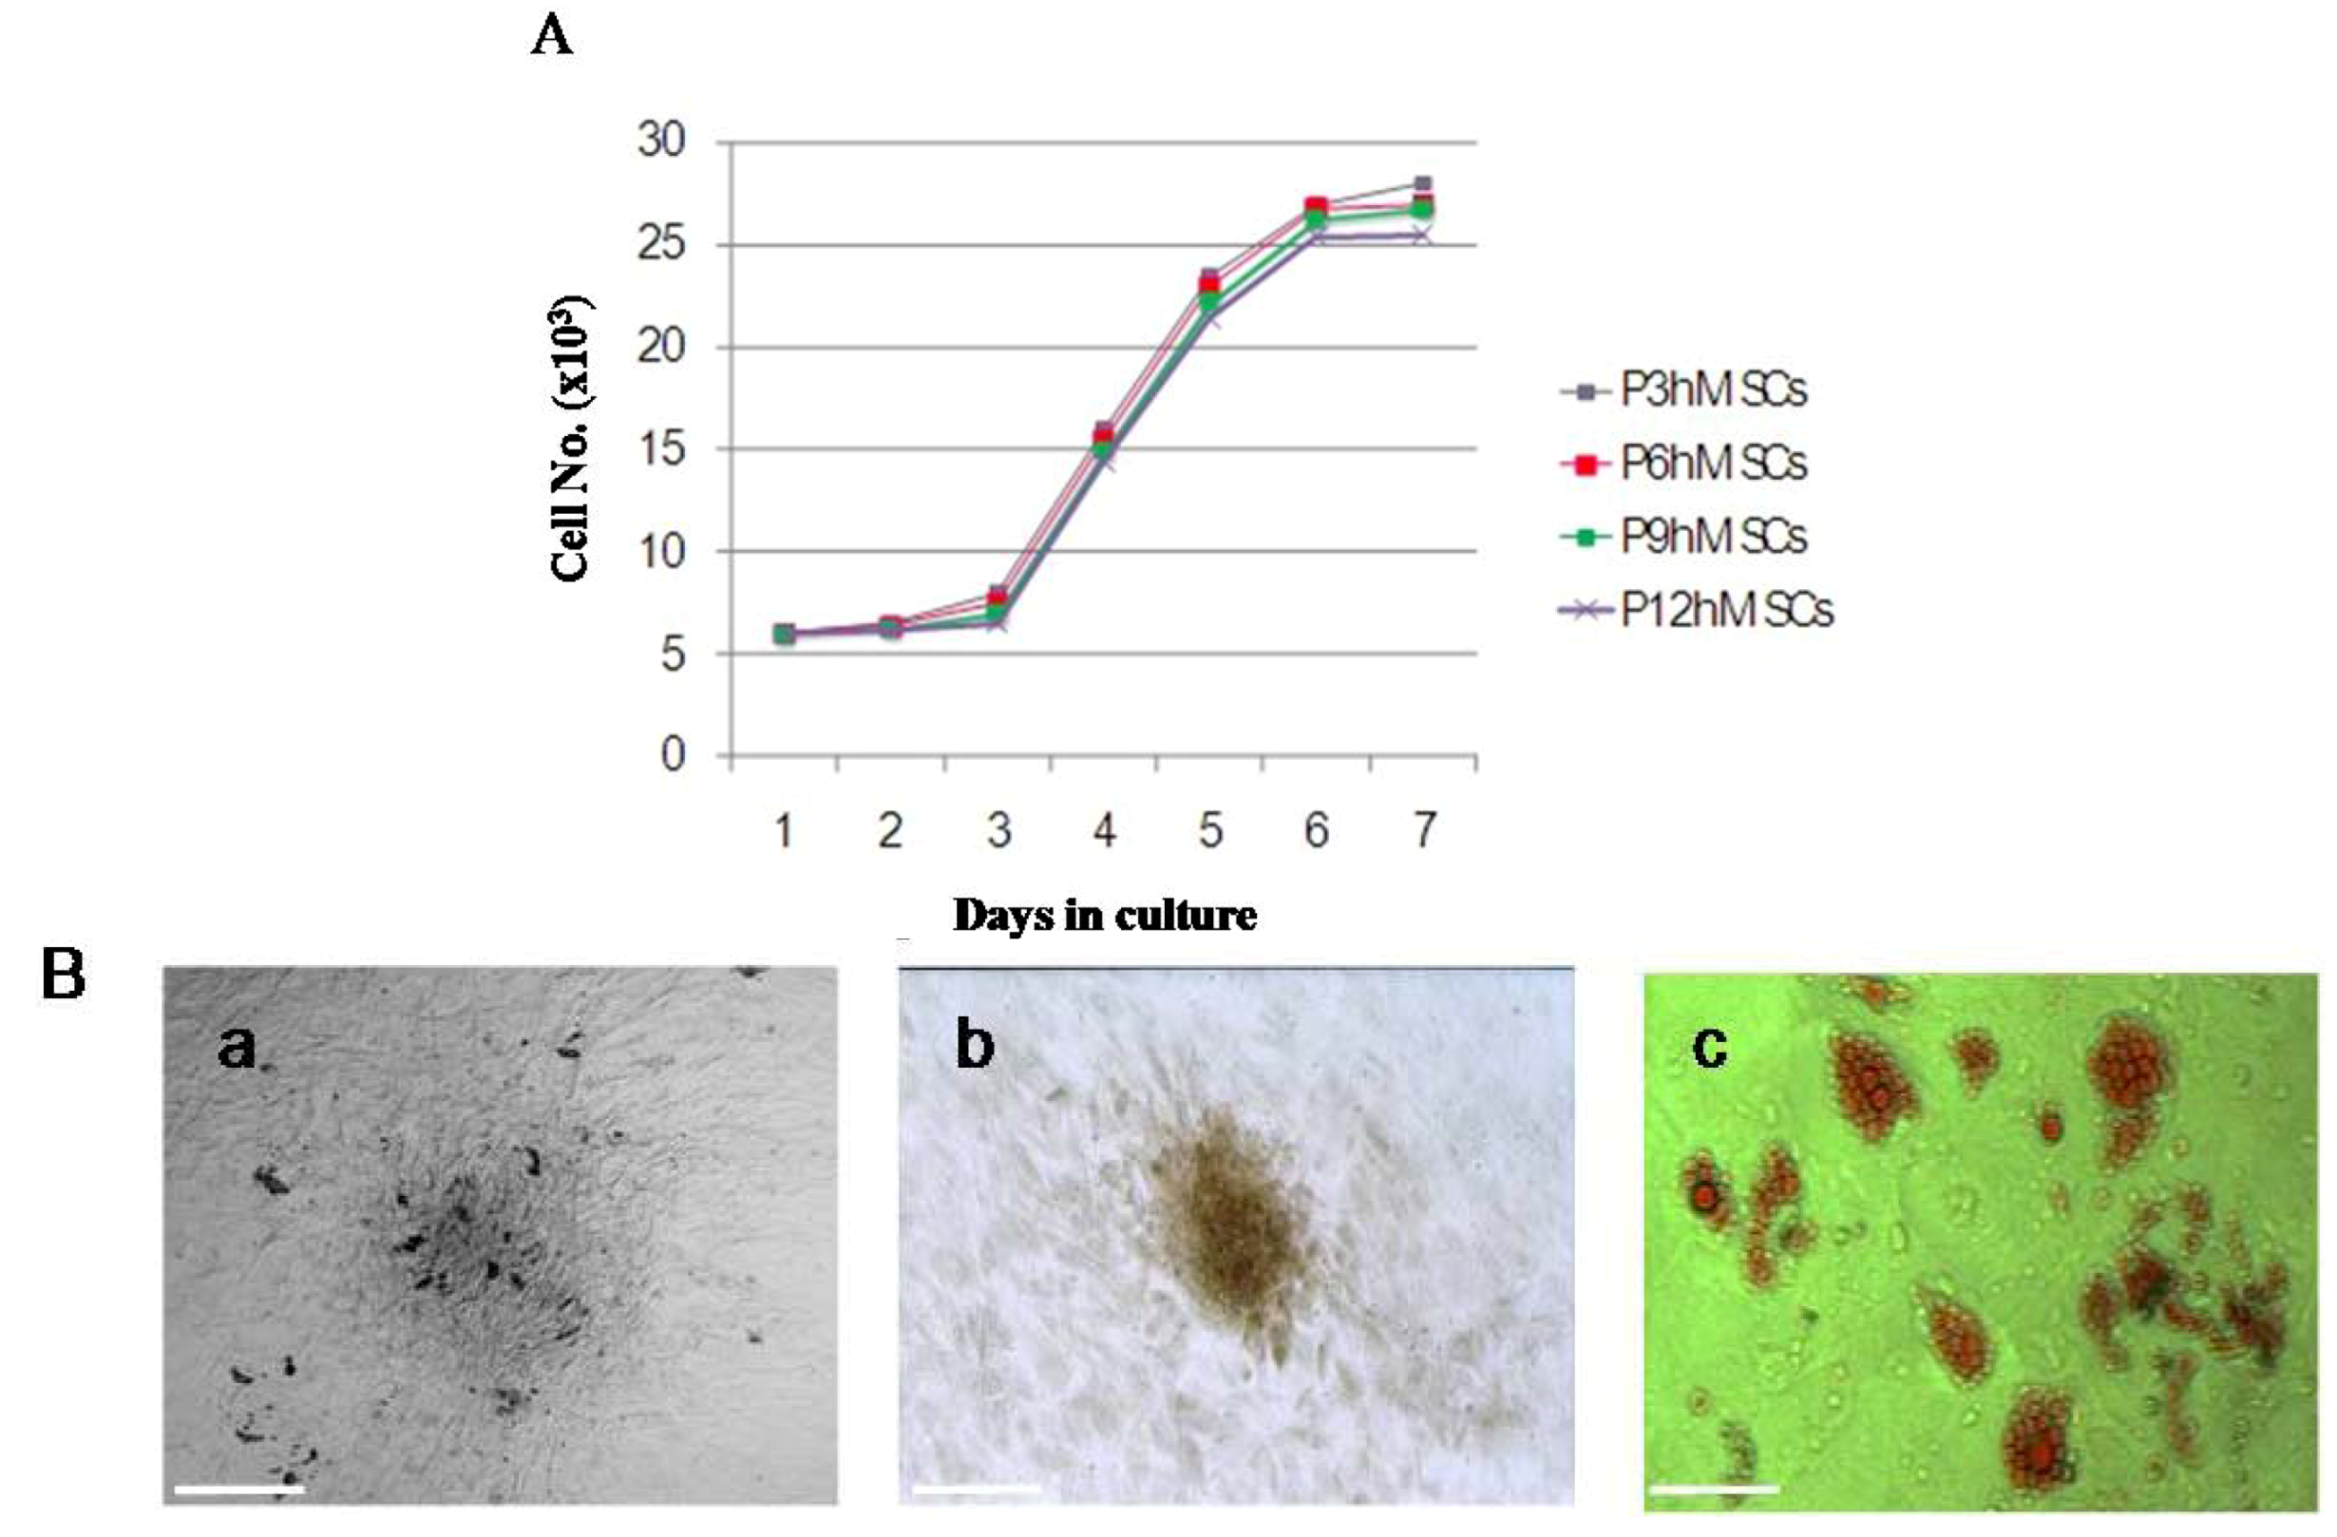
Figure 3A. Monitoring the growth of isolated hMSCs, the growth of cells was in the latent phase for the first 2 days, entered a log phase between days 3 and 5, and then reached a plateau. The doubling time for cells in the log phase was 37 ± 1.8 h, and the cells maintained a constant growth pattern until passage 12. The hMSCs were cultured in adipogenic and osteogenic media, respectively. 11–14 days after osteogenic induction, multiple but separated nodules, formed by the clustering of cells, became visible (
Figure 3B-a), which further transformed into typical bone trabeculae structures by days 22 to 24 and hMSCs began to express and became positive for ALP (
Figure 3B-b). 14 days after adipogenic induction, oil red O staining of adipogenic cultures was performed. Many lipid droplets were observed in the cytoplasm of induced hMSCs (
Figure 3B-c).
2.2. Determination of the Optimal 5-Aza Concentration to Induce Cardiomyocyte-Like Cells Differentiation of hMSCs
Different concentrations of 5-Aza (0, 1, 5, 10, 20, and 50 μM) were added to the isolated hMSCs when they were incubated in L-DMEM supplemented with 10% FBS to determine the optimal concentration of 5-Aza to induce the hMSCs to differentiate into cardiomyocyte-like cells. The evolution of the morphology was monitored, and the viability of the cells subjected to various concentrations of 5-Aza was assessed by the MTT assay.
Figure 1.
The morphology of isolated cells from bone marrow presented features of hMSCs. Cells isolated from bone marrow at 48 h after seeding (a, scale bar: 100 μm) and cells from individual clones grew into shoal or whirlpool shapes (b,scale bar: 100 μm), passage 3 (c), passage 6 (d), passage 9 (e), and passage 12 (f), respectively, were photographed under a microscope (magnification, 200×; Scale bar, 200 μm).
Figure 2.
Isolated cells presented cell surface markers of the hMSCs. The expressions of indicated cell surface markers were determined on isolated hMSCs (passage 6) by immunofluorescence staining (A), immunocytochemical staining (B), and flow cytometric analysis (C). Images (A) were obtained using laser scanning confocal microscopy. Scale bar, 50 μm. Cells in the P2 gate (C) represented the positively stained population.
Figure 3.
The growth cures and adipogenic, osteogenic differentiation of hMSCs. (A) Isolated hMSCs (8 × 10³) were seeded into a 24-well plate in DMEM supplemented with 10% FBS for a total of 7 days. The cell number on each day was determined with trypan blue staining; (B) The isolated hMSCs underwent osteogenic and adipogenic differentiation for different time periods. The cell morphology, ALP and oil red O stain were examined by differential interference contrast microscopy respectively. Scale bar, 100 μm.
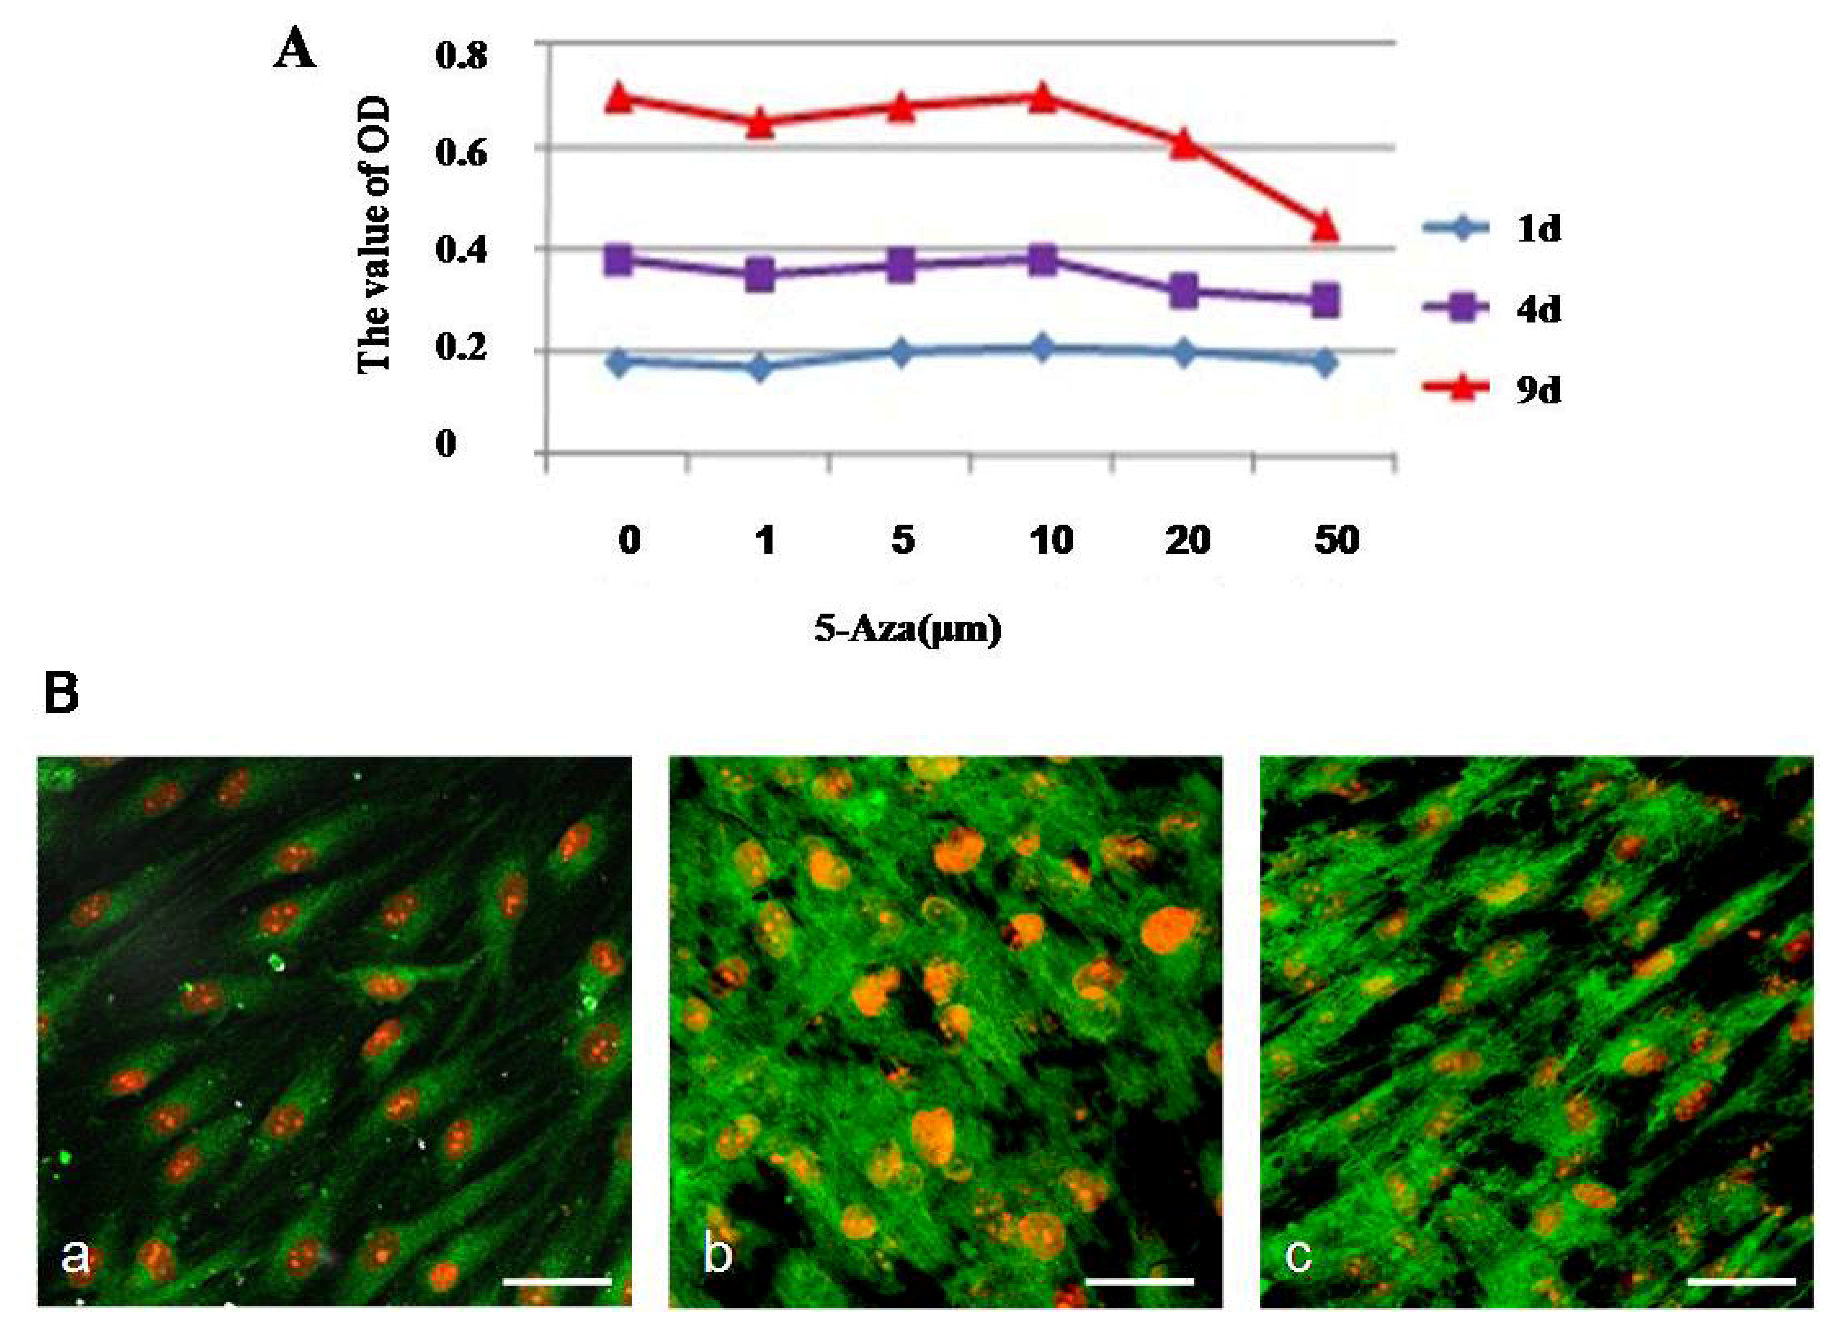
The treatment of hMSCs with different concentrations of 5-Aza affected the viability of hMSCs to various degrees. The levels of metabolic activity of hMSCs were assessed by the MTT assay. As shown in
Figure 4A, the viability of the cells was not affected at any concentration of 5-Aza after 1 day, indicating that the cells might be in an adaptation period. When induced after 4 days, the cell activity increased consistently. When the concentration of 5-Aza was less than10 μM, the influence over the hMSCs viability was minor. But when the concentration of 5-Aza was more than 20 μM, the morphology images showed cell retraction shorter, growth condition poor, almost no proliferation and cell death constant (
Figure 4B). Taking the cell viability results together with the morphology analysis of hMSCs into cardiomyocyte-like cells, we concluded that 10 μM is the most appropriate concentration of 5-Aza for induction; therefore, this concentration was used in further experiments.
Figure 4.
The optimal concentration of 5-Aza treatment induced cardiomyocyte-like cells differentiation. (A) Cells were induced with 5-Aza at different concentrations (6 replicates for each condition) for 24 h, and the medium was replaced with L-DMEM supplemented with 10% FBS. Cell proliferation was calculated at 1, 4, and 9 days after induction using the MTT assay according to the manufacturer’s protocol; (B) The microfilament changes of cardiomyocyte-like cells induced by 5-Aza were photographed under a microscope. The expression of microfilament was detected by immunofluorescent staining as described under the Experimental. Scale bar, 20 μm.
2.3. 5-Aza Treatment Induced Cardiomyocyte-Like Cells Differentiation of hMSCs in Vitro
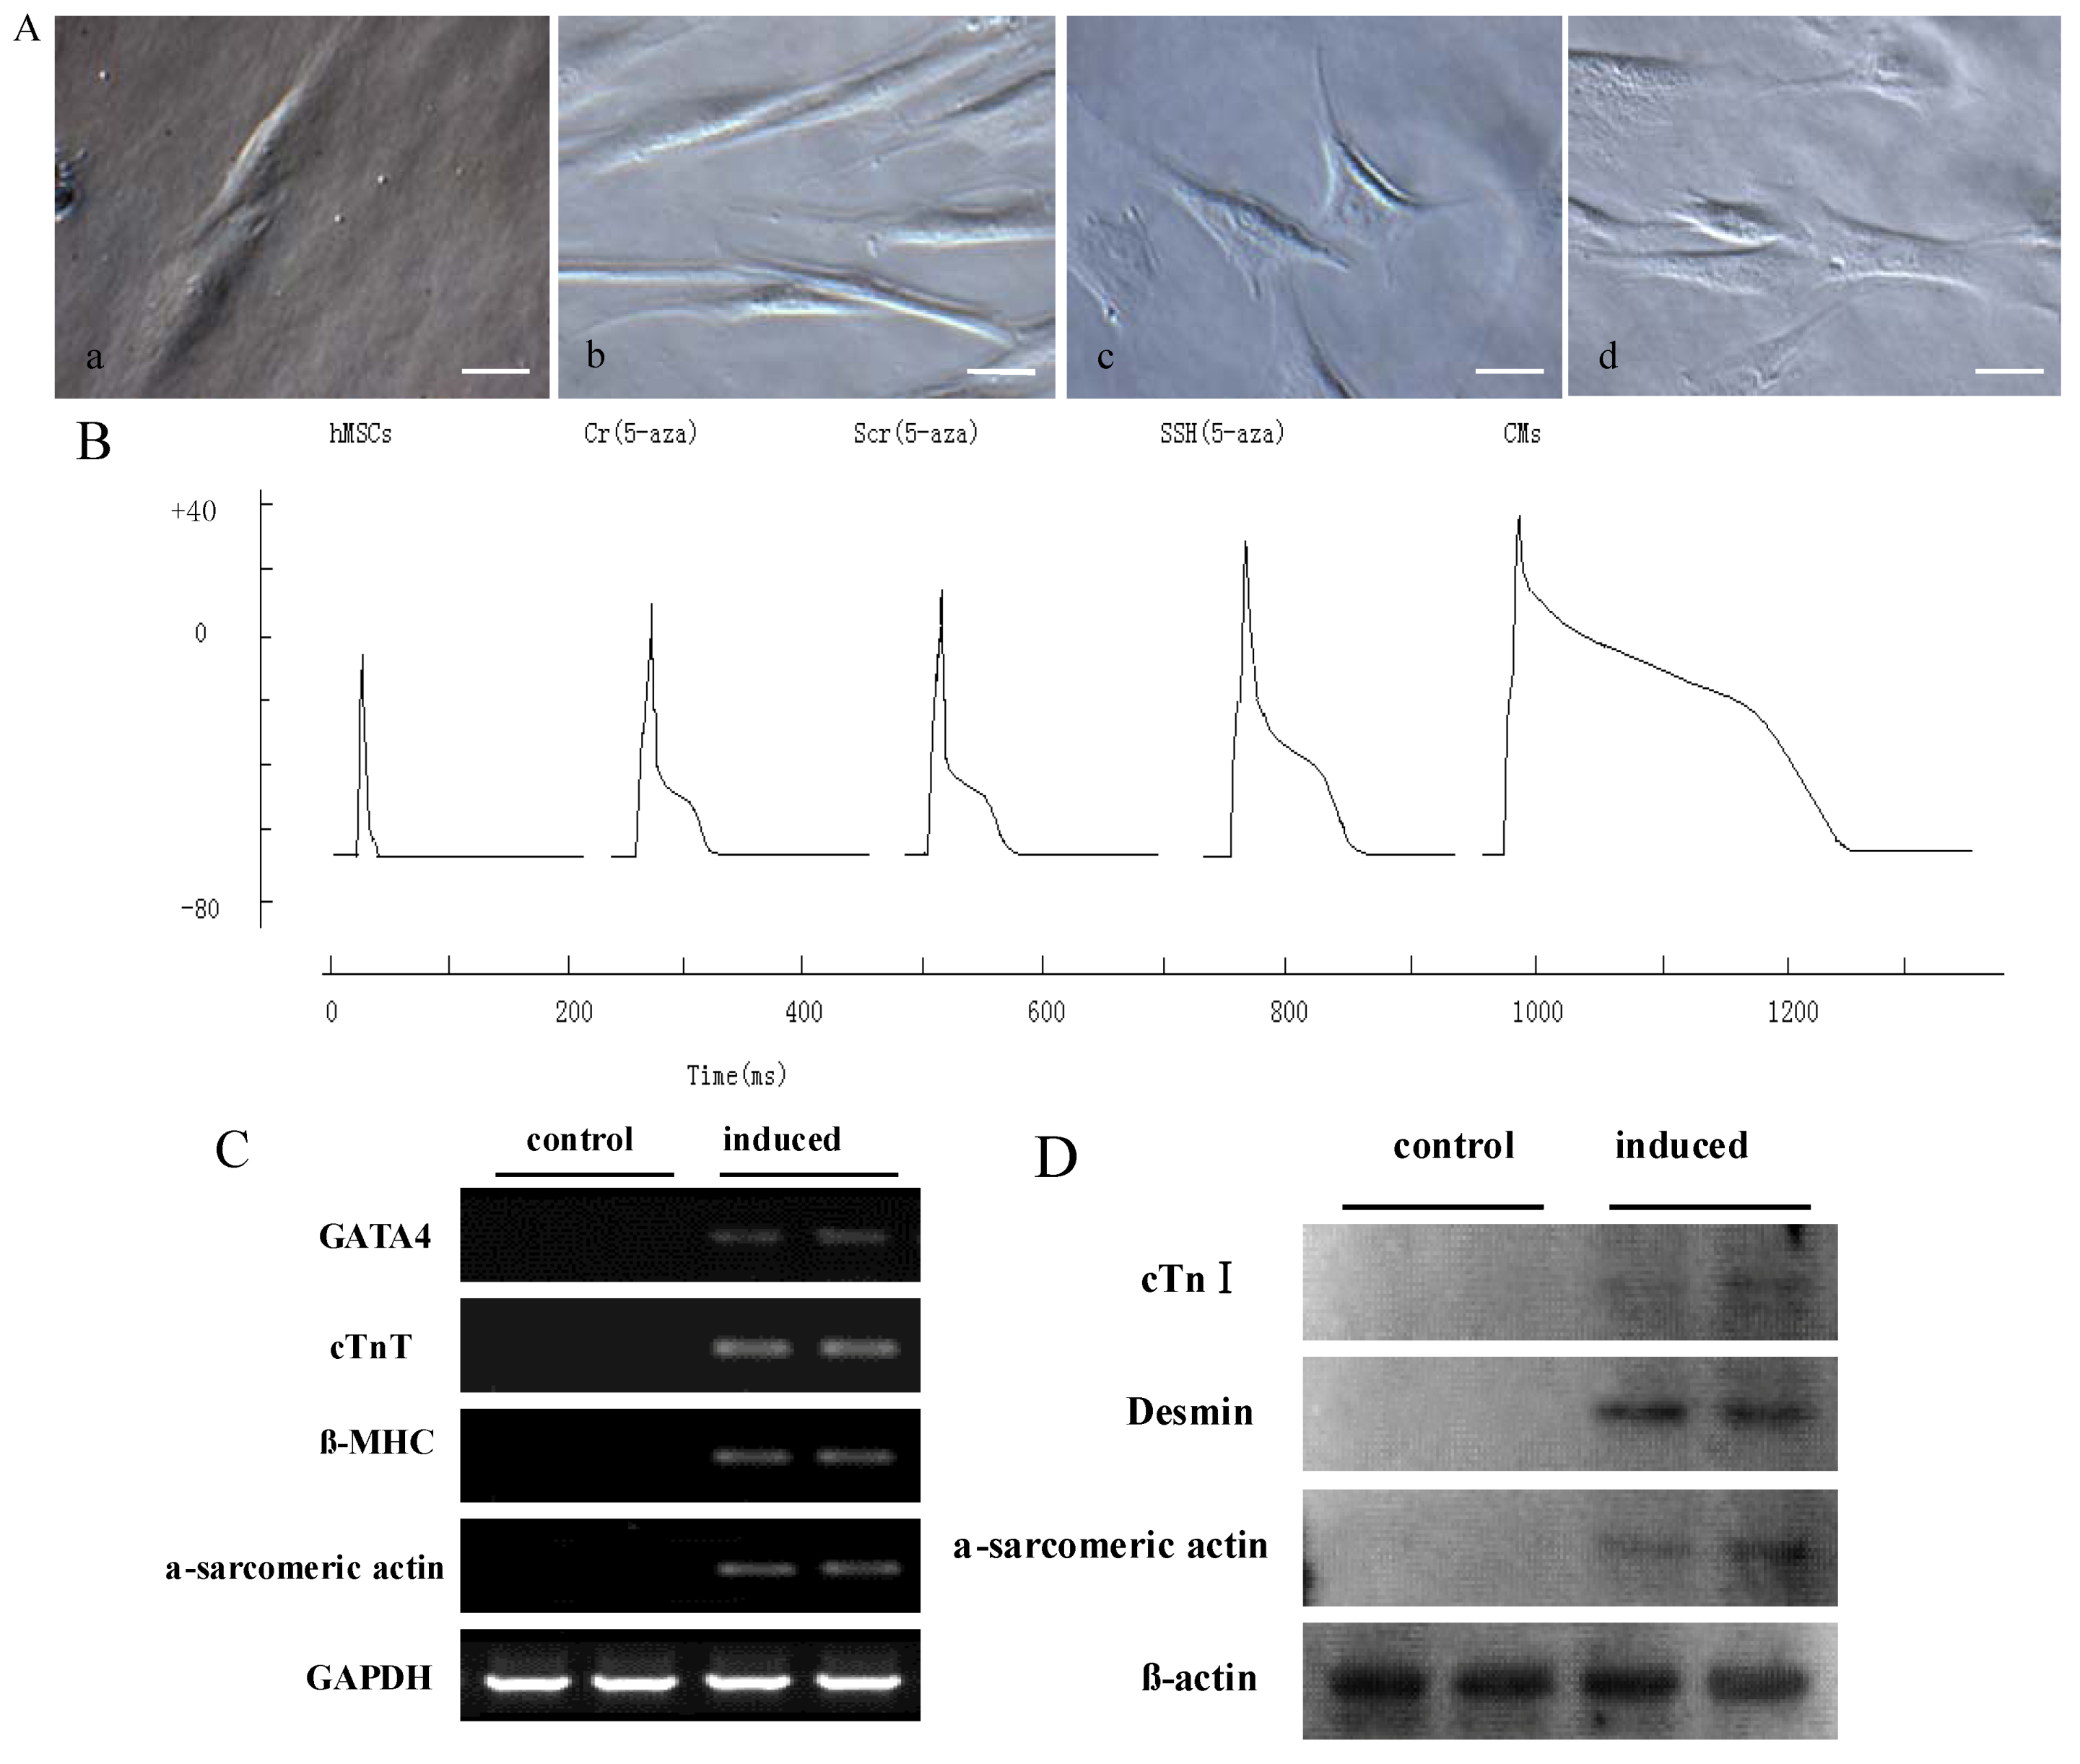
We carried out a series of detections to confirm the effect of 5-Aza on the cardiomyocyte-like cells differentiation of hMSCs. The hMSCs at the fourth passage were treated with 10 μM 5-Aza for 4 weeks to induce cardiomyocyte-like cells differentiation. After 5-Aza treatment, compared with the untreated group (
Figure 5A-a), the morphology of cardiomyocyte-like cells gradually increased in size and lengthened in one direction after 1 week of induction (
Figure 5A-b) and assumed a multiple branch morphology after 2–3 weeks (
Figure 5A-c). The cells also connected with neighboring cells forming myotube-like structures after 3–4 weeks of induction (
Figure 5A-d). After forming the whole cell configuration, the action potentials were elicited by intracellular injection of depolarizing current pulses (1 nA with 2 ms duration) at a frequency of 1 Hz.
Figure 5.
The effect of 5-Aza on cardiomyocyte-like cells differentiation of hMSCs in vitro. (A) The morphological changes of cardiomyocyte-like cells differentiation were photographed under a microscope. Scale bar, 20 μm; (B) Currents recorded in a patch clamped cell. As shown in Figure, compared with the hMSCs group, Cr and Scr group fired apparent action potentials. There were no significant differences on action potential between Cr and Scr groups. Compared with Cr and Scr group, SSH1L prolonged APD and elevated population spike. The voltage steps of SSH group applied in 100 mV increments from −70 mV to +30 mV from a holding potential of −70 mV. But contrast to CMs, SSH group cells have weaker action potential; RT-PCR (C) and Western blot (D) analysis for the expression of CM-specific genes and proteins, which were increased after 5-Aza treatment.
The patch clamp studies were used to confirm that hMSCs induced by 5-Aza could fire action potentials. The hMSCs and rat myocardial cell were used as experimental controls. These electrophysiologic changes suggest that 5-Aza plays an important role in hMSCs differentiation into cardiomyocyte-like cells (
Figure 5B). RT-PCR analysis for the expression of CM-specific genes showed that the induced cells expressed GATA4, cTnT, β-MHC, and α-sarcomeric actin; in addition, these CM-specific genes were not expressed in undifferentiated hMSCs (
Figure 5C). Western blot and Immunocytochemical staining analysis both revealed that induced cells were strongly positive for CM-specific proteins such as cTnI, desmin, and α-sarcomeric actin; whereas non-induced cells were negative for them (
Figure 5D,
Figure 6). These results indicate that 5-Aza was successful in inducing the cardiomyocyte-like cells differentiation of hMSCs.
2.4. Effect of SSH1L on Cardiomyocyte-Like Cells Differentiation of hMSCs
Our previous results suggested that the potential mechanism for estrogen to induce preferential osteoblastic
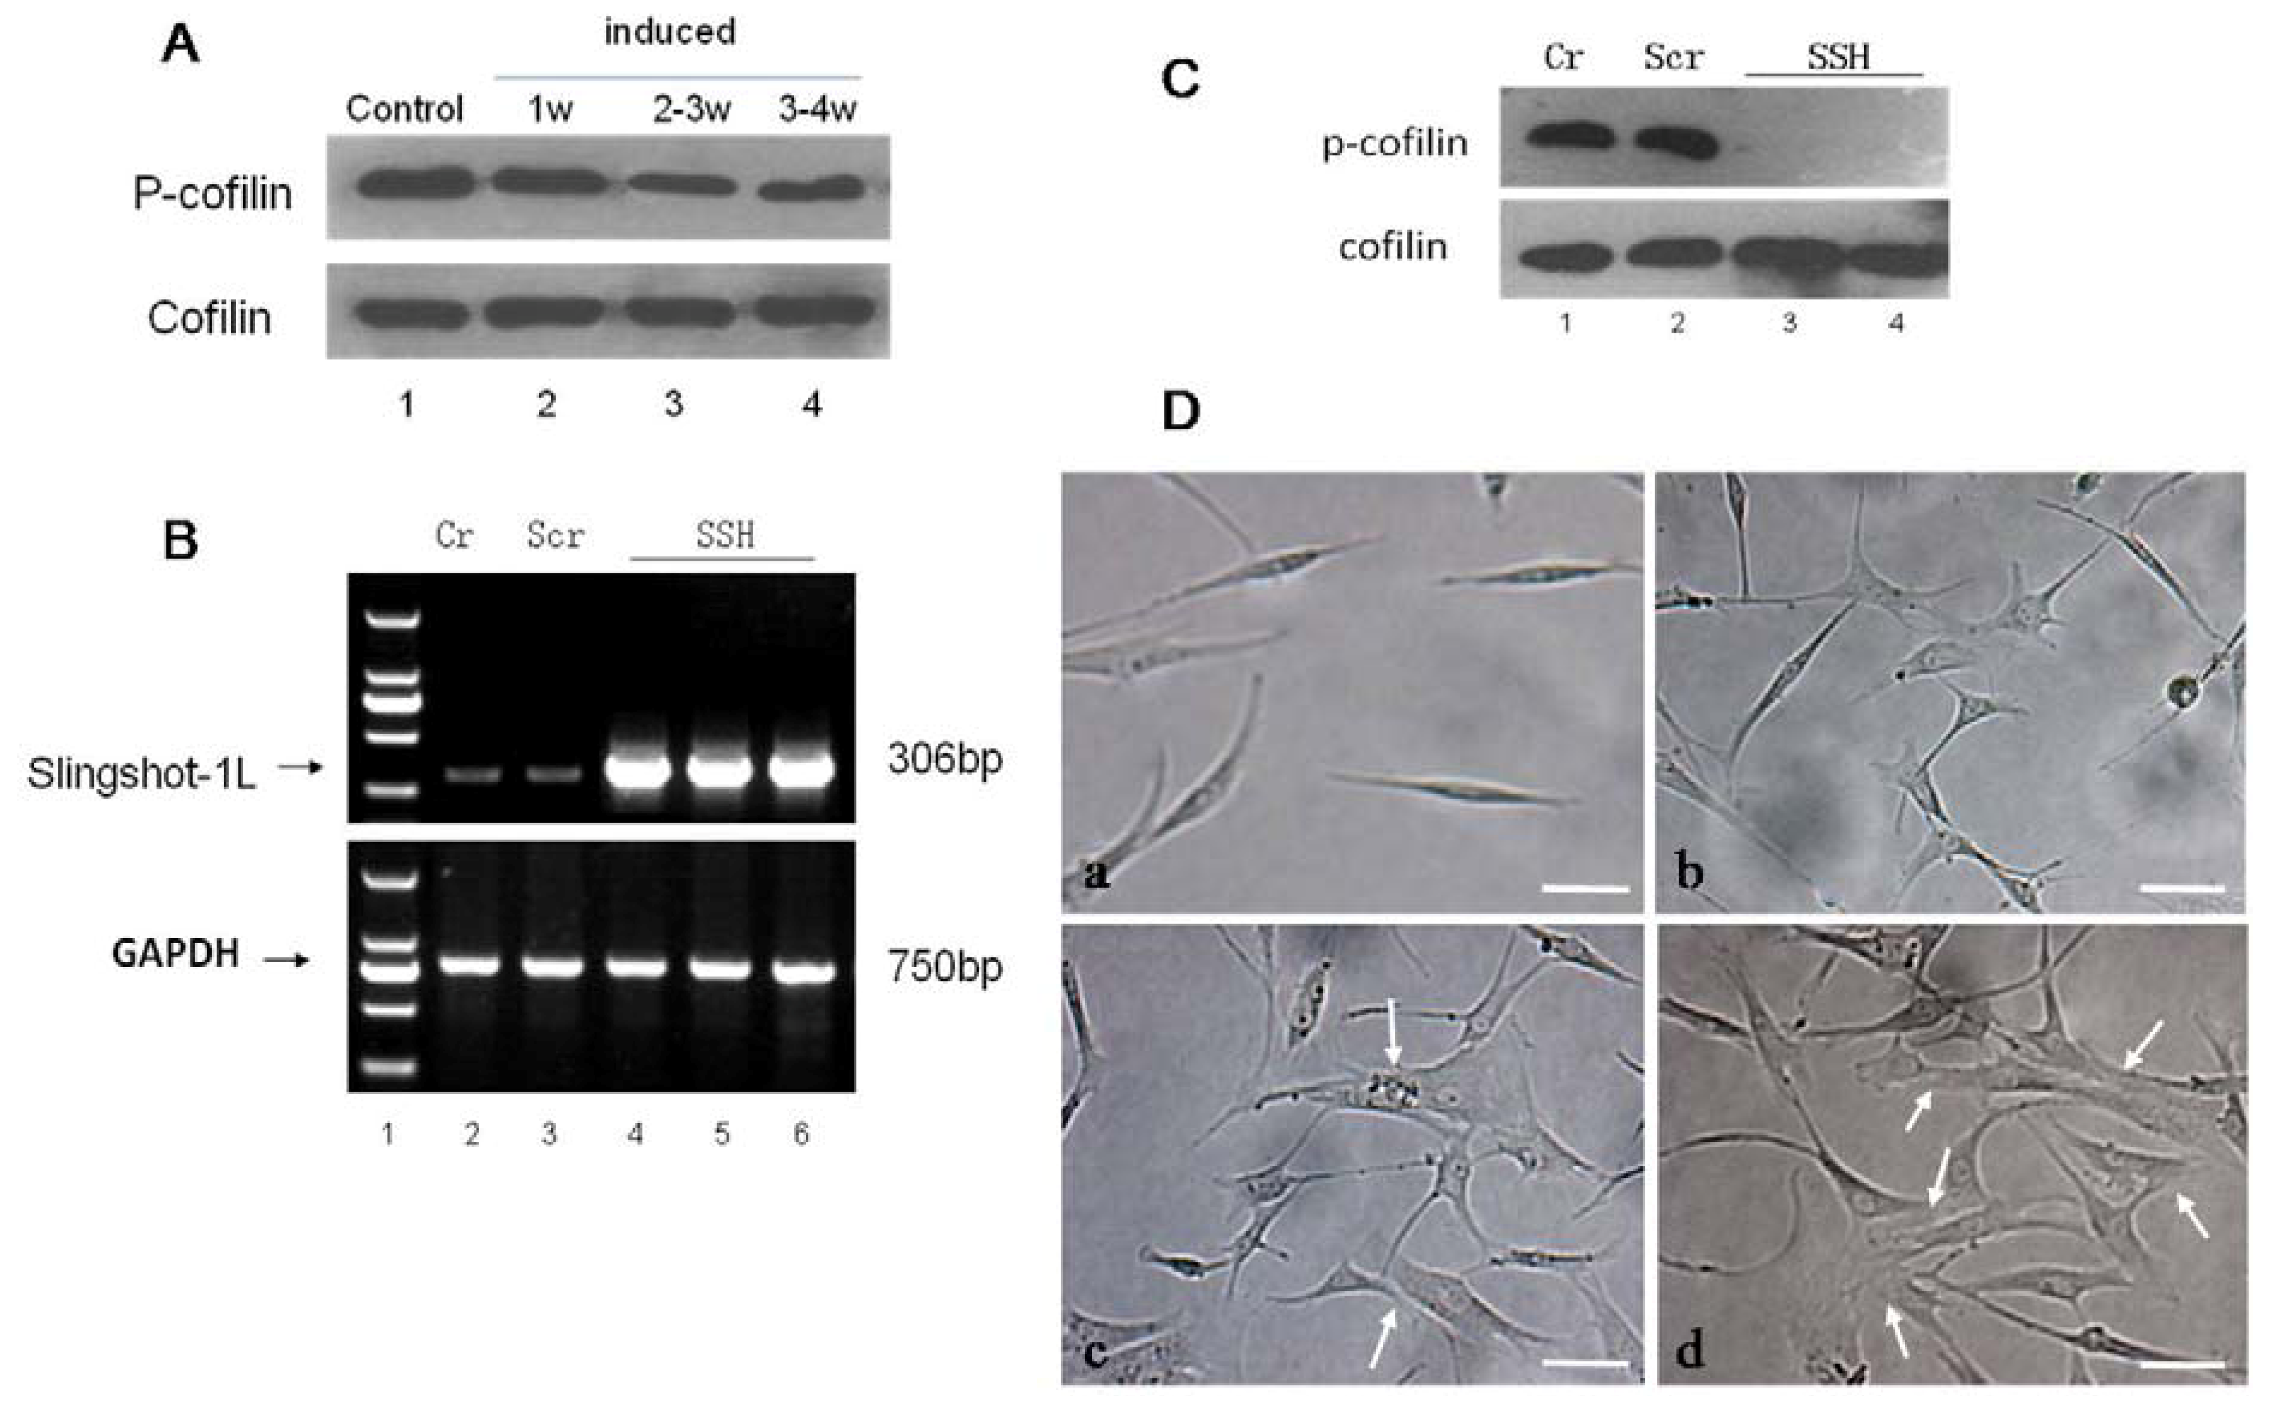
versus adipocytic differentiation was through the ER-PI3K/AKT-SSH1L axis. We decided to research the effect of SSH1L on 5-Aza induced cardiomyocyte-like cells differentiation of hMSCs. Compared to control group, the protein expression level of endogenous phospho-cofilin decreased apparently in hMSCs induced by 5-Aza, especially 2–3 week group (
Figure 7A). We successfully constructed the retroviral vector pLNCX-SSH1L which was transfected into hMSCs to overexpress SSH1L. An empty pLNCX retroviral vector transfected group (Scr) and an untransfected group (Cr) were used as experimental controls (
Figure 7B). As shown in
Figure 7C, SSH1L can suppress the protein expression level of phospho-cofilin, which indicated that SSH1L was activated during the differentiation process. The morphology of cardiomyocyte-like cells that were induced by 5-Aza was observed (
Figure 7D). When compared with the Cr group and the Scr group (
Figure 7D-a), the SSH group of transfected hMSCs showed multiple branches already after one week (
Figure 7D-b) and connecting with adjoining cells and forming myotube-like structures after 2–3 weeks (
Figure 7D-c).The myotube-like structures further increased after 3–4 weeks of culture (
Figure 7D-d). The image of
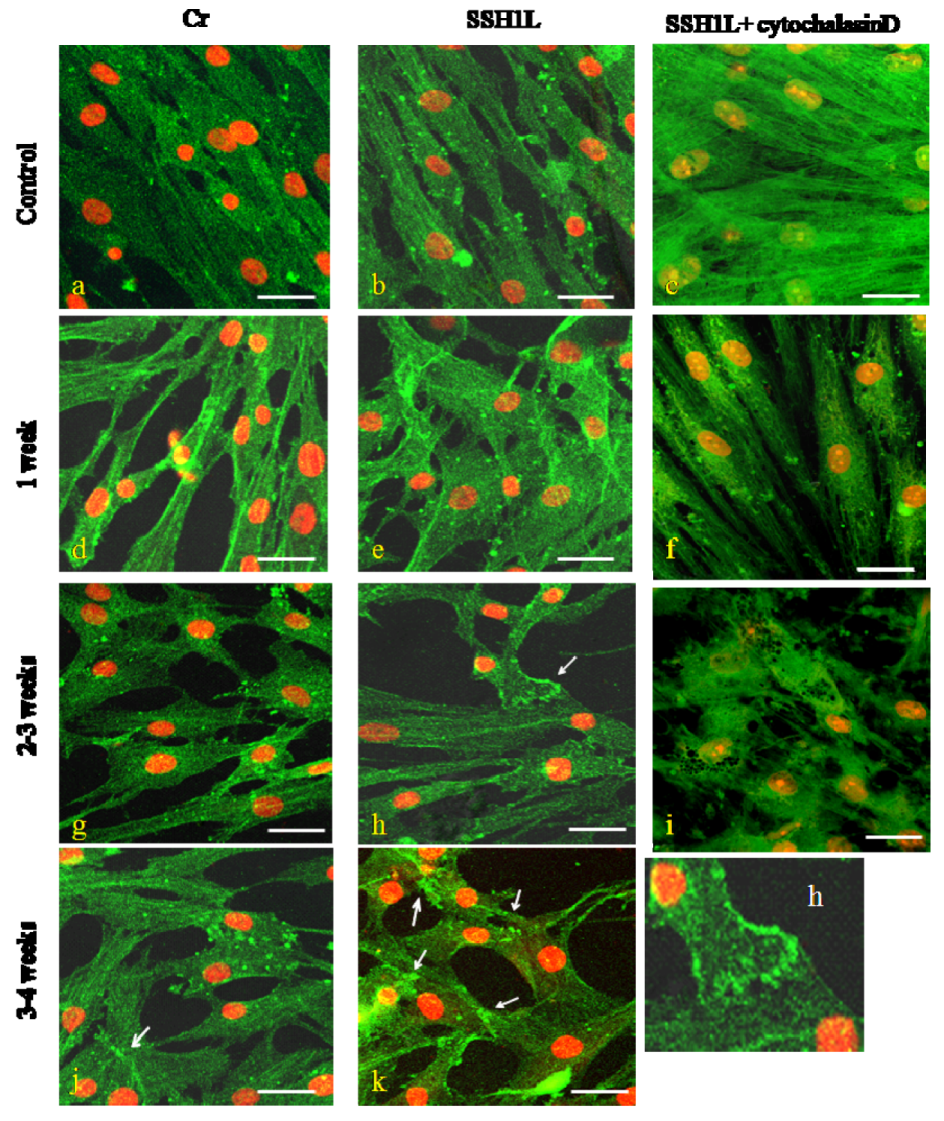
Figure 5B suggested that the action potential of SSH group was stronger than Scr and Cr group. These results indicated that the transfected hMSCs overexpressing SSH1L are more effective in differentiating into cardiomyocyte-like cells than the two control groups. In addition, we detected microfilament changes during hMSCs differentiation into cardiomyocyte-like cells induced by 5-Aza. Without induction, the hMSCs microfilaments of the Cr and SSH groups were all long straight fiber bundles along the cell’s major axis with regular arrangement (
Figure 8a,b). After induction with 5-Aza for 1week, the Cr group hMSCs microfilaments were basically along the cell’s major axis but with an irregular arrangement, while the SSH group hMSCs microfilaments spread to all directions and interweaved into the reticular structure (
Figure 8d,e). After induction for 2–3 weeks, the Cr group hMSCs microfilaments spread into all directions, while the SSH group hMSCs microfilaments joined one another and the actin gathered together forming intercalated disk-like structures (
Figure 8g,h). After induction for 3–4 weeks, the Cr group hMSCs microfilaments joined one another forming myotube-like structures, while the SSH group hMSCs actin gathered together in microfilament junctions and formed intercalated disk-like or myotube-like structures (
Figure 8j,k).
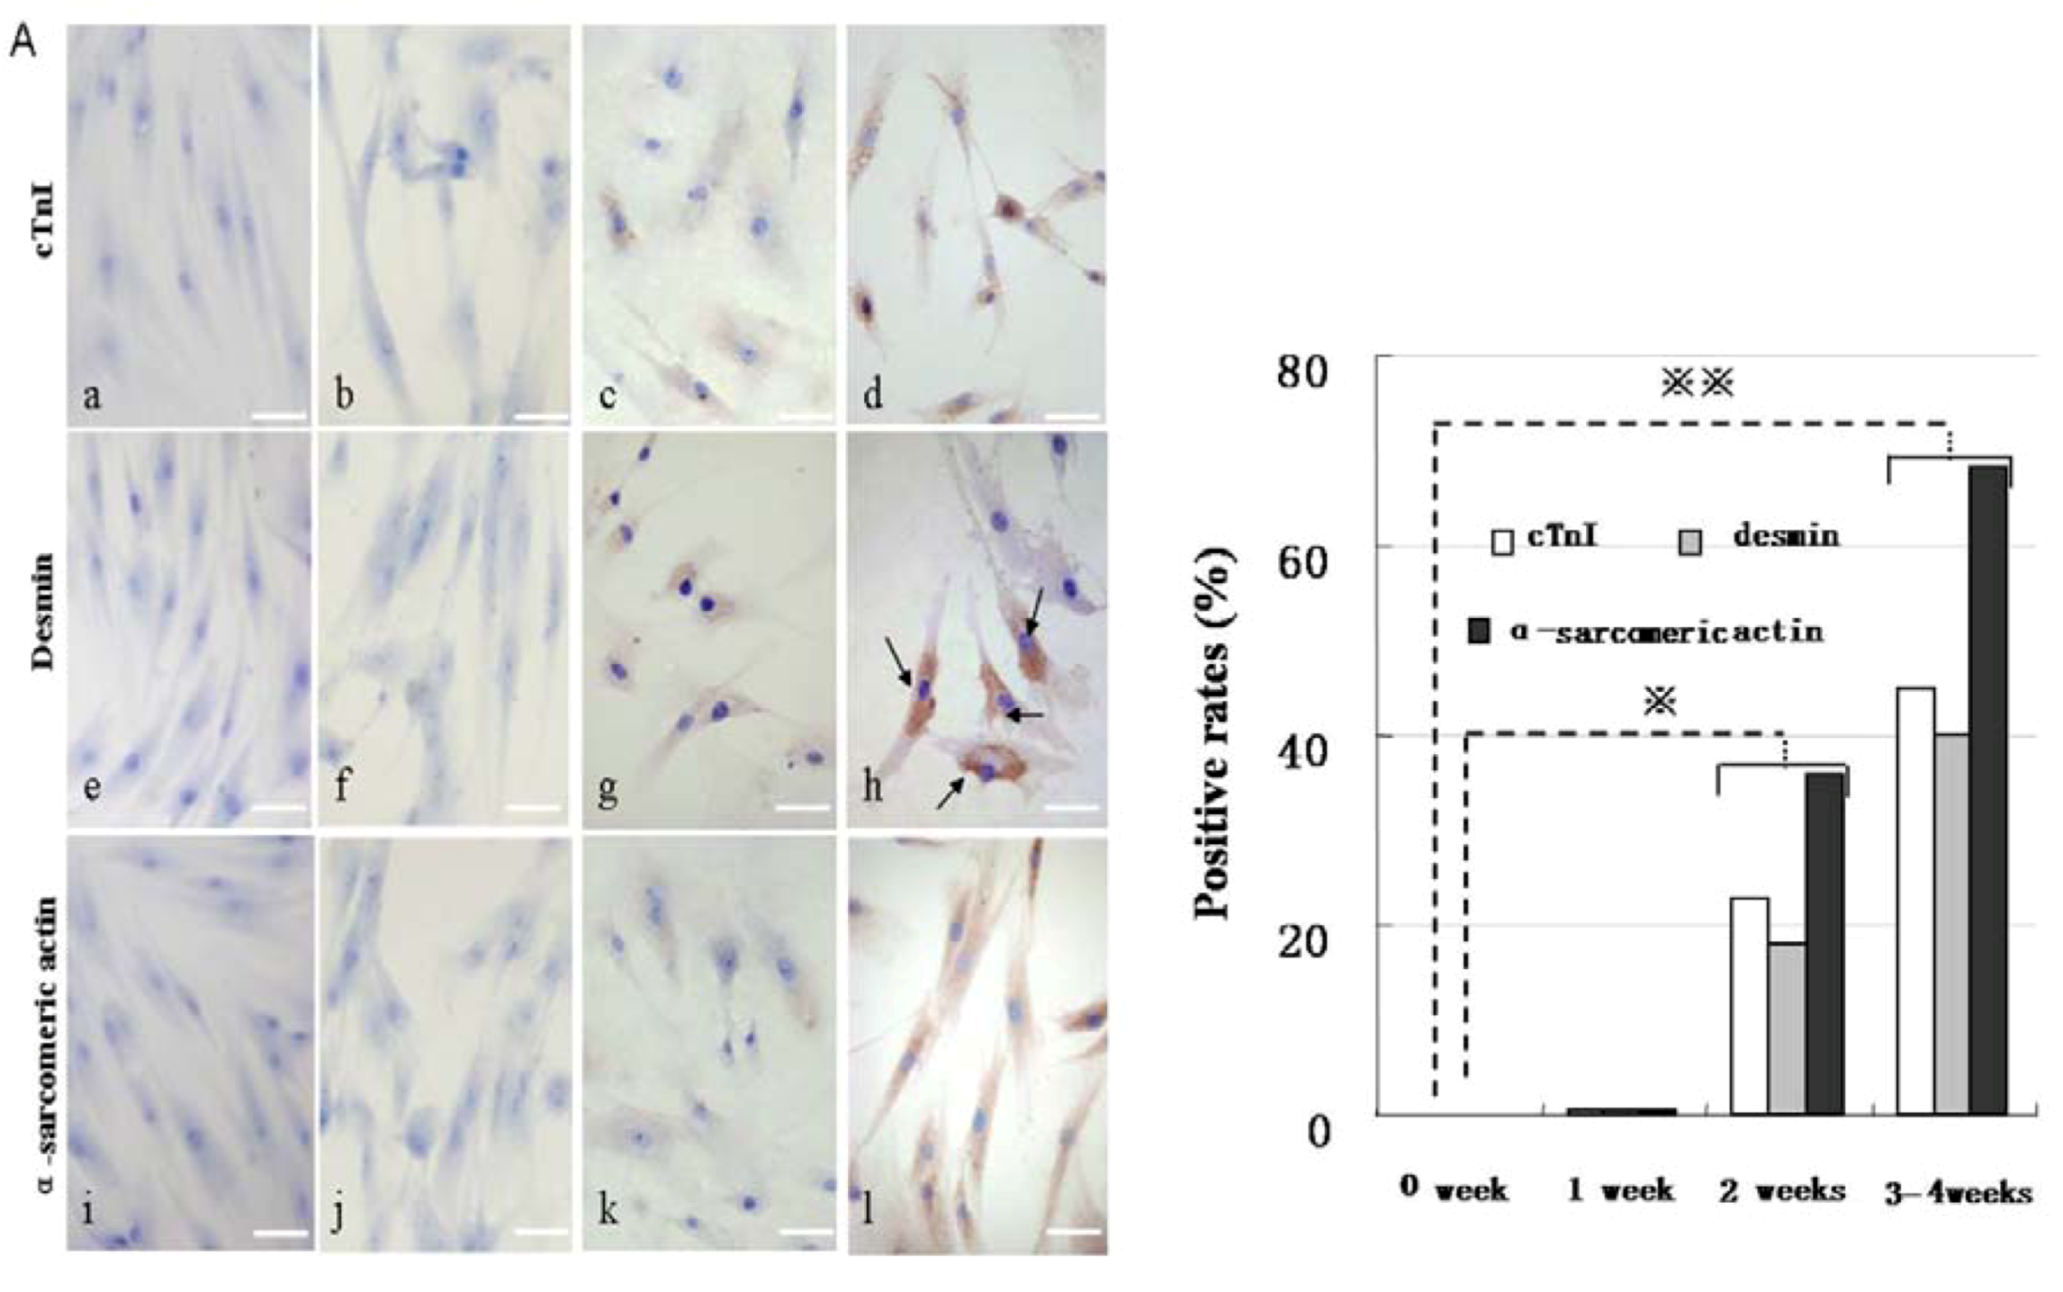
Figure 6.
Immunocytochemical staining analysis of cardiac-specific protein expression after 5-Aza treatment. (A) Immunocytochemical staining of CM-specific proteins such as cTnI (upper panels), desmin(middle panels), and α-sarcomericactin(lower panels) by inverted microscopy. The positive rates were shown in (B). a, e, and i were controls; b, f, and j were treated with 5-Aza for 1 week; c, g, and k for 2 weeks; d, h, and l for 3–4 weeks. Scale bar, 50 µm.
Figure 7.
The effect of SSH1L on the morphology of cardiomyocyte-like cells differentiation of hMSCs. (A) We induced cardiomyocyte-like cells differentiation of hMSCs after the optimal concentration of 5-Aza treatment for 1 week, 2–3 week, 3–4 week, and then tested that the expression of endogenous protein phosphor-cofilin decreased with the induction time increasing; (B) The hMSCs were transfected with the retroviral vector pLNCX-SSH1L to overexpress SSH, and the empty vector transfected group (Scr) and an untransfected group (Cr) were compared as controls. In addition, the expression of SSH1L was observed; (C) Compared to Cr and Scr, the endogenous protein expression of phosphor-cofilin decreased apparently in the SSH group of transfectedhMSCs (SSH1L), and there are no difference between Cr and Scr; (D) The effect of SSH1L on the morphological changes of cardiomyocyte-like cells induced by 5-Aza were photographed under a microscope . Arrows indicate the myotube-like structures. Scale bar, 20 μm.
![Molecules 17 14975 g007]()
The SSH group hMSCs preincubated with cytochalasin D showed no F-actin bundles, only F-actin clumps were visible (1, 2 weeks); cell retraction shorter, growth condition poor, almost no proliferation and cell death constant (2 weeks) (
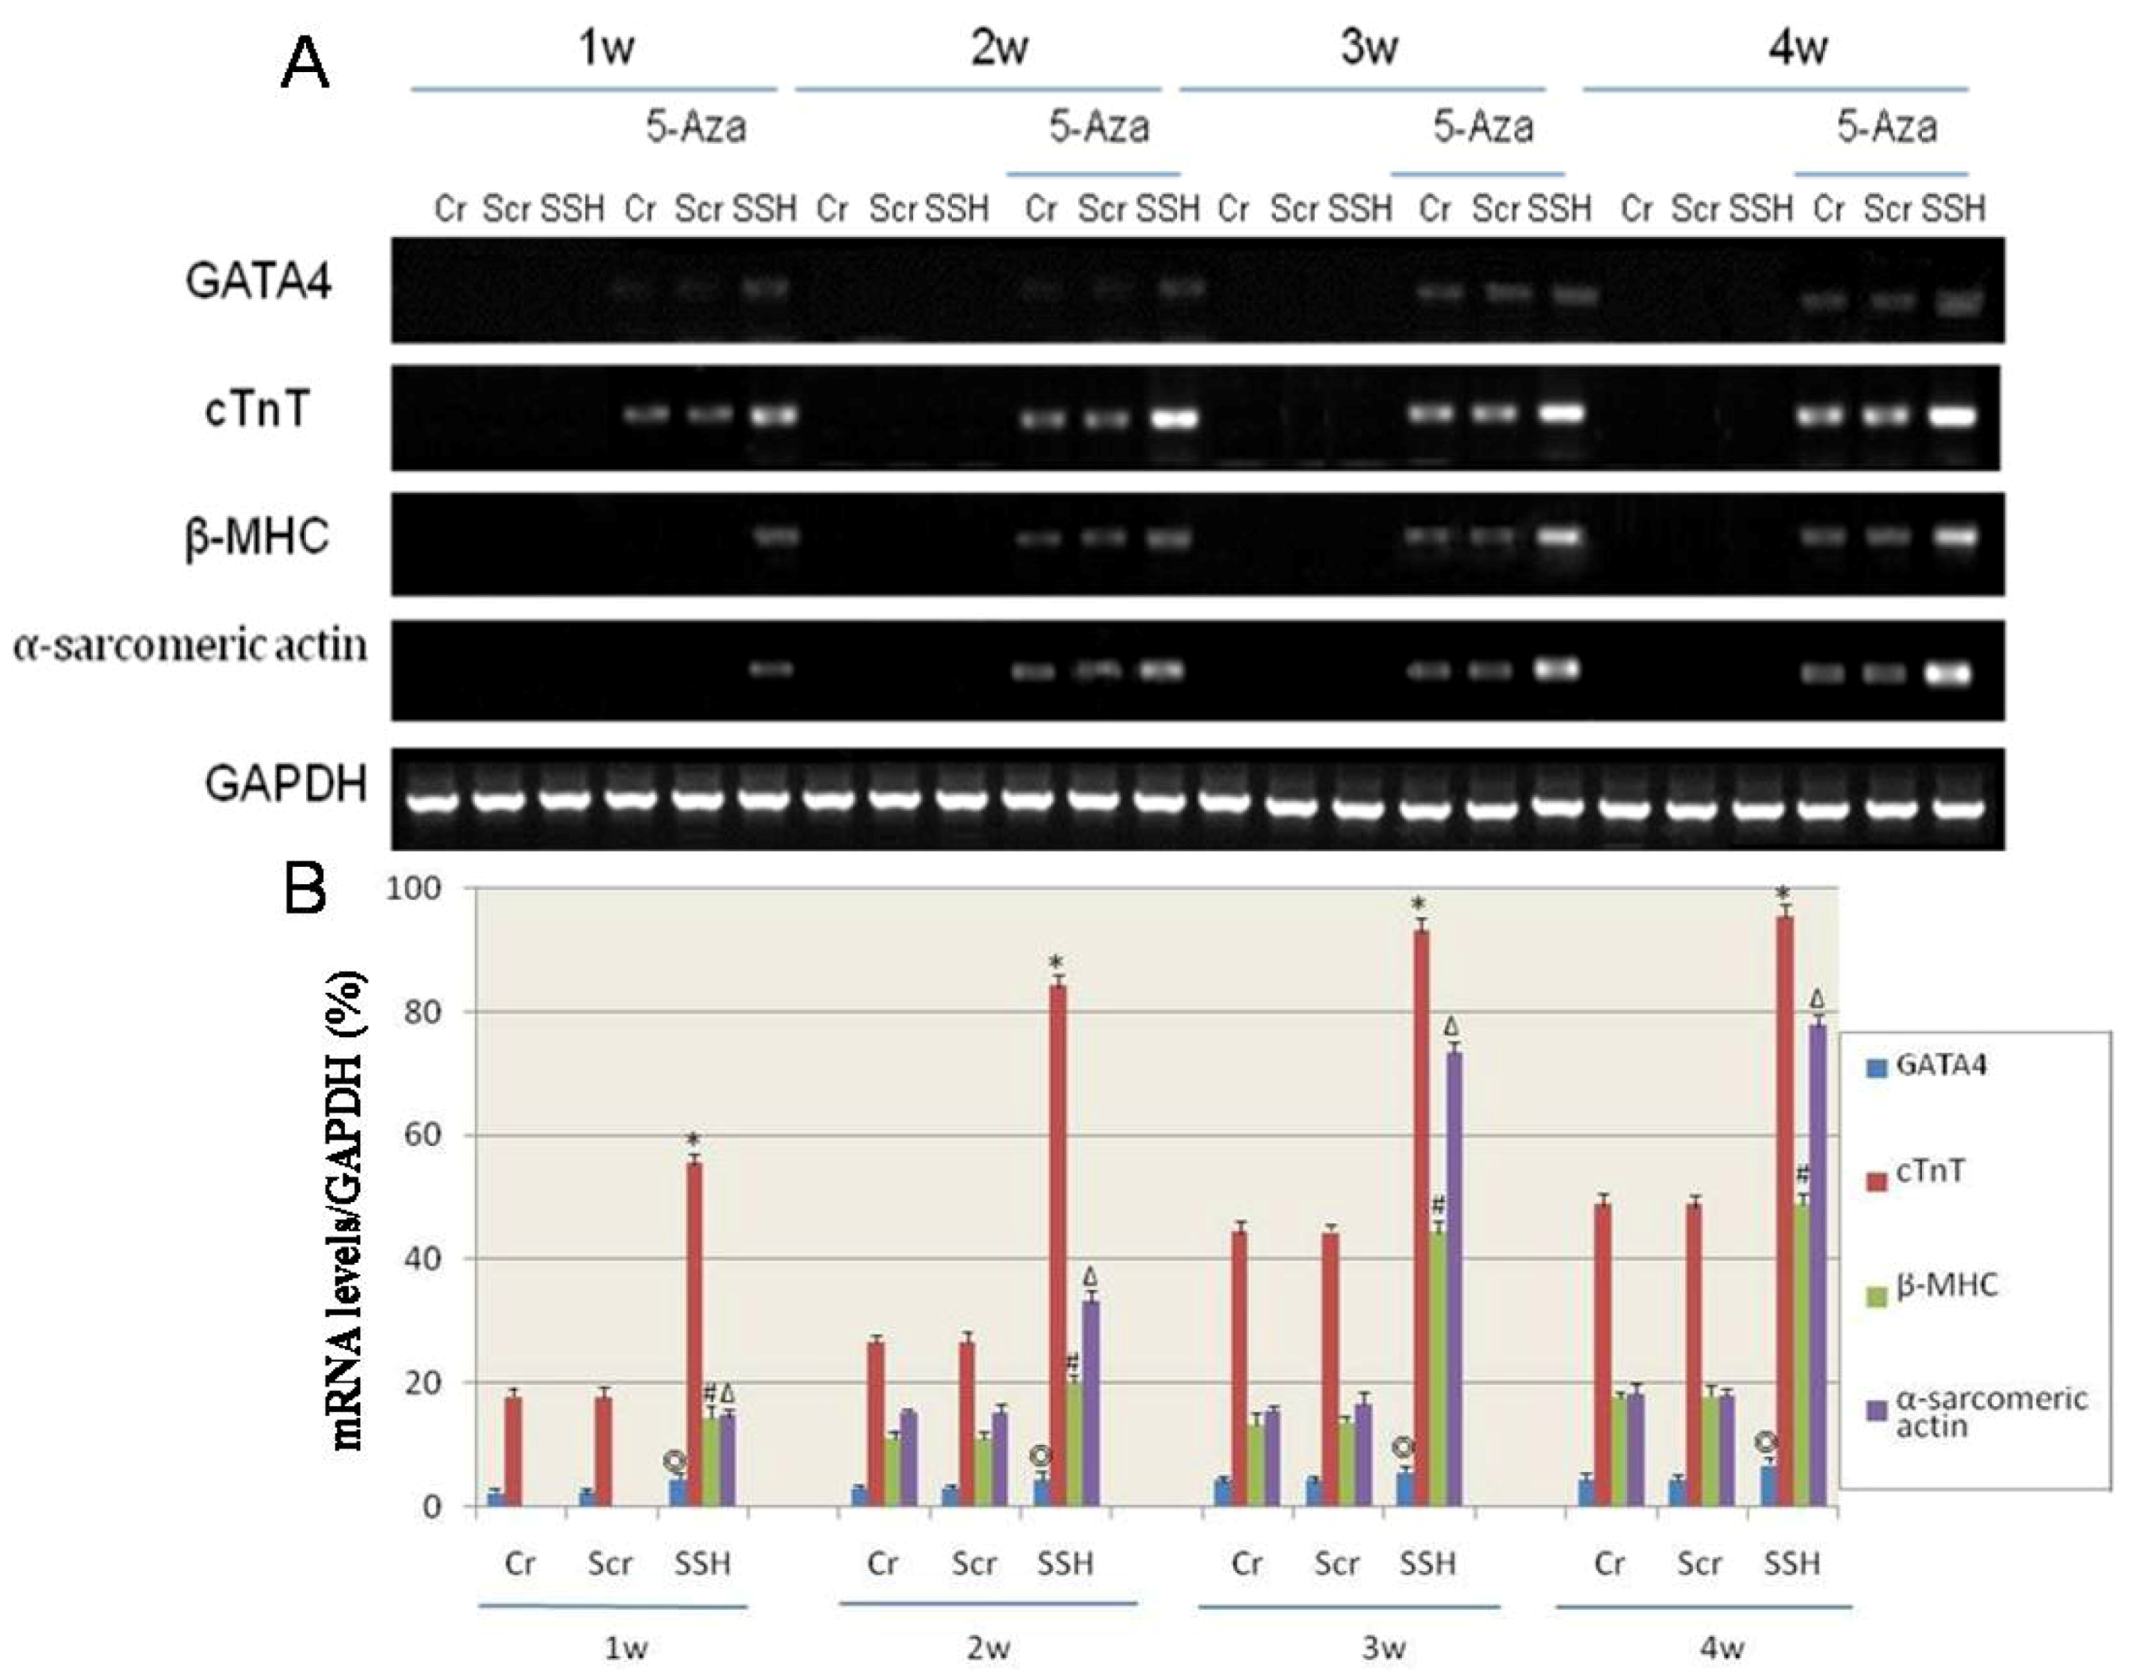
Figure 8c,f,i). RT-PCR analysis of mRNA expression for cardiac-specific genes in hMSCs showed that the genes were not detected in the Cr, Scr, and SSH groups of hMSCs without being induced by 5-Aza. After being induced by 5-Aza for 1 week, hMSCs expressed GATA4 and cTnT, which are early phase makers of the cardiomyogenic lineage. The SSH group of transfected hMSCs began to express β-MHC and α-sarcomeric actin, which are late markers of cardiac lineage, already after 1 week. After being induced by 5-Aza for 2 weeks, the Cr and Scr group of hMSCs also express β-MHC and α-sarcomeric actin. The mRNA expression level for cardiac-specific genes increased along the time of induction, with the cardiac-specific gene expression levels being much higher in the SSH group of hMSCs than in the other two control groups (
Figure 9).
Figure 8.
The effect of SSH1L on the changes of microfilament of cardiomyocyte-like cells differentiation induced by 5Aza. The microfilament changes of cardiomyocyte-like cells induced by 5-Aza were photographed under a microscope (bar, 20 μm). In control groups (left panels) the actin microfilaments joined one another forming myotube-like structures; and in SSH group (middle panels) showed actin microfilament junctions forming intercalated disk-like structures; but in cytochalasin D group (right panels) showed no F-actin bundles, only F-actin clumps were visible and cell death constant. microscopy. (h): Arrow indicate the intercalated disk-like structures; (j): Arrow indicate the myotube-like structures; (k): Arrow indicate the myotube-like structures or intercalated disk-like structures. The changes of microfilament were detected by immunofluorescent staining as described under the Experimental. Scale bar, 50 µm.
Figure 9.
The effect of SSH1L on the expression of cardiac-specific genes of cardiomyocyte-like cells differentiation induced by 5-Aza. Cardiac-specific genes were detected by RT-PCR (A). (B): The qualified data image of cardiac-specific genes expression (p < 0.05 GATA4:◎; cTnT:*; β-MHC:#; α-sarcomericactin:∆). The cardiac-specific genes increased along with the increased induction time, and the expression level was much higher in the SSH group than in the other two control groups.
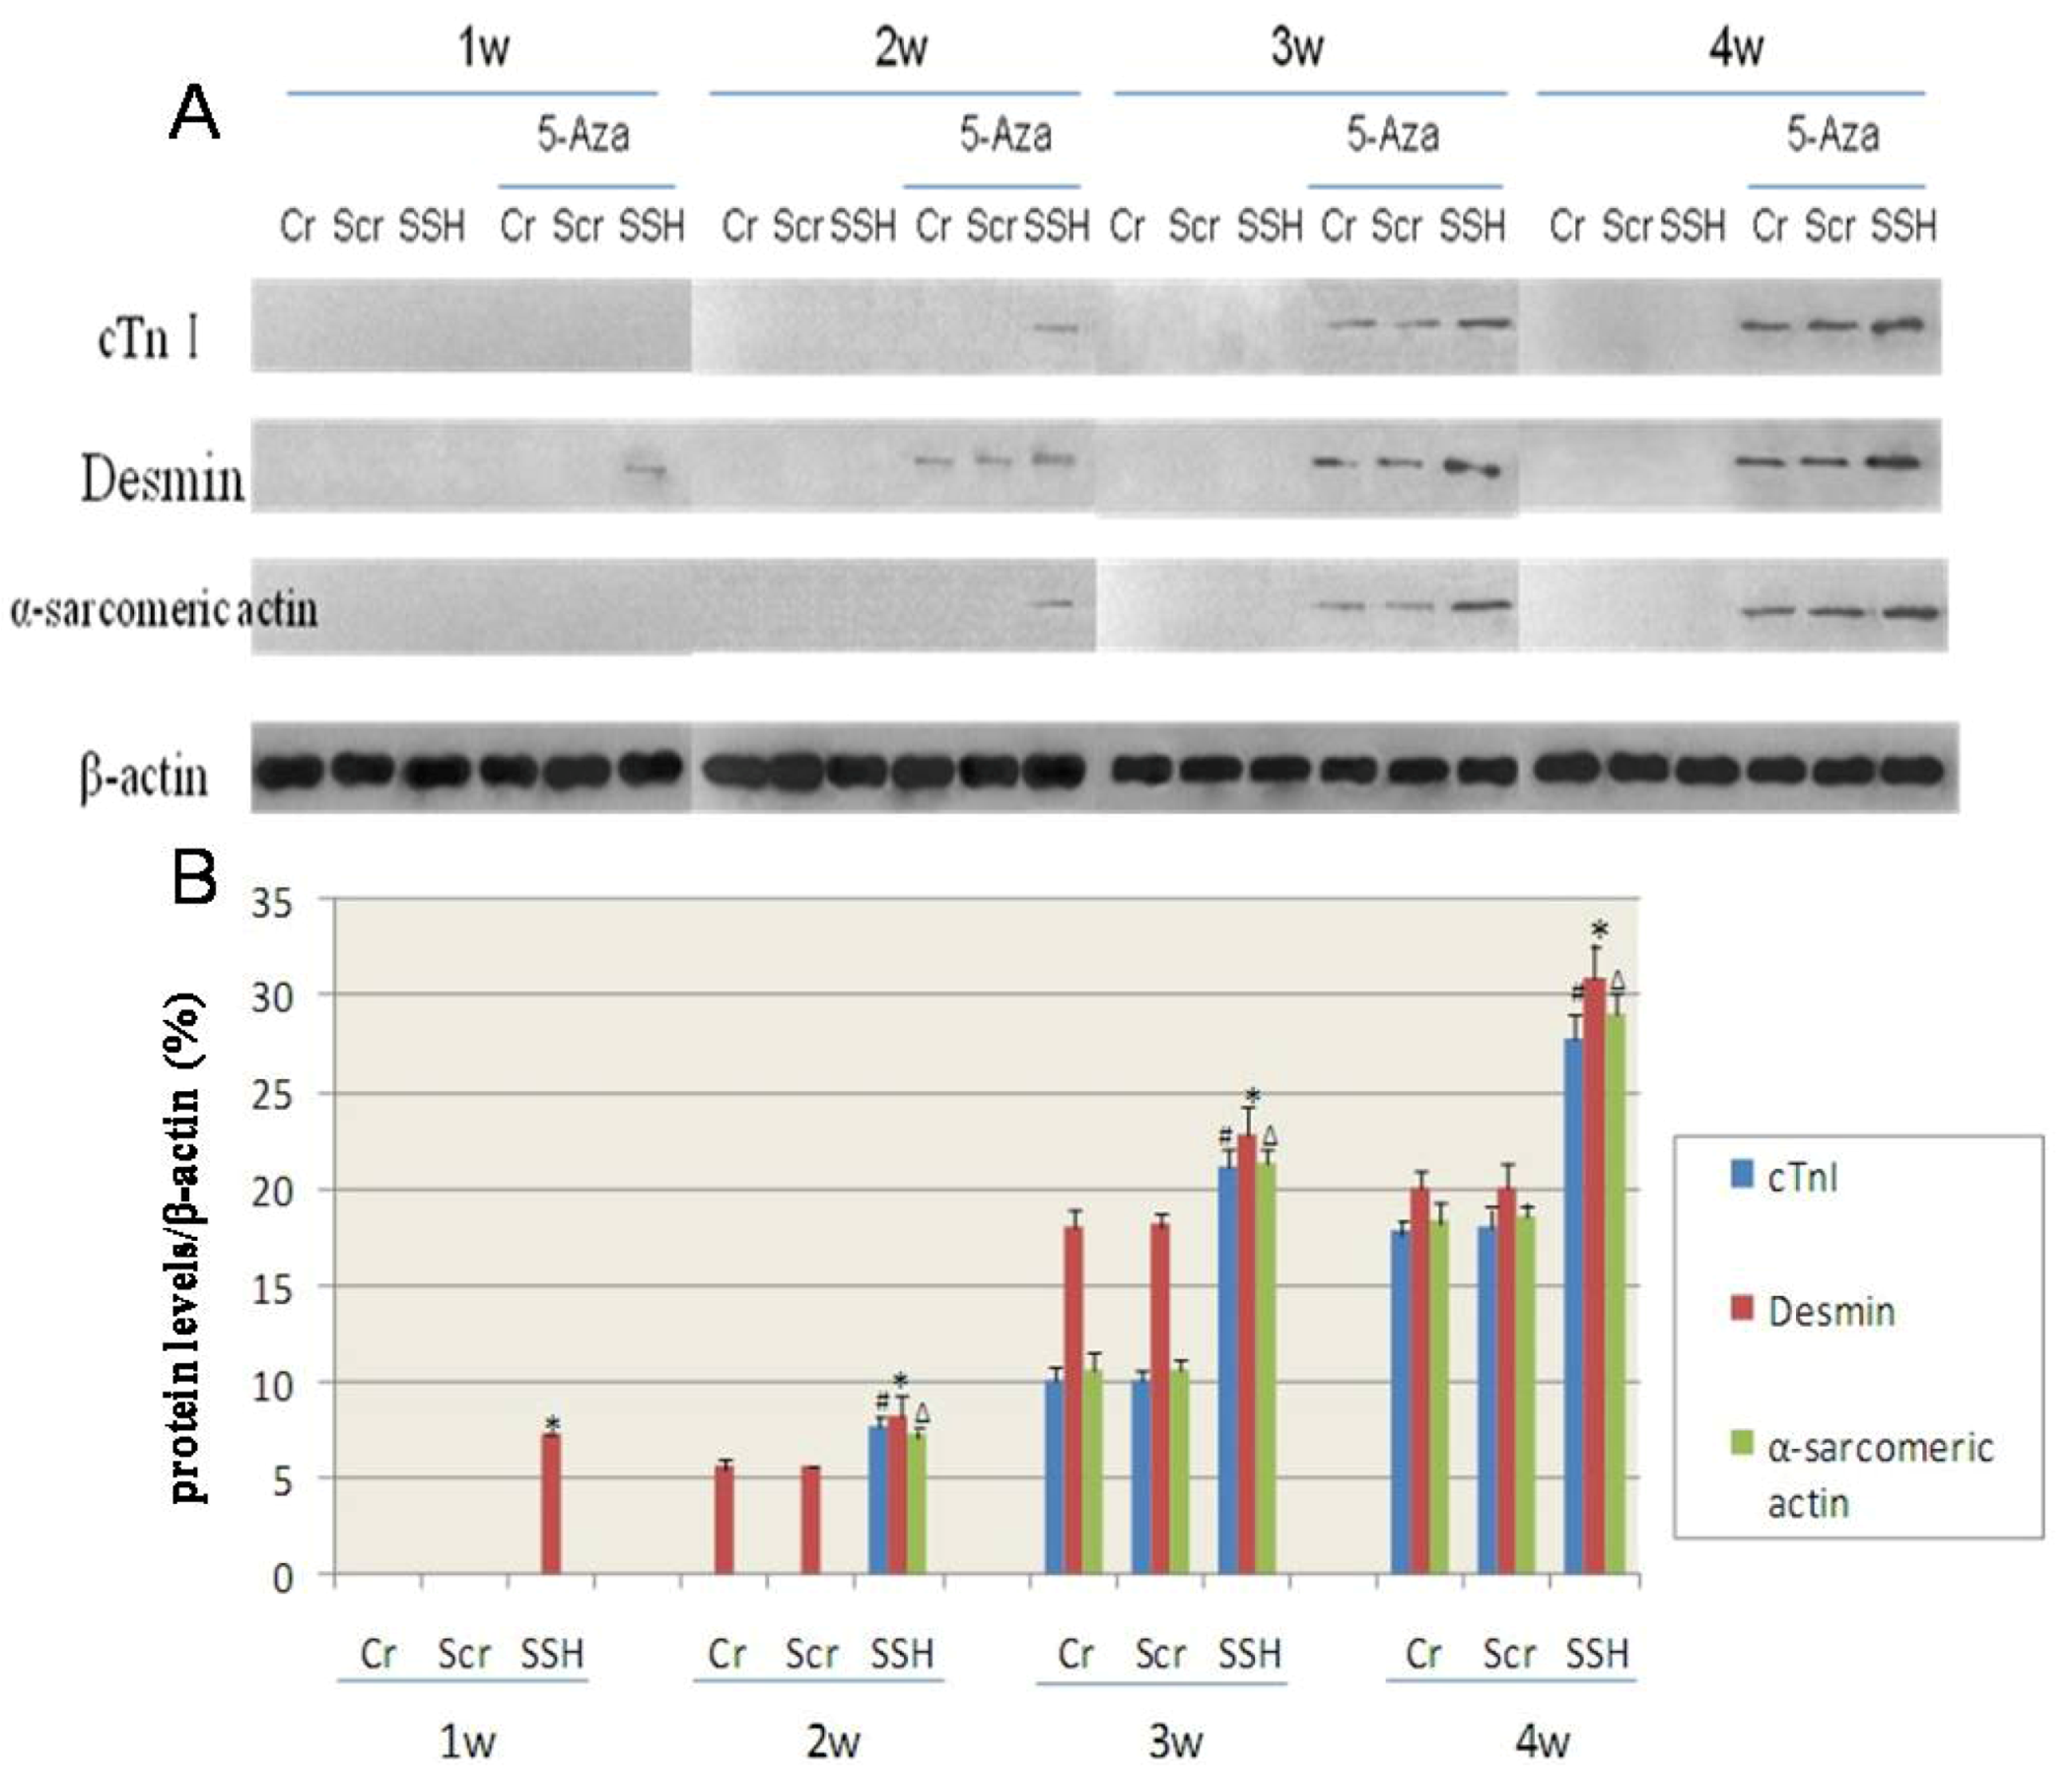
Western blot analysis showed that the expression of cardiac-specific proteins were not detected in the Cr, Scr, and SSH groups of hMSCs without induction by 5-Aza. After being induced with 5-Aza for 1week, the SSH group of hMSCs expressed desmin, which is known to be an early marker of myogenic differentiation. After induction for 2 weeks, both the Cr and Scr groups also showed expression of desmin; and the SSH group showed significant expression of the cardiac-specific proteins cTnI and α-sarcomeric actin. The Cr and Scr groups showed only expression of cTnI and α-sarcomeric actin after being induced for 3 weeks. The cardiac-specific protein expression increased along the period of induction, but the SSH group showed protein expression levels much higher than those of the other two control groups (
Figure 10). Based on these results, we concluded that SSH1L plays an important role in stimulating early hMSCs differentiation into cardiomyocyte-like cells through regulating cytoskeleton rearrangement.
Figure 10.
The effect of SSH1L on the expression of cardiac-specific proteins of cardiomyocyte-like cells differentiation induced by 5-Aza. Cardiac-specific proteins were detected by western-blot (A). (B): The qualified data image of cardiac-specific proteins expression (p < 0.05 cTnI:#; Desmin:*; α-sarcomericactin:∆). The cardiac-specific proteins increased along with the increased induction time, and the expression level was much higher in the SSH group than in the other two control groups.


