2.1. Isolation of Lectins
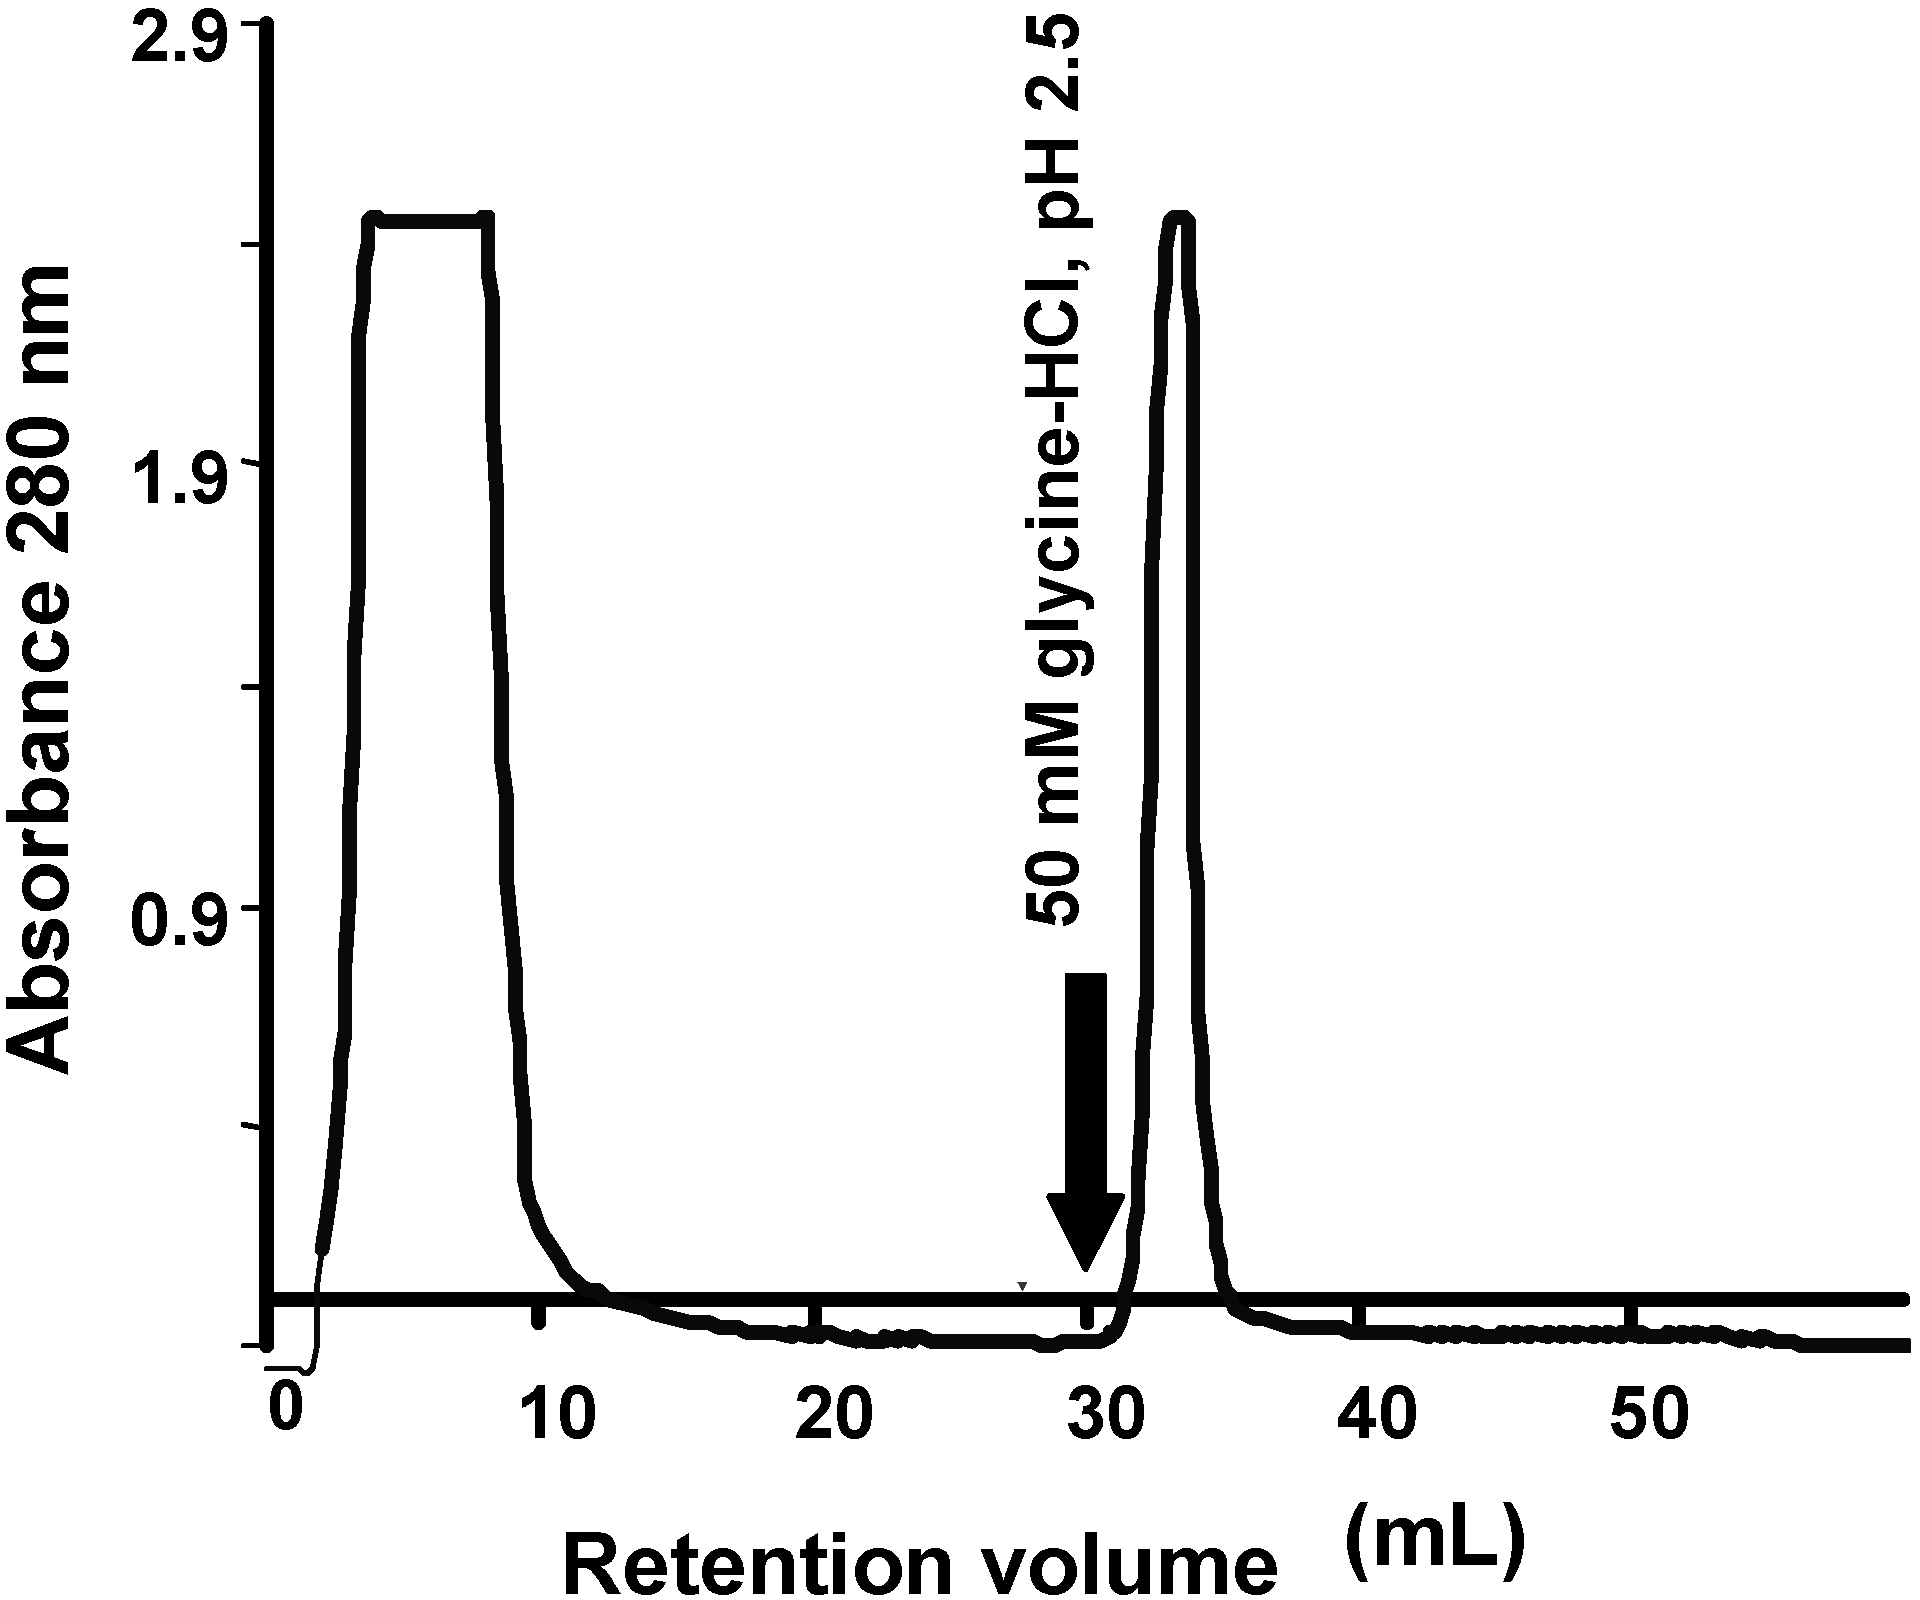
The tepary bean lectin was purified by affinity chromatography after ammonium sulfate precipitation of the aqueous extract from tepary beans (
Figure 1). Tepary bean crude extract had a protein concentration of 30.418 mg/mL, with a titer of 262,144 units and hemagglutination activity of 8,618.05 units/mg per mL protein.
Figure 1.
Affinity chromatography in immobilized fetuin of the aqueous extract from tepary beans after precipitation with ammonium sulfate. The lectin fraction was eluted with an acid solution (50 mM glycine-HCl, pH 2.5). The purification yield is shown in
Table 1.
Figure 1.
Affinity chromatography in immobilized fetuin of the aqueous extract from tepary beans after precipitation with ammonium sulfate. The lectin fraction was eluted with an acid solution (50 mM glycine-HCl, pH 2.5). The purification yield is shown in
Table 1.
The lectin fraction was recovered in one peak when the affinity column was eluted with glycine 50 mM, pH 2.5; this fraction showed a titer of 26,214.4 units, with hemagglutination activity of 226,376.51 units/mg per mL protein, with a 26-fold purification achieved at this point (
Table 1).
Table 1.
Purification table of the lectin from tepary beans (Phaseolus acutifolius).
Table 1.
Purification table of the lectin from tepary beans (Phaseolus acutifolius).
| Fraction | Protein Concentration (mg/mL) | Hemagglutination Titer * | Specific Activity | Purification factor | Lectin (%) |
|---|
| Crude Extract | 30.41 | 262144 | 8618.05 | 1 | |
| Protein bound to fetuin | 1.16 | 262144 | 226376.51 | 26 | 0.586 |
Differences in hemagglutination activity was observed with human erythrocytes from blood type A, B, and O (data not shown), indicating that PAA presents blood group specificity, contrary to what was observed for tepary bean variety escumite, in which there was no blood group specificity [
28].
The unbound fraction was applied to the fetuin affinity column until no binding was observed. Analysis of this unbound fraction showed that it retained high hemagglutination titers (data not shown). This result suggests that there are other fractions with hemagglutination activity that do not demonstrate affinity for fetuin. Therefore, this study was focused on the description of the fraction that showed affinity for fetuin.
Figure 2.
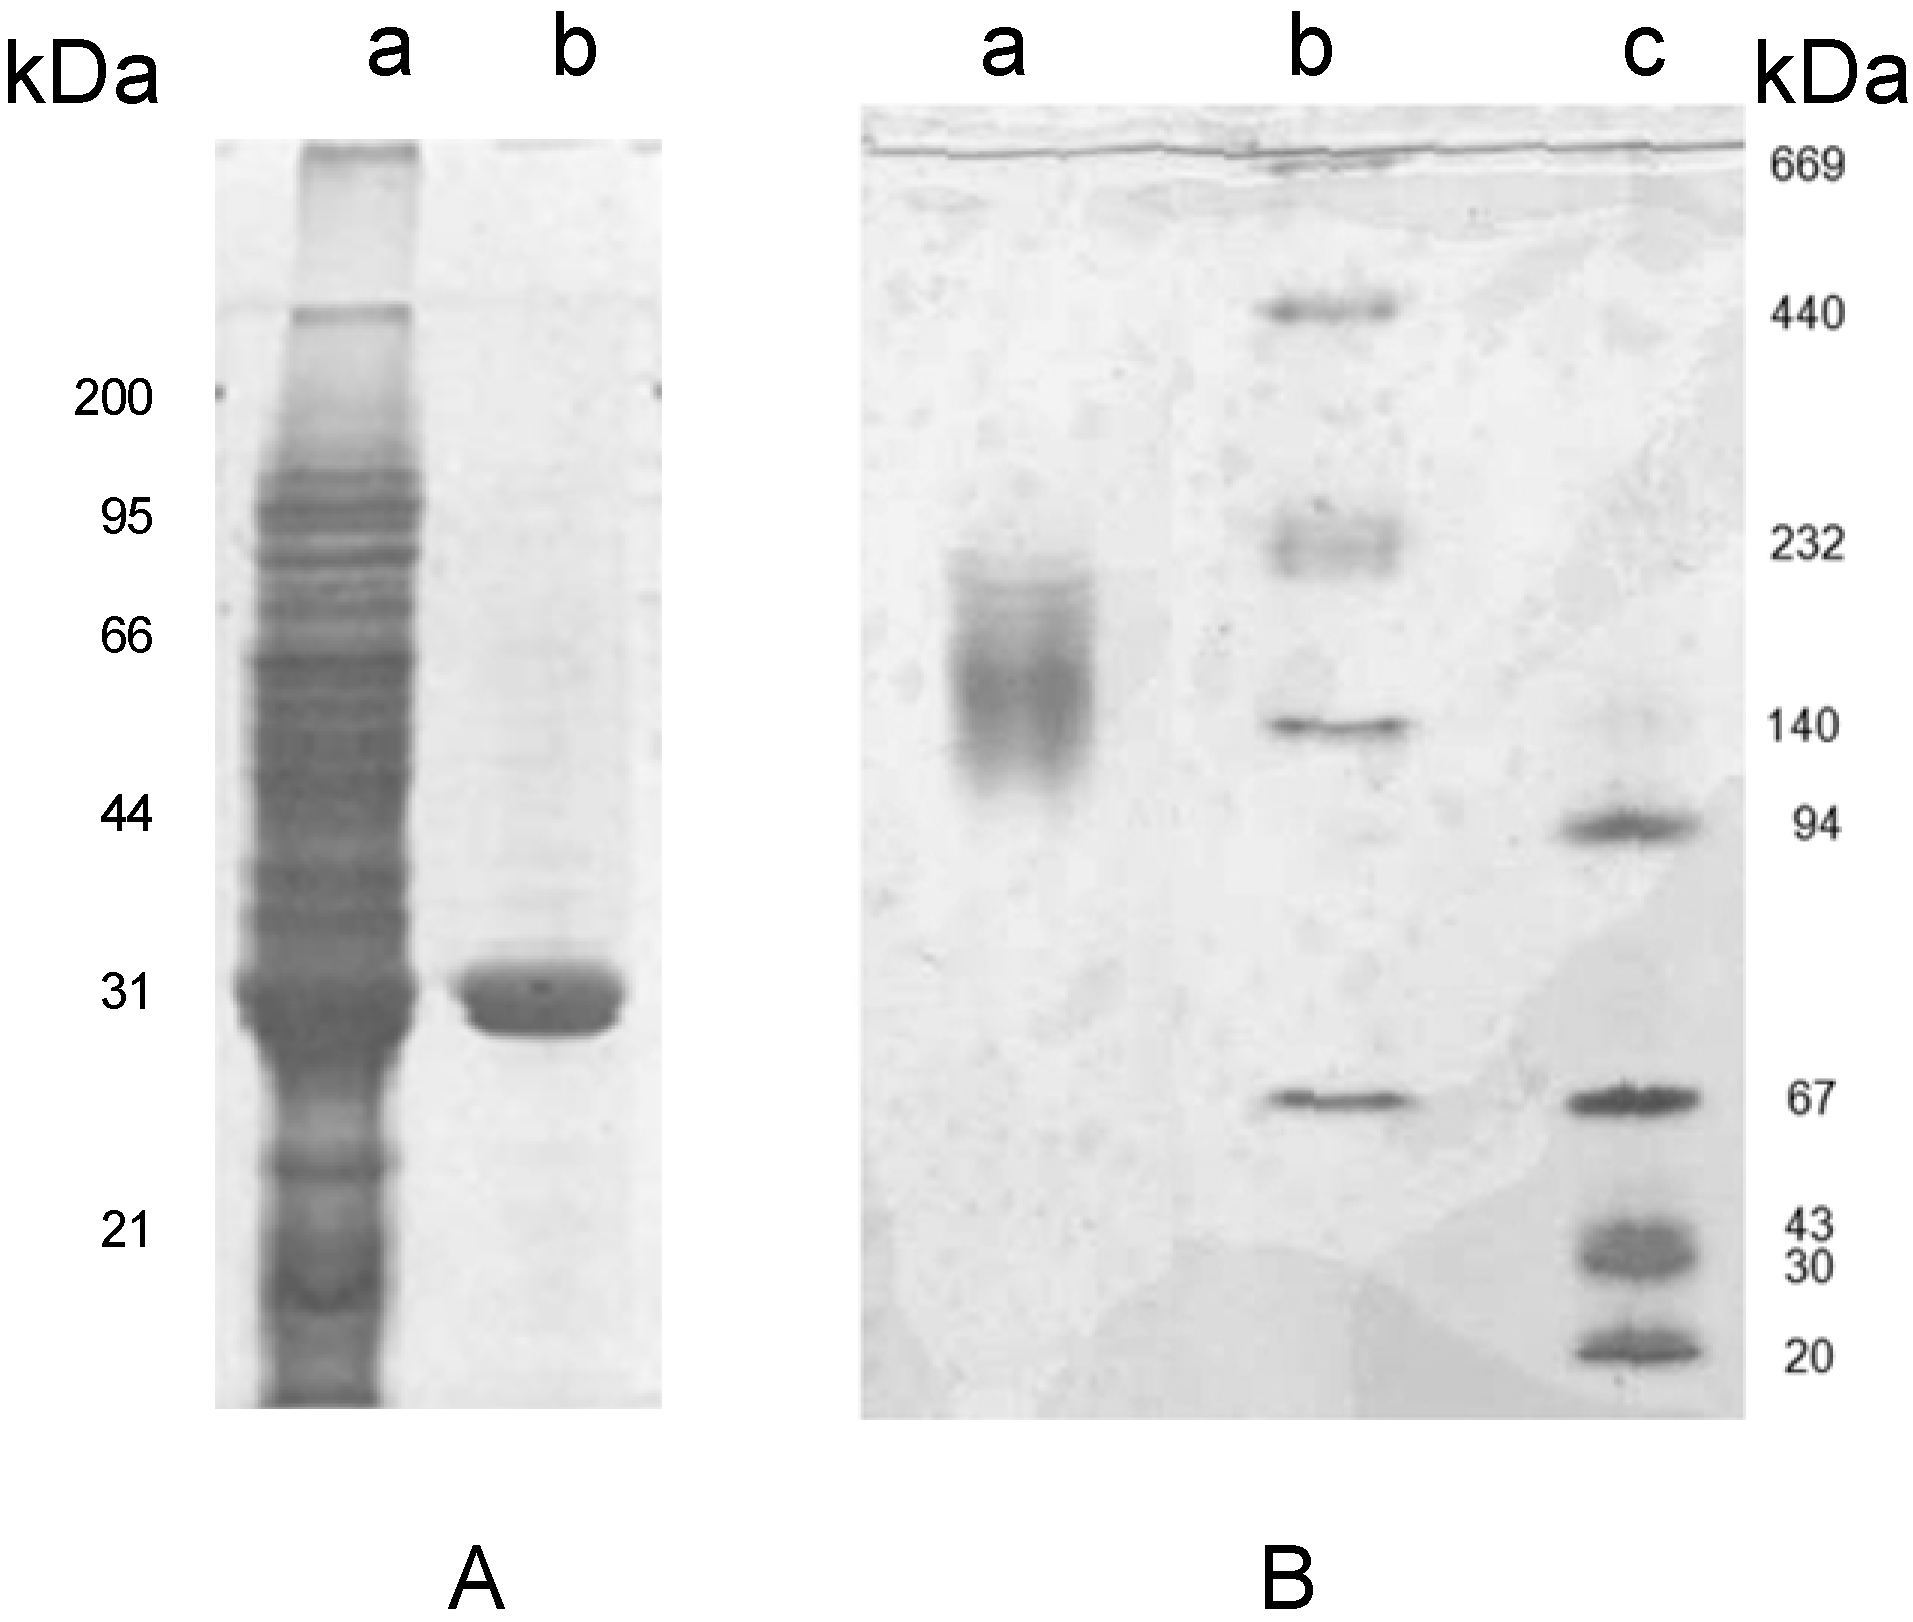
Electrophoretic analysis of the crude extract and pure lectin fractions from tepary beans on SDS-PAGE (Panel A) and Native PAGE (Panel B). Lane a in Panel A corresponds to the crude extract, lanes b and c corresponds to the pure lectin subunits with a molecular mass of 31 kDa. Panel B, line a shows that the lectin forms oligomers between of 132 and 153 kDa; lines b and c show the native Mw standards.
Figure 2.
Electrophoretic analysis of the crude extract and pure lectin fractions from tepary beans on SDS-PAGE (Panel A) and Native PAGE (Panel B). Lane a in Panel A corresponds to the crude extract, lanes b and c corresponds to the pure lectin subunits with a molecular mass of 31 kDa. Panel B, line a shows that the lectin forms oligomers between of 132 and 153 kDa; lines b and c show the native Mw standards.
Figure 2A depicts the electrophoretic pattern of the fetuin-bound fraction on SDS-PAGE under reducing conditions. This pattern showed a single band indicating that the hemagglutinating protein was purified to homogeneity.
2.2. Chemical Characterization of the Lectin
Table 2 shows the amino acid composition results, which were determined by acid hydrolysis of the protein and subsequent
O-phtalaldehyde derivatization. The amino acid content results showed differences with those reported by other authors for other varieties of tepary beans, because they found higher concentrations of Asx, Ser, and Leu [
26,
28,
29], whereas in PAA the amino acids Gly, Leu, Met, and Ile, were found at higher concentration, and Lys, Glx, and Ala at a low concentration.
Table 2.
Amino acid composition of the tepary bean lectin.
Table 2.
Amino acid composition of the tepary bean lectin.
| Amino Acid | ng/mg | % |
|---|
| Lys | 10.91 | 0.24 |
| Glx | 21.25 | 0.47 |
| Ala | 34.53 | 0.77 |
| Val | 52.22 | 1.17 |
| His | 109.50 | 2.45 |
| Tyr | 190.64 | 4.26 |
| Arg | 190.92 | 4.27 |
| Phe | 257.31 | 5.75 |
| Asx | 269.82 | 6.03 |
| Ser | 347.55 | 7.77 |
| Thr | 396.12 | 8.85 |
| Ile | 401.79 | 8.89 |
| Met | 460.67 | 10.29 |
| Leu | 472.22 | 10.55 |
| Gly | 1259.25 | 28.14 |
| Cys | n.d.a | n.d. |
Analysis of the pure lectin by the phenol sulfuric assay showed that lectin from tepary beans contains 6.5% of carbohydrates. These sugars are most likely part of
N-linked oligosaccharides, as is the case of most legume lectins [
30,
31]. The studies indicated that PAA is a glycoprotein that also contains metal ions in its structure, and various studies have shown that these structural components are of major importance for the biological activity of lectins [
29,
32,
33,
34].
Table 3 shows the concentration on metals, in parts per million (ppm), where it was observed that calcium was found at a higher concentrations than the other metals, while chromium was the one with the lowest concentration, and cadmium was not found in the lectin. Despite the presence of considerable amounts of calcium, no inhibition of hemagglutination activity was observed when EDTA was added to the hemagglutination reaction at concentrations of 100 mM (data not shown).
Table 3.
Metal content of PAA determined by plasma spectrometry.
Table 3.
Metal content of PAA determined by plasma spectrometry.
| Metal | Concentration (ppm) |
|---|
| Ca | 10739.9 |
| Cu | 2528.8 |
| Zn | 847.3 |
| Mg | 453.8 |
| Fe | 324.6 |
| Mn | 240.5 |
| Cr | 19.8 |
2.3. Oligomerization of the Lectin
Separation of PAA by SDS-PAGE (
Figure 2A) showed a single band with a molecular weight (Mw) of 31 kDa, whereas analysis by native gel electrophoresis showed a broad band in the range between 132 to 153 kDa (
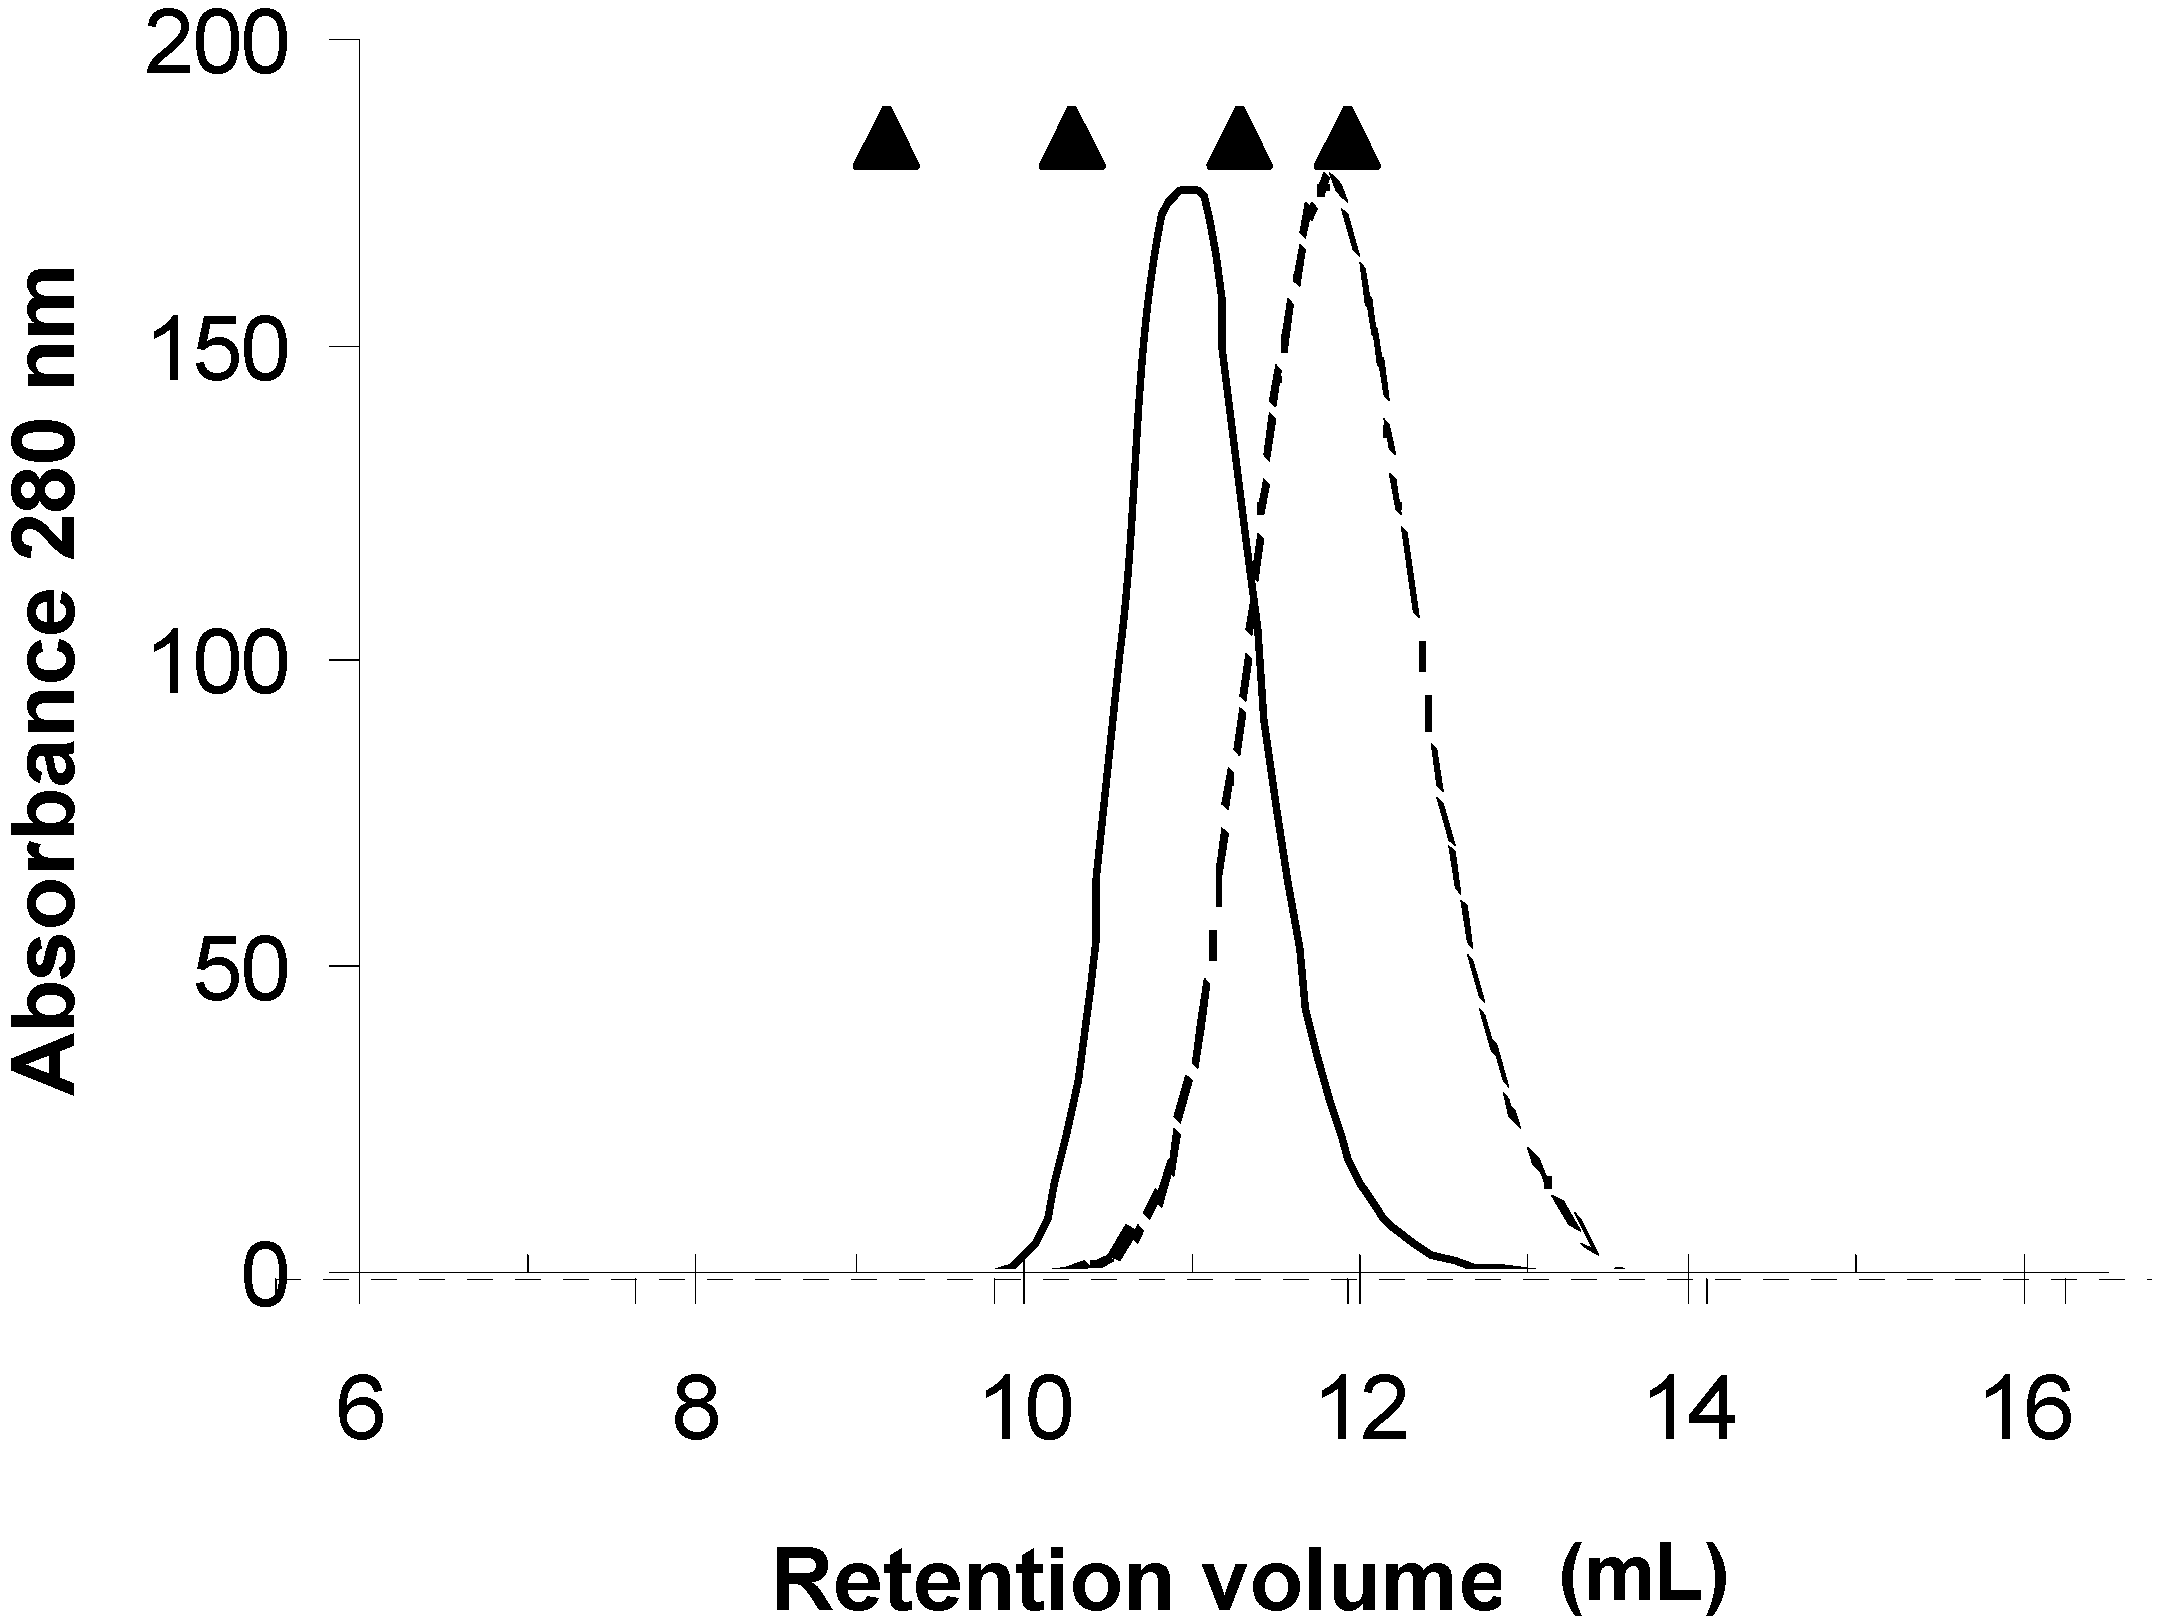
Figure 2B). Analysis of this lectin by MALDI-TOF revealed the presence of two species with Mw of 28 and 31 kDa, suggesting that the matrix used with fetuin has affinity for at least two isolectins, and that it forms an oligomer of at least four subunits. To confirm the results on the oligomerization of the lectin, one aliquot of the purified protein was injected into a TSK 3000-SW size exclusion chromatography column using PBS as elution buffer (data not shown). This analysis showed that PAA has an Mw of 62 kDa for the oligomeric protein, which suggests, in contrast to the native PAGE data, that it behaves like a dimer. To resolve these contradictory results, the role of ionic strength in the oligomerization of the lectin was tested. For this purpose, a set of size exclusion chromatography runs was performed in the lectin fraction using a Superose 12 size exclusion chromatography column (
Figure 3).
Figure 3.
Analysis of oligomerization of the subunits of PAA by size exclusion chromatography on a superose 12 column (1.0 × 30 cm). Pure lectin was injected into the column and eluted at low ionic strength (—) and 1 M NaCl (
![Molecules 16 02561 i001]()
). Elution positions of the molecular weight standards (Thyroglobulin 660 kDa, aldolase 150 kDa, bovine serum albumin 67 kDa, and ovoalbumin 44 kDa) are indicated (▲).
In the first run, protein was eluted with a buffer containing 25 mM MES pH 6.0. This run yielded an Mw estimation of 123 kDa, corroborating the tetrameric behavior of the oligomeric lectin. However in a second run, when 1 M NaCl was added to the MES buffer, the estimated Mw was 63 kDa (close to a dimeric behavior). These data demonstrated that the concentration of salt affected the oligomerization of the lectin. It is known that legume lectins can form oligomers consisting of two or four subunits. Although many of the structural features of the oligomerization of legume lectins have been elucidated [
30], there is still little information on the details of the mechanism for the oligomerization process. There are few studies on the influence of the ion concentration in the oligomerization process of any lectin. Hatakeyama
et al. and Kuwahara
et al. [
35,
36] reported that high concentrations of NaCl (1-M) and high pH values (9–10) induce oligomerization of the lectin CEL-III from the sea cucumber
Echinaria cucumata when small carbohydrate ligands are present in the lectin solution. In the present study, low concentrations of NaCl favor the formation of a tetramer, as opposed to the formation of a dimer at higher salt concentrations. The previously noted results allowed us to conclude that the lectin isoforms found in these beans are composed of four subunits, which agrees with reports for other lectins from other varieties of tepary beans [
26,
29,
37].
2.4. Characterization of the Subunits of the Tepary Bean Lectin
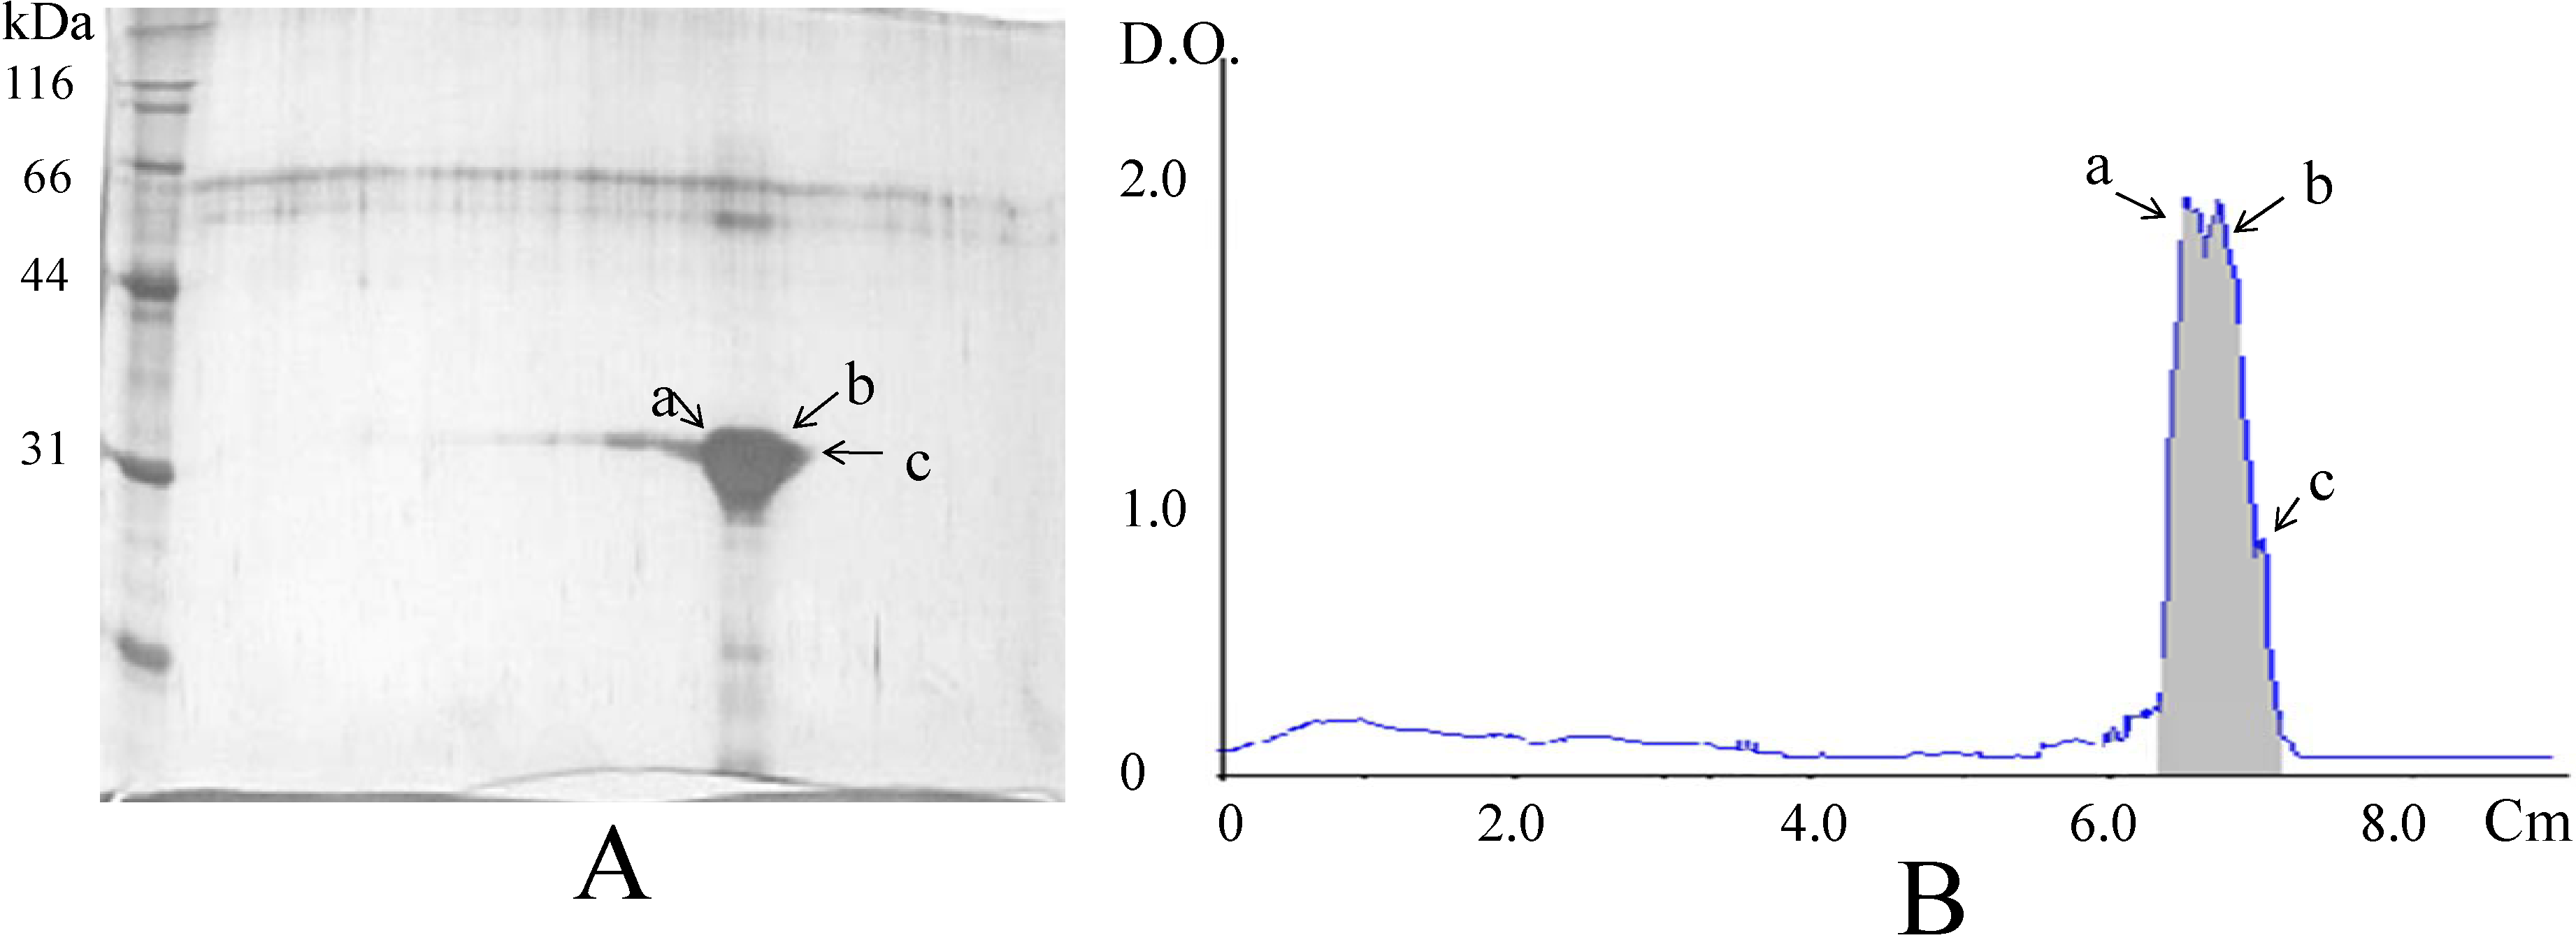
Analysis of the lectin fraction by 2D-PAGE resulted in the separation of three protein species with the same molecular weight but different isoelectric points (4.2, 4.4, and 4.5) (
Figure 4); each subunit is assumed to correspond to a different subunit.
Figure 4.
Analysis of the lectin from tepary beans by 2D-polyacrylamide gel electrophoresis. (A). In the gel shown, three distinct species (designated as a, b, and c) were distinguished; (B). Densitogram shows peaks corresponding to the three species, with calculated isoelectric points of 4.5 (a), 4.4 (b), and 4.2 (c).
Further analysis of the amino acid sequences of six tryptic peptides from these subunits (
Table 4) showed that all of them share between 90 and 93% of identity with erythroagglutinating phytohemagglutinin, leukoagglutinating phytohemagglutinin from
Phaseolus vulgaris [
38], and phytohemagglutinin from
Phaseolus coccineus [
39], and 100% identity with phytohemagglutinin from
Phaseolus acutifolius [
40]. This latter sequence was isolated when a c-DNA from tepary beans was screened with a probe derived from the sequence of the α-amylase inhibitor from
Phaseolus vulgaris. Mirkov
et al. [
40] did not report on this sequence, nor did they purify a lectin fraction from tepary beans. Therefore, the present work confirms that the sequence reported in that study corresponds to an active lectin. Due to the identity found among the sequences of other lectins, as mentioned previously, and the subunits separated by 2D-PAGE for PAA, it is suggested that the differences in pI in the resolved species are due to post-translational modifications, such as glycosylation.
Table 4.
Results of the sequence obtained by LC/MS/MS on tryptic peptides of proteins excised from 2D-PAGE separation of the tepary bean subunits. The calculated masses were obtained from a theoretical tryptic digest of the sequence of the lectin precursor from Phaseolus acutifolius reported in the NCBI protein sequence data base (Accession No gi|1086123).
| Calculated Mass | Observed Mass | Start residue | End residue. | Sequence |
|---|
| 1095.6156 | 1095.6118 | 161 | 170 | HIGIDVNSIK |
| 1317.7776 | 1317.7792 | 197 | 208 | LLVASLVYPSQK |
| 1324.6995 | 1324.7072 | 209 | 220 | TSFIVSDTVDLK |
| 1635.8125 | 1635.7968 | 140 | 153 | AHTVAVEFDTLYNR |
| 1800.9086 | 1800.8922 | 56 | 72 | LTNLNDNGEPTLSSLGR |
| 2219.2183 | 2219.2234 | 102 | 124 | VPNNAGPADGLAFALVPVGSKPK |
2.5. Hemagglutination Activity
Table 5 shows a comparison of specific activity on agglutination assays of the tepary bean hemagglutinin with commercial lectin from
Canavalia ensiformis (concanavalin A). Our results showed that, in general, tepary bean hemagglutinin had higher activity than concanavalin A. When hemagglutination assays were carried out with non-trypsinized erythrocytes, it was observed that hemagglutination activity was lower than when erythrocytes were pretreated with trypsin s (data not shown).
Table 5.
Hemagglutination activity of the purified lectin from Phaseolus acutifolius compared with that of the lectin from Canavalia ensiformis (Concanavalin A) on trypsinized human erythrocytes of blood types A and O.
Table 5.
Hemagglutination activity of the purified lectin from Phaseolus acutifolius compared with that of the lectin from Canavalia ensiformis (Concanavalin A) on trypsinized human erythrocytes of blood types A and O.
| Lectin | Lectin Concentration (mg/mL) | Trypsinized human erythrocytes(Hemaggluting titer) |
|---|
| Type A | Type O |
|---|
| Tepary bean | 3.5 | 292.6 | 36.6 |
| Phaseolus vulgaris (PHA-E) | 3.5 | 20.34 × 10⁷ | 33.55 × 10⁶ |
| Concanavalin A | 3.5 | 1.1 | 0.57 |
The effect of various monosaccharides, oligosaccharides, and glycoconjugates on hemagglutination activity was tested in the present study. These assays were performed in 96-well microtiter plates in which the concentration of the potential inhibitor was varied and the lectin concentration was maintained constant.
The results obtained in these experiments (
Table 6) showed that monosaccharide, oligosaccharides, and glycopeptides did not any inhibitory effects on the hemagglutination activity. However, on the other hand, intact glycoproteins showed an inhibitory effect in erythrocytes of both types A and O.
Table 6.
Effect of glycans and glycoconjugates on the hemagglutination activity of the lectin from tepary beans.
Table 6.
Effect of glycans and glycoconjugates on the hemagglutination activity of the lectin from tepary beans.
| | Inhibitory concentration a (mg/mL) |
|---|
| Glycoproteins | Human “O” Erythrocytes | Human “A” Erythrocytes |
| GnT-V | 1.7 × 10E-3 | 27.3 × 10E-3 |
| Fetuin | 78.1 × 10E-3 | 156.3 × 10E-3 |
| Fibrinogen | 9.8 × 10E-3 | 39.1 × 10E-3 |
| Thyroglobulin | 4.8 × 10E-3 | 4.8 × 10E-3 |
| Ovoalbumin | 1.3 | 1.3 |
| Glycopeptides | | |
| Tryptic glycopeptides from bovine fetuin | n.i. | n.i. |
| Tryptic glycopeptides from pocine Thyroglobulin | n.i. | n.i. |
| Tryptic glycopeptides from ovoalbumin | n.i. | n.i. |
| Thermolytic glycopeptides from Fibrinogen | n.i. | n.i. |
| Oligosaccharides | | |
| Chitooligosaccharides | n.i. | n.i. |
| Human milk oligosaccharides mixture | n.i. | n.i. |
| Raffinose | n.i. | n.i. |
| Lactose | n.i. | n.i. |
| Monosaccharides | | |
| Maltose | n.i. | n.i. |
| Glucose | n.i. | n.i. |
| Galactose | n.i. | n.i. |
| Mannose | n.i. | n.i. |
| Fucose | n.i. | n.i. |
| Metilglucopyranose | n.i. | n.i. |
| Glucosaminitol | n.i. | n.i. |
| Galactosaminitol | n.i. | n.i. |
These results indicate that
N-linked complexes (biantennary triantennary, or tetraantennary) are the best haptens for this lectin because these structures are those that present in the glycoprotein inhibitors that rendered the best inhibition. A summary of the structures that are present in the glycoproteins that were utilized in the hemagglutination inhibition assays is presented in
Table 7. Bovine fetuin expresses mainly biantennary structures [
40]. Triantennary oligosaccharides are the main components of bovine fetuin [
41]. Porcine thyroglobulin possess a variety of biantennary and triantennary
N-linked glycans [
42], and the recombinant human β-1,6-
N-acetylglucosaminyltransferase-V used in this study contains a variety of biantennary, triantennary, and tetraantennary glycans [
43]. PAA, however, may have low affinity for high mannose and hybrid structures because these are the structures present in ovoalbumin [
44] and because this glycoprotein caused moderate inhibition of the hemagglutinating reaction. The fact that glycopeptides that were prepared from the glycoproteins mentioned previously did not cause inhibition of the hemagglutinating reaction is an indication that cooperativity (clustering of multivalent ligands) is important in the binding of PAA to its ligands [
45]. Therefore, these results suggest that PAA, like other lectins [
28,
46,
47,
48] also belong to the group termed “complex” with specificity toward
N-glycans.
Table 7.
Asparagine-linked oligosaccharide structures that are present in the glycoproteins and glycopeptides utilized in inhibition of the hemagglutination assays of PAA.
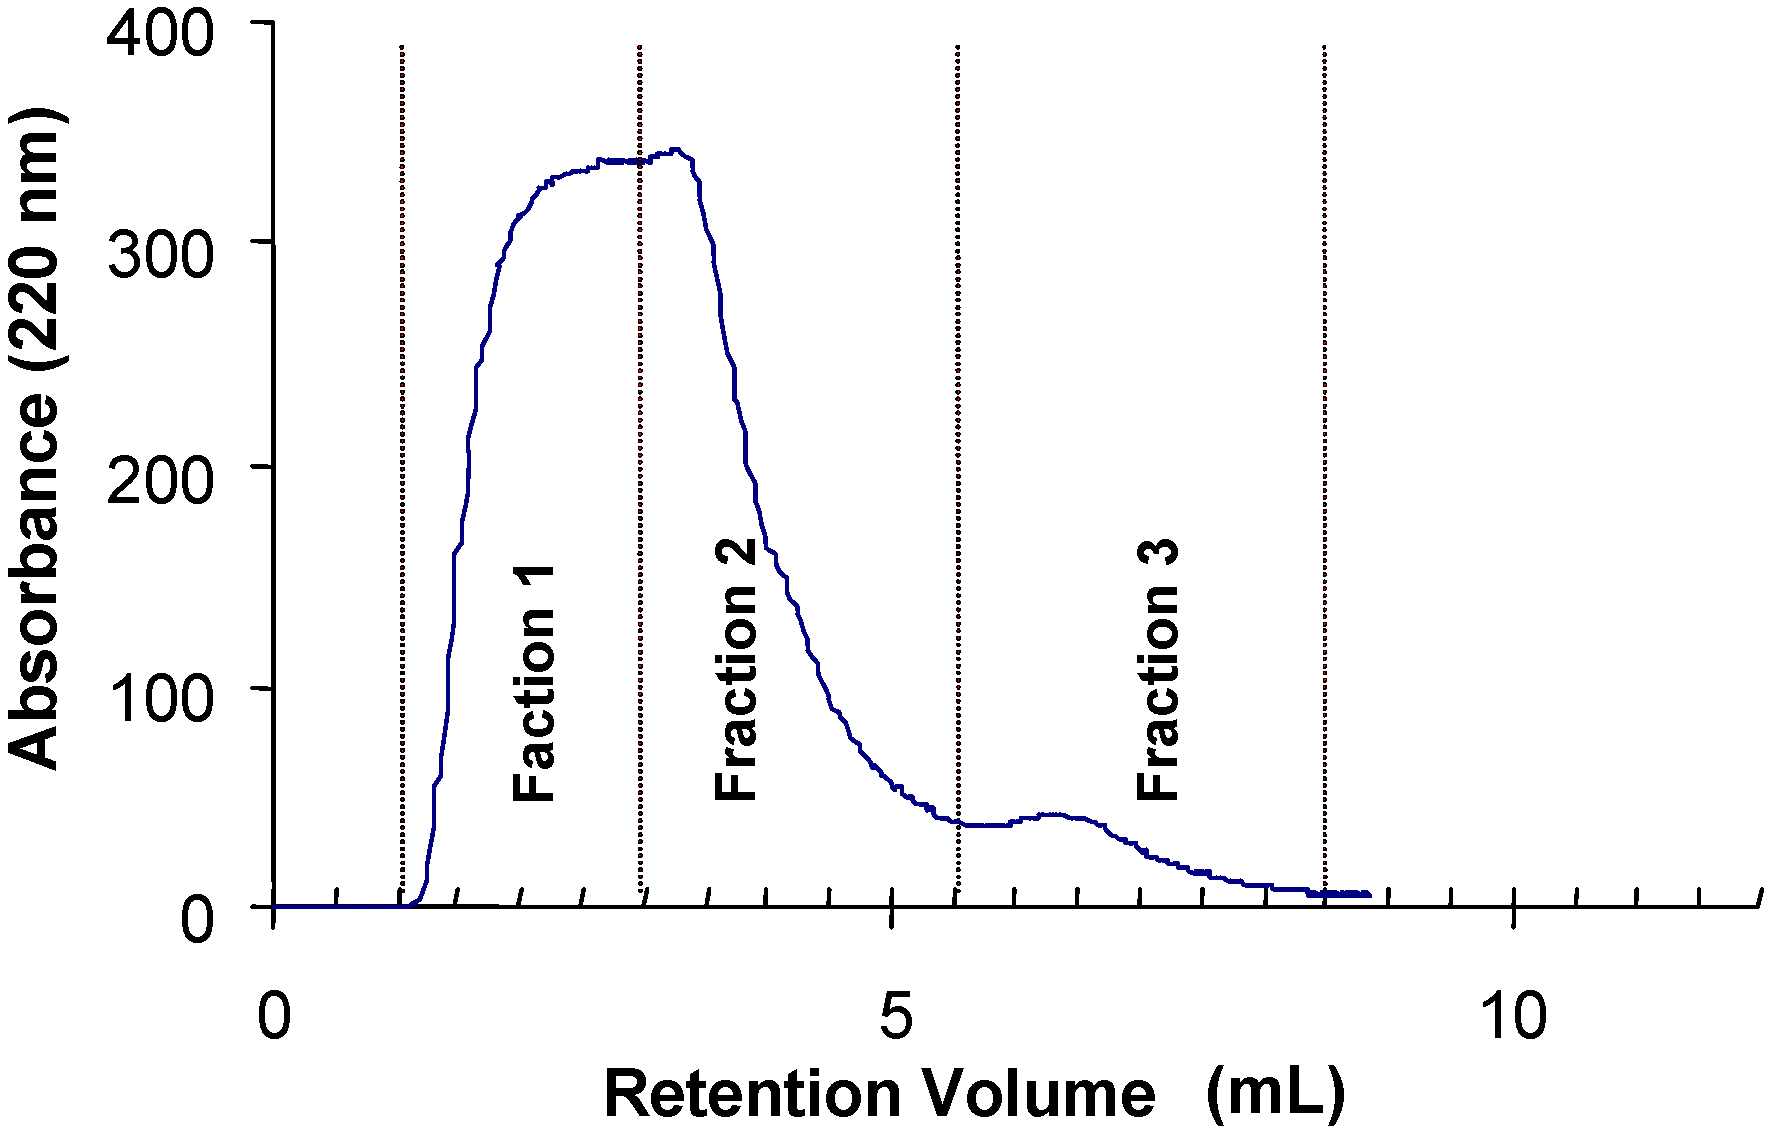
The binding of glycopeptides from porcine thyroglobulin with a high variety of complex
N-glycans showed that some of these glycopeptides were retarded by the immobilized tepary bean lectin. The chromatogram depicted in
Figure 5 shows three distinct fractions: fraction 1 corresponds to the unbound (run-through) material, and fractions 2 and 3 are the glycopeptides that were retarded by the affinity column. The monosaccharide composition of the three fractions from lectin affinity chromatography presented in
Table 8 shows that the retarded glycopeptides contained in fraction 3 have a larger proportion of
N-acetylglucosamine in their structures.
Figure 5.
Analysis of the carbohydrate specificity of tepary bean hemagglutinin by lectin affinity chromatography. A glycopeptide mixture purified from thermolysin-treated thyroglobulin was applied to a column with a resin containing immobilized PAA. The glycopeptides were eluted in three fractions. Fraction 1 contains the unbound glycopeptides. Fractions 2 and 3 are the fractions that were retarded by the lectin column and that therefore have affinity for the lectin. Carbohydrate composition of these fractions is presented in
Table 8. The proposed structure of the oligosaccharide with the highest affinity with the tepary bean lectin is presented in
Figure 6.
Table 8.
Carbohydrate compositions of the glycopeptide pools separated by affinity chromatography in an immobilized PAA column (
Figure 6).
Table 8.
Carbohydrate compositions of the glycopeptide pools separated by affinity chromatography in an immobilized PAA column (Figure 6).
| Carbohydrate Residue | Monosaccharide composition (%) |
|---|
| Fraction 1 | Fraction 2 | Fraction 3 |
|---|
| Fucose | 5.8 | 5.5 | 3.9 |
| Mannose | 49.1 | 43.8 | 26.0 |
| Galactose | 15.5 | 14.9 | 15.8 |
| N-acetylglucosamine | 22.6 | 29.6 | 40.5 |
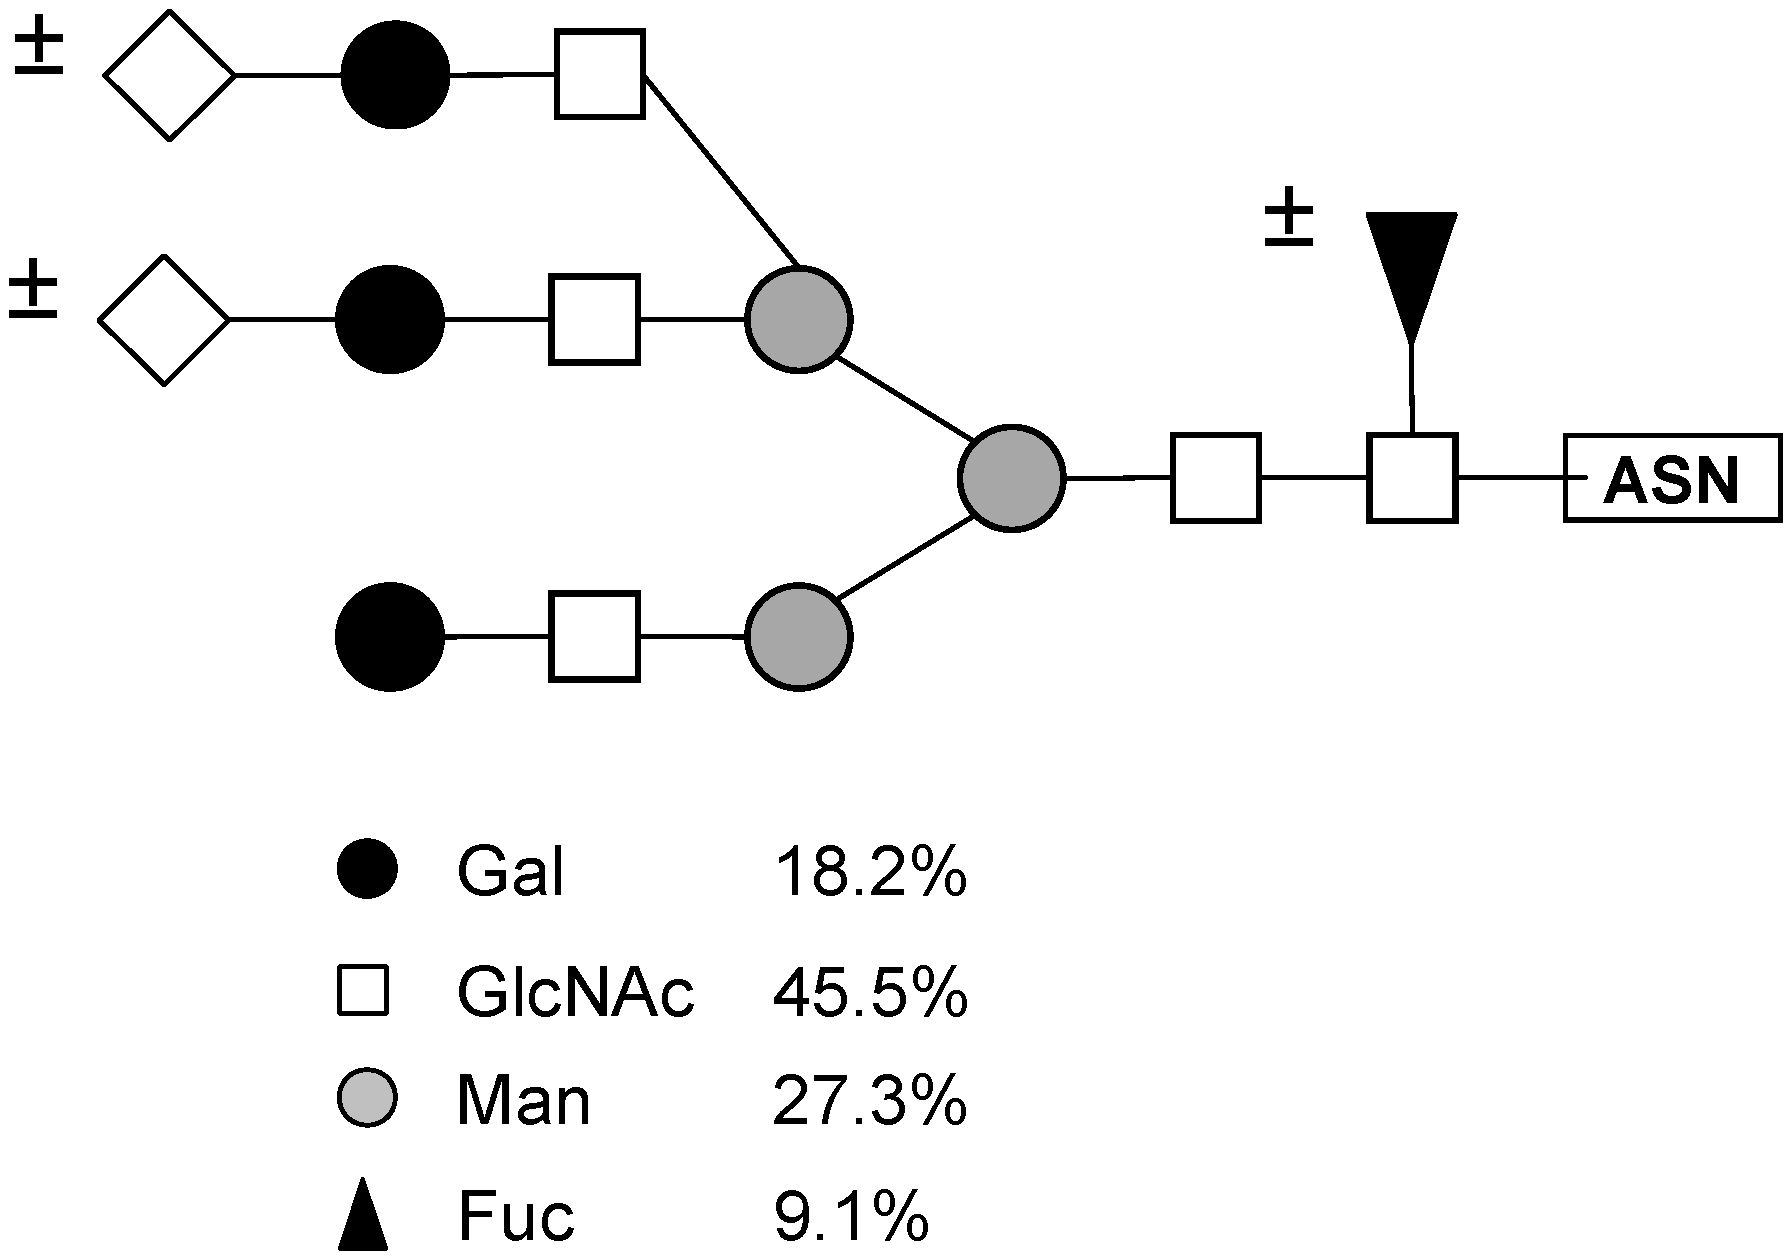
Based on this monosaccharide composition, the structure shown in
Figure 6 (a desialylated triantennary structure lacking a galactose residue in one of its branches) is proposed as the best ligand for PAA in the glycopeptides mixture from thyroglobulin.
2.6. Mitogenic Activity
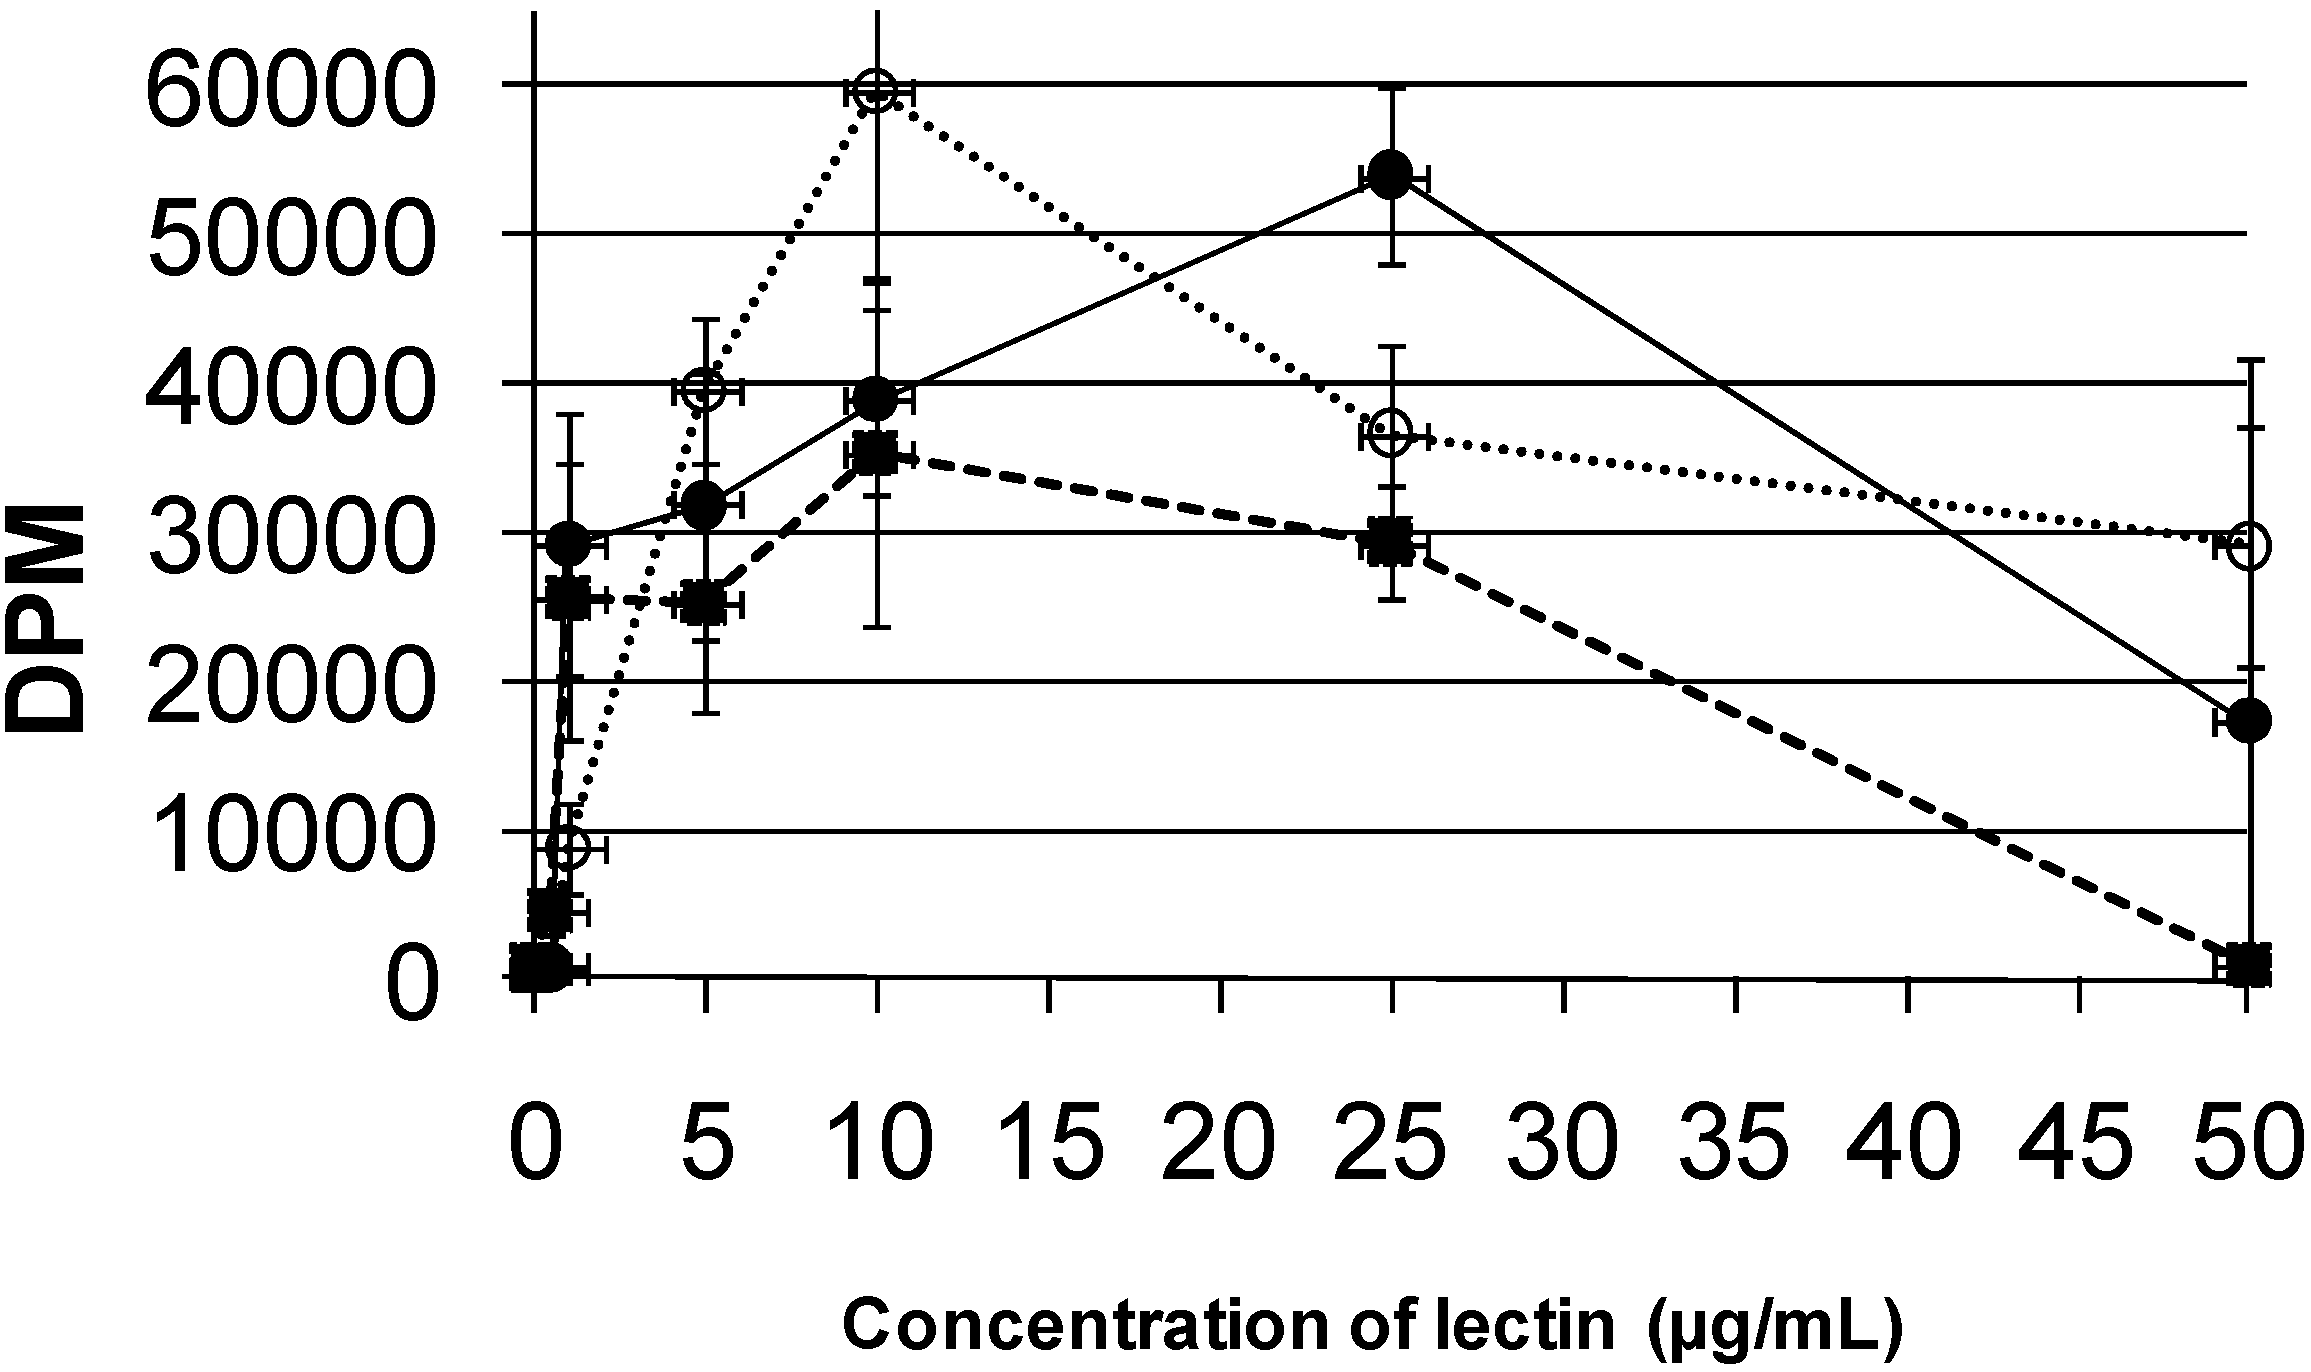
The mitogenic activity of PAA was compared with that of the leukoagglutinating lectin from the common bean lectin (PHA-L) and concanavalin (Con A). These assays were carried out by measuring the amount of [3H] thymidine that was incorporated into cultured human lymphocytes at various doses.
Results on the mitogenicity of the assayed lectins (PAA, PHA-L, and Con A) are presented in
Figure 7. These results indicate that the lectins from PHA-L and Con A possess higher potential for stimulation of cell division, showing their maximum mitogenic effect at concentrations of 10 μg/mL; on the other hand, PAA showed its maximum mitogenic effect at 25 μg/mL. Studies with
Phaseolus acutifolius variety escumite lectin [
28] showed the same mitogenic capacity as the PAA, while, on the other hand, Vargas-Albores
et al. [
26] reported that a lectin tepary had greater mitogenic activity than that of PAA.
Figure 6.
Structure of the oligosaccharide from porcine thyroglobulin (
Figure 5, Fraction 3), which has the highest affinity to the lectin from tepary beans. This structure was proposed based on the monosaccharide composition of this fraction, shown in
Table 8.
Figure 6.
Structure of the oligosaccharide from porcine thyroglobulin (
Figure 5, Fraction 3), which has the highest affinity to the lectin from tepary beans. This structure was proposed based on the monosaccharide composition of this fraction, shown in
Table 8.
Figure 7.
Comparison of the mitogenic effects of the lectin from tepary beans (
![Molecules 16 02561 i008]()
), the leukoagglutinating lectin from
Phaseolus vulgaris (
![Molecules 16 02561 i009]()
), and Concanavalin A (
![Molecules 16 02561 i010]()
). In these experiments, the incorporation of [
3H]-thymidine was measured after incubation of cultured human lymphocytes with increasing amounts of each lectin.
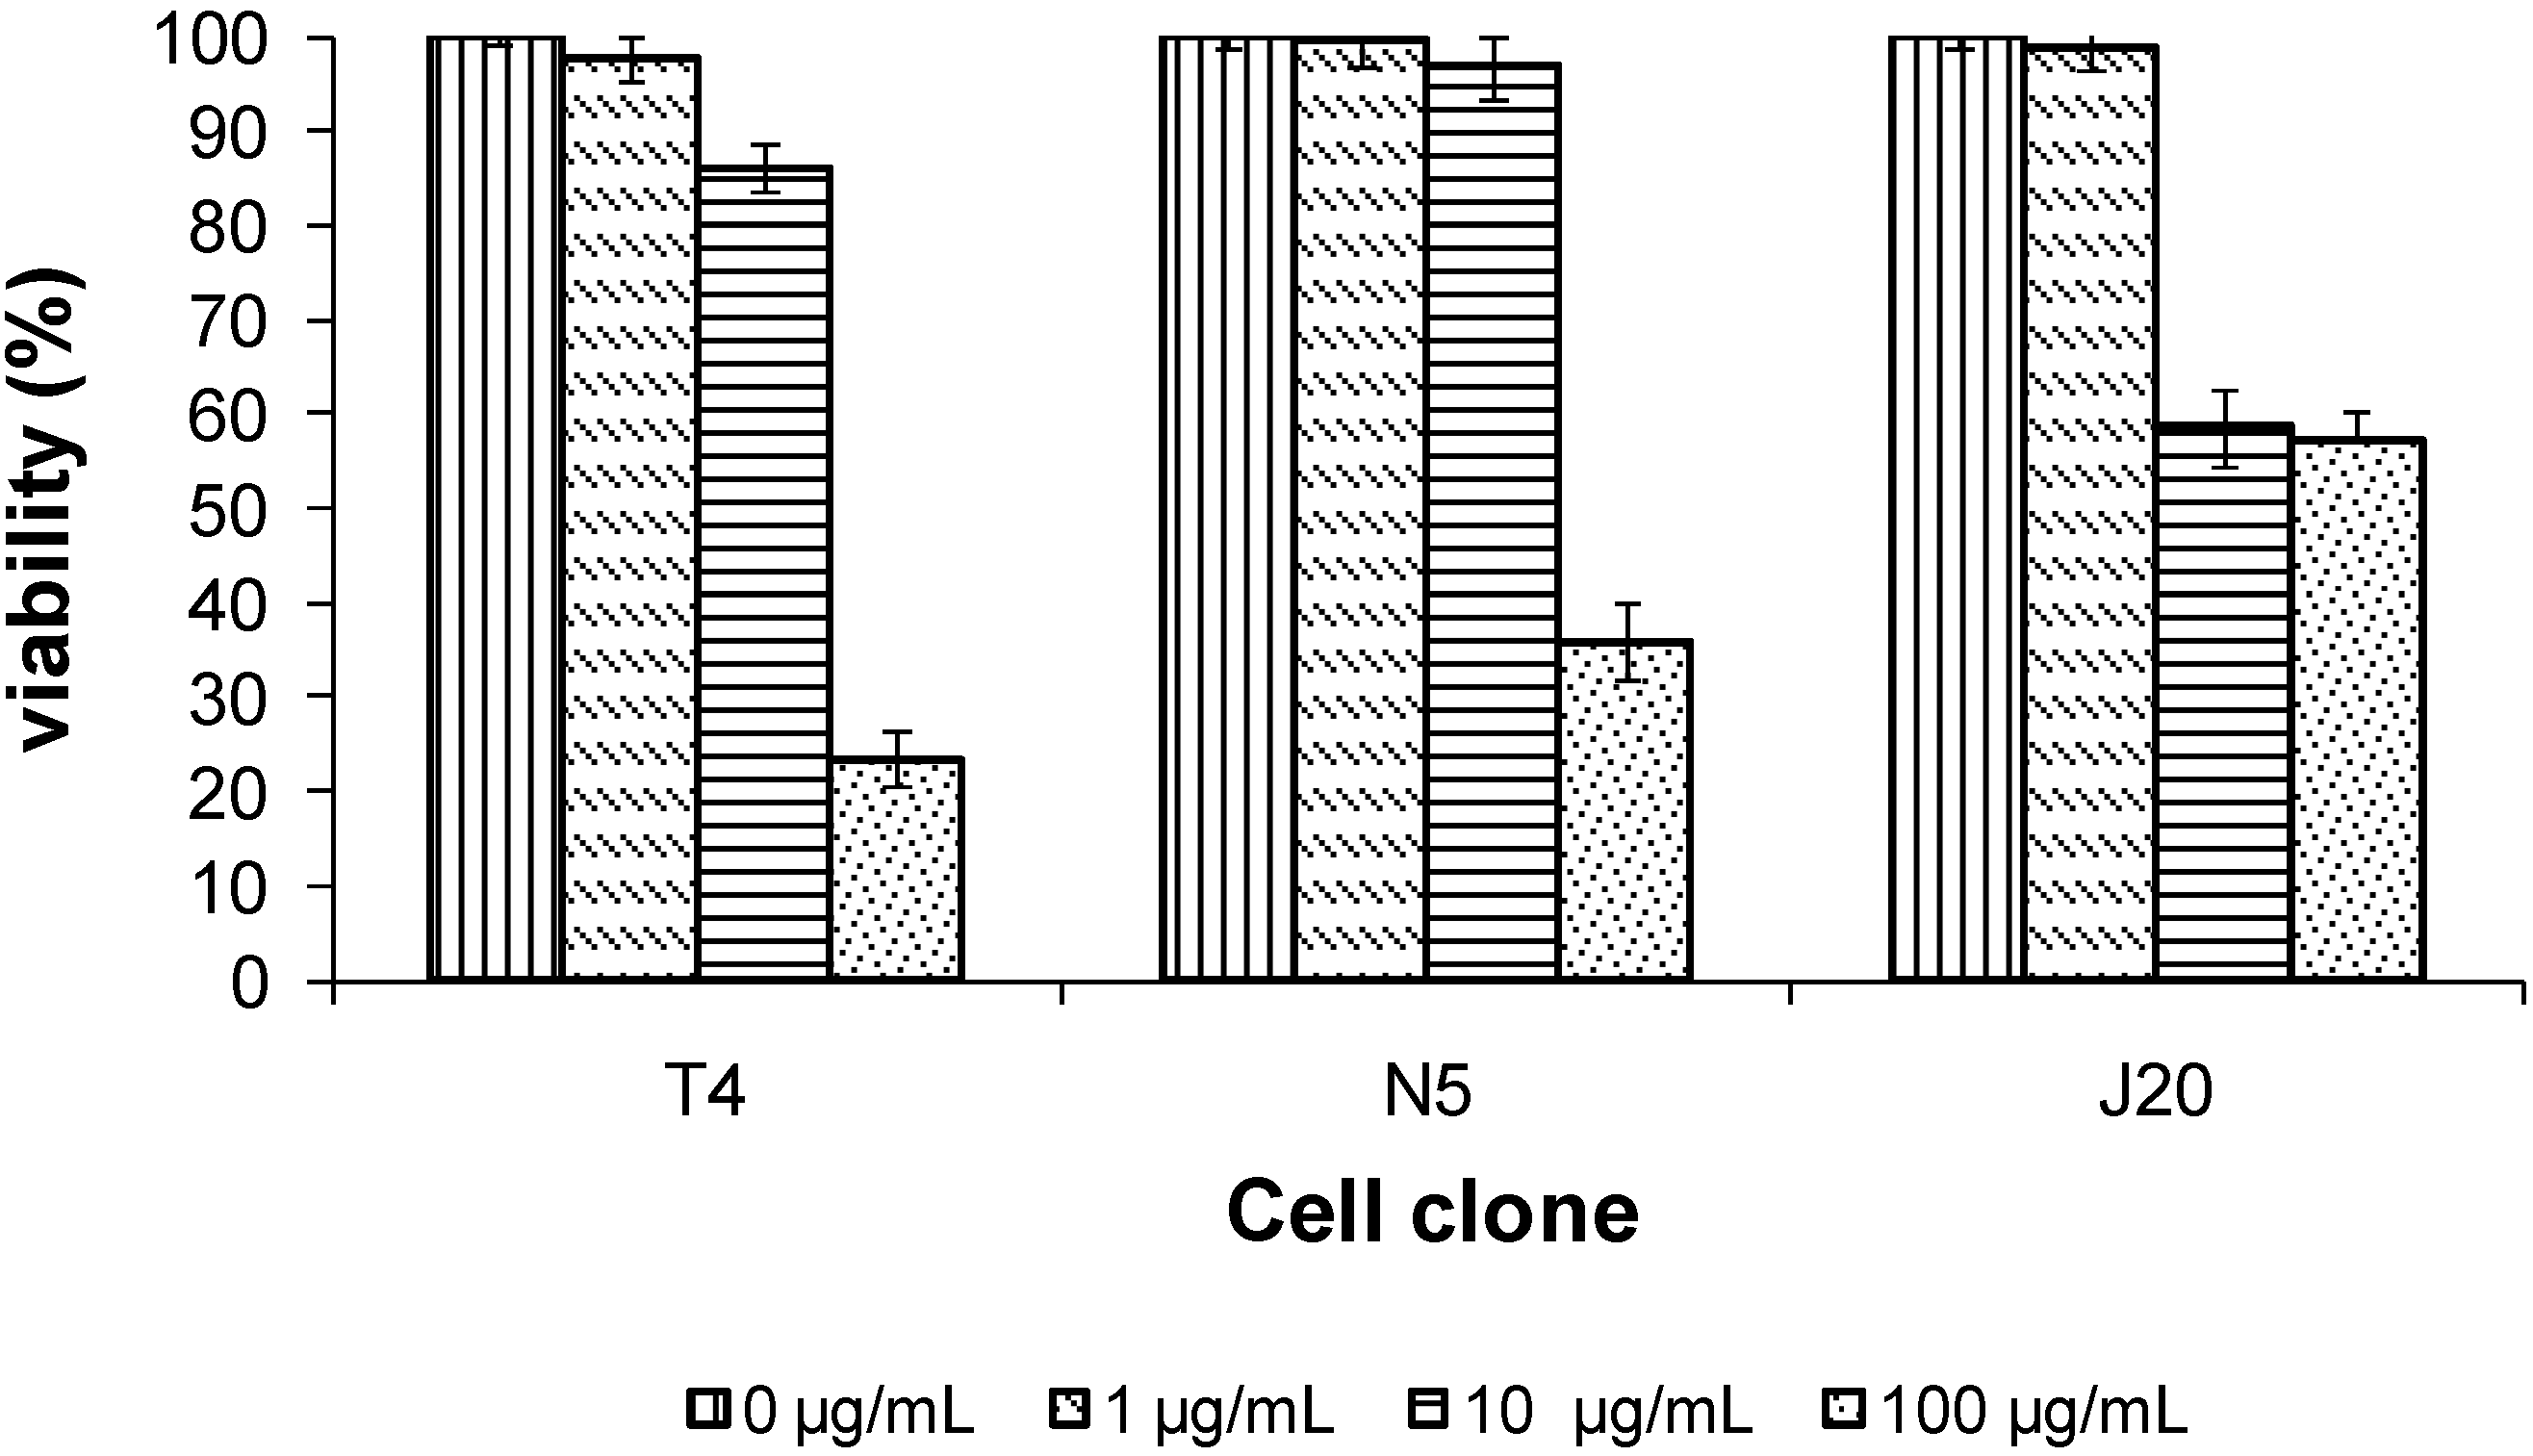
2.7. Cytotoxicity Activity on Mouse 3T3 Fibroblast Cell Clones
Tepary bean lectin presented a dose-depending cytotoxic effect on the cell clone (evaluated using the MTT test). The cytotoxicities of cell clones were different as shown by the IC
50 values obtained for each cell clones. For clone T4, we found an IC
50 of 51.5 µg/mL, for N5, of 72.5 µg/mL, and for J20, of 275 µg/mL.
Figure 8 demonstrates that the T4 clone showed significant growth inhibition, while J20 clone showed low inhibition even at a high lectin concentration. Cytotoxicity studies reported for the same lectin [
51] have demonstrated that PAA have the ability to inhibit the growth of human cancer cells, either by causing cytotoxic or anti-proliferation effects on SW480 and C33-A cell lines, and, on the other hand, that PAA has the ability to inhibit the colony formation ability in both cell lines. On the other hand, it has also been reported that tepary bean lectin can reduce the viability of small intestine epithelial cells of rats [
52], as well as induce severe damage in mice [
53].
Figure 8.
Effect of the lectin from tepary beans on mouse 3T3 fibroblast cell clones. Cell clones were exposed to the indicated concentration of tepary bean lectins for 24 h, and after incubation, viability was determined employing the MTT assay.
Figure 8.
Effect of the lectin from tepary beans on mouse 3T3 fibroblast cell clones. Cell clones were exposed to the indicated concentration of tepary bean lectins for 24 h, and after incubation, viability was determined employing the MTT assay.


 ,
, 


 ). Elution positions of the molecular weight standards (Thyroglobulin 660 kDa, aldolase 150 kDa, bovine serum albumin 67 kDa, and ovoalbumin 44 kDa) are indicated (▲).


 Mannose; ◊ N-Acetylneuraminic (sialic) acid; ▲ Fucose; ± indicates that the monosaccharide residue may or not be present as part of the structure.

 ), the leukoagglutinating lectin from Phaseolus vulgaris (
  ), and Concanavalin A (
  ). In these experiments, the incorporation of [3H]-thymidine was measured after incubation of cultured human lymphocytes with increasing amounts of each lectin.

