A Quantified Ginseng (Panax ginseng C.A. Meyer) Extract Influences Lipid Acquisition and Increases Adiponectin Expression in 3T3-L1 Cells

Abstract
:1. Introduction

2. Results
2.1. HPLC-ESI-MS

| Room temperature | Methanolic reflux | Ethanolic reflux | Ultrasonic-assisted | |||||||||
|---|---|---|---|---|---|---|---|---|---|---|---|---|
| Rg1 | 48.57 | ± | 2.45 | 47.40 | ± | 4.28 | 53.15 | ± | 5.35 | 51.29 | ± | 3.00 |
| Re | 60.94 | ± | 3.99 b | 61.62 | ± | 5.10 b | 51.04 | ± | 4.60 a | 62.98 | ± | 2.60 b |
| Rf | 6.30 | ± | 0.54 b | 6.14 | ± | 0.28 b | 4.80 | ± | 0.46 a | 6.41 | ± | 0.59 b |
| Rb1 | 18.79 | ± | 3.89 ab | 21.73 | ± | 1.29 b | 17.21 | ± | 1.75 a | 18.29 | ± | 0.62 ab |
| Rc | 66.43 | ± | 7.56 b | 78.79 | ± | 4.15 c | 53.47 | ± | 4.80 a | 65.73 | ± | 2.95 b |
| Rb2 | 48.12 | ± | 7.31 ab | 56.80 | ± | 3.79 b | 40.54 | ± | 3.38 a | 46.82 | ± | 2.95 a |
| Rd | 4.36 | ± | 0.86 a | 5.90 | ± | 0.41 b | 3.92 | ± | 0.41 a | 4.38 | ± | 0.57 a |
| Total | 253.50 | ± | 26.60 ab | 278.38 | ± | 19.30 b | 224.13 | ± | 20.75 a | 255.89 | ± | 13.27 ab |

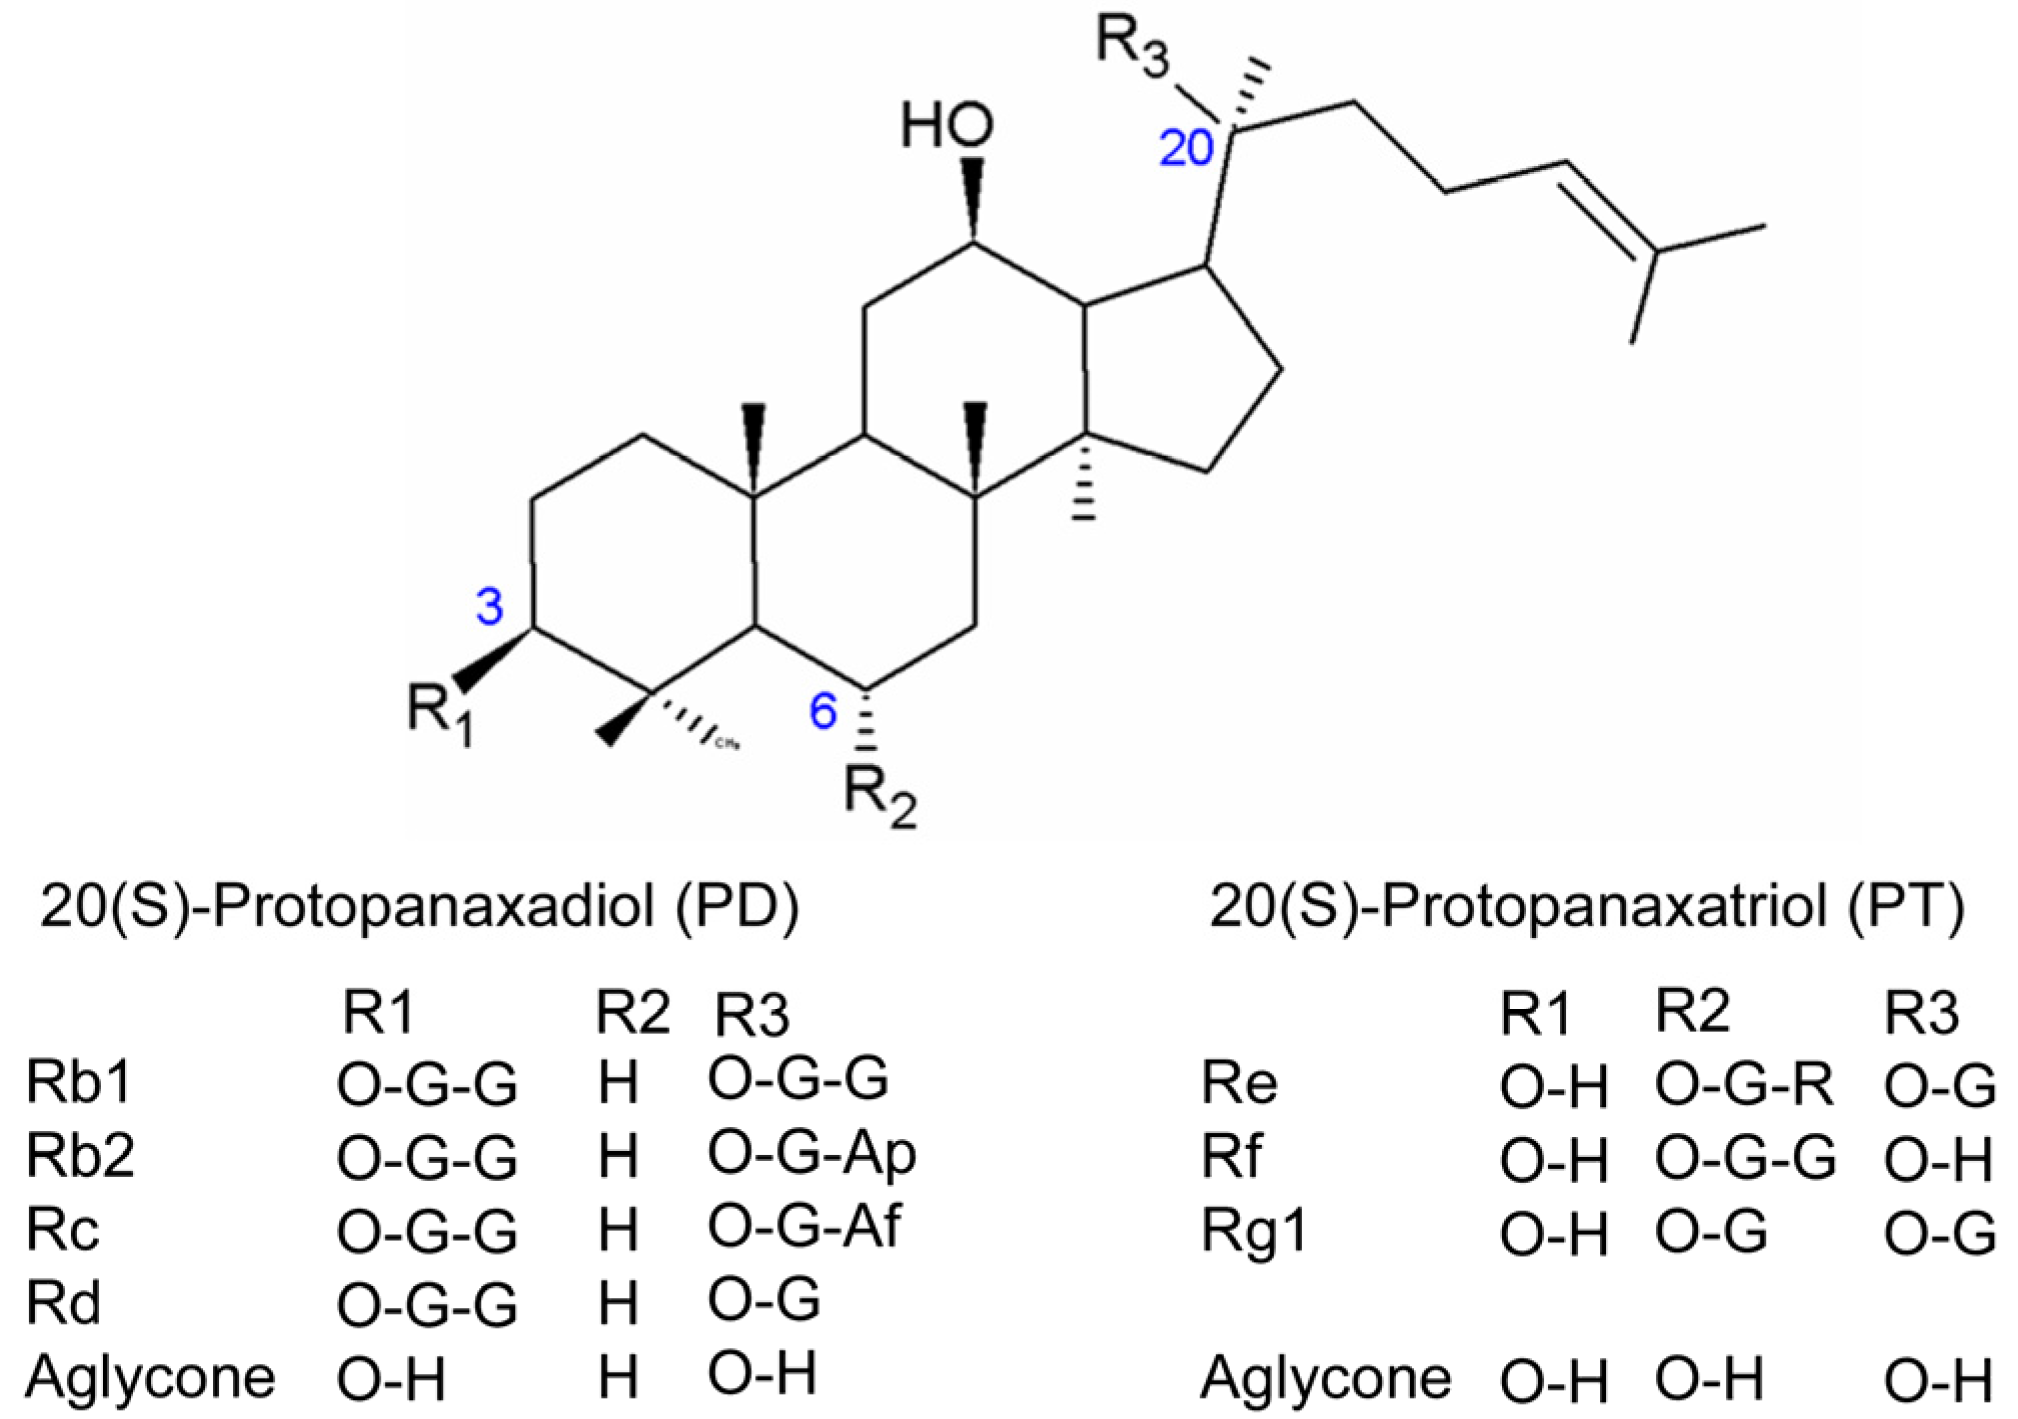
| Ginsenosides retention order | Empirical Formula | Molecular weight (Da) | Concentration within extract (mg g−1) | Main Ion Fragments, m/z | |
|---|---|---|---|---|---|
| [M − H]− | Others | ||||
| Rg1 | C42H72O14 | 801 | 47.40 ± 4.28 | 799.6 | 841.5, 885.3, 927.6 |
| Re | C48H82O18 | 947 | 61.62 ± 5.10 | 945.5 | 991.4,1110.4,1149.3 |
| Rf | C42H72O14 | 801 | 6.14 ± 0.28 | 799.6 | 835.5, 1127.4 |
| Rb1 | C54H92O23 | 1109 | 21.73 ± 1.29 | 1107.8 | 1153.3, 1170.5 |
| Rc | C53H90O22 | 1079 | 78.79 ± 4.15 | 1077.6 | 1123.3,1209.6,1462.7 |
| Rb2 | C53H90O22 | 1079 | 56.80 ± 3.79 | 1077.6 | 1123.4,1150.4, 1209.6 |
| Rd | C42H72O14 | 947 | 5.90 ± 0.41 | 945.6 | 991.4, 1119.5 |
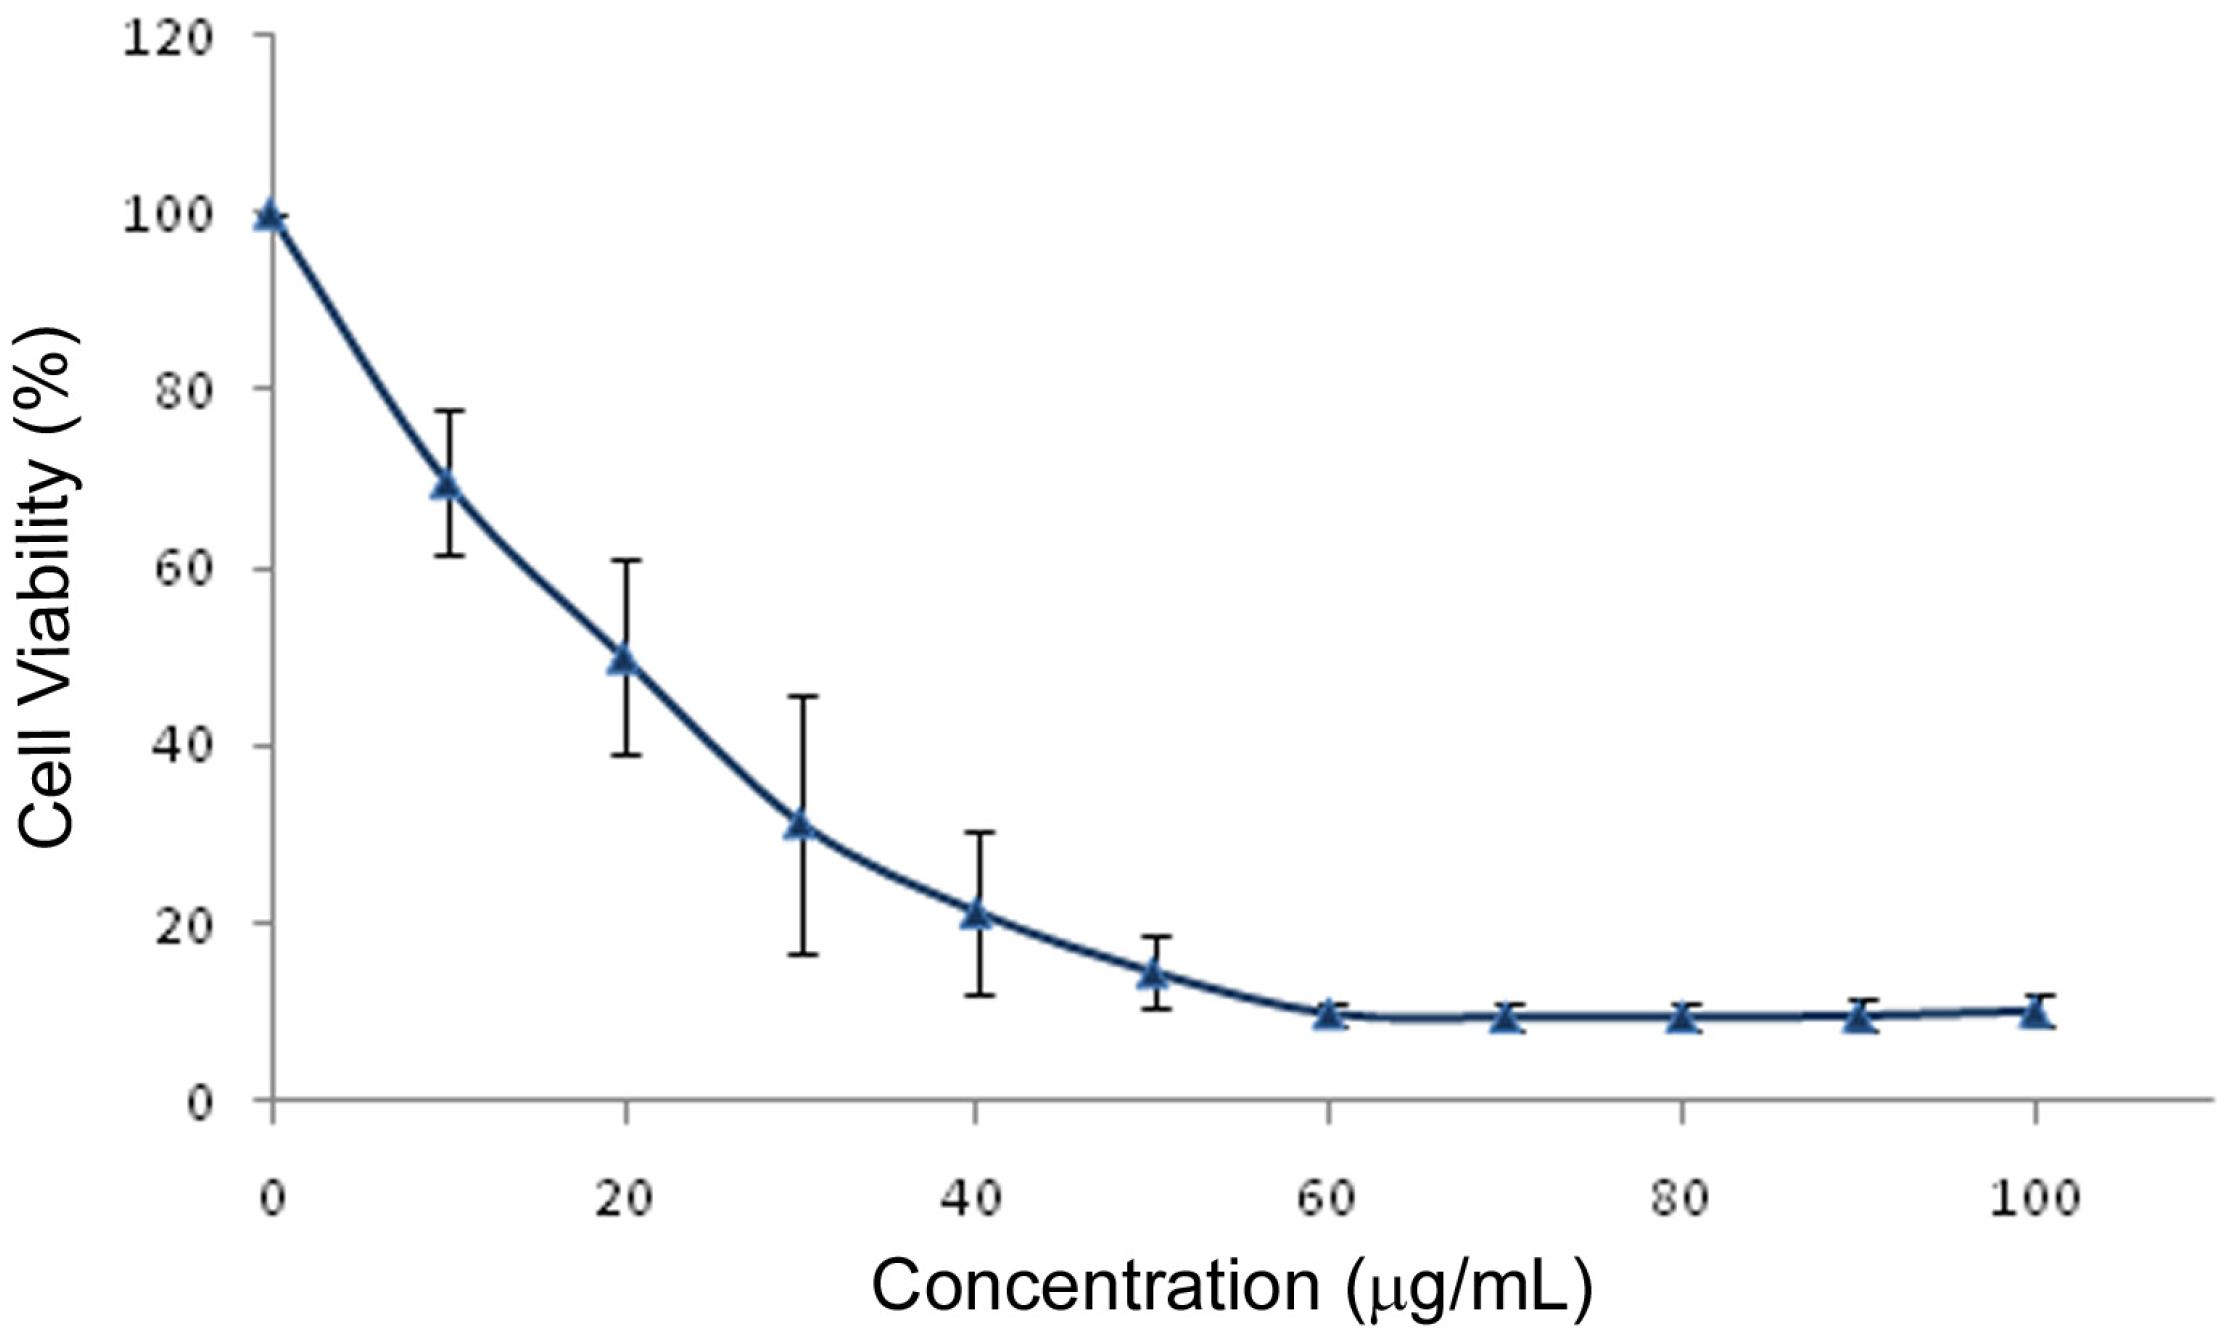
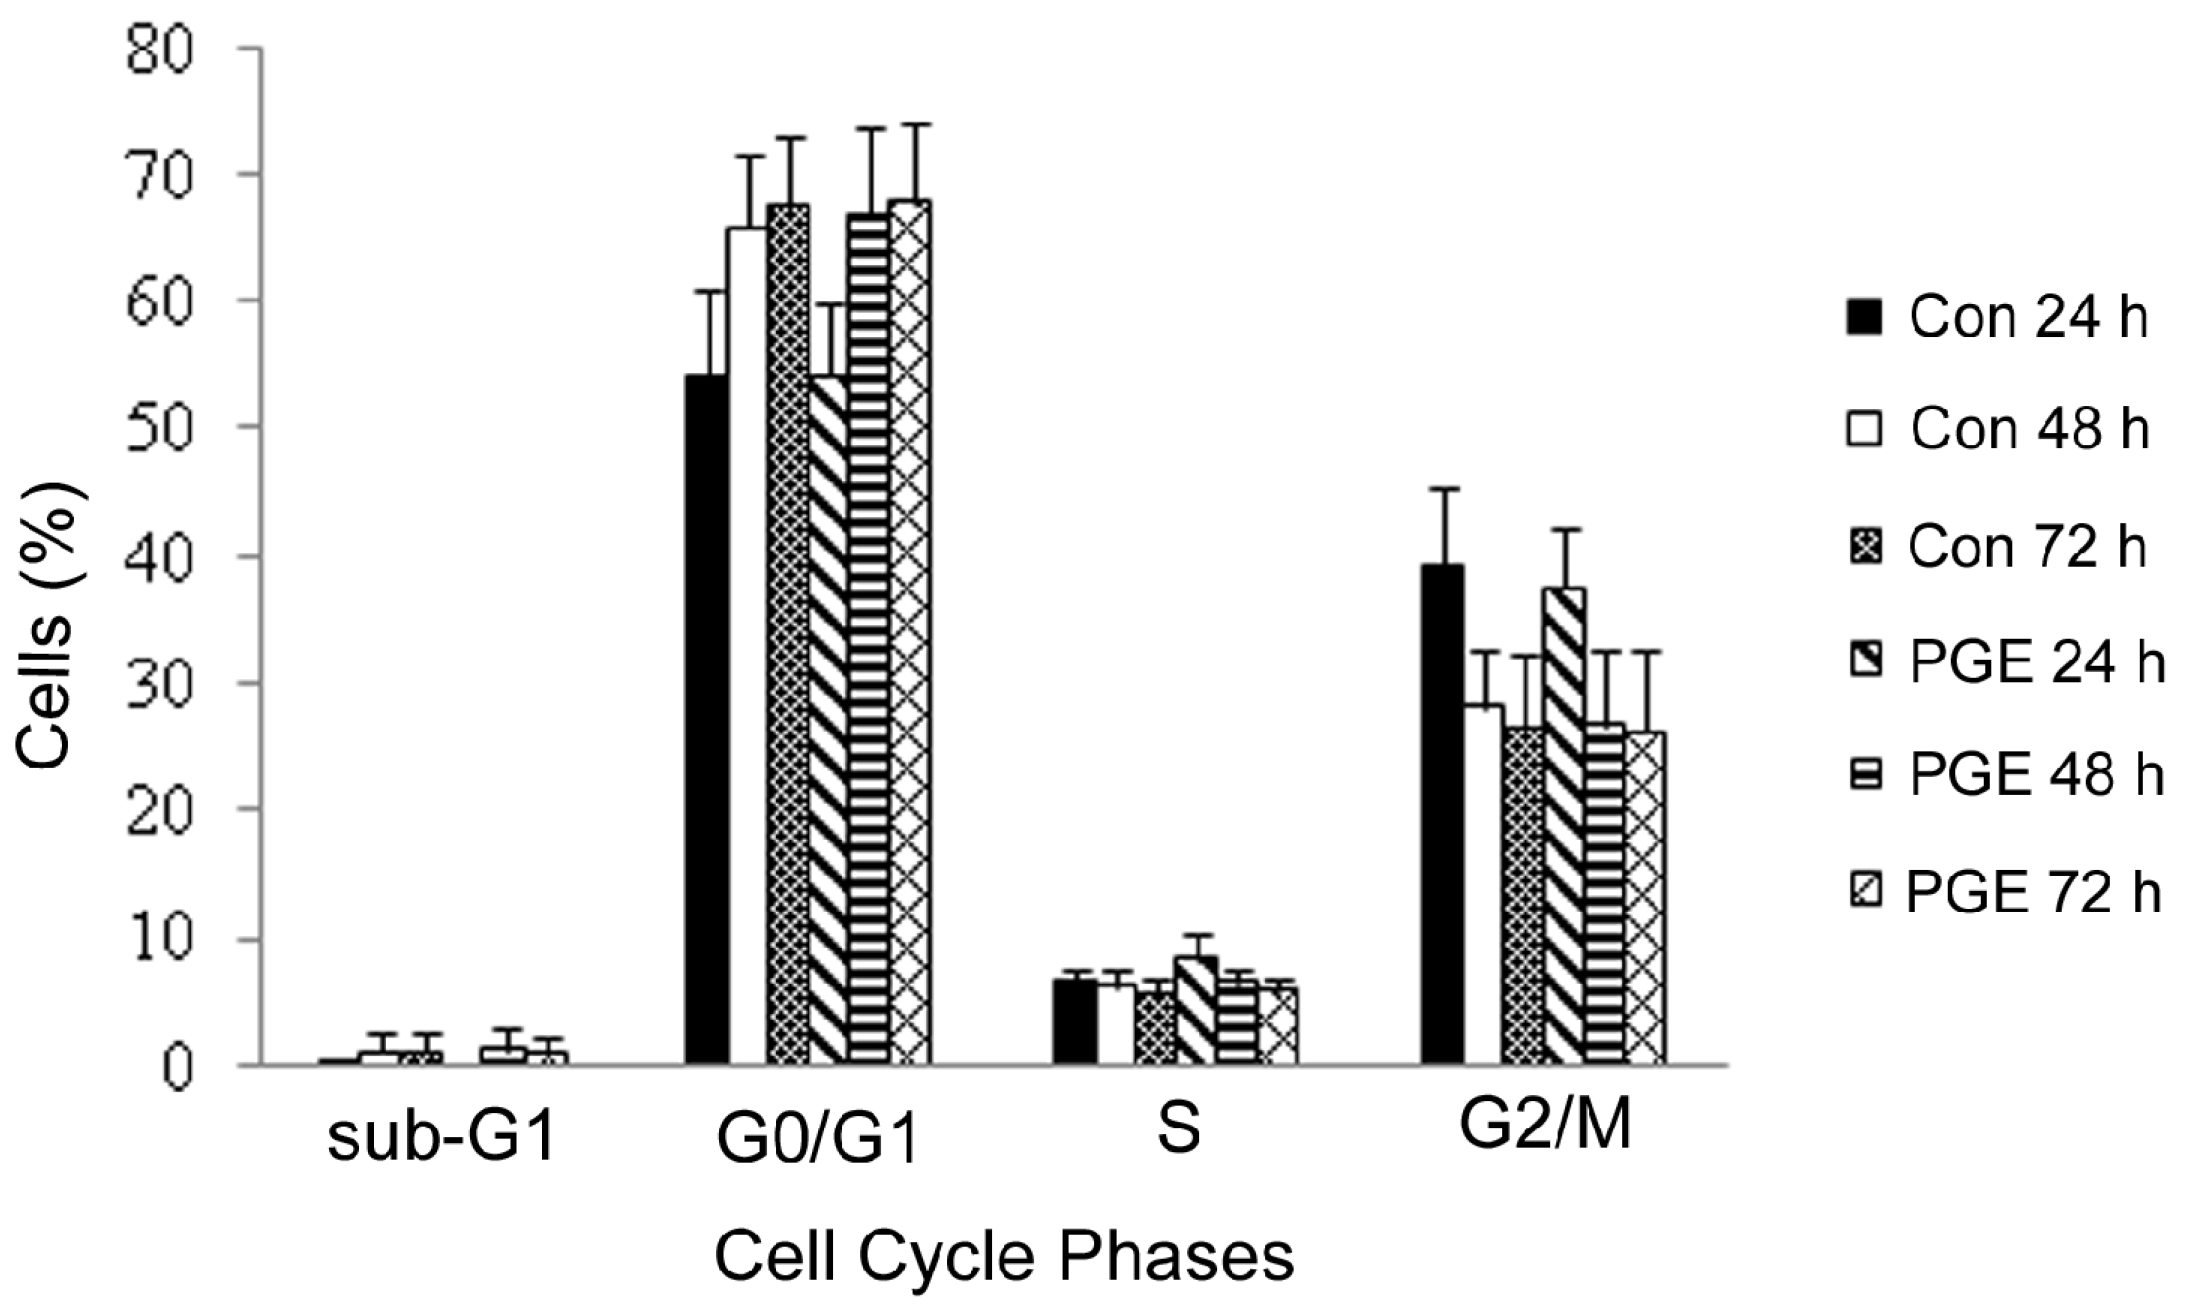
2.2. MTT LC50 Determination and Cell Cycle Distribution


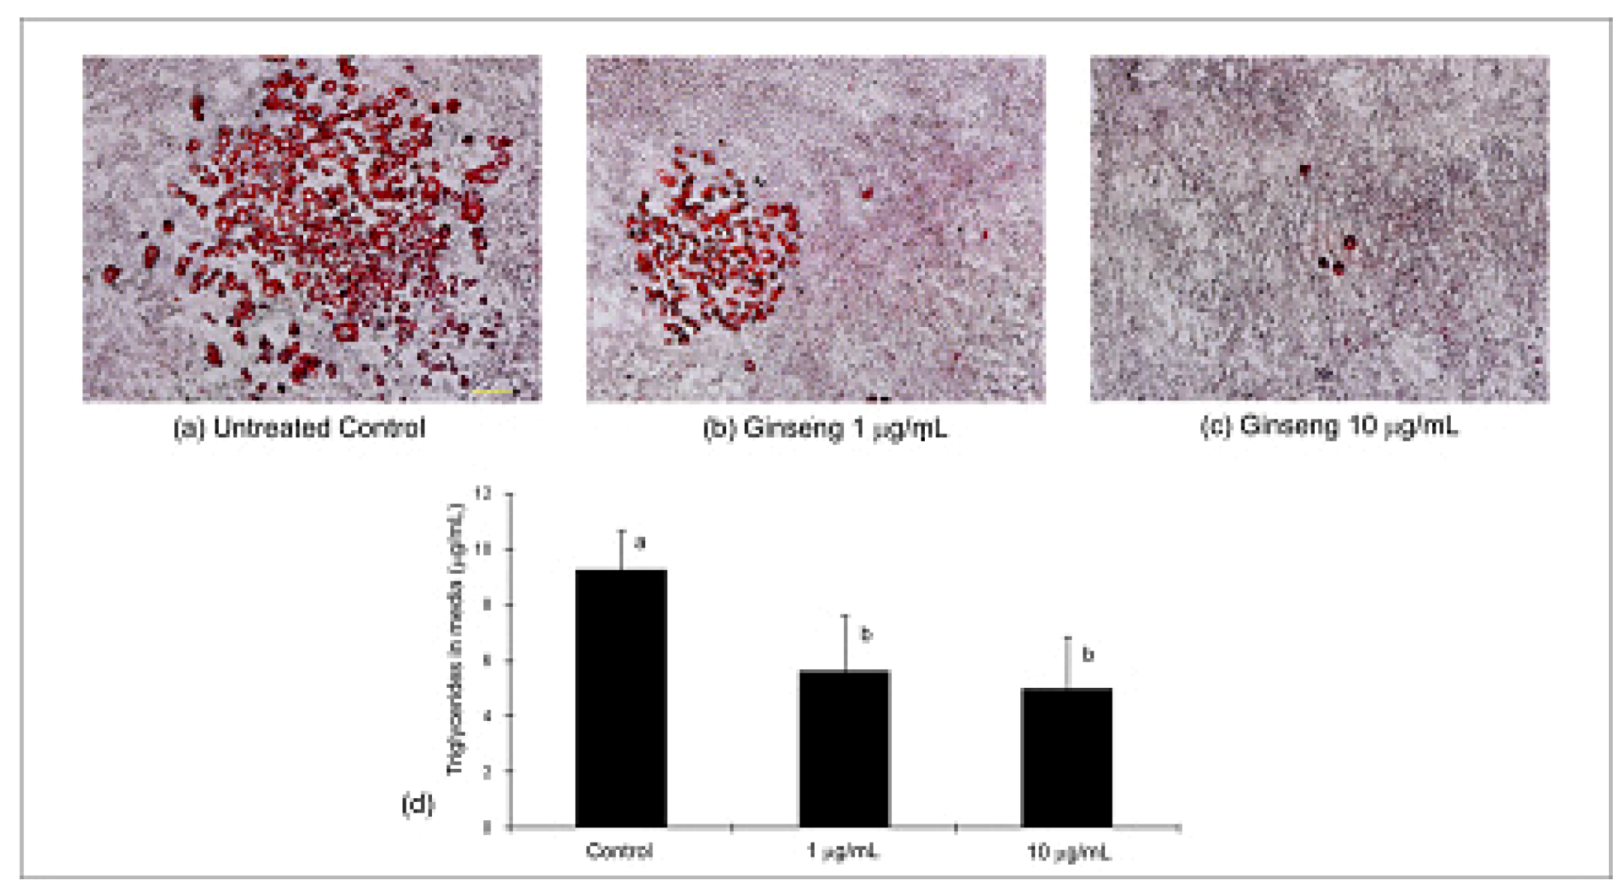
2.3. Differentiation, Oil Red O Lipid Staining and Triglycerides
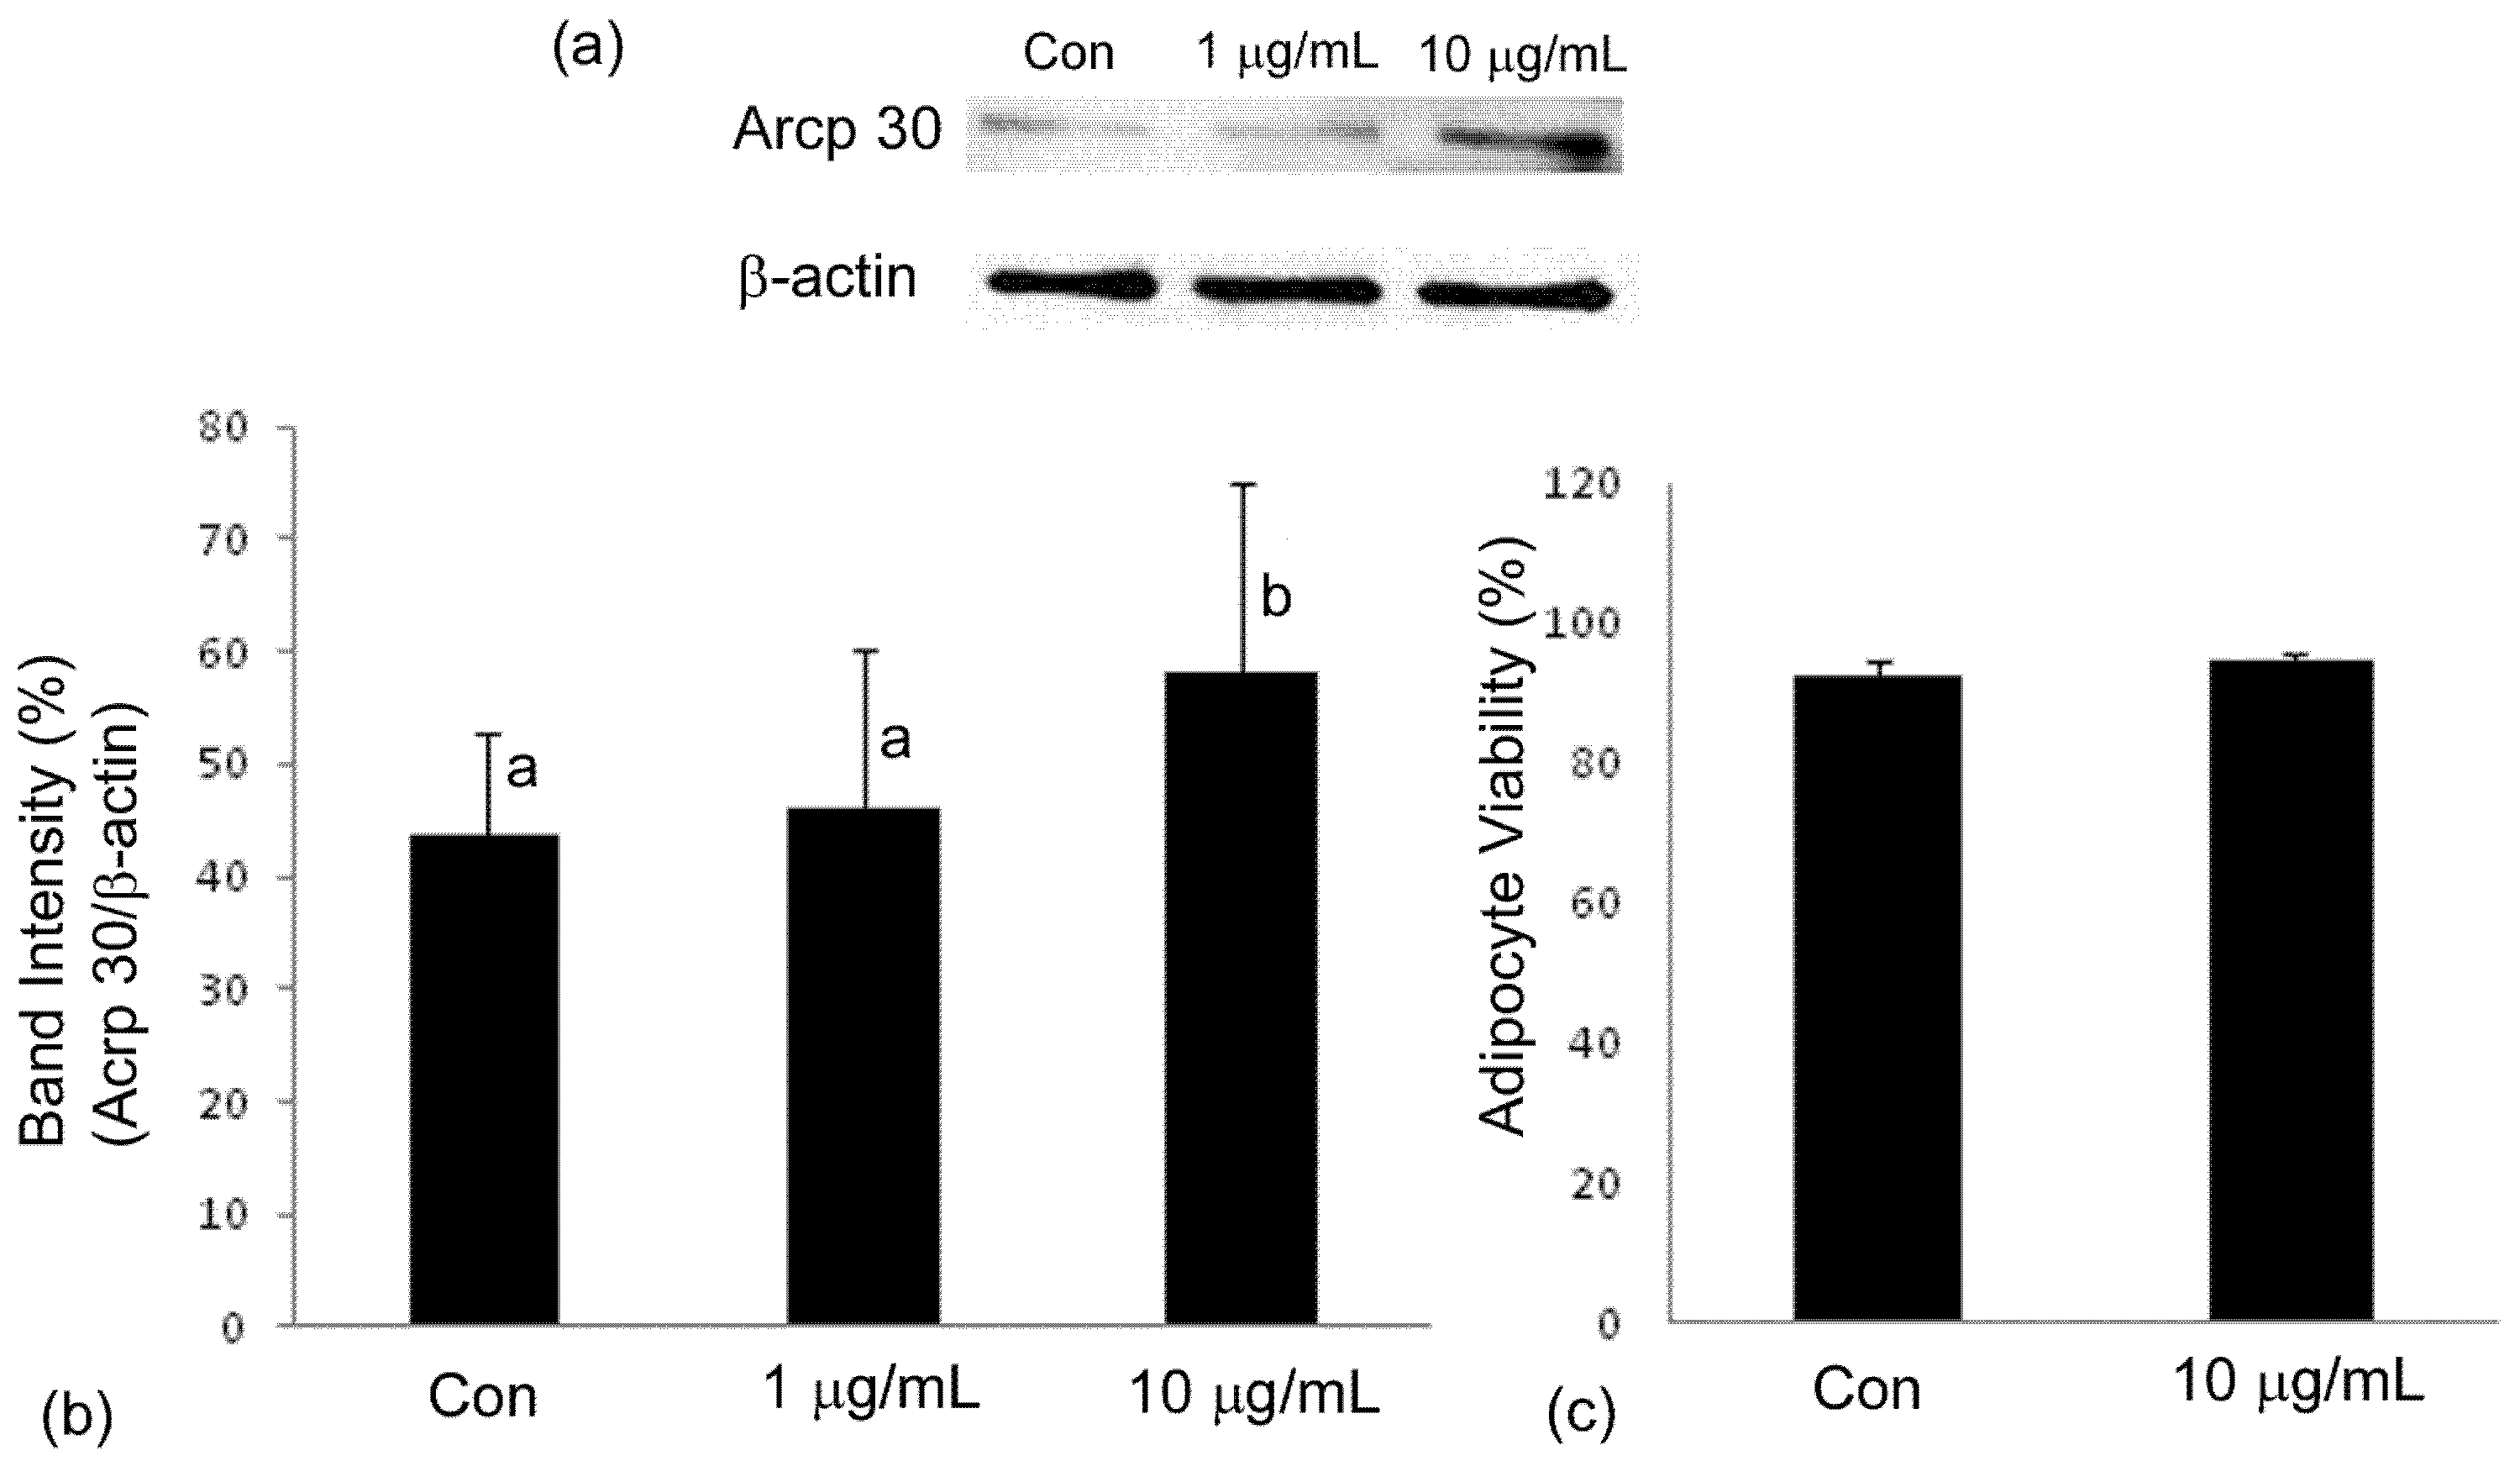
2.4. Adiponectin Expression
3. Discussion
4. Experimental
4.1. Extraction of Plant Material
4.2. HPLC and ESI-MS Analysis
4.3. Cell Culture
4.4. Cell Viability MTT Assay Dose-Response
4.5. Cell Cycle Analysis
4.6. Induction of Adipogenesis
4.7. Oil Red O Staining and Quantification of Triglycerides
4.8. Adipocyte Viability and Western Blot Analysis
4.9. Statistical Methods
5. Conclusions
Acknowledgements
References and Notes
- Gregoire, F.M.; Smas, C.M.; Sul, H.S. Understanding adipocyte differentiation. Physiol. Rev. 1998, 78, 783–809. [Google Scholar]
- Gregoire, F.M. Adipocyte differentiation: from fibroblast to endocrine cell. Exp. Biol. Med. (Maywood.) 2001, 226, 997–1002. [Google Scholar]
- Nawrocki, A.R.; Scherer, P.E. Keynote review: the adipocyte as a drug discovery target. Drug Discov. Today 2005, 10, 1219–1230. [Google Scholar] [CrossRef]
- Fu, Y.; Luo, N.; Klein, R.L.; Garvey, W.T. Adiponectin promotes adipocyte differentiation, insulin sensitivity, and lipid accumulation. J. Lipid Res. 2005, 46, 1369–1379. [Google Scholar] [CrossRef]
- Popovich, D.G.; Li, L.; Zhang, W. Bitter melon (Momordica charantia) triterpenoid extract reduces preadipocyte viability, lipid accumulation and adiponectin expression in 3T3-L1 cells. Food Chem. Toxicol. 2010, 48, 1619–1626. [Google Scholar] [CrossRef]
- Jeon, T.; Hwang, S.G.; Hirai, S.; Matsui, T.; Yano, H.; Kawada, T.; Lim, B.O.; Park, D.K. Red yeast rice extracts suppress adipogenesis by down-regulating adipogenic transcription factors and gene expression in 3T3-L1 cells. Life Sci. 2004, 75, 3195–3203. [Google Scholar] [CrossRef]
- Lee, I.; Seo, J.; Kim, J.; Kim, H.; Youn, U.; Lee, J.; Jung, H.; Na, M.; Hattori, M.; Min, B.; Bae, K. Lanostane triterpenes from the fruiting bodies of Ganoderma lucidum and their inhibitory effects on adipocyte differentiation in 3T3-L1 Cells. J. Nat. Prod. 2010, 73, 172–176. [Google Scholar] [CrossRef]
- Lee, I.; Kim, H.; Youn, U.; Kim, J.; Min, B.; Jung, H.; Na, M.; Hattori, M.; Bae, K. Effect of lanostane triterpenes from the fruiting bodies of Ganoderma lucidum on adipocyte differentiation in 3T3-L1 cells. Planta Med. 2010, 76, 1558–1563. [Google Scholar] [CrossRef]
- Attele, A.S.; Wu, J.A.; Yuan, C.S. Ginseng pharmacology: multiple constituents and multiple actions. Biochem. Pharmacol. 1999, 58, 1685–1693. [Google Scholar] [CrossRef]
- Gillis, C.N. Panax ginseng pharmacology: A nitric oxide link? Biochem. Pharmacol. 1997, 54, 1–8. [Google Scholar] [CrossRef]
- Huang, Y.C.; Lin, C.Y.; Huang, S.F.; Lin, H.C.; Chang, W.L.; Chang, T.C. Effect and mechanism of ginsenosides CK and Rg1 on stimulation of glucose uptake in 3T3-L1 adipocytes. J. Agric. Food Chem. 2010, 58, 6039–6047. [Google Scholar] [CrossRef]
- Kim, E.J.; Lee, H.I.; Chung, K.J.; Noh, Y.H.; Ro, Y.; Koo, J.H. The Ginsenoside-Rb2 lowers cholesterol and triacylglycerol levels in 3T3-L1 adipocytes cultured under high cholesterol or fatty acids conditions. BMB Reports 2009, 42, 194–199. [Google Scholar] [CrossRef]
- Niu, C.S.; Yeh, C.H.; Yeh, M.F.; Cheng, J.T. Increase of adipogenesis by ginsenoside (Rh2) in 3T3-L1 cell via an activation of glucocorticoid receptor. Horm. Metab. Res. 2009, 41, 271–276. [Google Scholar] [CrossRef]
- Hwang, J.T.; Lee, M.S.; Kim, H.J.; Sung, M.J.; Kim, H.Y.; Kim, M.S.; Kwon, D.Y. Antiobesity effect of ginsenoside Rg3 involves the AMPK and PPAR-gamma signal pathways. Phytother. Res. 2009, 23, 262–266. [Google Scholar] [CrossRef]
- Yeo, C.R.; Lee, S.M.; Popovich, D.G. Ginseng (Panax quinquefolius) reduces cell growth, lipid acquisition and increases adiponectin expression in 3T3-L1 cells. Evid. Based. Complement Alternat. Med. 2010. [Google Scholar] [CrossRef]
- Abbasi, F.; Chu, J.W.; Lamendola, C.; McLaughlin, T.; Hayden, J.; Reaven, G.M.; Reaven, P.D. Discrimination between obesity and insulin resistance in the relationship with adiponectin. Diabetes 2004, 53, 585–590. [Google Scholar] [CrossRef]
- Lee, M.S.; Kim, C.T.; Kim, I.H.; Kim, Y. Inhibitory effects of green tea catechin on the lipid accumulation in 3T3-L1 adipocytes. Phytother. Res. 2009, 23, 1088–1091. [Google Scholar] [CrossRef]
- Feve, B. Adipogenesis: cellular and molecular aspects. Best Pract. Res Clin. Endocrinol. Metab. 2005, 19, 483–499. [Google Scholar] [CrossRef]
- He, M.L.; Wang, Y.; You, J.S.; Mir, P.S.; McAllister, T.A. Effect of a seaweed extract on fatty acid accumulation and glycerol-3-phosphate dehydrogenase activity in 3T3-L1 adipocytes. Lipids 2009, 44, 125–132. [Google Scholar] [CrossRef]
- Shang, W.; Yang, Y.; Jiang, B.; Jin, H.; Zhou, L.; Liu, S.; Chen, M. Ginsenoside Rb1 promotes adipogenesis in 3T3-L1 cells by enhancing PPARgamma2 and C/EBPalpha gene expression. Life Sci. 2007, 80, 618–625. [Google Scholar] [CrossRef]
- Wink, M. Evolutionary advantage and molecular modes of action of multi-component mixtures used in phytomedicine. Curr. Drug Metab. 2008, 9, 996–1009. [Google Scholar] [CrossRef]
- Han, K.L.; Jung, M.H.; Sohn, J.H.; Hwang, J.K. Ginsenoside 20S-protopanaxatriol (PPT) activates peroxisome proliferator-activated receptor gamma (PPARgamma) in 3T3-L1 adipocytes. Biol. Pharm. Bull. 2006, 29, 110–113. [Google Scholar] [CrossRef]
- Park, S.; Ahn, I.S.; Kwon, D.Y.; Ko, B.S.; Jun, W.K. Ginsenosides Rb1 and Rg1 suppress triglyceride accumulation in 3T3-L1 adipocytes and enhance beta-cell insulin secretion and viability in Min6 cells via PKA-dependent pathways. Biosci. Biotechnol. Biochem. 2008, 72, 2815–2823. [Google Scholar] [CrossRef]
- Hwang, J.T.; Kim, S.H.; Lee, M.S.; Kim, S.H.; Yang, H.J.; Kim, M.J.; Kim, H.S.; Ha, J.; Kim, M.S.; Kwon, D.Y. Anti-obesity effects of ginsenoside Rh2 are associated with the activation of AMPK signaling pathway in 3T3-L1 adipocyte. Biochem. Biophys. Res. Commun. 2007, 364, 1002–1008. [Google Scholar] [CrossRef]
- Kim, S.N.; Lee, J.H.; Shin, H.; Son, S.H.; Kim, Y.S. Effects of in vitro-digested ginsenosides on lipid accumulation in 3T3-L1 adipocytes. Planta Med. 2009, 75, 596–601. [Google Scholar] [CrossRef]
- Attele, A.S.; Zhou, Y.P.; Xie, J.T.; Wu, J.A.; Zhang, L.; Dey, L.; Pugh, W.; Rue, P.A.; Polonsky, K.S.; Yuan, C.S. Antidiabetic effects of Panax ginseng berry extract and the identification of an effective component. Diabetes 2002, 51, 1851–1858. [Google Scholar] [CrossRef]
- Kim, J.H.; Kang, S.A.; Han, S.M.; Shim, I. Comparison of the antiobesity effects of the protopanaxadiol- and protopanaxatriol-type saponins of red ginseng. Phytother. Res. 2009, 23, 78–85. [Google Scholar] [CrossRef]
- Lee, H.J.; Lee, Y.H.; Park, S.K.; Kang, E.S.; Kim, H.J.; Lee, Y.C.; Choi, C.S.; Park, S.E.; Ahn, C.W.; Cha, B.S.; Lee, K.W.; Kim, K.S.; Lim, S.K.; Lee, H.C. Korean red ginseng (Panax ginseng) improves insulin sensitivity and attenuates the development of diabetes in Otsuka Long-Evans Tokushima fatty rats. Metabolism 2009, 58, 1170–1177. [Google Scholar]
- Yun, S.N.; Moon, S.J.; Ko, S.K.; Im, B.O.; Chung, S.H. Wild ginseng prevents the onset of high-fat diet induced hyperglycemia and obesity in ICR mice. Arch. Pharm. Res 2004, 27, 790–796. [Google Scholar] [CrossRef]
- Wang, H.; Reaves, L.A.; Edens, N.K. Ginseng extract inhibits lipolysis in rat adipocytes in vitro by activating phosphodiesterase 4. J. Nutr. 2006, 136, 337–342. [Google Scholar]
- Kim, S.H.; Park, K.S. Effects of Panax ginseng extract on lipid metabolism in humans. Pharmacol. Res. 2003, 48, 511–513. [Google Scholar] [CrossRef]
- Dridi, S.; Taouis, M. Adiponectin and energy homeostasis: consensus and controversy. J. Nutr. Biochem. 2009, 20, 831–839. [Google Scholar] [CrossRef]
- Fasshauer, M.; Klein, J.; Neumann, S.; Eszlinger, M.; Paschke, R. Hormonal regulation of adiponectin gene expression in 3T3-L1 adipocytes. Biochem. Biophys. Res. Commun. 2002, 290, 1084–1089. [Google Scholar] [CrossRef]
- Gil-Campos, M.; Canete, R.R.; Gil, A. Adiponectin, the missing link in insulin resistance and obesity. Clin. Nutr. 2004, 23, 963–974. [Google Scholar] [CrossRef]
- Whitehead, J.P.; Richards, A.A.; Hickman, I.J.; Macdonald, G.A.; Prins, J.B.; Weyer, C.; Funahashi, T.; Tanaka, S.; Hotta, K.; Matsuzawa, Y.; Pratley, R.E.; Tataranni, P.A. Adiponectin--a key adipokine in the metabolic syndrome Hypoadiponectinemia in obesity and type 2 diabetes: close association with insulin resistance and hyperinsulinemia. Diabetes Obes. Metab. 2006, 8, 264–280. [Google Scholar] [CrossRef]
- Sun, Y.; Xun, K.; Wang, C.; Zhao, H.; Bi, H.; Chen, X.; Wang, Y. Adiponectin, an unlocking adipocytokine. Cardiovasc. Ther. 2009, 27, 59–75. [Google Scholar] [CrossRef]
- Pajvani, U.B.; Hawkins, M.; Combs, T.P.; Rajala, M.W.; Doebber, T.; Berger, J.P.; Wagner, J.A.; Wu, M.; Knopps, A.; Xiang, A.H.; Utzschneider, K.M.; Kahn, S.E.; Olefsky, J.M.; Buchanan, T.A.; Scherer, P.E. Complex distribution, not absolute amount of adiponectin, correlates with thiazolidinedione-mediated improvement in insulin sensitivity. J. Biol. Chem. 2004, 279, 12152–12162. [Google Scholar]
- Yamauchi, T.; Kamon, J.; Waki, H.; Terauchi, Y.; Kubota, N.; Hara, K.; Mori, Y.; Ide, T.; Murakami, K.; Tsuboyama-Kasaoka, N.; et al. The fat-derived hormone adiponectin reverses insulin resistance associated with both lipoatrophy and obesity. Nat. Med. 2001, 7, 941–946. [Google Scholar] [CrossRef]
- Loo, L.H.; Lin, H.J.; Singh, D.K.; Lyons, K.M.; Altschuler, S.J.; Wu, L.F. Heterogeneity in the physiological states and pharmacological responses of differentiating 3T3-L1 preadipocytes. J. Cell Biol. 2009, 187, 375–384. [Google Scholar] [CrossRef]
- Chang, Y.; Huang, W.J.; Tien, L.T.; Wang, S.J. Ginsenosides Rg1 and Rb1 enhance glutamate release through activation of protein kinase A in rat cerebrocortical nerve terminals (synaptosomes). Eur. J. Pharmacol. 2008, 578, 28–36. [Google Scholar] [CrossRef]
- Chen, C.F.; Chiou, W.F.; Zhang, J.T. Comparison of the pharmacological effects of Panax ginseng and Panax quinquefolium. Acta Pharmacol. Sin. 2008, 29, 1103–1108. [Google Scholar] [CrossRef]
- Chang, Y.; Wang, S.J. Ginsenoside Rg1 and Rb1 enhance glutamate exocytosis from rat cortical nerve terminals by affecting vesicle mobilization through the activation of protein kinase C. Eur. J. Pharmacol. 2008, 590, 74–79. [Google Scholar] [CrossRef]
- Wang, W.; Zhao, Y.; Rayburn, E.R.; Hill, D.L.; Wang, H.; Zhang, R. In vitro anti-cancer activity and structure-activity relationships of natural products isolated from fruits of Panax ginseng. Cancer Chemother. Pharmacol. 2007, 59, 589–601. [Google Scholar] [CrossRef]
- Kim, Y.S.; Kim, D.S.; Kim, S.I. Ginsenoside Rh2 and Rh3 induce differentiation of HL-60 cells into granulocytes: modulation of protein kinase C isoforms during differentiation by ginsenoside Rh2. Int. J. Biochem. Cell Biol. 1998, 30, 327–338. [Google Scholar] [CrossRef]
- Popovich, D.G.; Kitts, D.D. Generation of ginsenosides Rg3 and Rh2 from North American ginseng. Phytochemistry 2004, 65, 337–344. [Google Scholar] [CrossRef]
- Popovich, D.G.; Yeo, S.Y.; Zhang, W. Ginseng (Panax quinquefolius) and Licorice (Glycyrrhiza uralensis) root extract combinations increase hepatocarcinoma cell (Hep-G2) viability. Evid. Based. Complement Alternat. Med. 2009. [Google Scholar] [CrossRef]
- Li, W.; Gu, C.; Zhang, H.; Awang, D.V.; Fitzloff, J.F.; Fong, H.H.; van Breemen, R.B. Use of high-performance liquid chromatography-tandem mass spectrometry to distinguish Panax ginseng C. A. Meyer (Asian ginseng) and Panax quinquefolius L. (North American ginseng). Anal. Chem 2000, 72, 5417–5422. [Google Scholar] [CrossRef]
- Zhang, W.; Yeo, M.C.; Tang, F.Y.; Popovich, D.G. Bioactive responses of Hep-G2 cells to soyasaponin extracts differs with respect to extraction conditions. Food Chem. Toxicol. 2009, 47, 2202–2208. [Google Scholar] [CrossRef]
- Sample Availability: Samples of the compounds are not available from the authors.
© 2011 by the authors; licensee MDPI, Basel, Switzerland. This article is an open access article distributed under the terms and conditions of the Creative Commons Attribution license ( http://creativecommons.org/licenses/by/3.0/).
Share and Cite
Yeo, C.-R.; Yang, C.; Wong, T.-Y.; Popovich, D.G. A Quantified Ginseng (Panax ginseng C.A. Meyer) Extract Influences Lipid Acquisition and Increases Adiponectin Expression in 3T3-L1 Cells. Molecules 2011, 16, 477-492. https://doi.org/10.3390/molecules16010477
Yeo C-R, Yang C, Wong T-Y, Popovich DG. A Quantified Ginseng (Panax ginseng C.A. Meyer) Extract Influences Lipid Acquisition and Increases Adiponectin Expression in 3T3-L1 Cells. Molecules. 2011; 16(1):477-492. https://doi.org/10.3390/molecules16010477
Chicago/Turabian StyleYeo, Chia-Rou, Chen Yang, Ting-Yan Wong, and David G. Popovich. 2011. "A Quantified Ginseng (Panax ginseng C.A. Meyer) Extract Influences Lipid Acquisition and Increases Adiponectin Expression in 3T3-L1 Cells" Molecules 16, no. 1: 477-492. https://doi.org/10.3390/molecules16010477