1. Introduction
Solanum indicum L., also known as “African nightshade” or “bitter berries”, is cultivated in many parts of Africa and the Arabian Peninsula for culinary purposes. In Ivory Coast
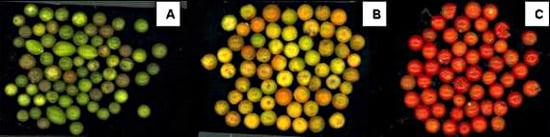
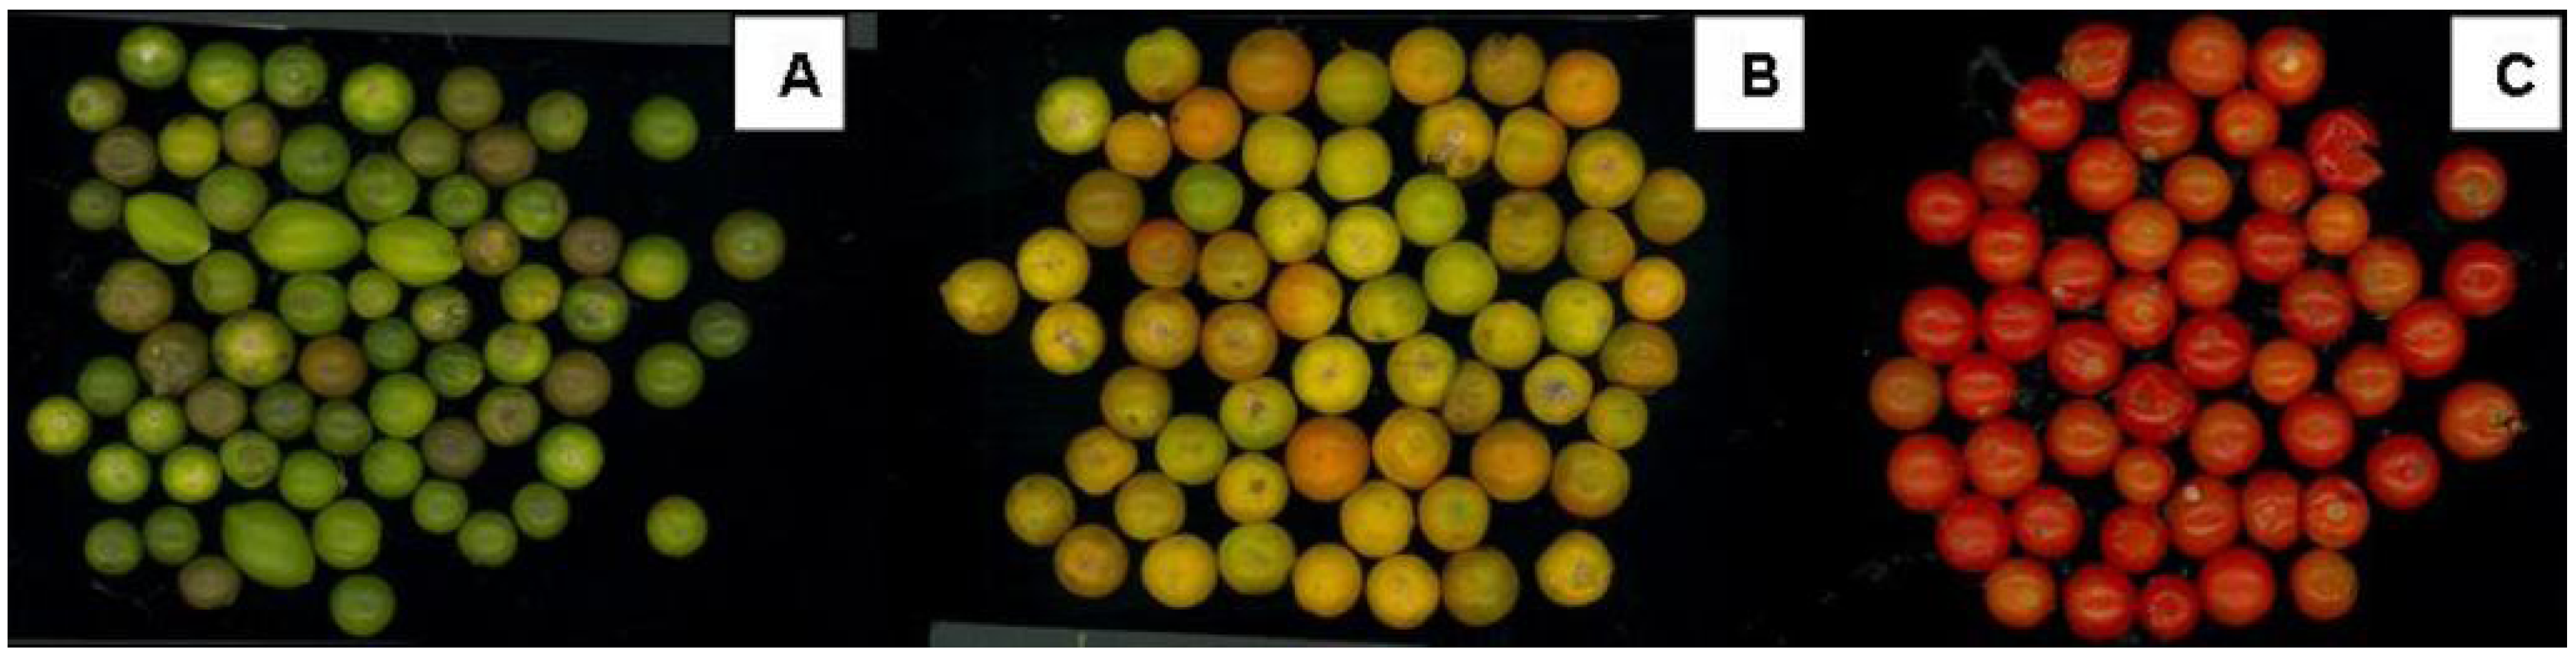
Solanum indicum L., known locally as “Gnagnan”, is consumed fresh or sun dried, usually made as a soup alone or mixed with other vegetables. Like tomato fruits, Gnagnan assumes different colours, from green to yellow, and finally red during its ripening period. During the harvest period, from July to October, the local populations eat the vegetable frequently because the product is fresh and savoury [
1], though little attention is paid to the degree of ripeness. After this period, the dried berries become available on the markets, but the fruits are not particularly appreciated because they become tasteless.
Traditionally
Solanum indicum L. is also used as an herbal remedy for several diseases such as diarrhoea, malaria and prostate diseases. Despite these supposedly beneficial effects on human health, few scientific studies focused on
Solanum indicum L. to assess its composition and demonstrate its health effects. In an
in vivo study, Bahgat
et al. [
2] showed that a standardised extract of
Solanum indicum L. containing more than 0.15% of chlorogenic acids prevented the development of hypertension in rats. Three studies on edible plants from Iran and India demonstrated that these berries had the highest content in phenolics compared to the other plants analysed [
3,
4,
5]. Considering the scarce information available on the composition of Gnagnan, the purpose of this study was to characterize the antioxidant content of the berries at different stages of maturation. This characterisation should allow the definition of the optimal ripening degree at which this food should be consumed in order to introduce the highest amount of antioxidant phytochemicals.
3. Experimental
3.1. Chemical
Ascorbic acid (A) was purchased from Riedel-de Haën (Sigma-Aldrich, St. Louis, MO, USA). Potassium phosphate monobasic was purchased from Fluka (Sigma-Aldrich, St. Louis, MO, USA). Lycopene, trans-β-carotene, quercetin, rutin, quercetin-3-glucoside, naringenin, caffeic, p-coumaric and 3-caffeoylquinic acids, 2,4,6-tripyridyl-s-triazine (TPTZ), and 2,6-di-tert-butyl-p-cresol (BHT) were purchased from Sigma (Sigma-Aldrich, St. Louis, MO, USA). Oxalic acid was purchased from Merck (Darmstadt, Germany). O-Phosphoric acid 88% (v/v) was purchased from BDH Chemicals LTD (Poole, England). All chemicals and solvents (all HPLC-grade) were purchased from Carlo Erba Reagents (Milan, Italy) and from Merck (Darmstadt, Germany). High-purity water was produced in the laboratory by using an Alpha-Q system (Millipore, Marlborough, MA, USA).
3.2. Solanum indicum L. fruits
The Solanum indicum L. berries came from Ivory Coast. All the fruits were purchased from a local market, collected at different ripening stages, with different colours (green, yellow and red) and stored at -80 °C prior to analysis.
3.3. Analysis
The analysis of reduced ascorbic acid were performed according to previously described methods [
23,
24]. The determination of carotenoids was carried out by high-performance liquid chromatography (HPLC) analysis according to Leonardi
et al. [
25]. The phenolic compounds were extracted following the procedure described by Crozier
et al. [
26], and determined by the Folin–Ciocalteu assay [
27]. The total antioxidant capacity (TAC) was determined as previously described by Pellegrini
et al. [
20]. Food extracts were immediately analyzed in triplicate for their antioxidant capacity by ferric reducing antioxidant power (FRAP) assay [
28]. FRAP values were expressed as millimoles of Fe
2+ equivalents per 100 g of sample. All extracts were stored at -80 °C prior to analysis.
3.4. HPLC-DAD analysis
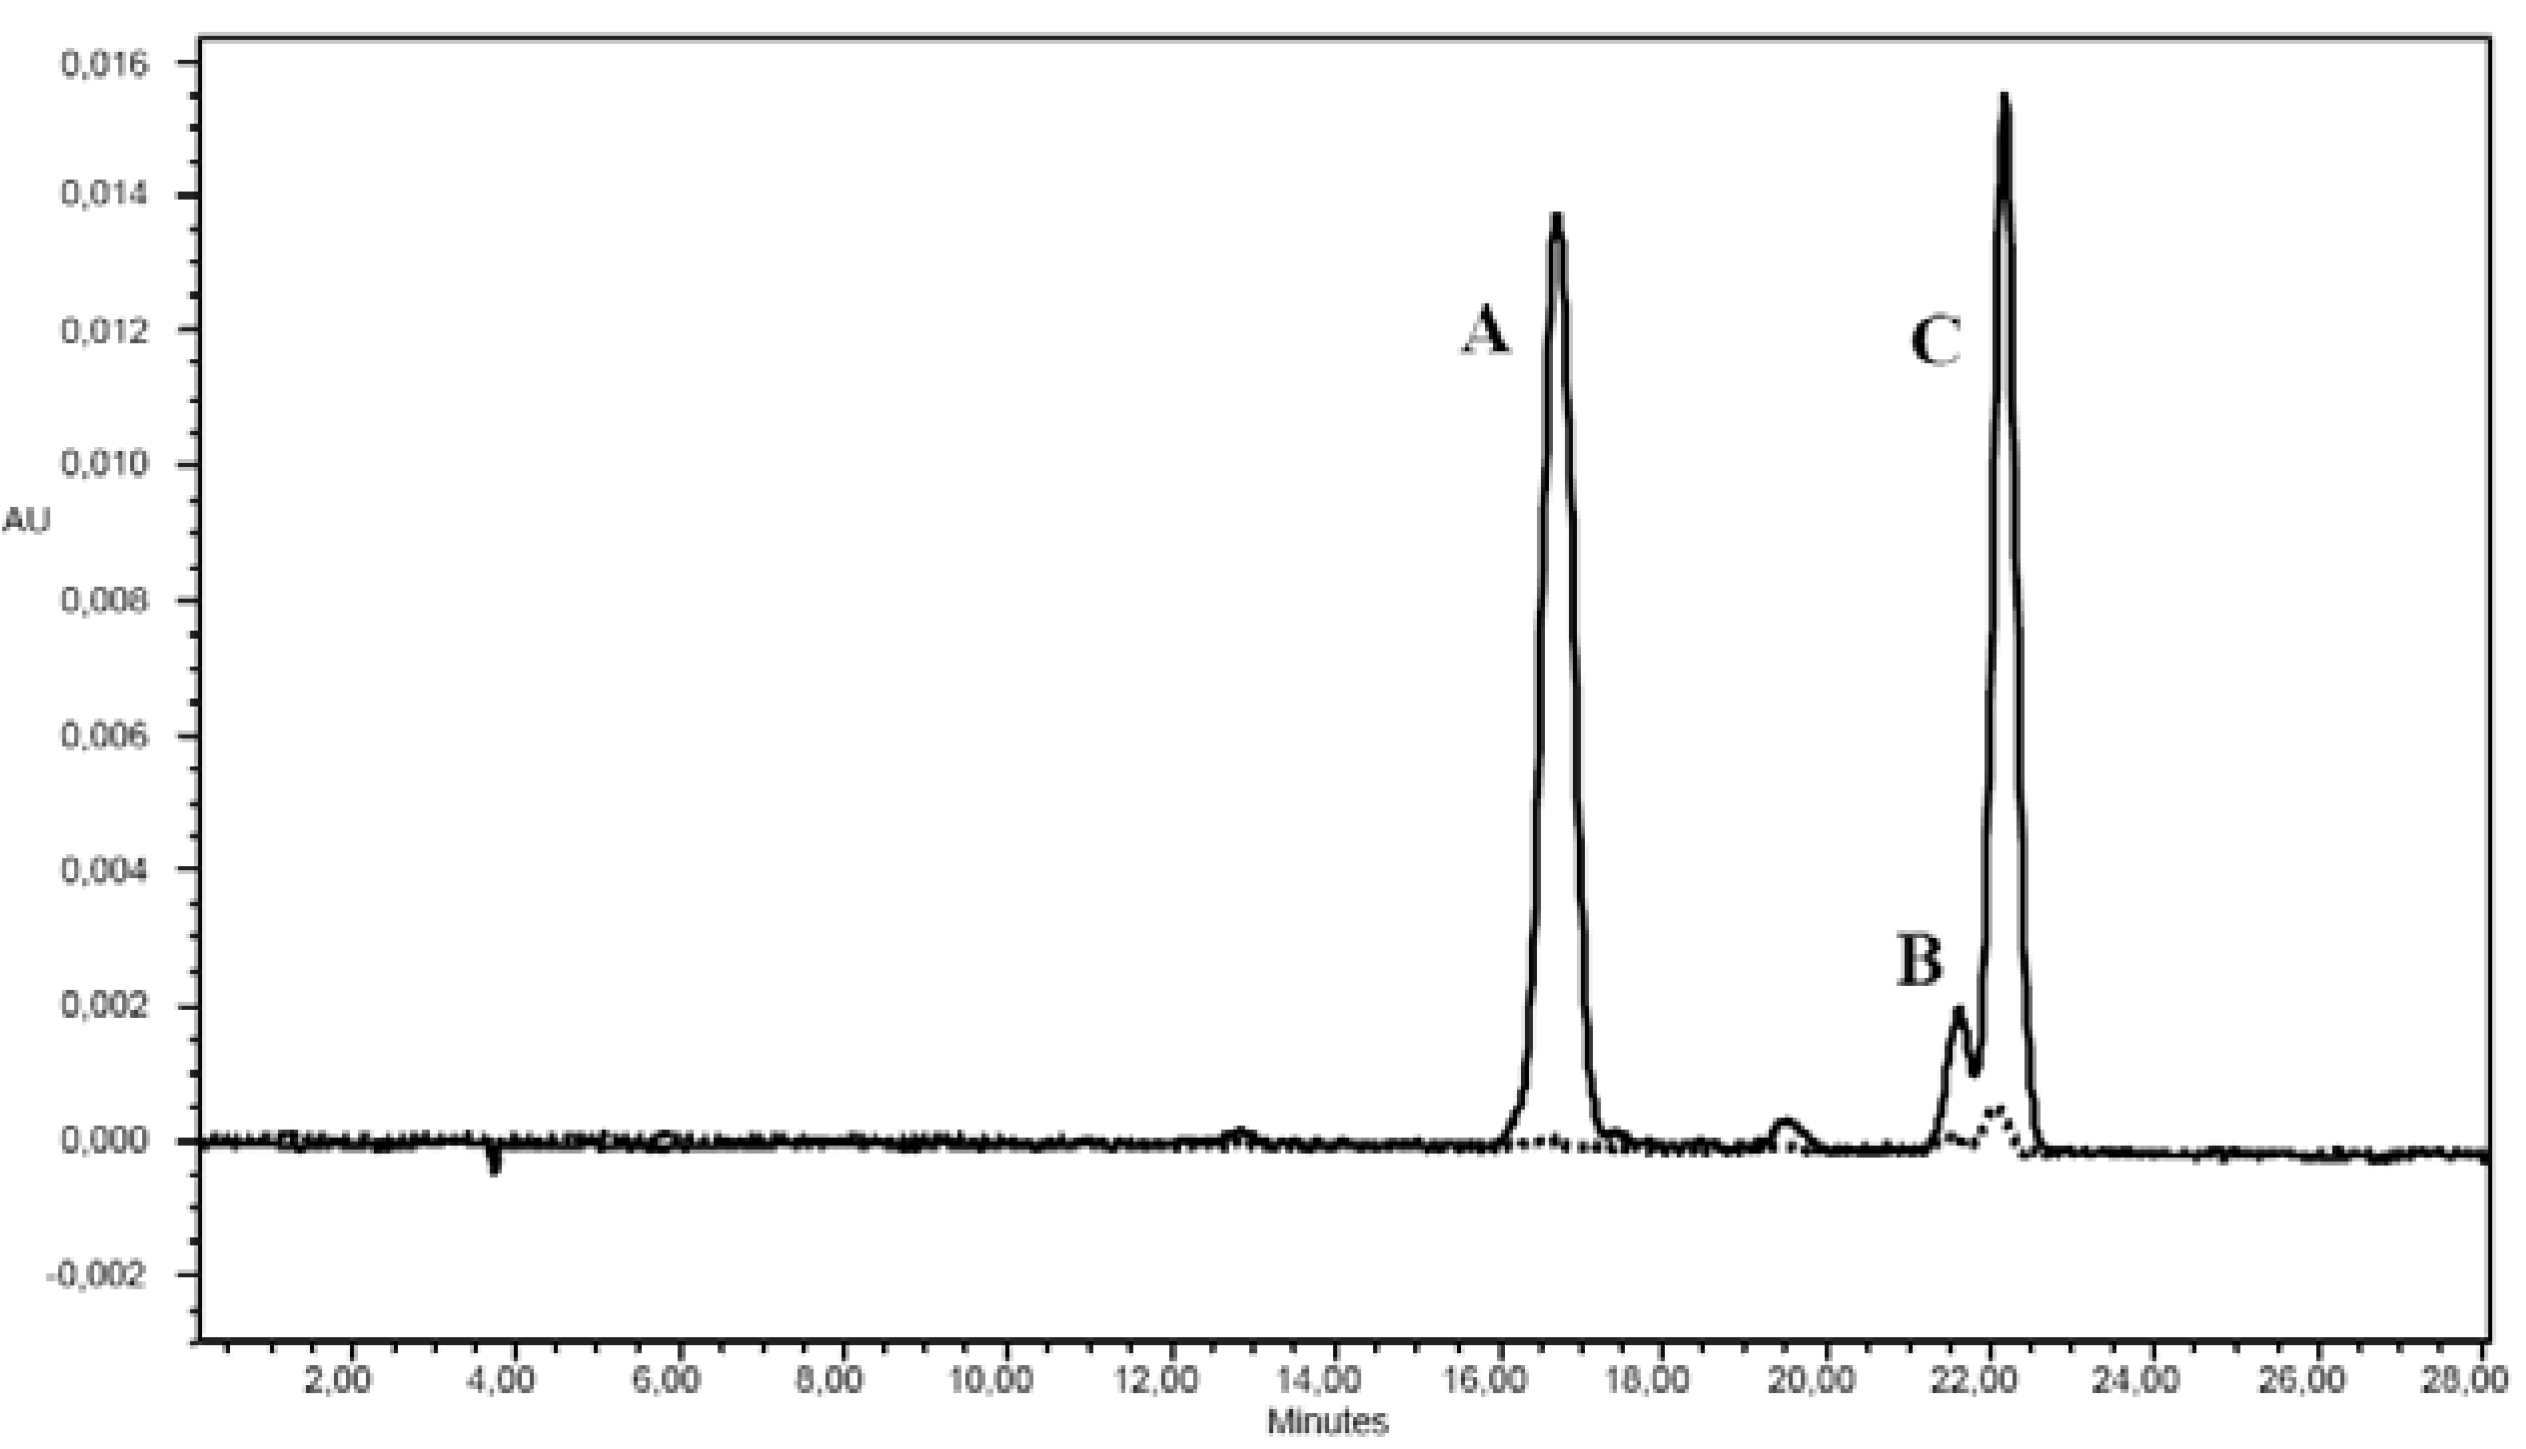
Both ascorbic acid and carotenoids were analyzed using a Hewlett Packard 1100 separation module equipped with a Waters 2996 Photodiode Array Detector (DAD), using a Waters 717 Plus autosampler, and a Millenium32 data processor (Waters, Milford, MA, USA). The ascorbic acid, lycopene and β-carotene content were quantified using the corresponding standard compound, whereas α-carotene was quantified as β-carotene equivalents.
3.5. HPLC-ESI-MS /MS analysis of phenolic compounds
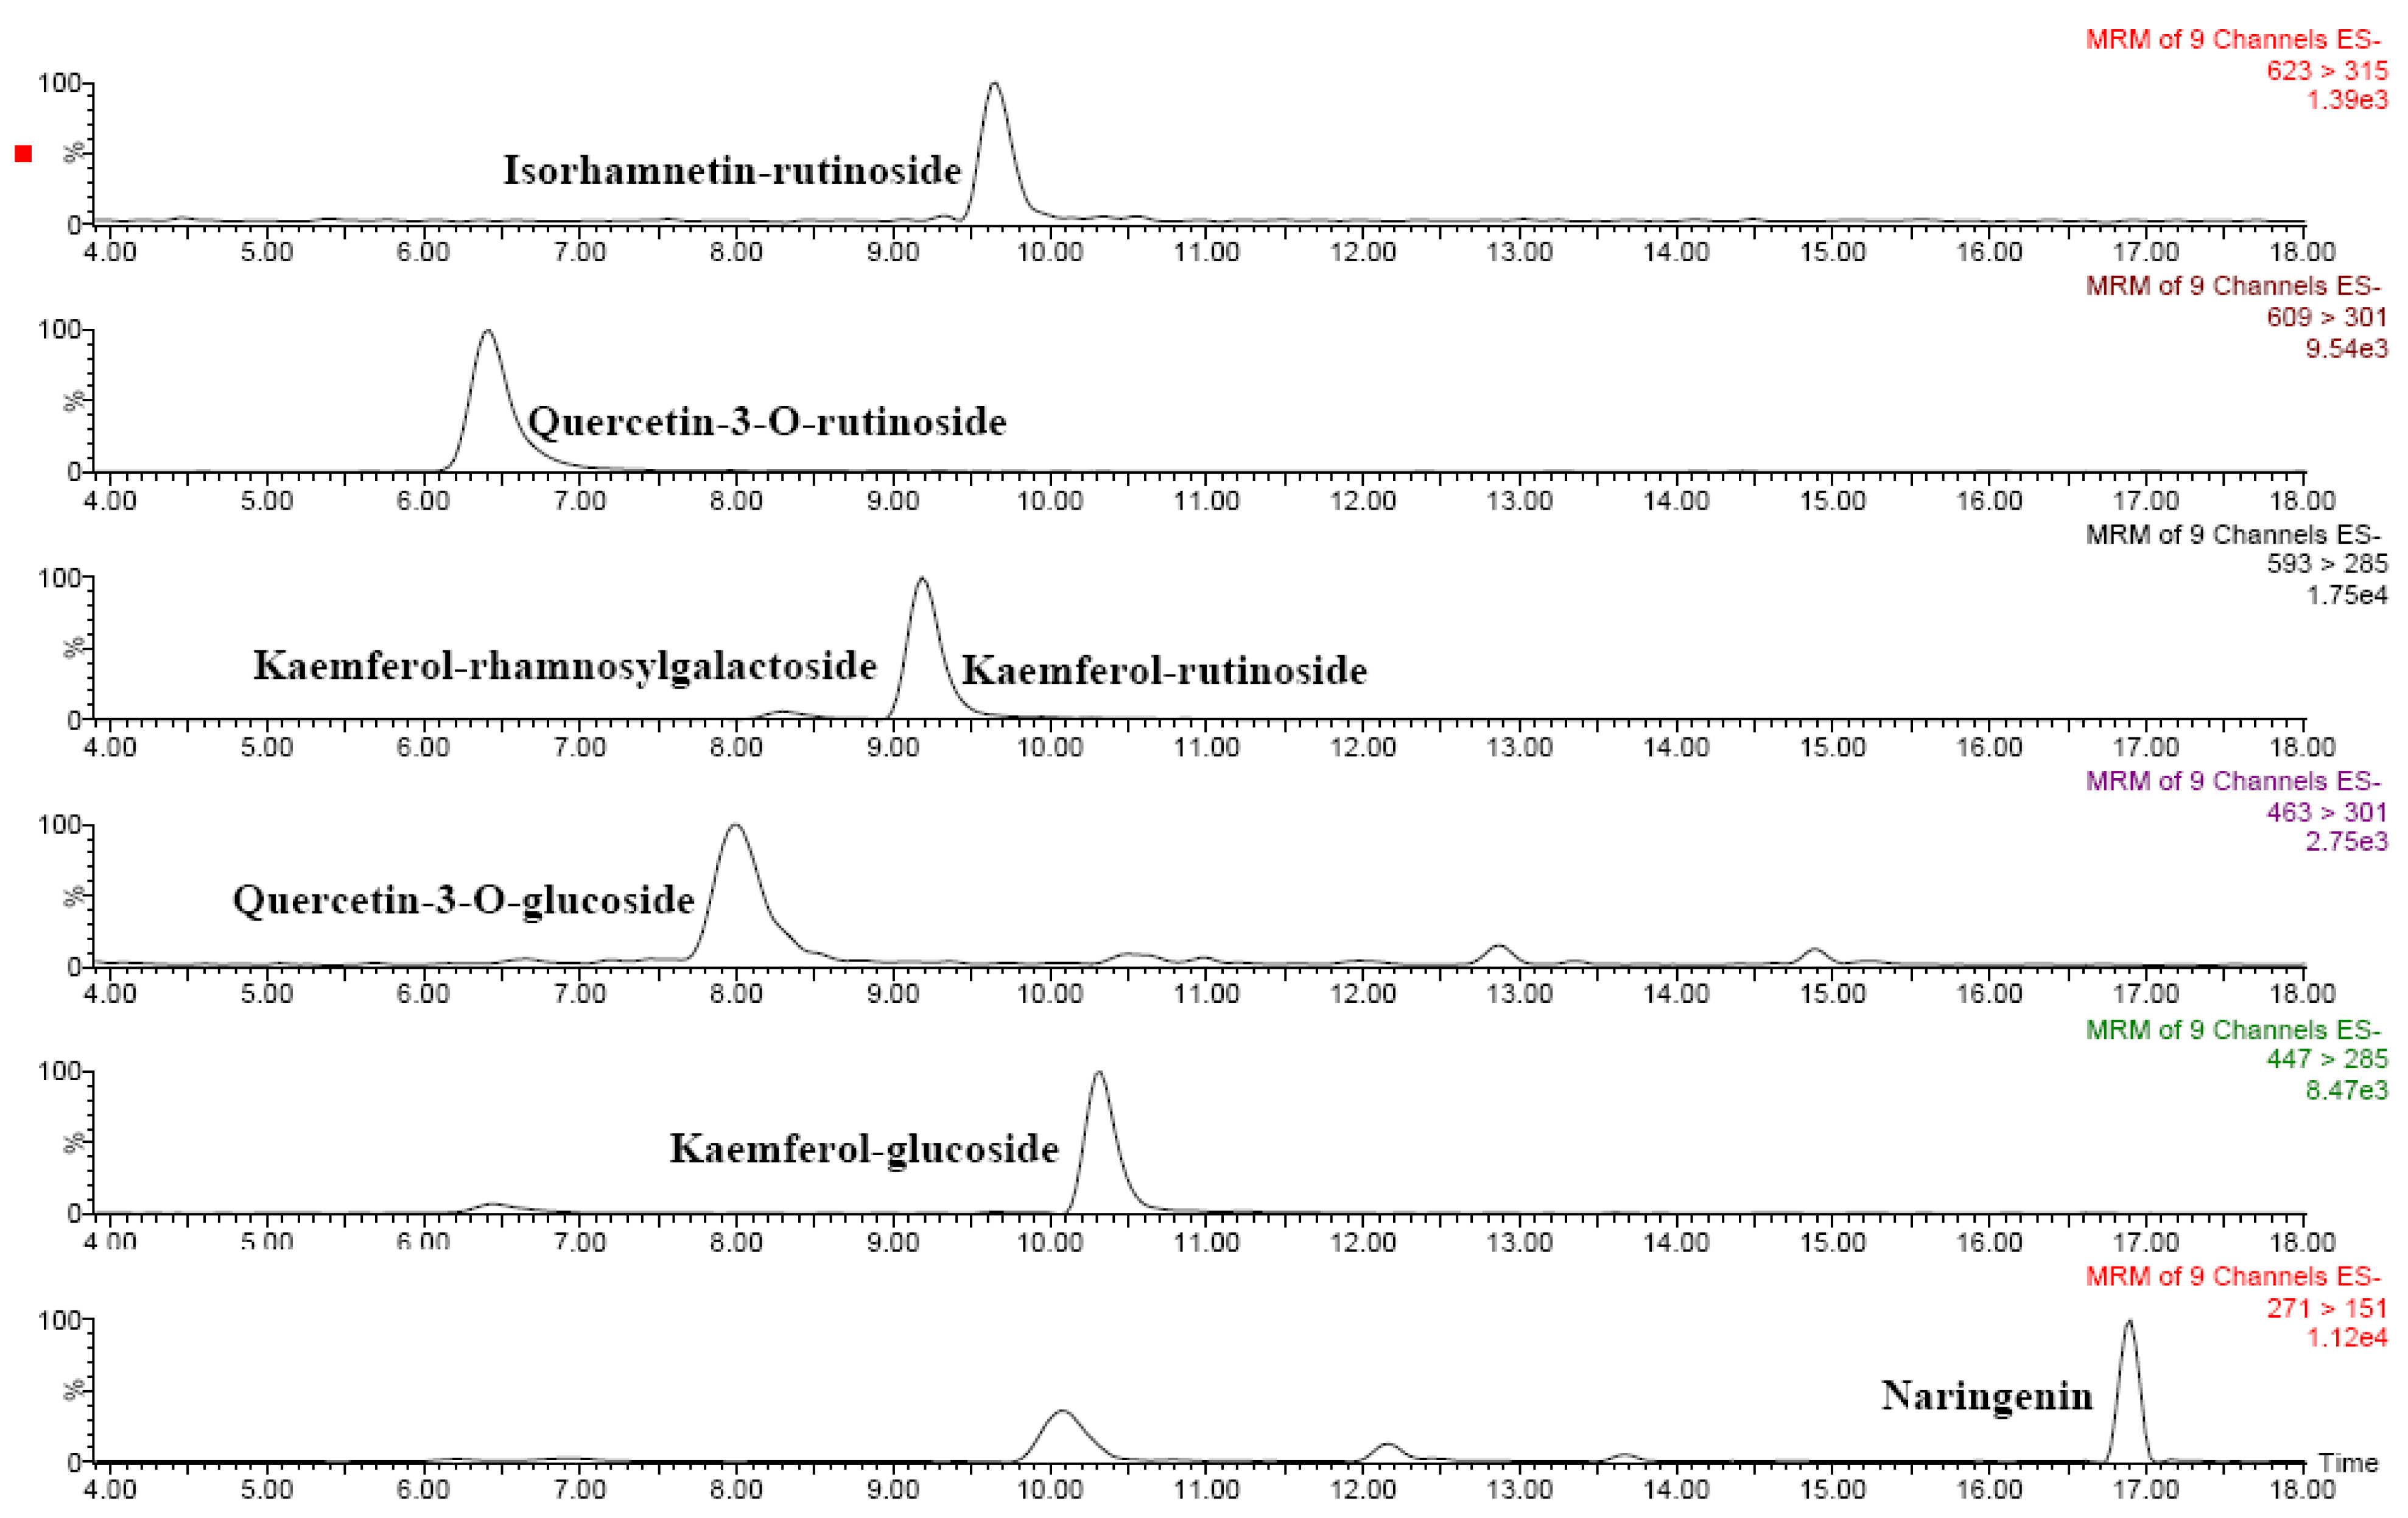
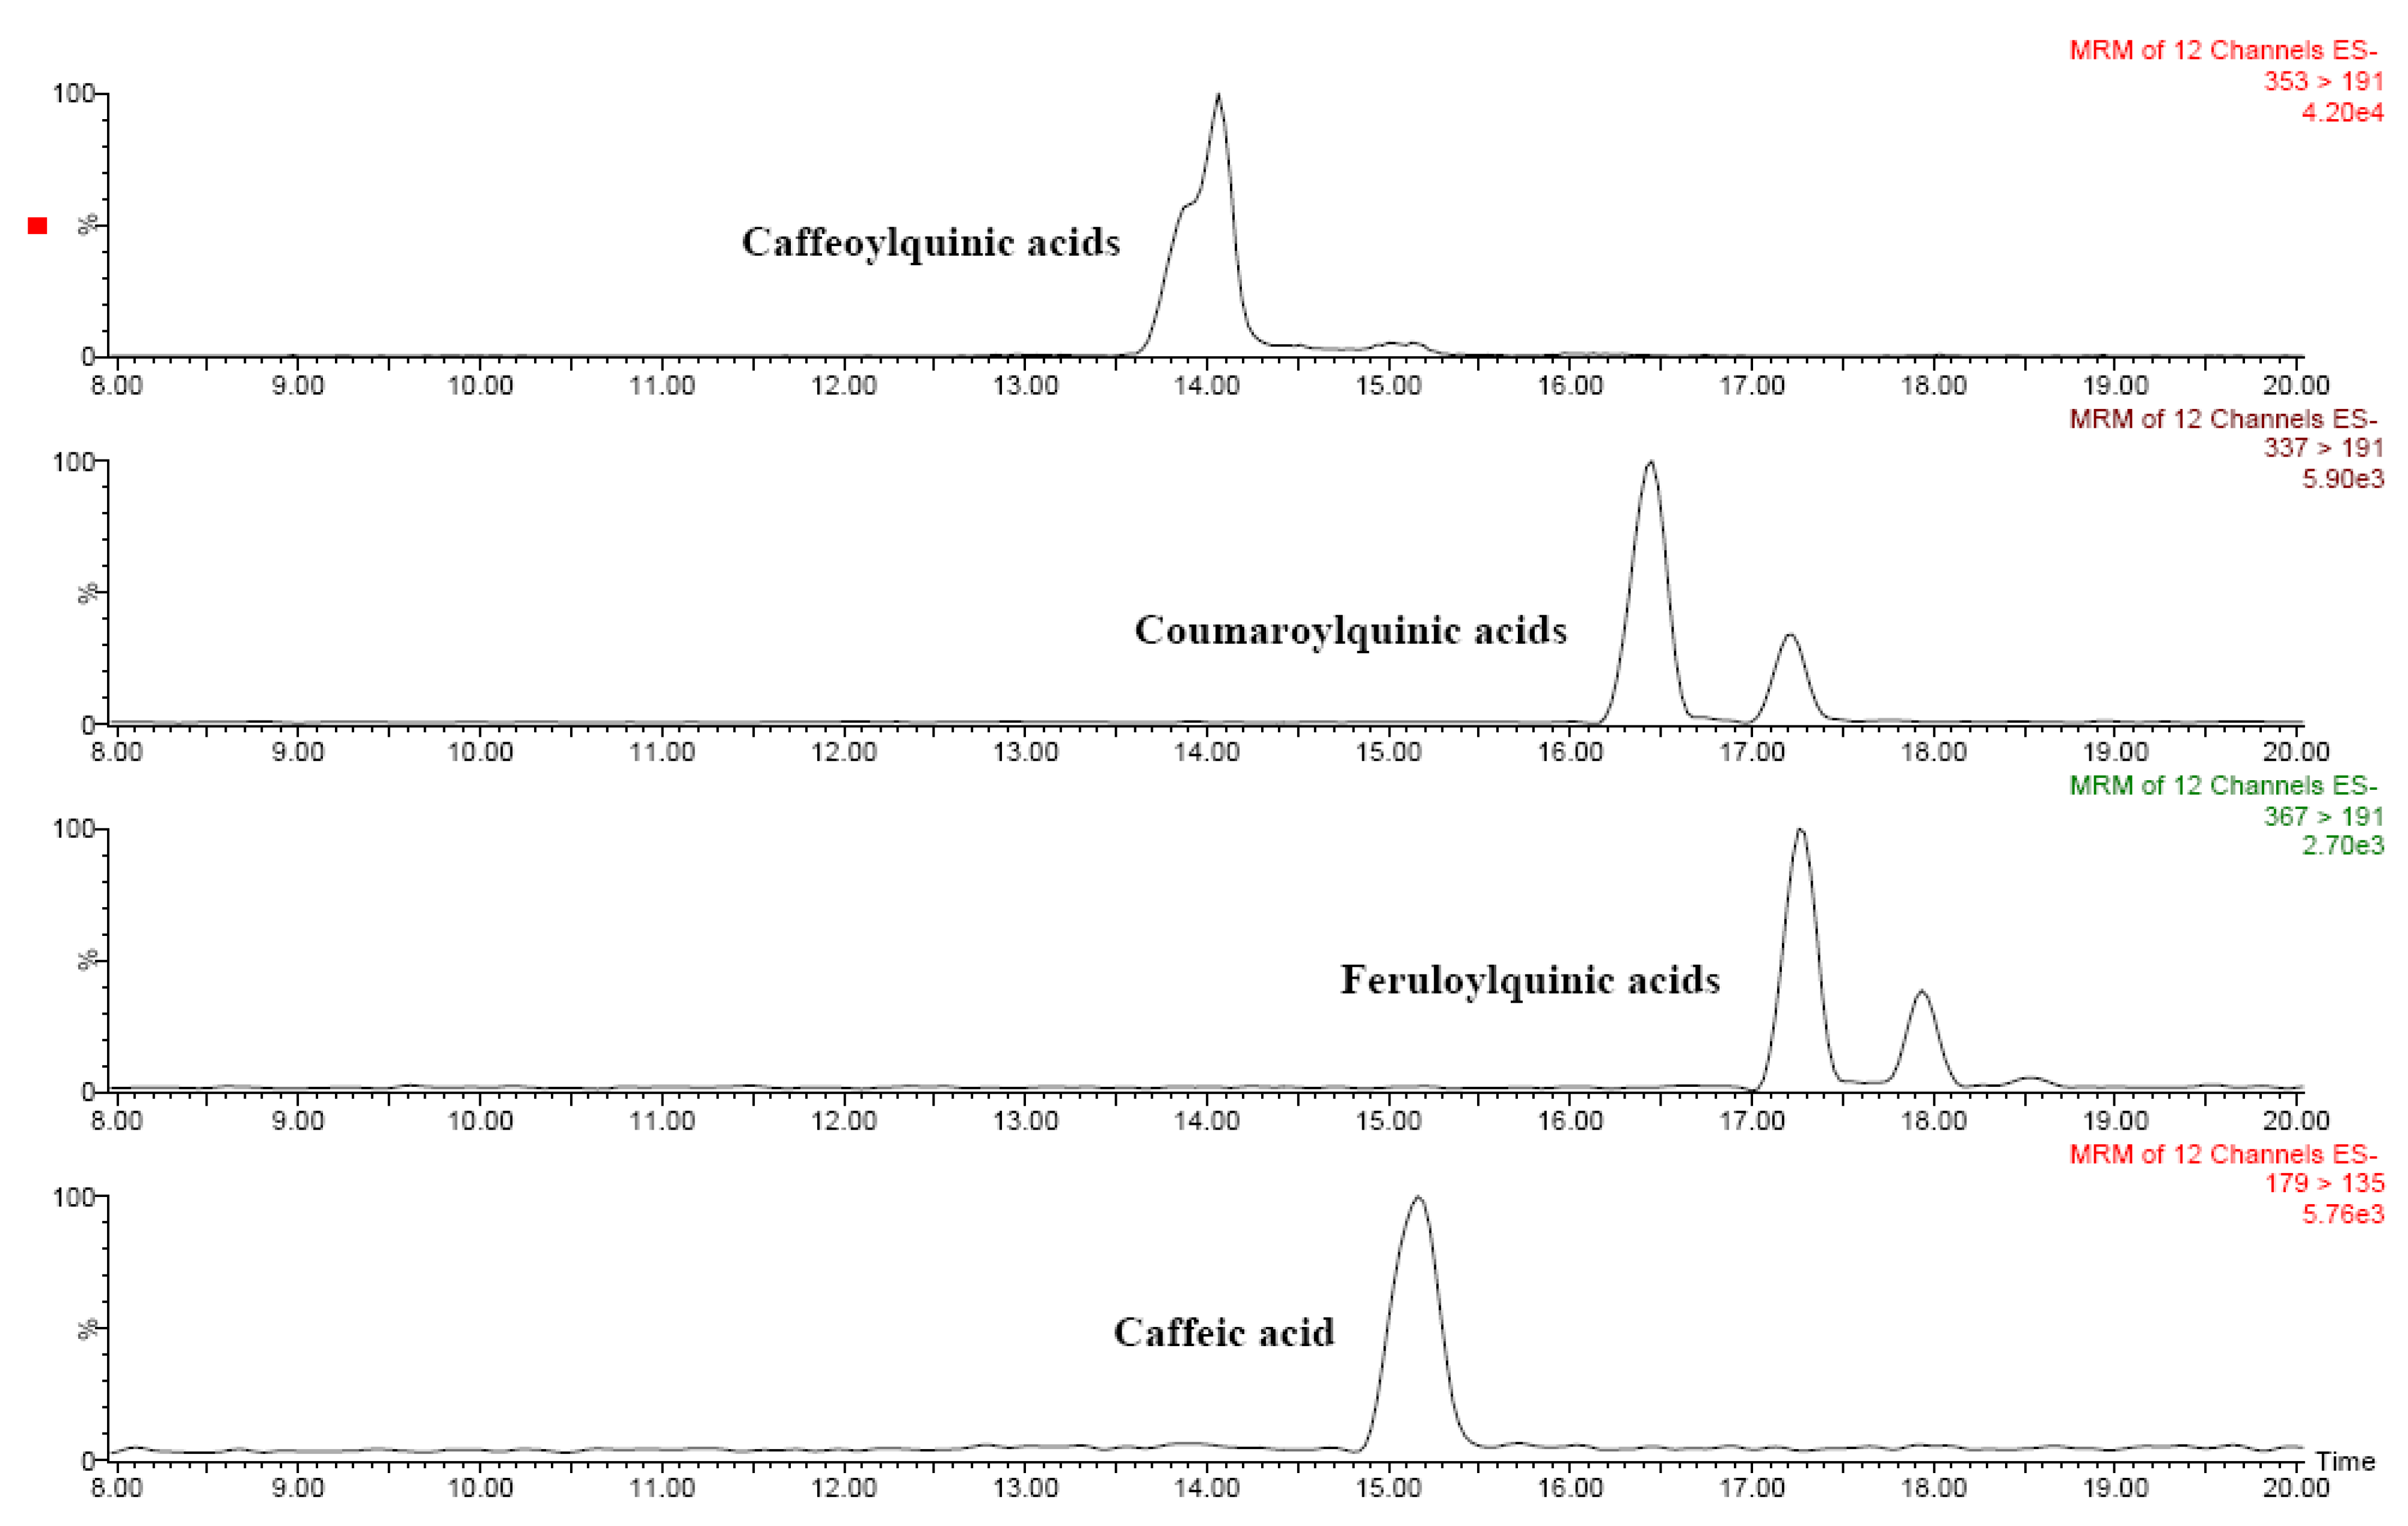
Phenolic compounds were analysed using a Waters 2695 Alliance separation module equipped with a Micromass Quattro Micro API mass spectrometer fitted with an electrospray interface (ESI) (Waters, Milford, MA, USA). Separations were performed using a Waters Atlantis dC18 3 µm (2.1 x 150 mm) reverse phase column (Waters), with the mobile phase, pumped at a flow rate of 0.17 mL/min. We have generated two Multiple Reaction Monitoring (MRM) methods for identification of phenolic acids and flavonoids. For phenolic acid analysis, capillary and cone voltages of 2.8 kV and 30 V, respectively, were used, while the collision energy was set at 20 eV. The analytes were eluted with a 15-min gradient of 5-30% acetonitrile in 1% aqueous formic acid. For flavonoid analysis, capillary and cone voltages were set at 2.8 kV and 35 V, respectively, and the collision energy was 30 eV. Flavonoids were eluted by means of a 10-min gradient of 20-40 % acetonitrile in 1 % aqueous formic acid.
For all MRM methods, the ESI source worked in negative mode, with a temperature of 120 °C, desolvation temperature of 350 °C, desolvation gas (N2) 750 L/h, cone gas (N2) 50 L/h, and the collision gas used was argon.
3-O-Caffeoylquinic acid, p-coumaric acid, caffeic acid, naringenin, quercetin-3-O-rutinoside and quercetin-3-O-glucoside were all quantified by reference to standard calibration curves. The other cinnamoylquinic acids were quantified in caffeoylquinic acid equivalents by monitoring the loss of cinnamoyl moiety with resulting ionization of quinic acid. The kaempferol-glucoside, on the other hand, was quantified in quercetin-3-O-glucoside equivalents by monitoring the loss of sugar moiety with resulting ionization of kaempferol, and flavonol-rutinosides were quantified in quercetin-3-O-rutinoside equivalents by monitoring the loss of rutionosyl moiety with resulting ionization of the corresponding aglycone.
3.6. Colour determination
Colour determination was carried out by means of two different methods:
Colorimeter: colour determinations were carried out by means of a Minolta reflectance colorimeter (CM 2600d, Minolta Co., Osaka, Japan) equipped with a standard illuminant D65: L* (lightness, black = 0, white = 100), a* (redness > 0, greenness < 0), b* (yellowness, b* > 0, blue < 0) were quantified on each sample using a 2° position of the standard observer. The instrument was calibrated before each analysis with white and black standard tiles. A total of 10 determinations were performed for each sample.
Image analysis: samples were scanned by means of a desktop flatbed scanner (Hewlett Packard Scanjet 8200, Palo Alto, CA, USA) at 236 pixels per cm (600 dpi of resolution; true colour – 24 bit), equipped with a cold cathode lamp for reflective scanning. All images were scanned at the same conditions, by positioning on the scanner 10 samples: during image acquisition, the scanner was held in a black box, in order to exclude surrounding light and external reflections. Flatbed scanner colour was characterized and corrected as previously reported by Romani
et al. [
29].
3.7. Statistical Analysis
Means and standard deviations (SD) were calculated with SPSS (Version 17.0, SPSS Inc., Chicago, Illinois, USA) statistical software. SPSS was used to verify significant differences between colorimetric and antioxidant data by one-way-analysis of variance (ANOVA) followed by Tukey’s honest significant difference test (HSD) at p ≤ 0.05 to identify differences among groups.
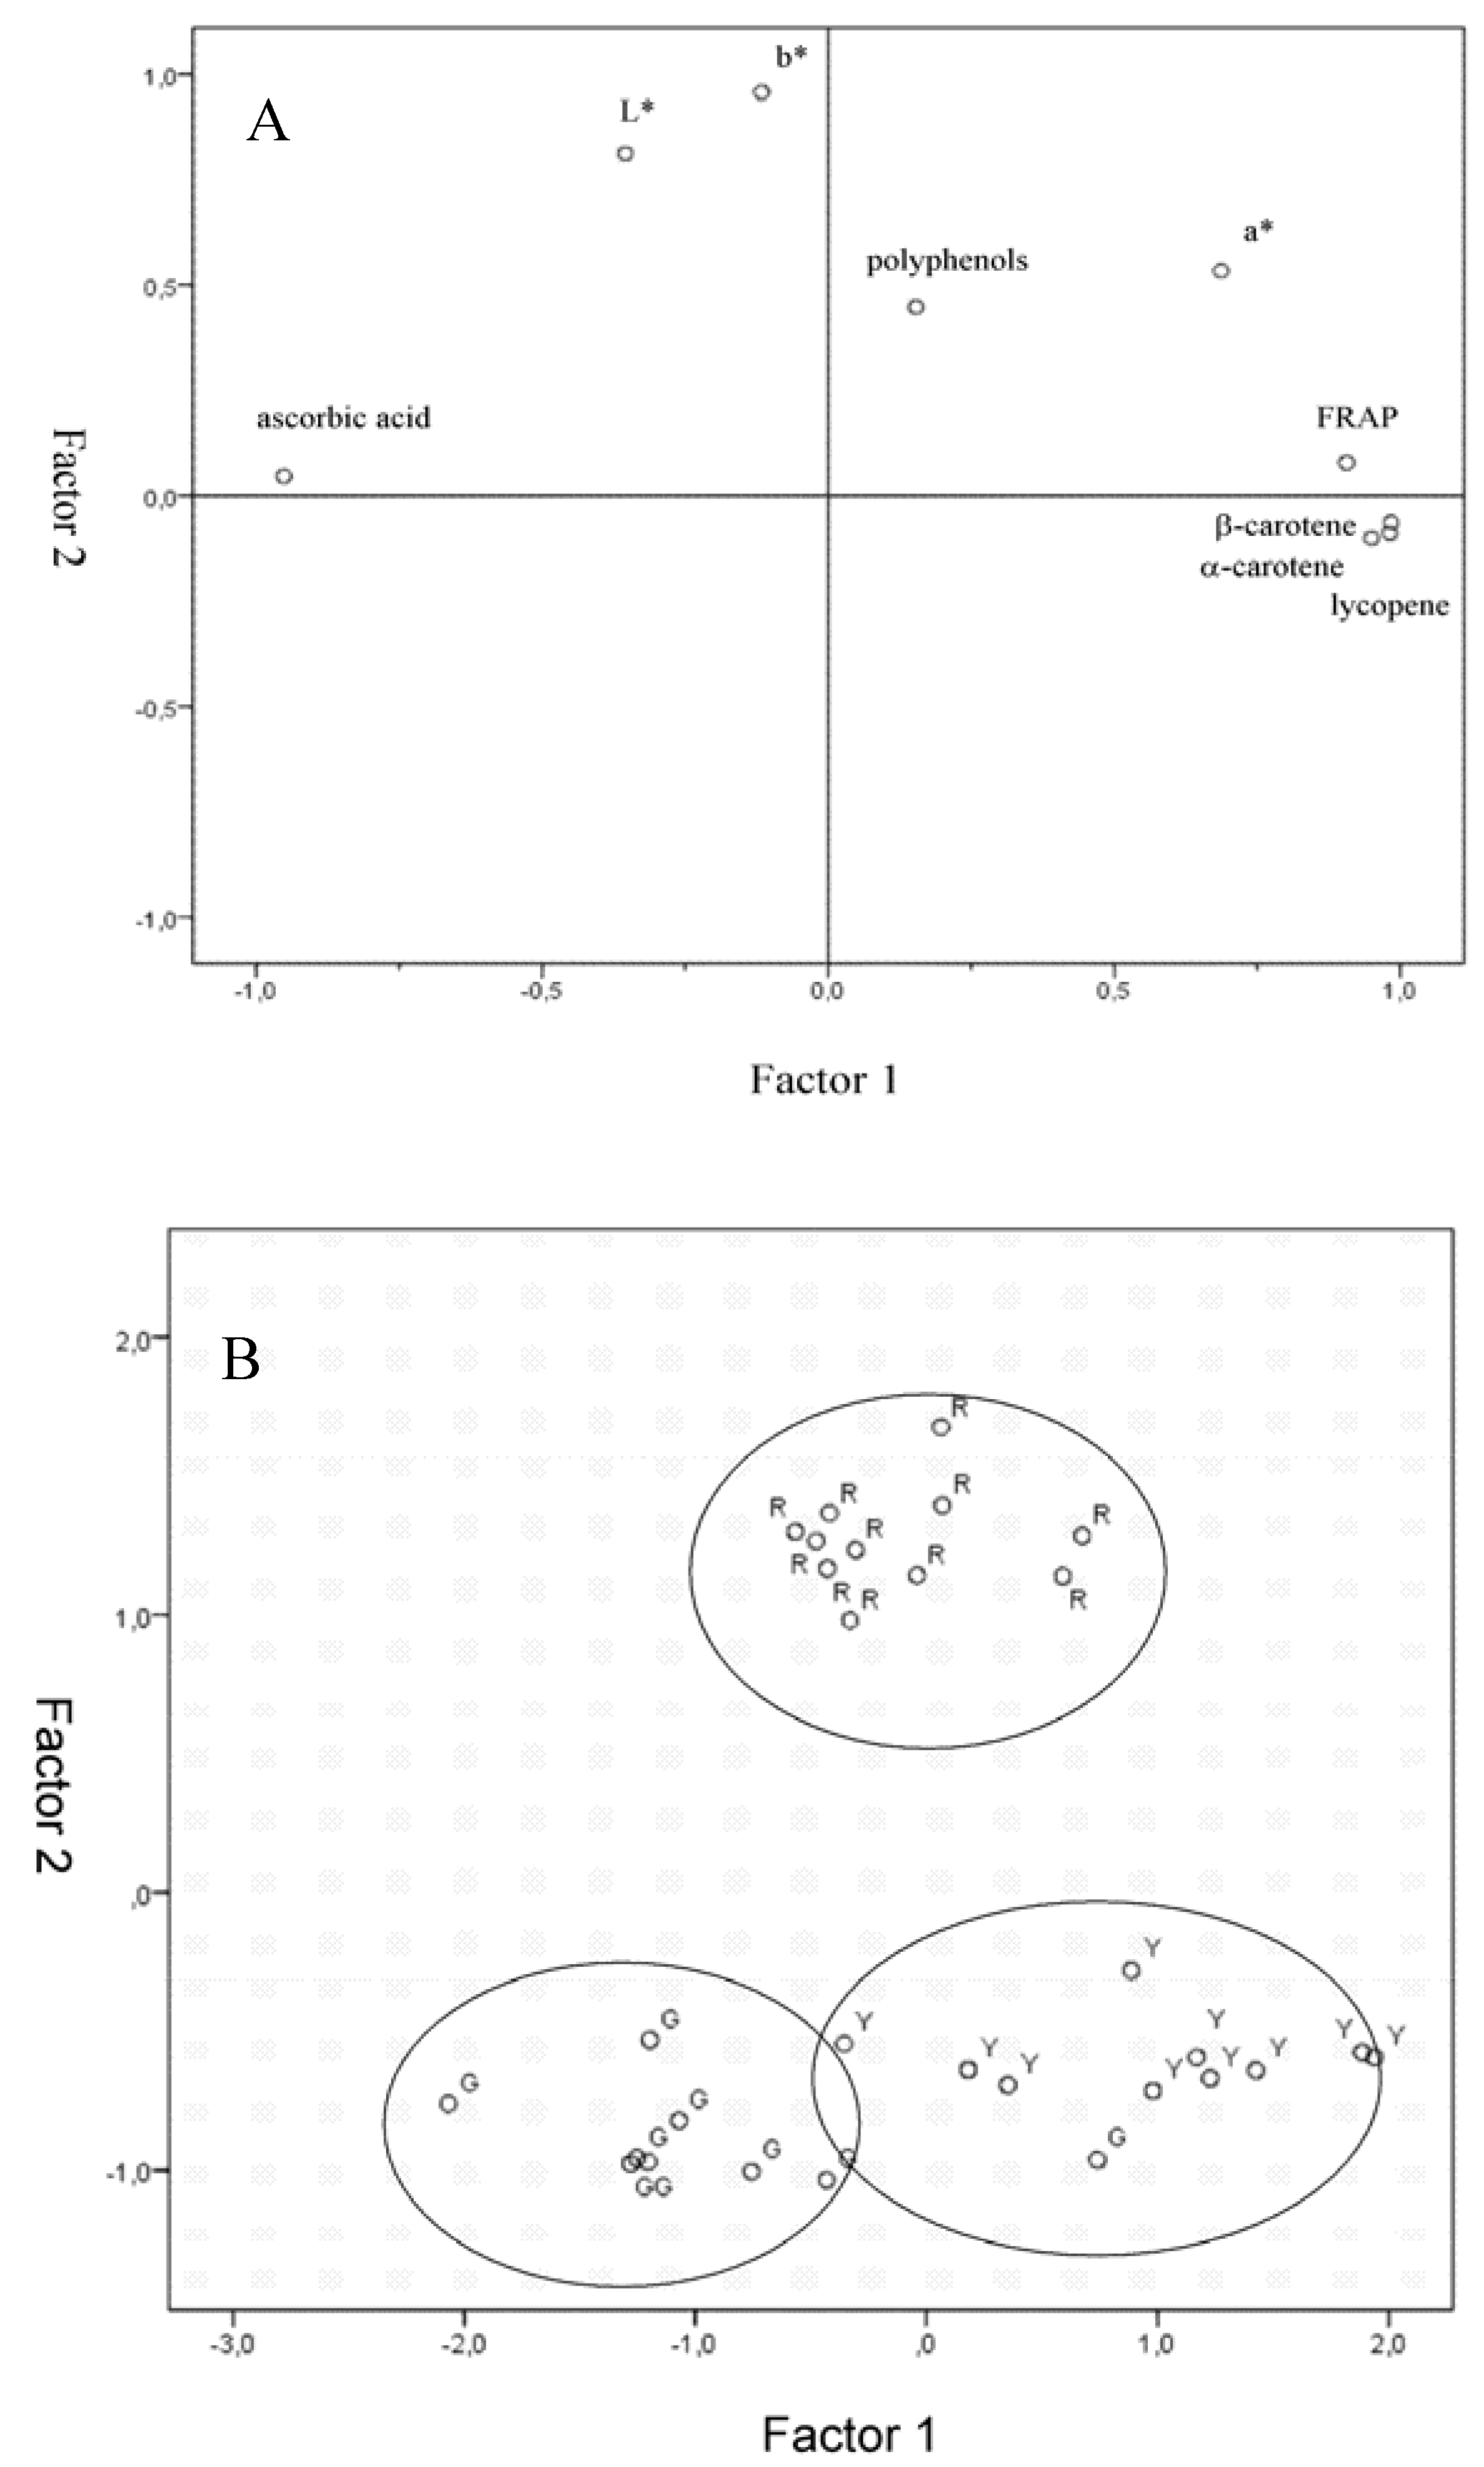
A factor analysis was also performed by means of the same software on the Y-variable data set (physical and nutritional data) to determine if individual variables could be combined to define some underlying multivariate parameter. In factor analysis, linear combinations of the variables are successively computed to maximize overall variability followed by an axis rotation to facilitate interpretation as previously reported by Clèment
et al. [
30]. The first factor explains the highest proportion of data set variability (eigenvalue), the second factor represents the second highest eigenvalue, and so on. Factors are new, independent variables (not correlated among themselves). A value (score) can be calculated for each ripening level on each factor. Factors having an eigenvalue of >1.0 were considered as being of interest for interpretation; they were selected, and a Varimax rotation was done to better distinguish which original variables are most correlated with each factor.
4. Conclusions
The present study is the first to fully characterize the antioxidant content and colour of Solanum indicum L. berries at different ripening stages. Based on the present results, Gnagnan berries should be consumed at full ripeness in order to benefit from the putatively bioactive molecules present in these Solanaceae fruits, such as carotenoids and phenolic compounds. The factorial analysis demonstrated that the ripening degrees of the berries are fully described by FRAP, α-carotene, β-carotene and lycopene content and colorimetric indexes (L*, a* and b*). Moreover, this study demonstrated that by means of colour analysis or even only visual inspection it is possible to choose the best maturity stage of Gnagnan.
Considering its high content of antioxidants, Solanum indicum L. might be considered as an interesting food to improve the antioxidant status of people living in the sub-Saharan Africa, even though further studies are needed in order to understand the impact on the nutritional values of Solanum indicum L. of various environmental conditions during the growing period and after harvest.

 ,
, 
