Identification of a Benzamide Derivative that Inhibits Stress-Induced Adrenal Corticosteroid Synthesis

Abstract
:
Abbreviations
| ACTH | adrenocorticotropic hormone or corticotrophin |
| AD | Alzheimer’s disease |
| AIDS | acquired immunodeficiency syndrome |
| DAPI | 4',6'-diamidino-2-phenylindole hydrochloride |
| dbcAMP | dibutyryl cyclic AMP |
| F-actin | filamentous actin |
| G-actin | monomeric actin |
| HMGCR | 3-hydroxy-3-methylglutaryl-coenzyme A reductase |
| HPA | hypothalamus-pituitary-adrenal |
| LDL | low density lipoprotein |
| HDL | high density lipoprotein |
| MTT | 3-(4,5-dimethylthiazol-2-yl)-2,5-diphenyl tetrazolium bromide |
| NBD-cholesterol, 22-(N-(7-nitrobenz-2-oxa-1, 3- diazol-4-yl) amino)-23 | 24-bisnor-5-cholen-3β-ol |
| P450scc | cytochrome P450 side chain cleavage (CYP11A1) |
| PBS | phosphate-buffered saline |
| PCR | polymerase chain reaction |
| Q-PCR | real-time quantitative PCR |
| SDS-PAGE | sodium dodecyl sulfate polyacrylamide gen electrophoresis |
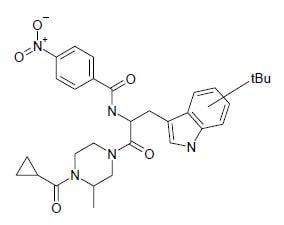
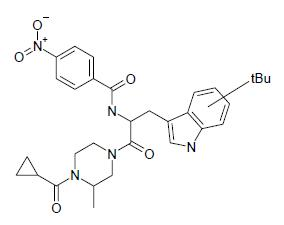
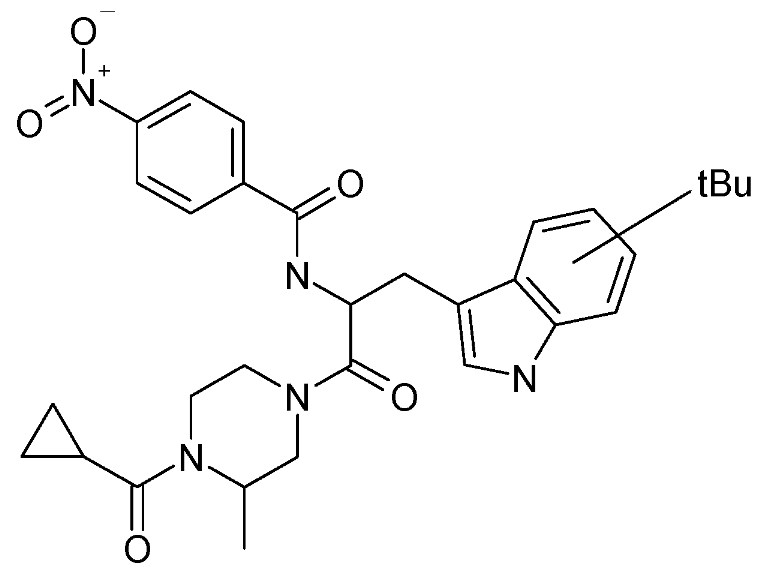
| SP-10 | N-[2-(4-cyclopropanecarbonyl-3-methyl-piperazin-1-yl)-1-(tert-butyl-1H-indol-3-yl-methyl)-2-oxo-ethyl]-4-nitro-benzamide |
| SR-BI | scavenger receptor class B type I |
| StAR | steroidogenesis acute regulatory protein |
| TSPO | translocator protein 18 kDa). |
1. Introduction

2. Results
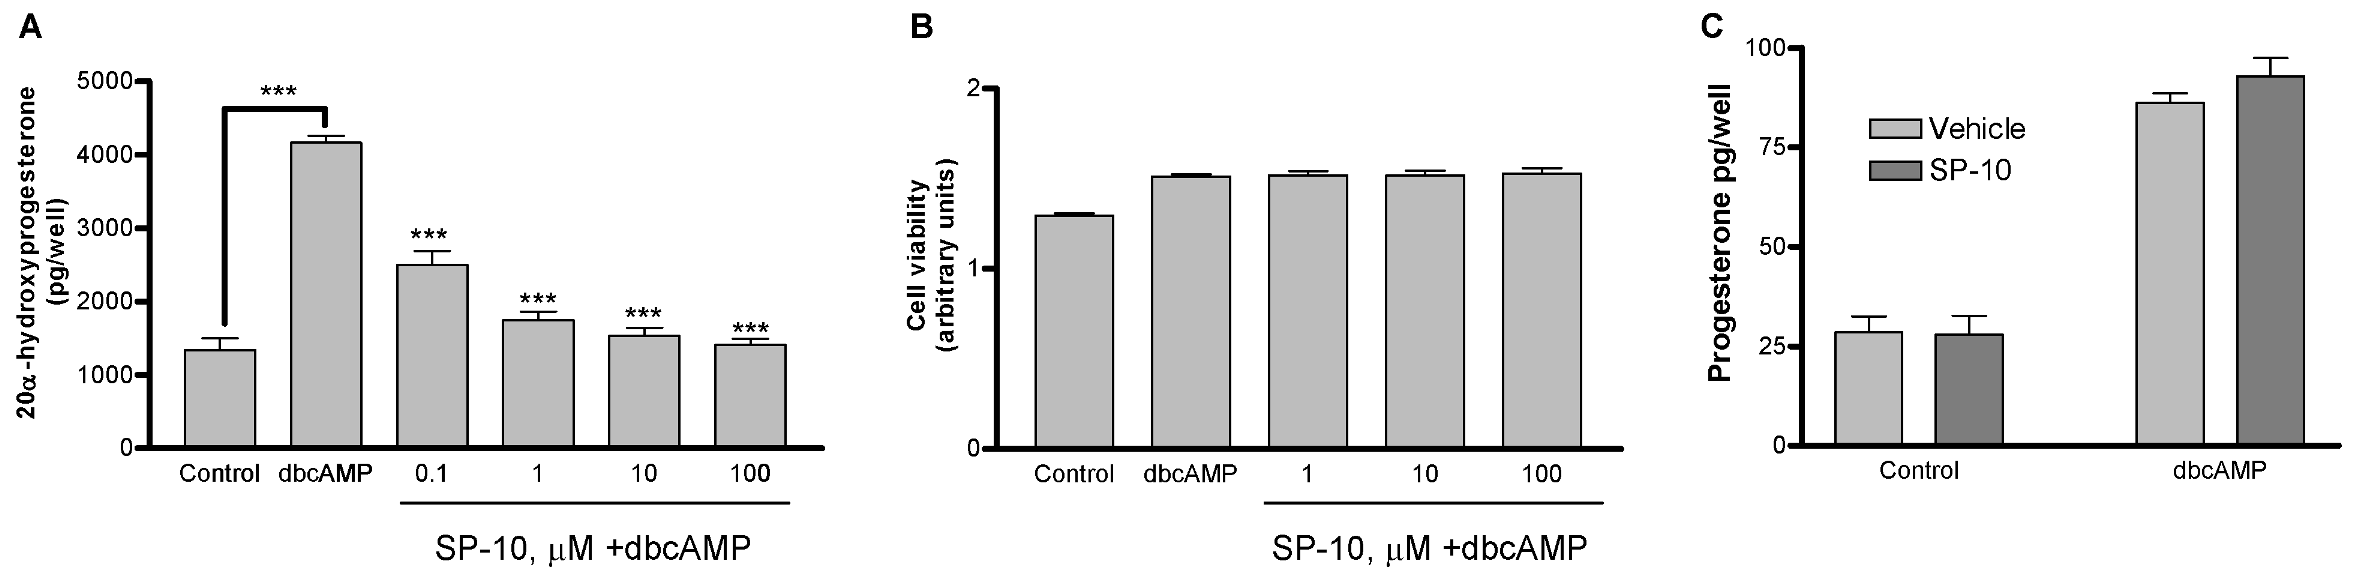
2.1. SP-10 inhibits dbcAMP-induced steroid formation in Y-1 mouse adrenal cells

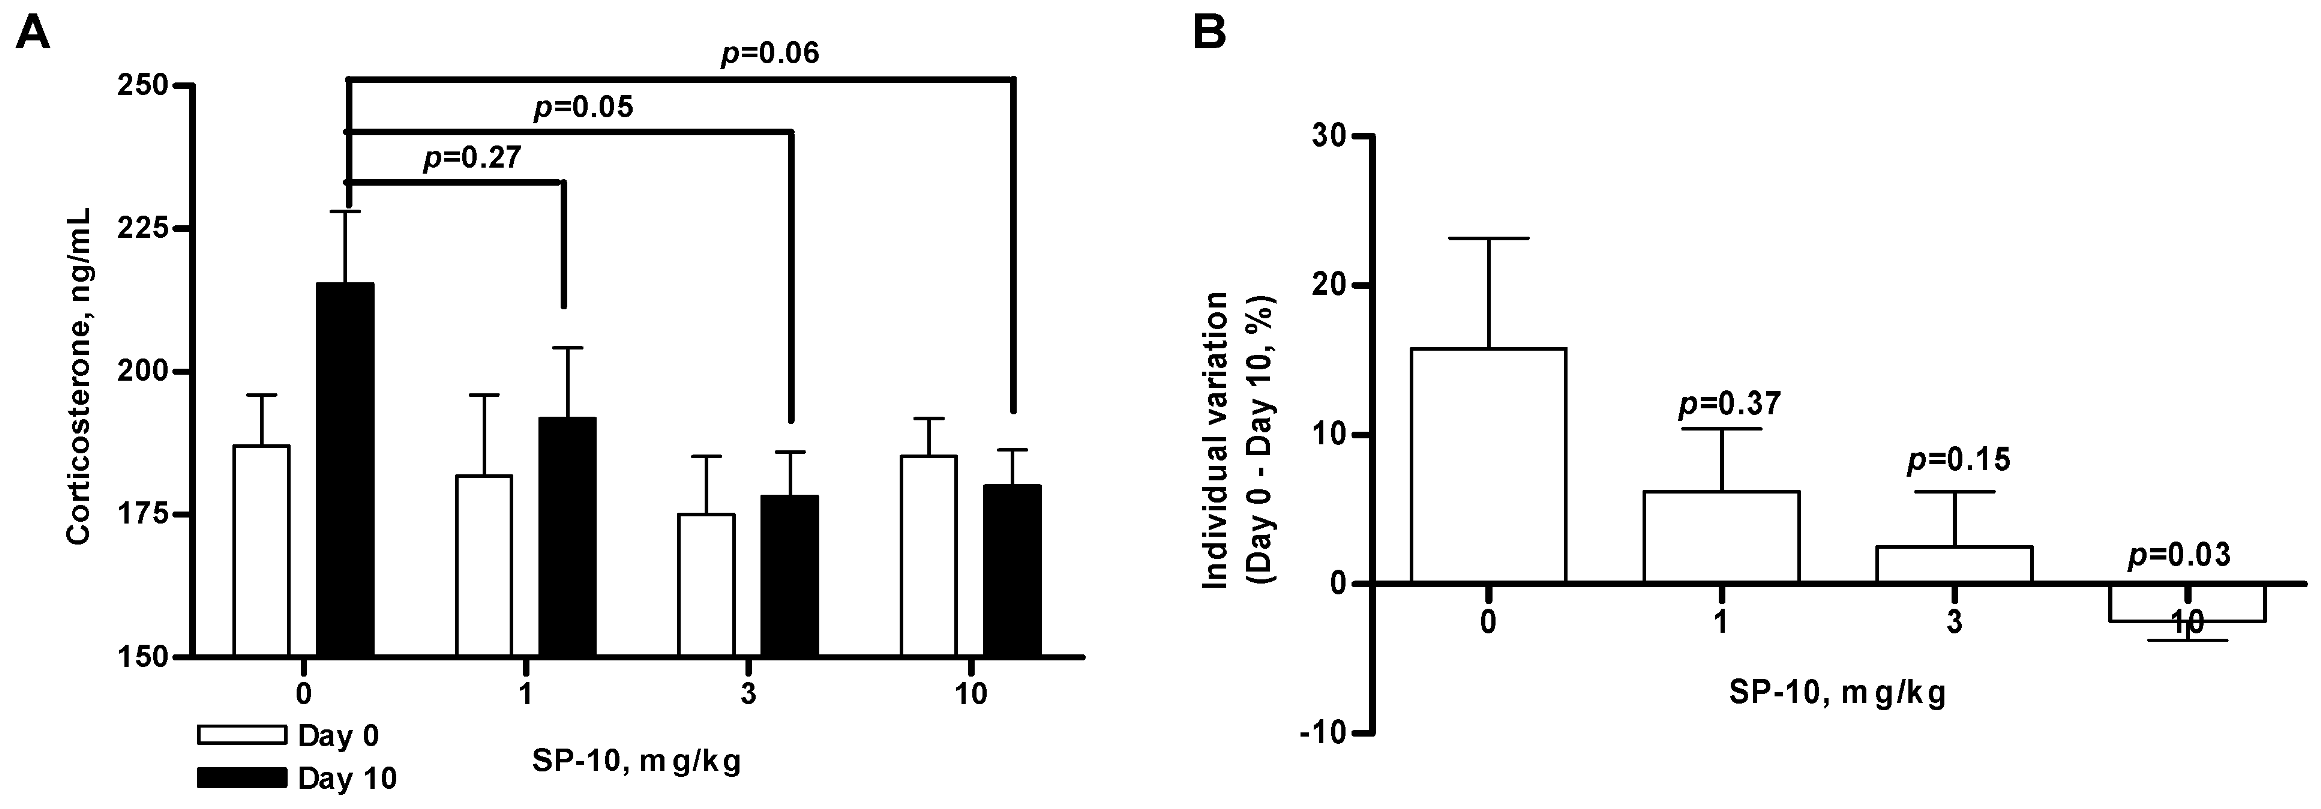
2.2. SP-10 decreases circulating corticosterone levels in rats

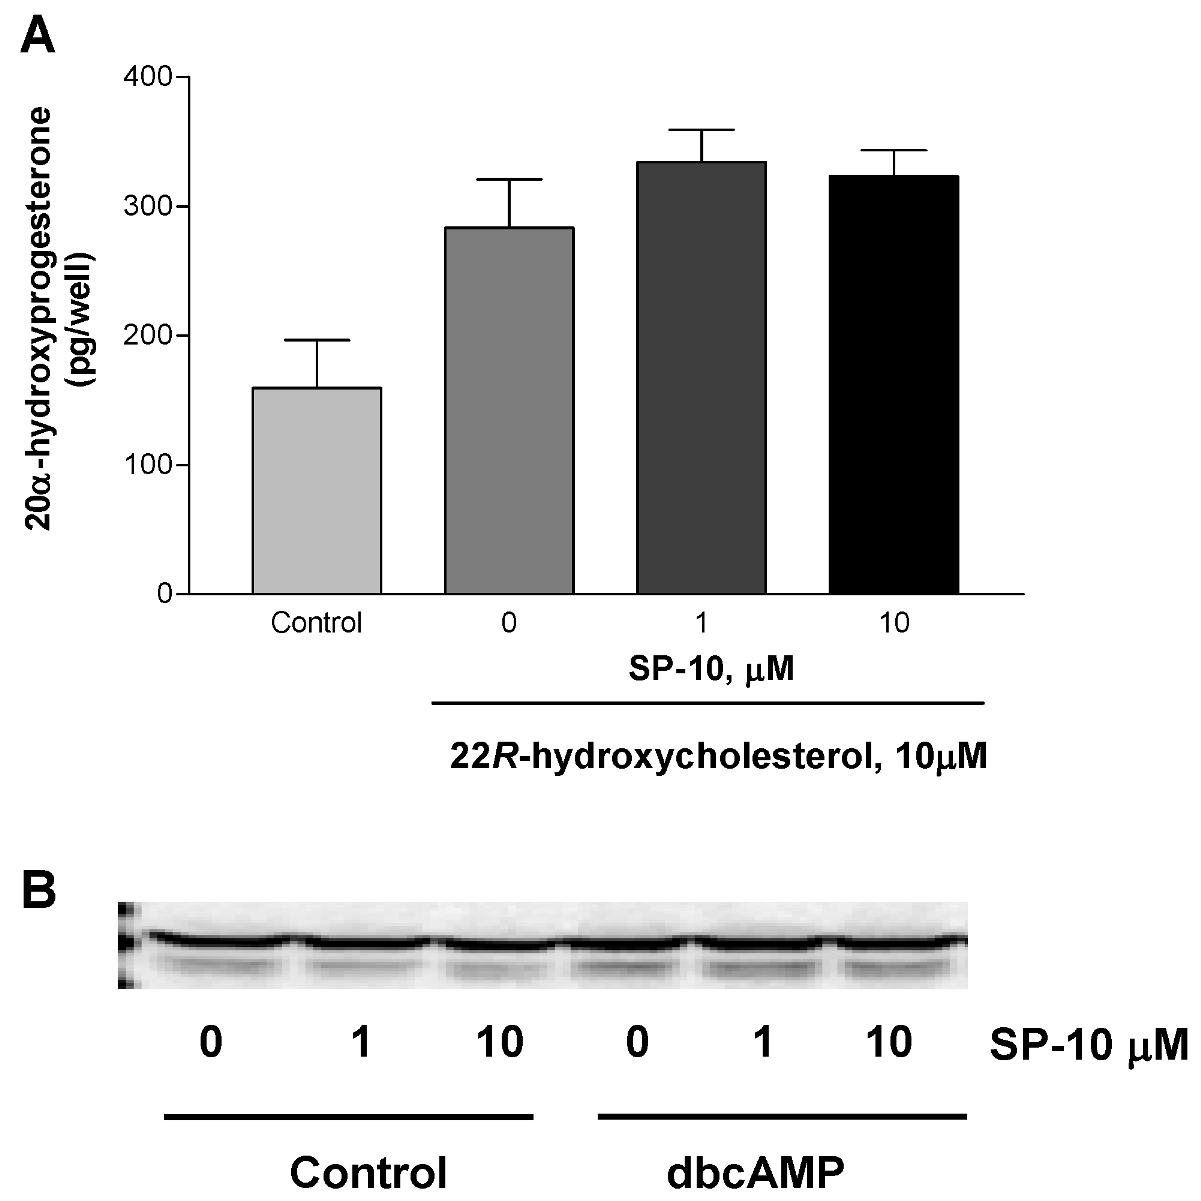
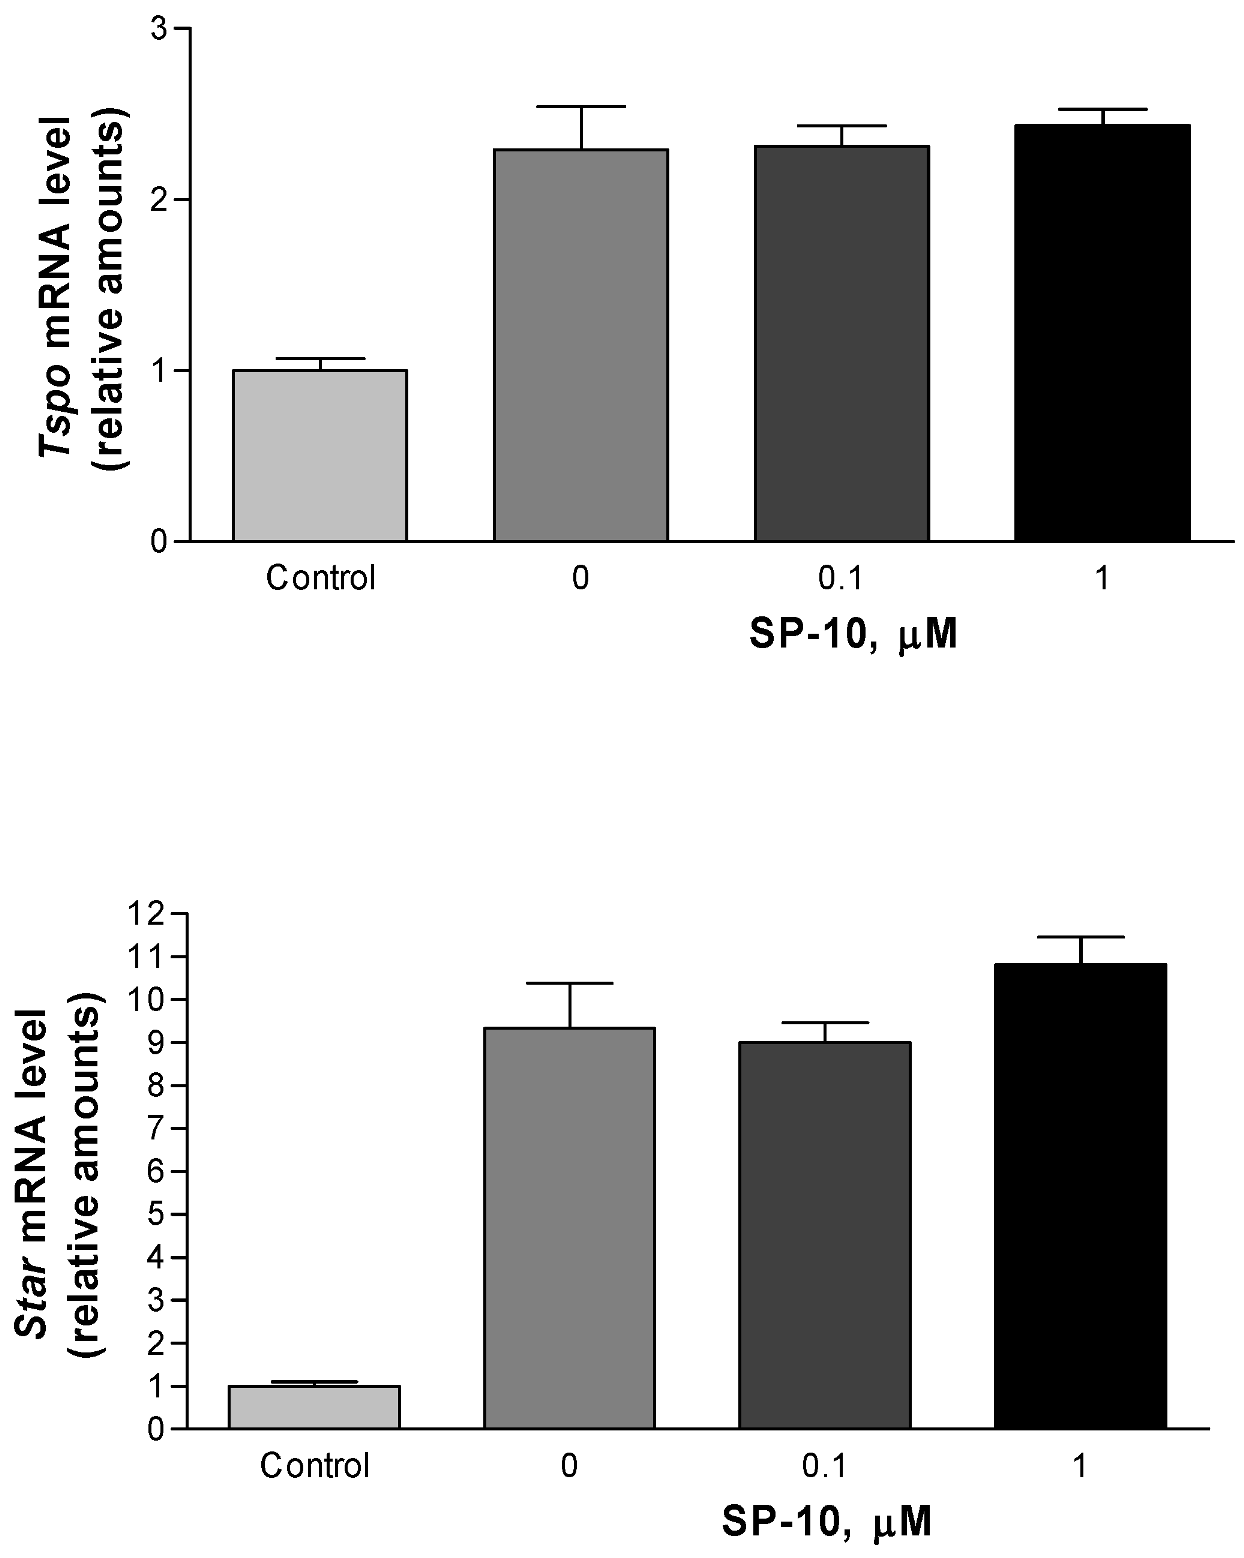
2.3. Effects of SP-10 on the steroidogenic pathway


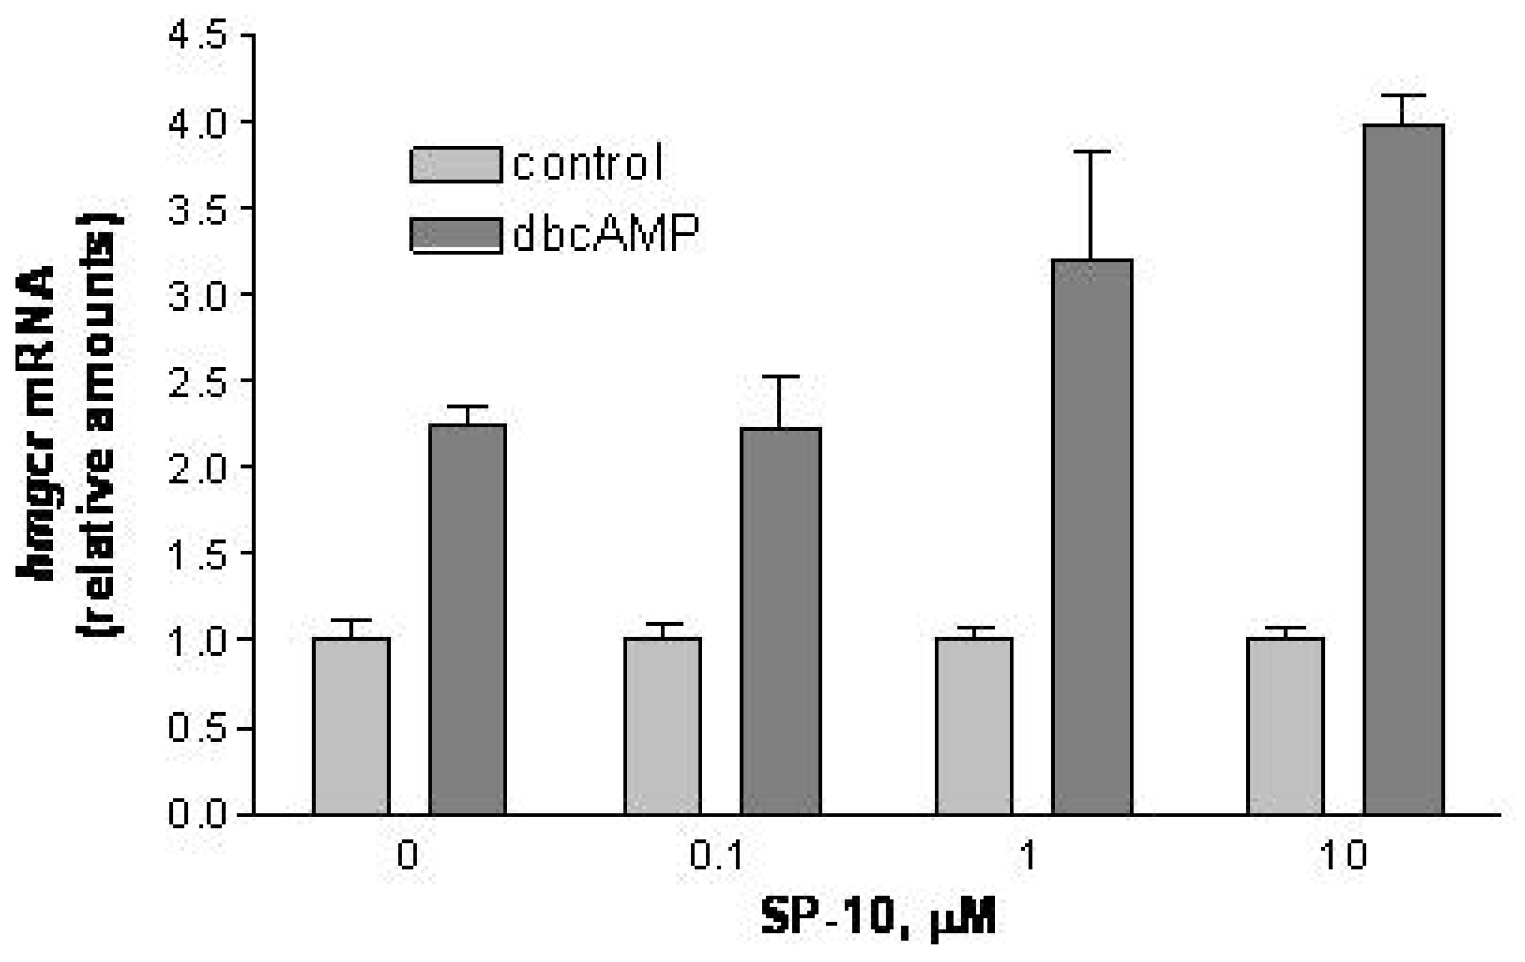
2.4. SP-10 increases hmgcr mRNA expression

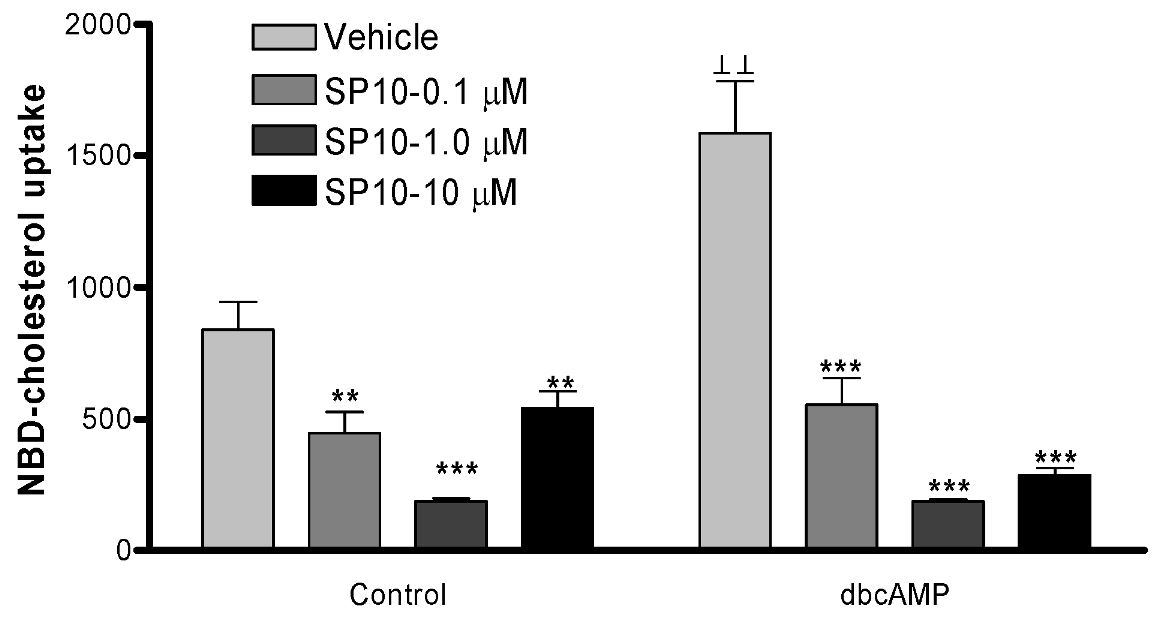
2.5. SP-10 inhibits NBD-cholesterol uptake

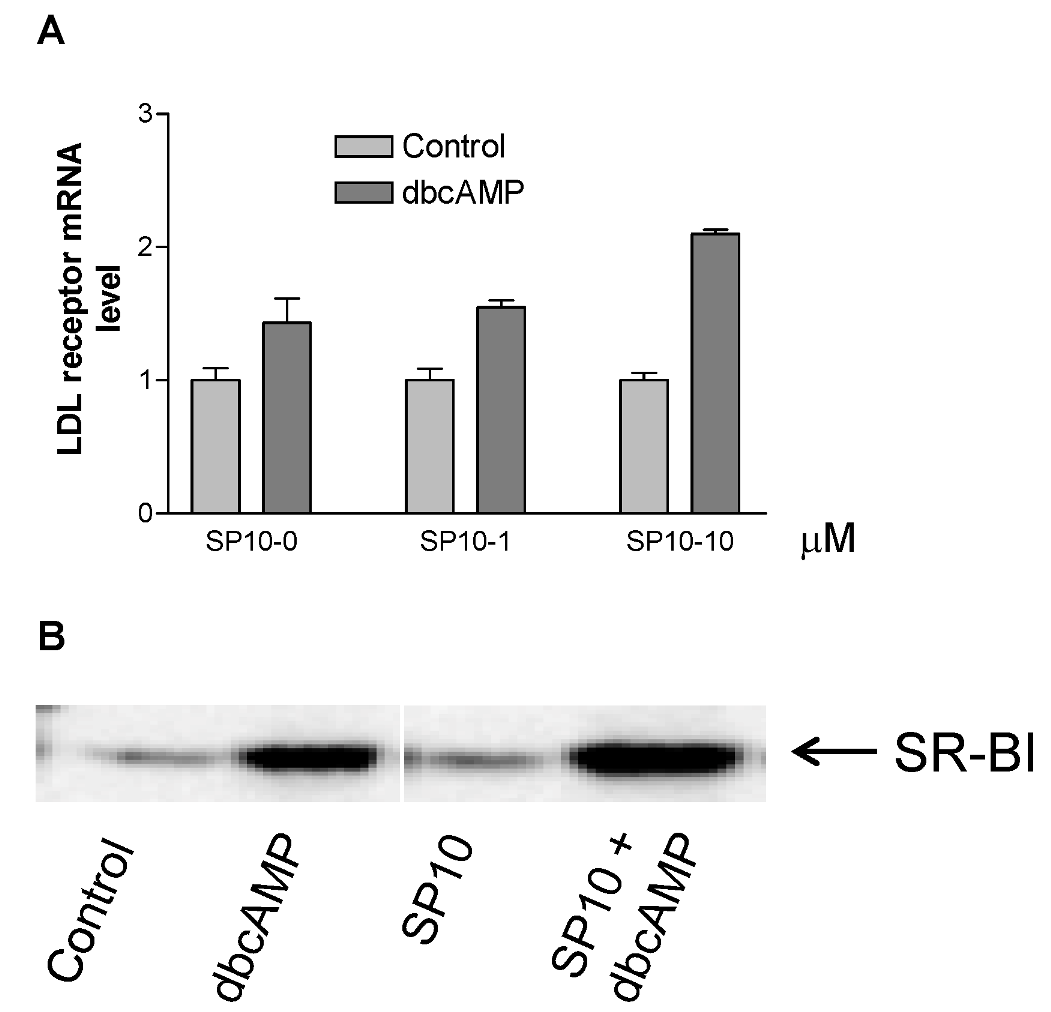
2.6. Effects of SP-10 on LDL receptor and SR-BI receptor expression

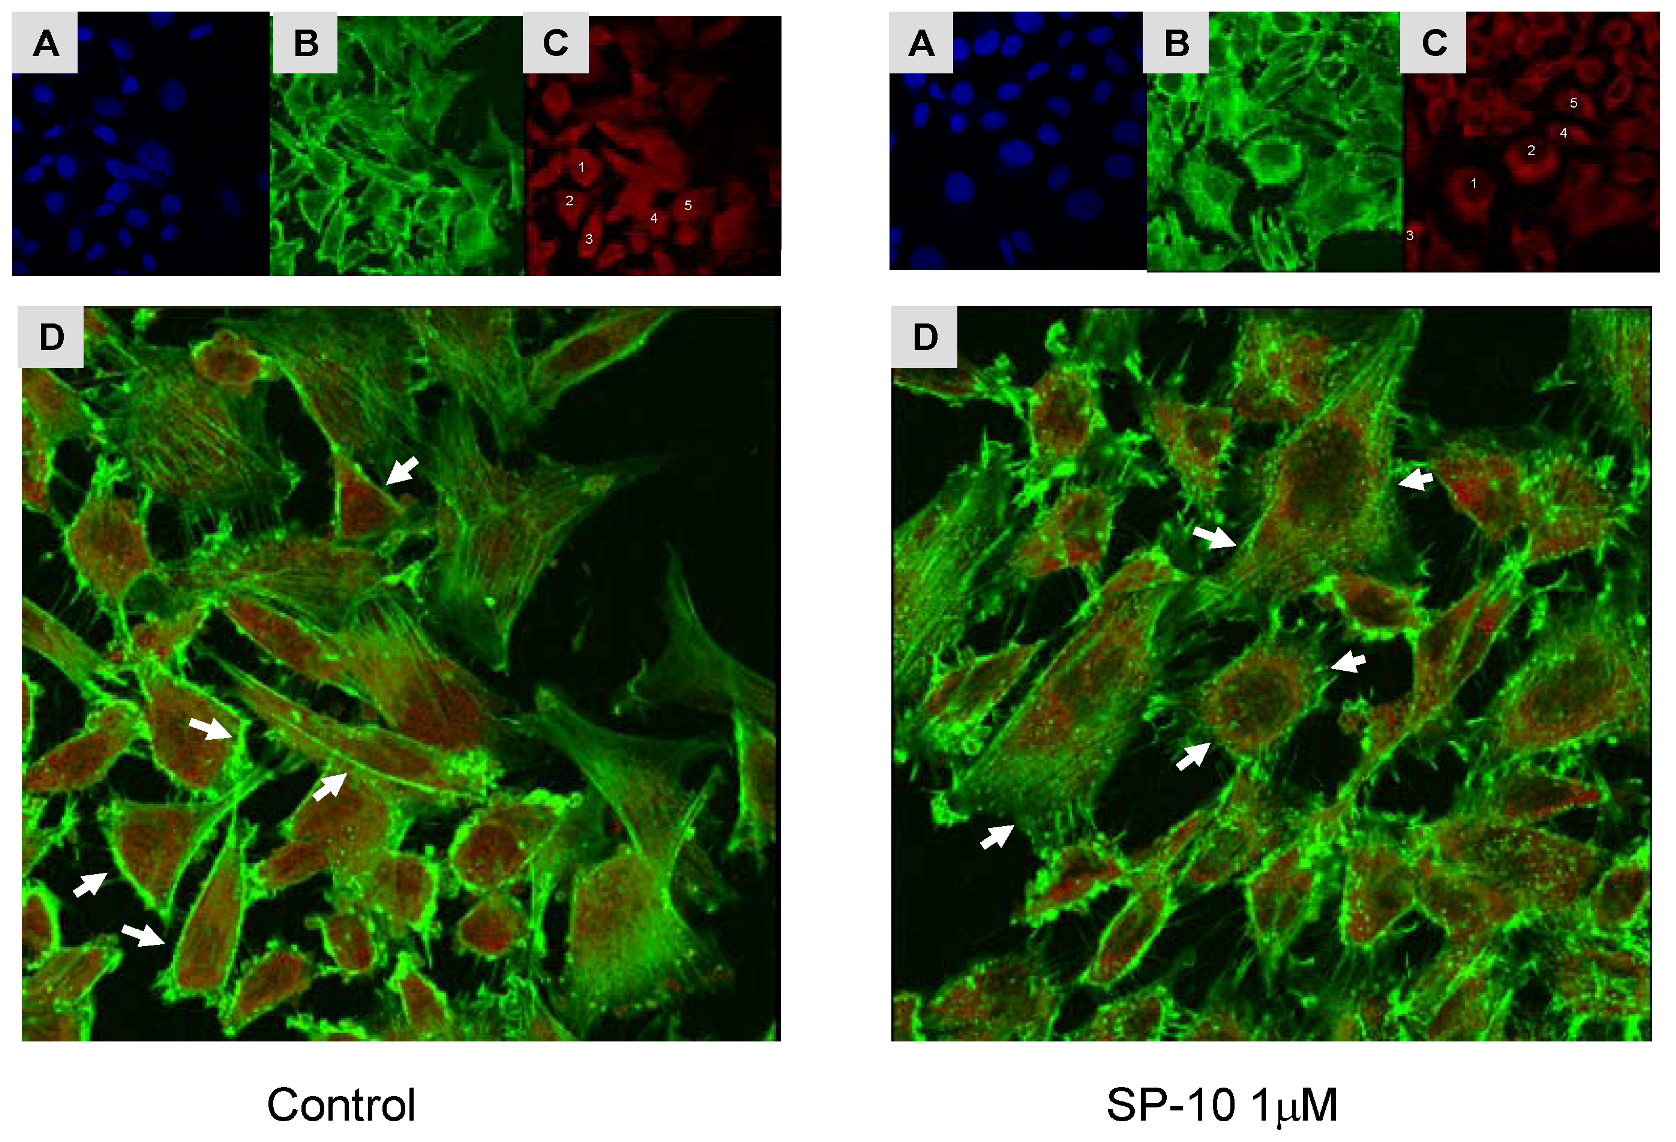
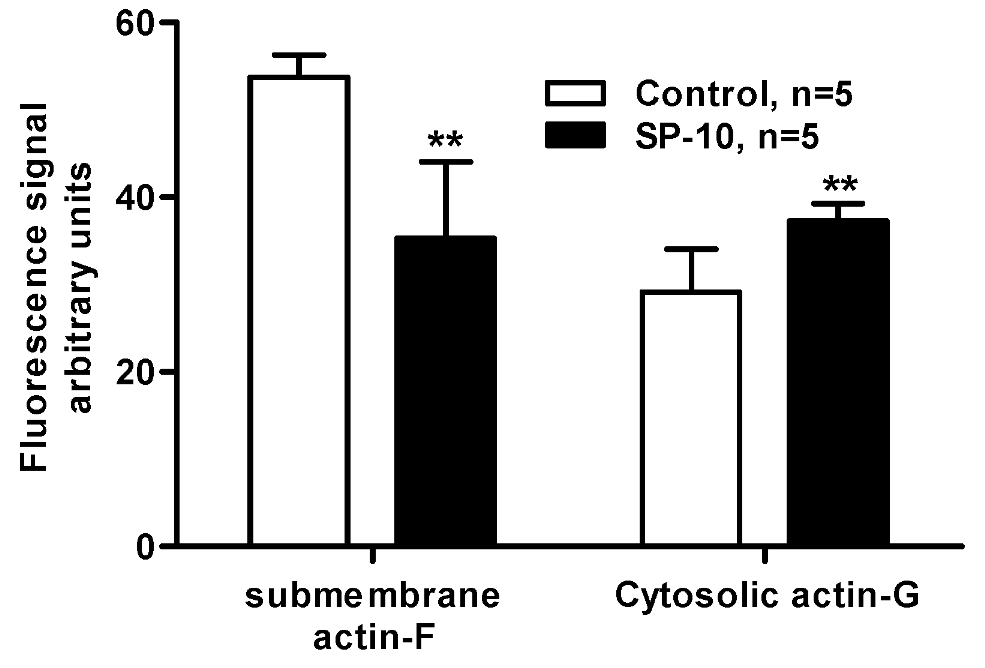
2.7. SP-10 alters actin cytoskeleton dynamics in Y-1 cells


3. Discussion
4. Conclusions
5. Experimental
5.1. Materials
5.2. Animal treatment
5.3. Cell culture
5.4. Determination of steroid synthesis
5.5. Analysis of mitochondrial integrity/cell viability
5.6. Real-time quantitative PCR (Q-PCR)
5.7. Radioligand-binding assays
5.8. Immunoblotting
5.9. NBD-cholesterol uptake
5.10. Confocal laser scanning microscopy
5.11. Statistics
Acknowledgements
- Sample Availability: Samples of the compounds are available from authors.
References and Notes
- McEwen, B.S. Corticosteroids and hippocampal plasticity. Ann. N. Y. Acad. Sci. 1994, 746, 134–142. [Google Scholar] [CrossRef]
- Chrousos, G.P.; Gold, P.W. The concepts of stress and stress system disorders. Overview of physical and behavioral homeostasis. JAMA 1992, 267, 1244–1252. [Google Scholar] [CrossRef]
- Kiraly, S.J.; Ancill, R.J.; Dimitrova, G. The relationship of endogenous cortisol to psychiatric disorder: a review. Can. J. Psychiatry 1997, 42, 415–420. [Google Scholar]
- Tafet, G.E.; Toister-Achituv, M.; Shinitzky, M. Enhancement of serotonin uptake by cortisol: a possible link between stress and depression. Cogn. Affect. Behav. Neurosci. 2001, 1, 96–104. [Google Scholar] [CrossRef]
- Maeda, K.; Tanomoto, K.; Terada, T.; Shintani, T.; Kakigi, T. Elevated urinary free cortisol in patients with dementia. Neurobiol. Aging 1991, 12, 161–163. [Google Scholar] [CrossRef]
- Polleri, A.; Gianelli, M.V.; Murialdo, G. Dementia: a neuroendocrine perspective. J. Endocrinol. Invest. 2002, 25, 73–83. [Google Scholar]
- Wolkowitz, O.M.; Lupien, S.J.; Bigler, E.; Levin, R.B.; Canick, J. The "steroid dementia syndrome": an unrecognized complication of glucocorticoid treatment. Ann. N. Y. Acad. Sci. 2004, 1032, 191–194. [Google Scholar] [CrossRef]
- Swaab, D.F.; Raadsheer, F.C.; Endert, E.; Hofman, M.A.; Kamphorst, W.; Ravid, R. Increased cortisol levels in aging and Alzheimer’s disease in postmortem cerebrospinal fluid. J. Neuroendocrinol. 1994, 6, 681–687. [Google Scholar] [CrossRef]
- O’Brien, J.T.; Ames, D.; Schweitzer, I.; Mastwyk, M.; Colman, P. Enhanced adrenal sensitivity to adrenocorticotrophic hormone (ACTH) is evidence of HPA axis hyperactivity in Alzheimer’s disease. Psychol. Med. 1996, 26, 7–14. [Google Scholar] [CrossRef]
- Weiner, M.F.; Vobach, S.; Olsson, K.; Svetlik, D.; Risser, R.C. Cortisol secretion and Alzheimer’s disease progression. Biol. Psychiatry 1997, 42, 1030–1038. [Google Scholar] [CrossRef]
- Giubilei, F.; Patacchioli, F.R.; Antonini, G.; Sepe Monti, M.; Tisei, P.; Bastianello, S.; Monnazzi, P.; Angelucci, L. Altered circadian cortisol secretion in Alzheimer’s disease: Clinical and neuroradiological aspects. J. Neurosci. Res. 2001, 66, 262–265. [Google Scholar] [CrossRef]
- Rasmuson, S.; Nasman, B.; Carlstrom, K.; Olsson, T. Increased levels of adrenocortical and gonadal hormones in mild to moderate Alzheimer’s disease. Dement. Geriatr. Cogn. Disord. 2002, 13, 74–79. [Google Scholar] [CrossRef]
- Corley, P.A. Acquired immune deficiency syndrome: The glucocorticoid solution. Med. Hypotheses 1996, 47, 49–54. [Google Scholar] [CrossRef]
- Bhansali, A.; Dash, R.J.; Sud, A.; Bhadada, S.; Sehgal, S.; Sharma, B.R. A preliminary report on basal and stimulated plasma cortisol patients with acquired immunodeficiency syndrome. Indian J. Med. Res. 2000, 112, 173–177. [Google Scholar]
- Christeff, N.; Nunez, E.A.; Gougeon, M.L. Changes in cortisol/DHEA ratio in HIV-infected men are related to immunological and metabolic perturbations leading to malnutrition and lipodystrophy. Ann. N. Y. Acad. Sci. 2000, 917, 962–970. [Google Scholar]
- Erkut, Z.A.; Endert, E.; Huitinga, I.; Swaab, D.F. Cortisol is increased in postmortem cerebrospinal fluid of multiple sclerosis patients: relationship with cytokines and sepsis. Mult. Scler. 2002, 8, 229–236. [Google Scholar] [CrossRef]
- Luecken, L.J.; Compas, B.E. Stress, coping, and immune function in breast cancer. Ann. Behav. Med. 2002, 24, 336–344. [Google Scholar] [CrossRef]
- Jefcoate, C. High-flux mitochondrial cholesterol trafficking, a specialized function of the adrenal cortex. J. Clin. Invest. 2002, 110, 881–890. [Google Scholar]
- Azha, r S.; Leers-Sucheta, S.; Reaven, E. Cholesterol uptake in adrenal and gonadal tissues: the SR-BI and ‘selective’ pathway connection. Front. Biosci. 2003, 8, s998–s1029. [Google Scholar] [CrossRef]
- Xu, J.; Lecanu, L.; Han, Z.; Yao, Z.; Greeson, J.; Papadopoulos, V. Inhibition of adrenal cortical steroid formation by procaine is mediated by reduction of the cAMP-induced 3-hydroxy-3-methylglutaryl-coenzyme A reductase messenger ribonucleic acid levels. J. Pharmacol. Exp. Ther. 2003, 307, 1148–1157. [Google Scholar] [CrossRef]
- Xu, J.; Lecanu, L.; Tan, M.; Yao, W.; Greeson, J.; Papadopoulos, V. The benzamide derivative N-[2-(4-cyclopropanecarbonyl-3-methyl-piperazin-1-yl)-1-(1H-indol-3-yl-methyl)-2-oxo-ethyl]-4-nitro-benzamide (SP-10) reduces HIV 1 infectivity in vitro by modifying actin dynamics. Antivir. Chem. Chemother. 2007, 17, 331–342. [Google Scholar]
- Papadopoulos, V.; Baraldi, M.; Guilarte, T.R.; Knudsen, T.B.; Lacapère, J.J.; Lindemann, P.; Norenberg, M.D.; Nutt, D.; Weizman, A.; Zhang, M.R.; Gavish, M. Translocator protein (18kDa): new nomenclature for the peripheral-type benzodiazepine receptor based on its structure and molecular function. Trends Pharmacol. Sci. 2006, 27, 402–409. [Google Scholar]
- Stocco, D.M. StAR protein and the regulation of steroid hormone biosynthesis. Annu. Rev. Physiol. 2001, 63, 193–213. [Google Scholar] [CrossRef]
- Atshaves, B.P.; Starodub, O.; McIntosh, A.; Petrescu, A.; Roths, J.B.; Kier, A.B.; Schroeder, F. Sterol carrier protein-2 alters high density lipoprotein-mediated cholesterol efflux. J. Biol. Chem. 2000, 275, 36852–36861. [Google Scholar]
- Frolov, A.; Petrescu, A.; Atshaves, B.P.; So, P.T.C.; Gratton, E.; Serrero, G.; Schroeder, F. High density lipoprotein-mediated cholesterol uptake and targeting to lipid droplets in intact L-cell fibroblasts. A single- and multiphoton fluorescence approach. J. Biol. Chem. 2000, 275, 12769–12780. [Google Scholar]
- Capponi, A.M. Regulation of cholesterol supply for mineralocorticoid biosynthesis. Trends Endocrinol. Metab. 2002, 13, 118–121. [Google Scholar] [CrossRef]
- Estes, J.E.; Selden, L.A.; Gershman, L.C. Mechanism of action of phalloidin on the polymerization of muscle actin. Biochemistry 1981, 20, 708–712. [Google Scholar] [CrossRef]
- Howard, T.H.; Oresajo, C.O. The kinetics of chemotactic peptide-induced change in F-actin content, F-actin distribution, and the shape of neutrophils. J. Cell. Biol. 1985, 101, 1078–1085. [Google Scholar] [CrossRef]
- Cassimeris, L.; McNeill, H.; Zigmond, S.H. Chemoattractant-stimulated polymorphonuclear leukocytes contain two populations of actin filaments that differ in their spatial distributions and relative stabilities. J. Cell. Biol. 1990, 110, 1067–1075. [Google Scholar] [CrossRef]
- Brown, A.S.; Hall, P.F.; Shoyab, M.; Papadopoulos, V. Endozepine/Diazepam Binding Inhibitor in adrenocortical and Leydig cell lines: Absence of hormonal regulation. Mol. Cell. Endocr. 1992, 83, 1–9. [Google Scholar] [CrossRef]
- Lecanu, L.; Greeson, J.; Papadopoulos, V. Beta-amyloid and oxidative stress jointly induce neuronal death, amyloid deposits, gliosis, and memory impairment in the rat brain. Pharmacology 2006, 76, 19–33. [Google Scholar] [CrossRef]
- Ferrari, E.; Fioravanti, M.; Magri, F.; Solerte, S.B. Variability of Interactions Between Neuroendocrine and Immunological Functions in Physiological Aging and Dementia of the Alzheimer's Type. Ann. N. Y. Acad. Sci. 2000, 917, 582–596. [Google Scholar]
- Simpson, E.; Lauber, M.; Demeter, M.; Stirling, D.; Rodgers, R.; Means, G.; Mahendroo, M.; Kilgore, M.; Mendelson, C.; Waterman, M. Regulation of the genes encoding steroidogenic enzymes. J. Steroid Biochem. Mol. Biol. 1991, 40, 45–52. [Google Scholar] [CrossRef]
- Connelly, M.A.; Williams, D.L. SR-BI and cholesterol uptake into steroidogenic cells. Trends in Endo. Metab. 2003, 14, 467–472. [Google Scholar] [CrossRef]
- Plump, A.S.; Erickson, S.K.; Weng, W.; Partin, J.S.; Breslow, J.L.; Williams, D.L. Apolipoprotein A-I is required for cholesteryl ester accumulation in steroidogenic cells and for normal adrenal steroid production. J. Clin. Invest. 1996, 97, 2660–2671. [Google Scholar] [CrossRef]
- Liu, J.; Heikkila, P.; Meng, Q.H.; Kahri, A.I.; Tikkanen, M.J.; Voutilainen, R. Expression of low and high density lipoprotein receptor genes in human adrenals. Eur. J. Endocrinol. 2000, 142, 677–682. [Google Scholar] [CrossRef]
- Landschulz, K.; Pathak, R.K.; Rigotti, A.; Krieger, M.; Hobbs, H.H. Regulation of scavenger receptor, class B, Type I, a high density lipoprotein receptor, in liver and steroidogenic tissues of the rat. J. Clin. Invest. 1996, 98, 984–995. [Google Scholar] [CrossRef]
- Azhar, S.; Nomoto, A.; Reaven, E. Hormonal regulation of adrenal microvillar channel formation. J. Lipid Res. 2002, 43, 861–871. [Google Scholar]
- Fu, T.; Kozarsky, K.F.; Borensztajn, J. Overexpression of SR-BI by adenoviral vector reverses the fibrate-induced hypercholesterolemia of apolipoprotein E-deficient mice. J. Biol. Chem. 2006, 278, 52559–52563. [Google Scholar]
- Mardones, P.; Pilon, A.; Bouly, M.; Duran, D.; Nishimoto, T.; Arai, H.; Kozarsky, K.F.; Altayo, M.; Miquel, J.F.; Luc, G.; Clavey, V.; Staels, B.; Rigotti, A. Fibrates down-regulate hepatic scavenger receptor class B type I protein expression in mice. J. Biol. Chem. 2003, 278, 7884–7890. [Google Scholar]
- Briand, O.; Lestavel, S.; Pilon, A. SR-BI does not require raft/caveola localization for cholesteryl ester selective uptake in the human adrenal cell line NCI-H295R. Biochim. Biophys. Acta 2003, 1631, 42–50. [Google Scholar] [CrossRef]
- Reaven, E.; Cortez, Y.; Leers-Sucheta, S.; Nomoto, A.; Azhar, S. Dimerization of the scavenger receptor class B type I: formation, function, and localization in diverse cells and tissues. J. Lipid Res. 2004, 45, 513–528. [Google Scholar]
- Revenu, C.; Athman, R.; Robine, S.; Louvard, D. The co-workers of actin filaments: From cell structures to signals. Nat. Rev. Mol. Cell. Biol. 2004, 5, 635–646. [Google Scholar]
- Deng, Y.L.; Utsunomiya, H.; Osamura, Y. The role of actin in changes of cell shape and steroidogenesis in mouse Y-1 cells stimulated by ACTH--immunocytochemical studies. Tokai J. Exp. Clin. Med. 1990, 15, 435–448. [Google Scholar]
- Hall, P.F. On the mechanism of action of ACTH: The role of actin. Endocr. Res. 1985, 10, 431–461. [Google Scholar] [CrossRef]
- Loesser, K.E.; Malamed, S. A morphometric analysis of adrenocortical actin localized by immunoelectron microscopy: The effect of adrenocorticotropin. Endocrinology 1987, 121, 1400–1404. [Google Scholar] [CrossRef]
- Loesser, K.E.; Cain, L.D.; Malamed, S. The peripheral cytoplasm of adrenocortical cells: Zone-specific responses to ACTH. Anat. Rec. 1994, 239, 95–102. [Google Scholar] [CrossRef]
- Hall, P.F. The roles of microfilaments and intermediate filaments in the regulation of steroid synthesis. J. Steroid Biochem. Mol. Biol. 1995, 55, 601–605. [Google Scholar] [CrossRef]
- Li, W.; Amri, H.; Huang, H.; Wu, C.; Papadopoulos, V. Gene and protein profiling of the response of MA-10 Leydig tumor cells to human chorionic gonadotropin. J. Androl. 2004, 25, 900–913. [Google Scholar]
- Papadopoulos, V.; Amri, H.; Li, H.; Boujrad, N.; Vidic, B.; Garnier, M. Targeted disruption of the peripheral-type benzodiazepine receptor gene inhibits steroidogenesis in the R2C Leydig tumor cell line. J. Biol. Chem. 1997, 272, 32129–32135. [Google Scholar]
- Lada, A.T.; Davis, M.; Kent, C.; Chapman, J.; Tomoda, H.; Omura, S.; Rudel, L.L. Identification of ACAT1- and ACAT2-specific inhibitors using a novel, cell-based fluorescence assay: individual ACAT uniqueness. J. Lipid Res. 2004, 45, 378–386. [Google Scholar]
- Sapolsky, R.M. Glucocorticoids and hippocampal atrophy in neuropsychiatric disorders. Arch. Gen. Psychiatry 2000, 57, 925–935. [Google Scholar] [CrossRef]
- Dedovic, K.; Duchesne, A.; Andrews, J.; Engert, V.; Pruessner, J.C. The brain and the stress axis: The neural correlates of cortisol regulation in response to stress. NeuroImage 2009, 47, 864–871. [Google Scholar]
© 2009 by the authors; licensee Molecular Diversity Preservation International, Basel, Switzerland. This article is an open access article distributed under the terms and conditions of the Creative Commons Attribution license ( http://creativecommons.org/licenses/by/3.0/).
Share and Cite
Xu, J.; Lecanu, L.; Tan, M.; Greeson, J.; Papadopoulos, V. Identification of a Benzamide Derivative that Inhibits Stress-Induced Adrenal Corticosteroid Synthesis. Molecules 2009, 14, 3392-3410. https://doi.org/10.3390/molecules14093392
Xu J, Lecanu L, Tan M, Greeson J, Papadopoulos V. Identification of a Benzamide Derivative that Inhibits Stress-Induced Adrenal Corticosteroid Synthesis. Molecules. 2009; 14(9):3392-3410. https://doi.org/10.3390/molecules14093392
Chicago/Turabian StyleXu, Jing, Laurent Lecanu, Matthew Tan, Janet Greeson, and Vassilios Papadopoulos. 2009. "Identification of a Benzamide Derivative that Inhibits Stress-Induced Adrenal Corticosteroid Synthesis" Molecules 14, no. 9: 3392-3410. https://doi.org/10.3390/molecules14093392