Introduction
Recent advances in chemical biology have prompted a need for reliable methods and strategies for combinatorial synthesis of abundant small molecule libraries, which can be used to elucidate the function of proteins [
1]. One attractive approach is the development of chemistry based on cascade [
2,
3] or multi-component reactions [
4,
5,
6] to generate diversified complex molecules with high efficiency. Since those molecules will be screened and possibly selected for development into clinical drug candidates, the selection of drug-like scaffolds is especially necessary. Pyrazoles are classic compounds with applications in pharmaceutical and agrochemical industry which are frequently found as substructures in a large variety of compounds which exhibit important biological activities and pharmacological properties [
7,
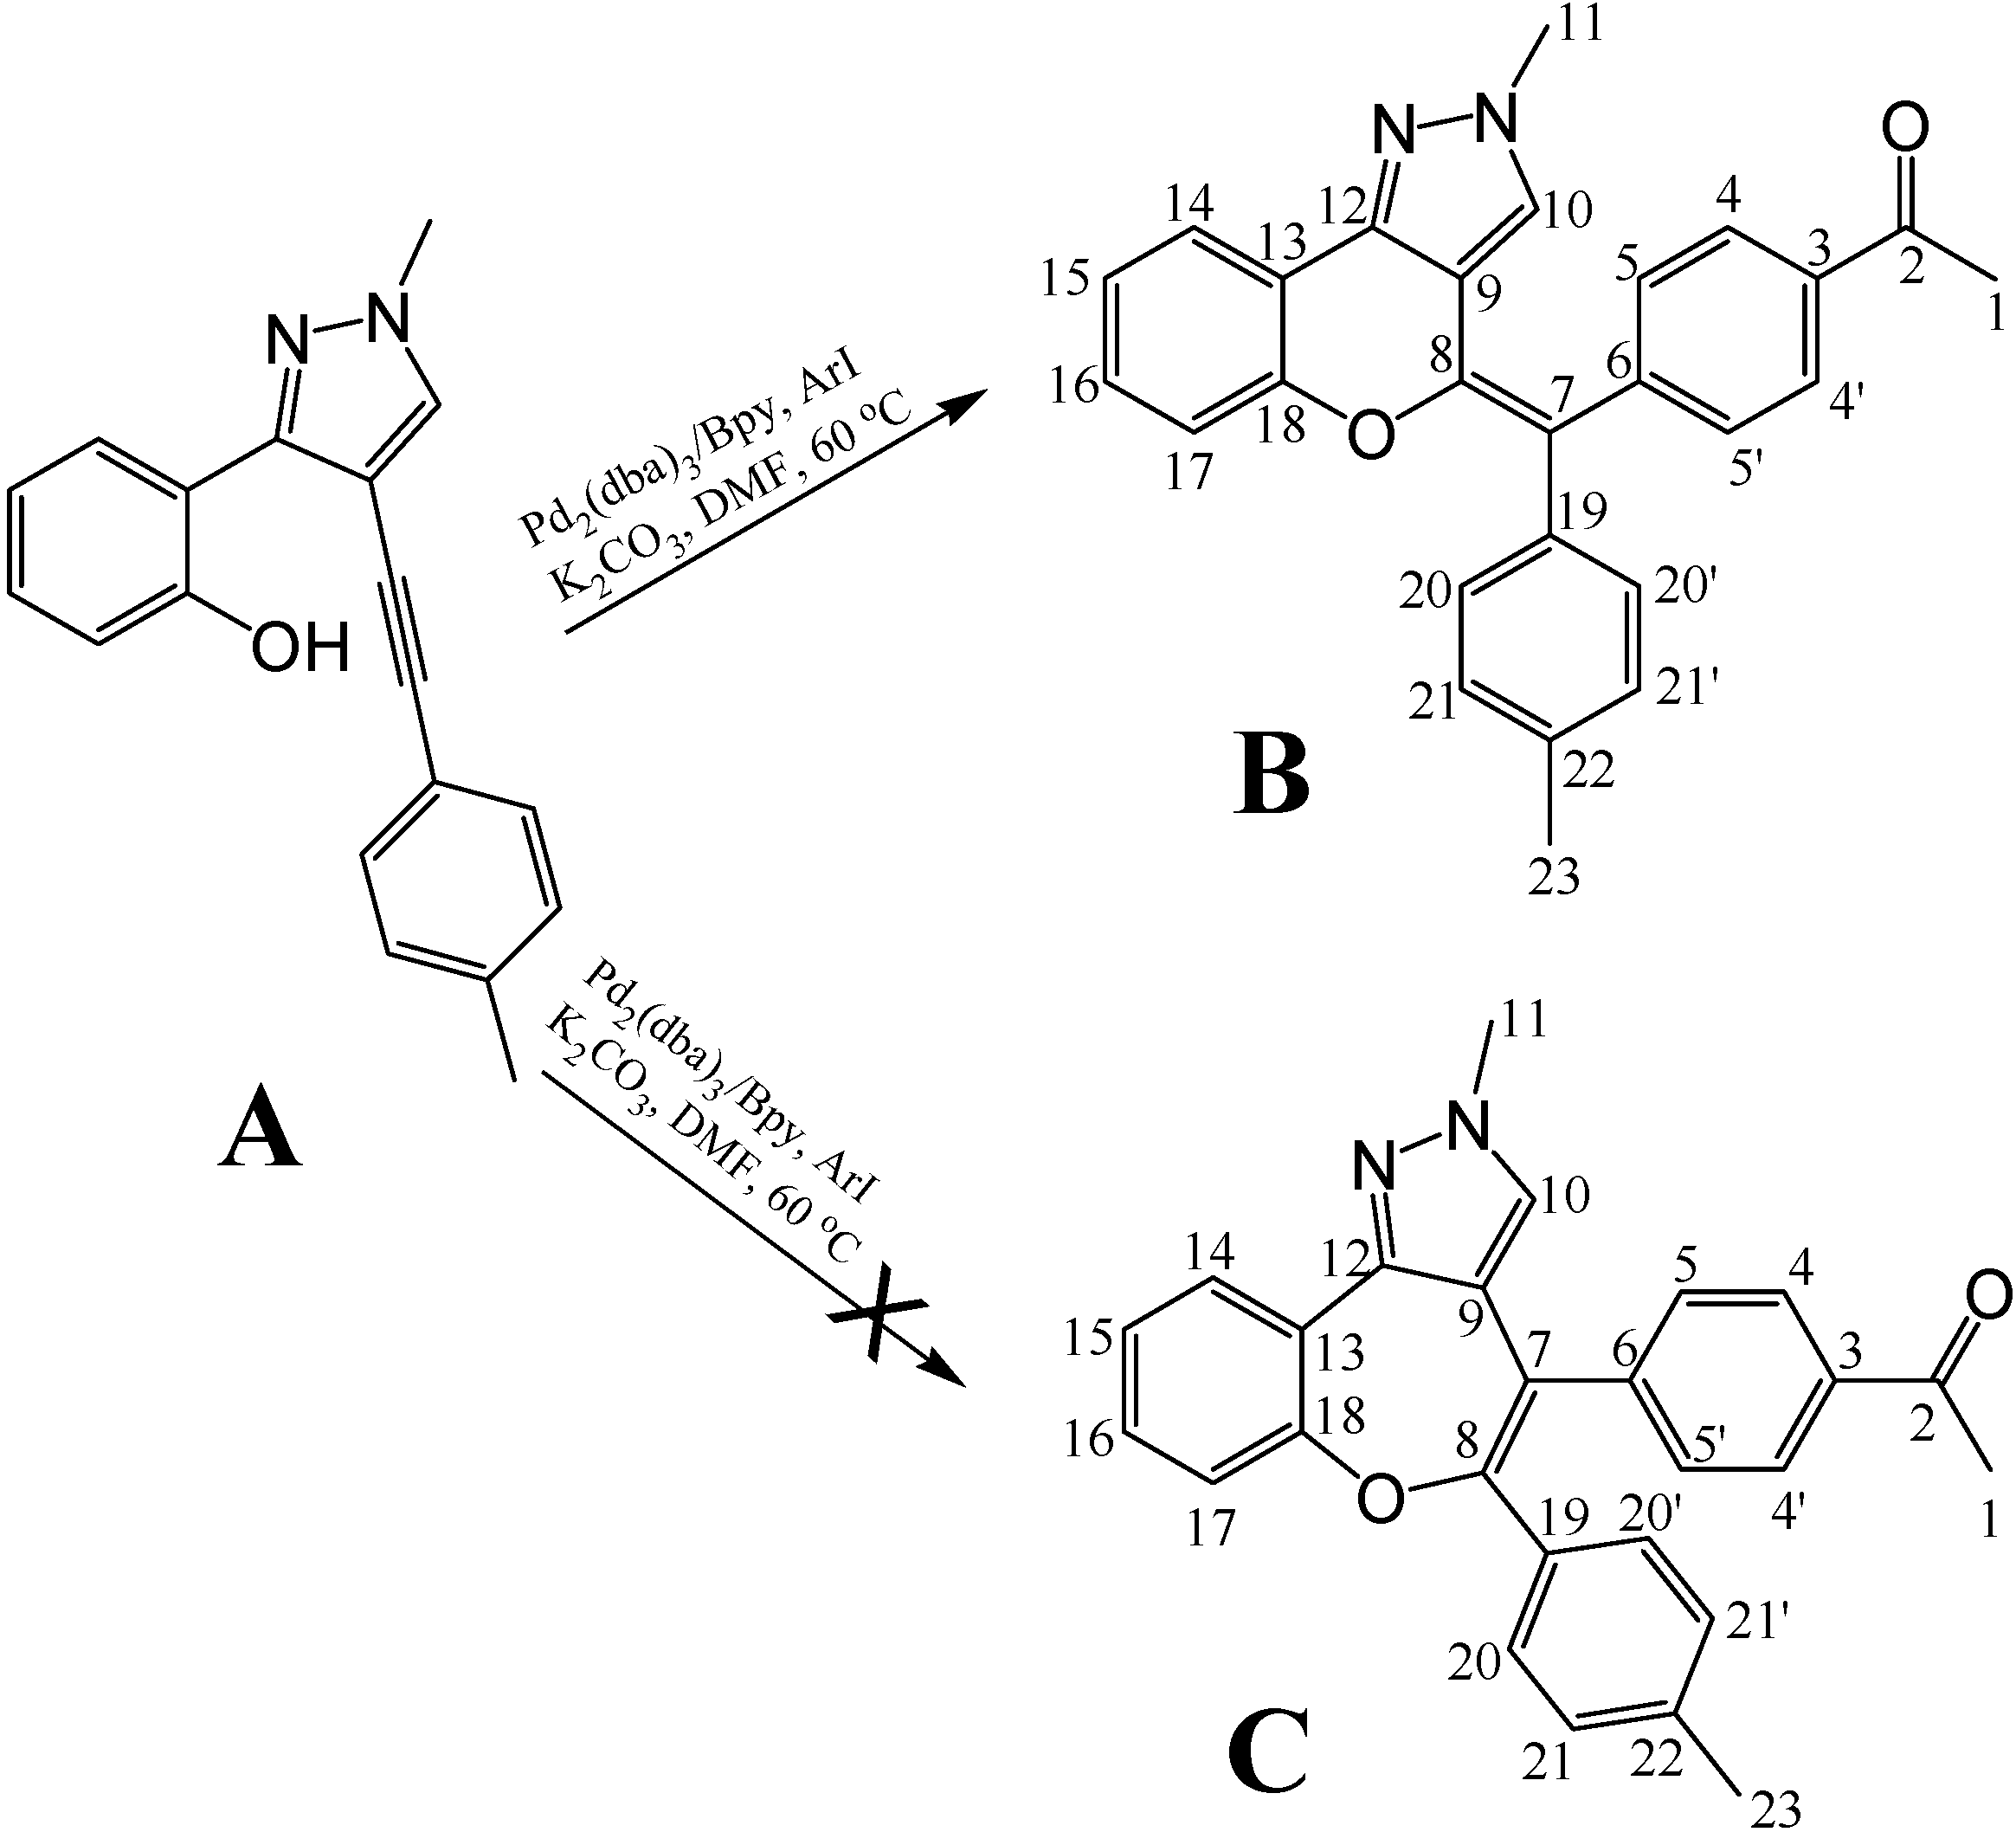
8]. Recently, a novel multi-component reaction approach was developed for efficiently producing pyrazolo[3,4]pyran scaffolds which made the combinatorial synthesis of pyrazolo[3,4]pyran-based libraries feasible (unpublished data). The final step of the synthetic method involved a palladium-catalyzed cyclization, but under the reaction conditions more than one product was possible (
Figure 1). We have now analyzed the configuration of a representative compound with 1D- and 2D-NMR spectroscopy and our results showed that the 6-member ring product (compound
B) was the dominant product of the palladium-catalyzed reaction between compound
A and aryl iodides. The complete
1H and
13C assignments for this representative compound are also reported.
Figure 1.
Final step of the synthetic method for the pyrazolo[3,4]pyran derivatives.
Figure 1.
Final step of the synthetic method for the pyrazolo[3,4]pyran derivatives.
Results and Discussion
NMR Spectrum Assignment
A series of 1D and 2D NMR spectra, including
1H,
13C, DEPT, COSY, HSQC and HMBC were recorded to assist with the signal assignments. The proton signals were readily assigned by analyzing the chemical shifts, integrations, coupling constants and coupling patterns, but unfortunately, it is difficult to assign the carbon signals for such a proton deficient system. Nevertheless, by using HSQC and HMBC spectra combined with analysis of the
13C-NMR line shapes and the predicted chemical shifts obtained using the ChemOffice software package, complete proton and carbon assignments were made and long-range connectivity determined from the HMBC data (
Table 1).
Table 1.
1H and 13C assignments for compound B and HMBC connectivity.
Table 1.
1H and 13C assignments for compound B and HMBC connectivity.
| Position | δH(mult., JHz) | δC | HMBC |
|---|
| 1 | 2.65(s) | 26.74 | -- |
| 2 | -- | 199.46 | H-1, H-4 |
| 3 | -- | 135.84 | H-5, H-1 |
| 4 | 8.07(d, 8.0) | 129.43 | H-1, H-4’ |
| 5 | 7.42(d, 8.0) | 131.01 | H-4, H-5’ |
| 6 | -- | 145.23 | H-4, H-5 |
| 7 | -- | 113.96 | H-5, H-20 |
| 8 | -- | 140.46 | H-5, H-20 |
| 9 | -- | 110.33 | H-10 |
| 10 | 6.15 (s) | 128.24 | H-11 |
| 11 | 3.73(s) | 39.07 | H-10 |
| 12 | -- | 141.82 | H-10, H-14, H-17 |
| 13 | -- | 115.66 | H-14, H-15, H-17 |
| 14 | 7.71(dd, 7.5, 1.0) | 121.42 | H-10, H-15, H-16 |
| 15 | 7.11(dd, 7.5, 7.5) | 122.82 | H-17 |
| 16 | 7.32(ddd, 7.5, 7.5, 1.0) | 129.69 | H-14 |
| 17 | 7.02(d, 7.5) | 115.86 | H-15, H-16 |
| 18 | -- | 151.63 | H-14, H-15, H-16, H-17 |
| 19 | -- | 135.74 | H-21 |
| 20 | 7.25(d, 8.5) | 128.98 | H-20’ |
| 21 | 7.14(d, 8.5) | 128.50 | H-23,H-21’ |
| 22 | -- | 135.20 | H-20, H-23 |
| 23 | 2.29(s) | 20.68 | H-21 |
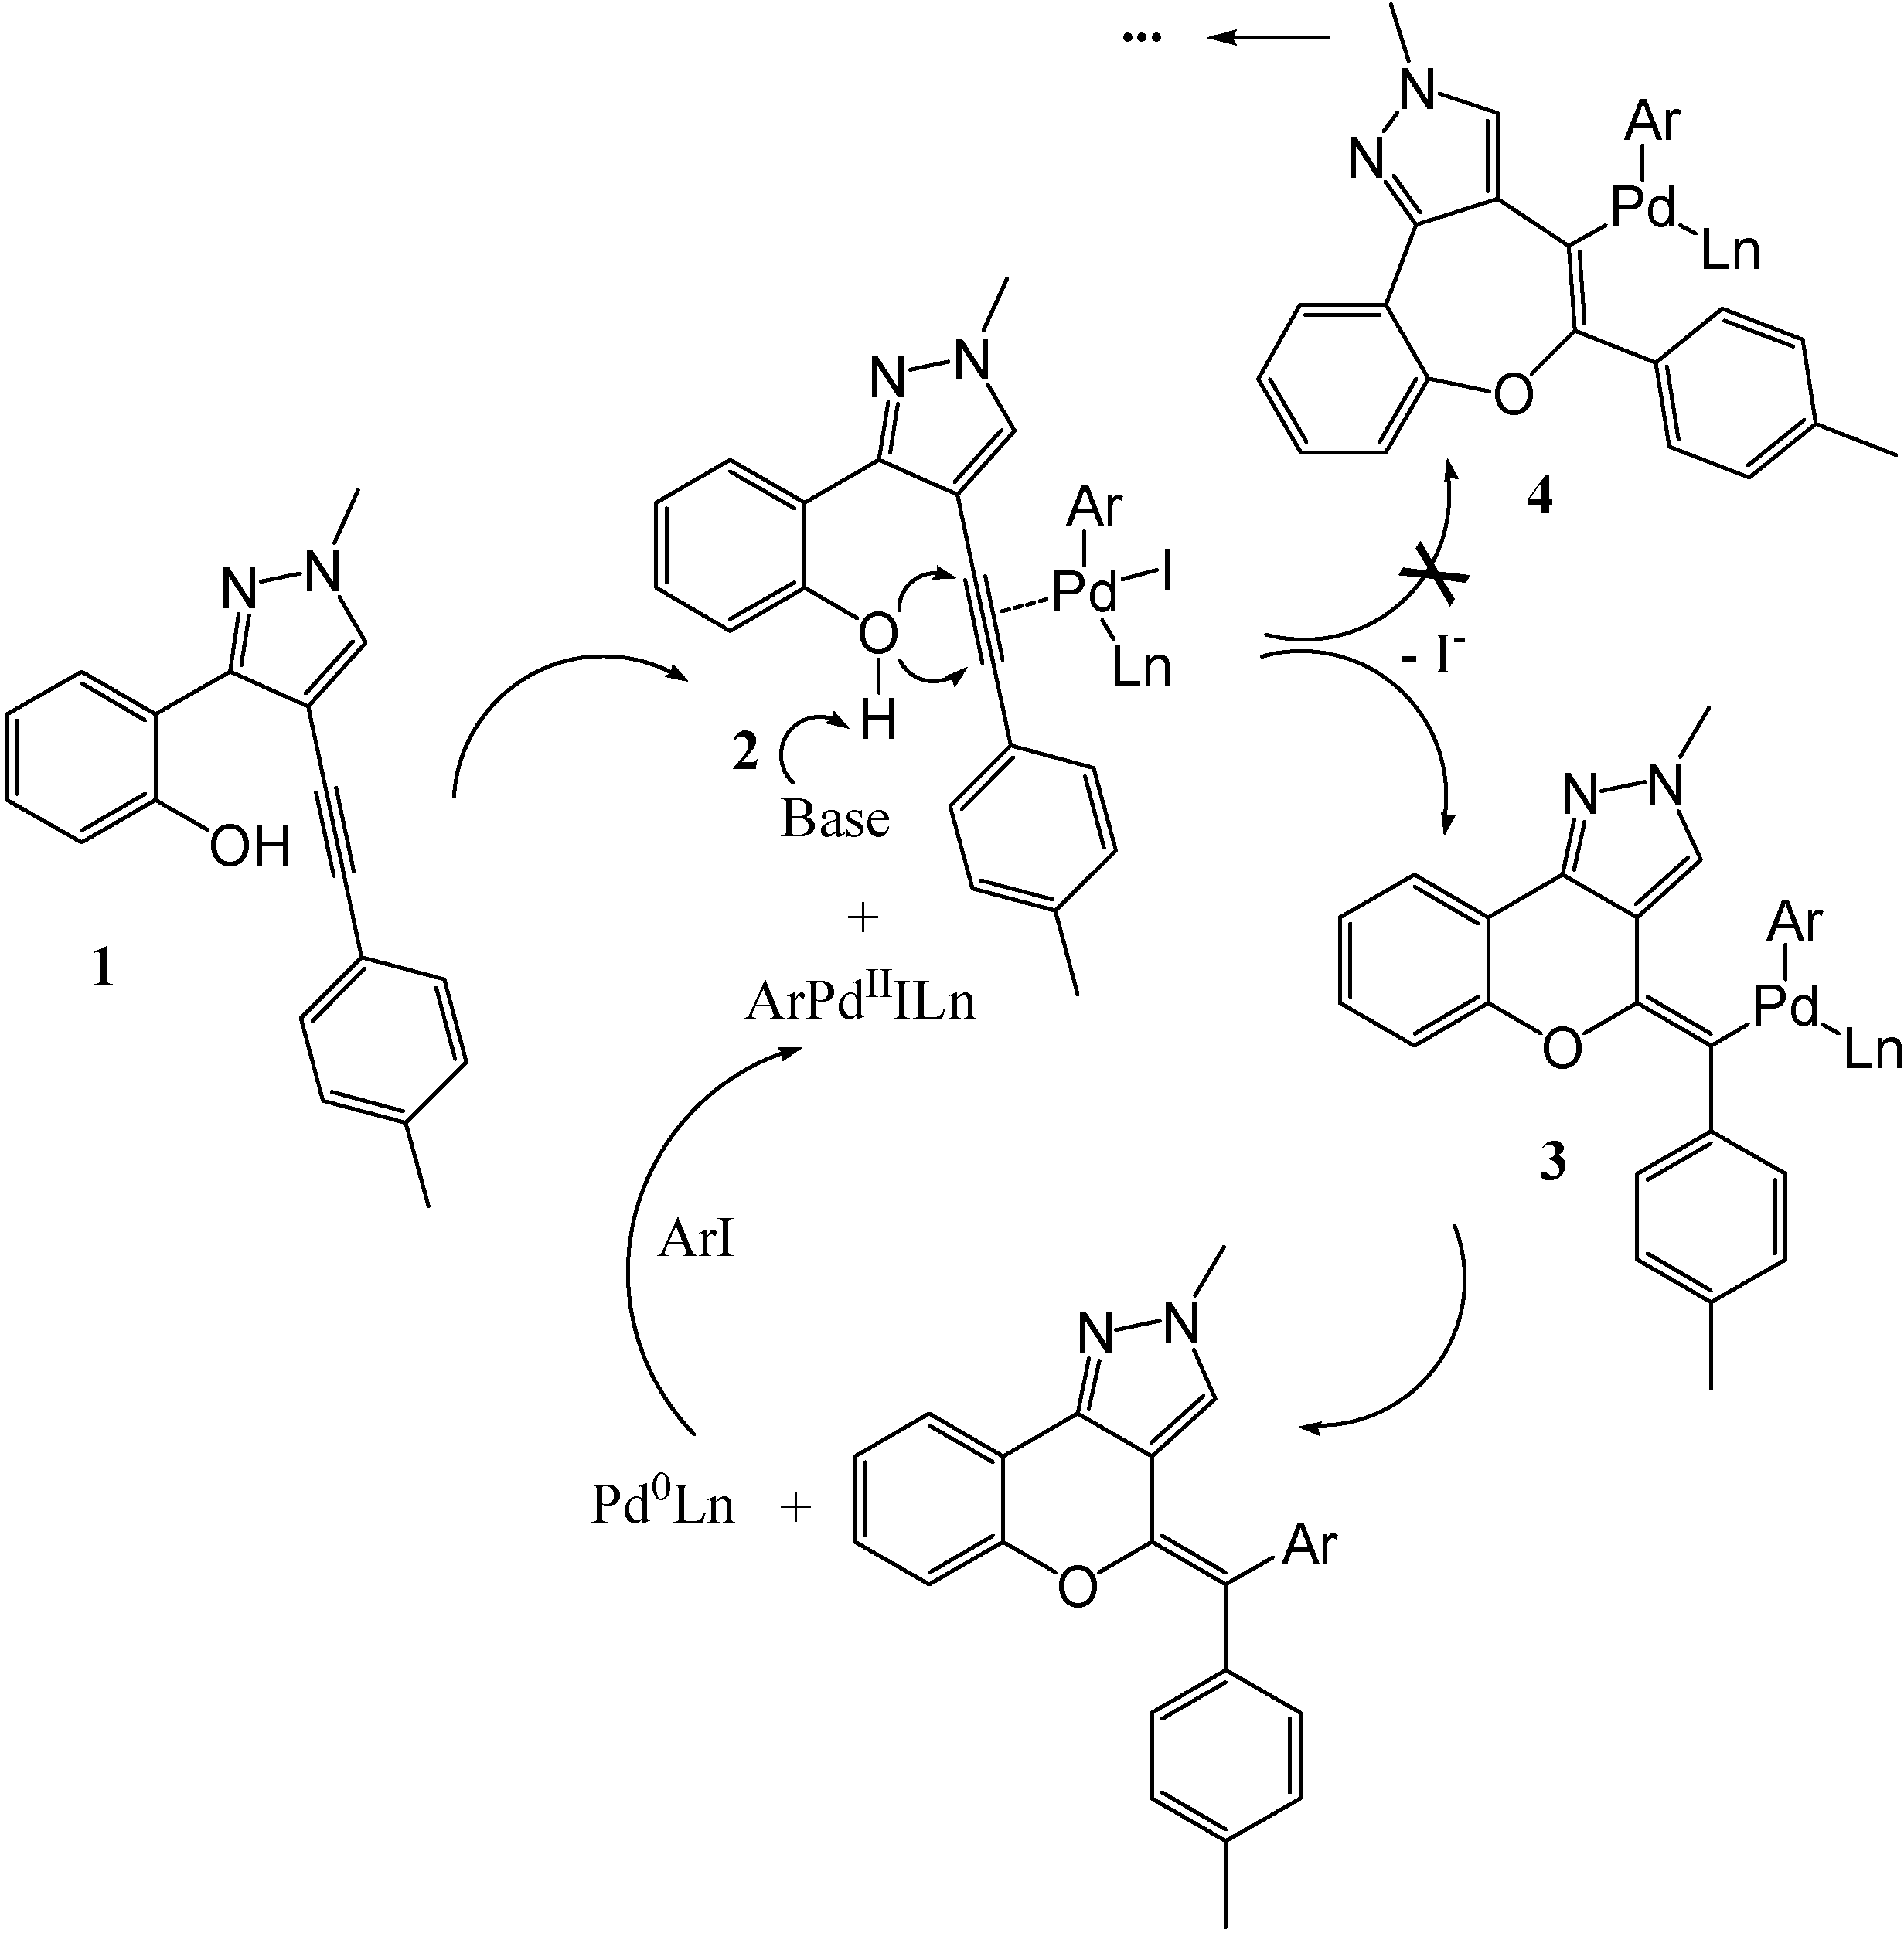
Possible Reaction Mechanism and Stereochemistry
A possible scenario for the palladium catalyzed cyclization reaction which presumably involves oxidative addition of aryl iodides to Pd
0 to generate ArPd
IIILn has been documented [
9]. The Pd
II complex then coordinates with the alkyne
1 to form
2, followed by the base promoted intramolecular
exo-cycloaddition to give the final product. The regioselectivity of this reaction is unknown, and more than one product is possible (see
Figure 2).
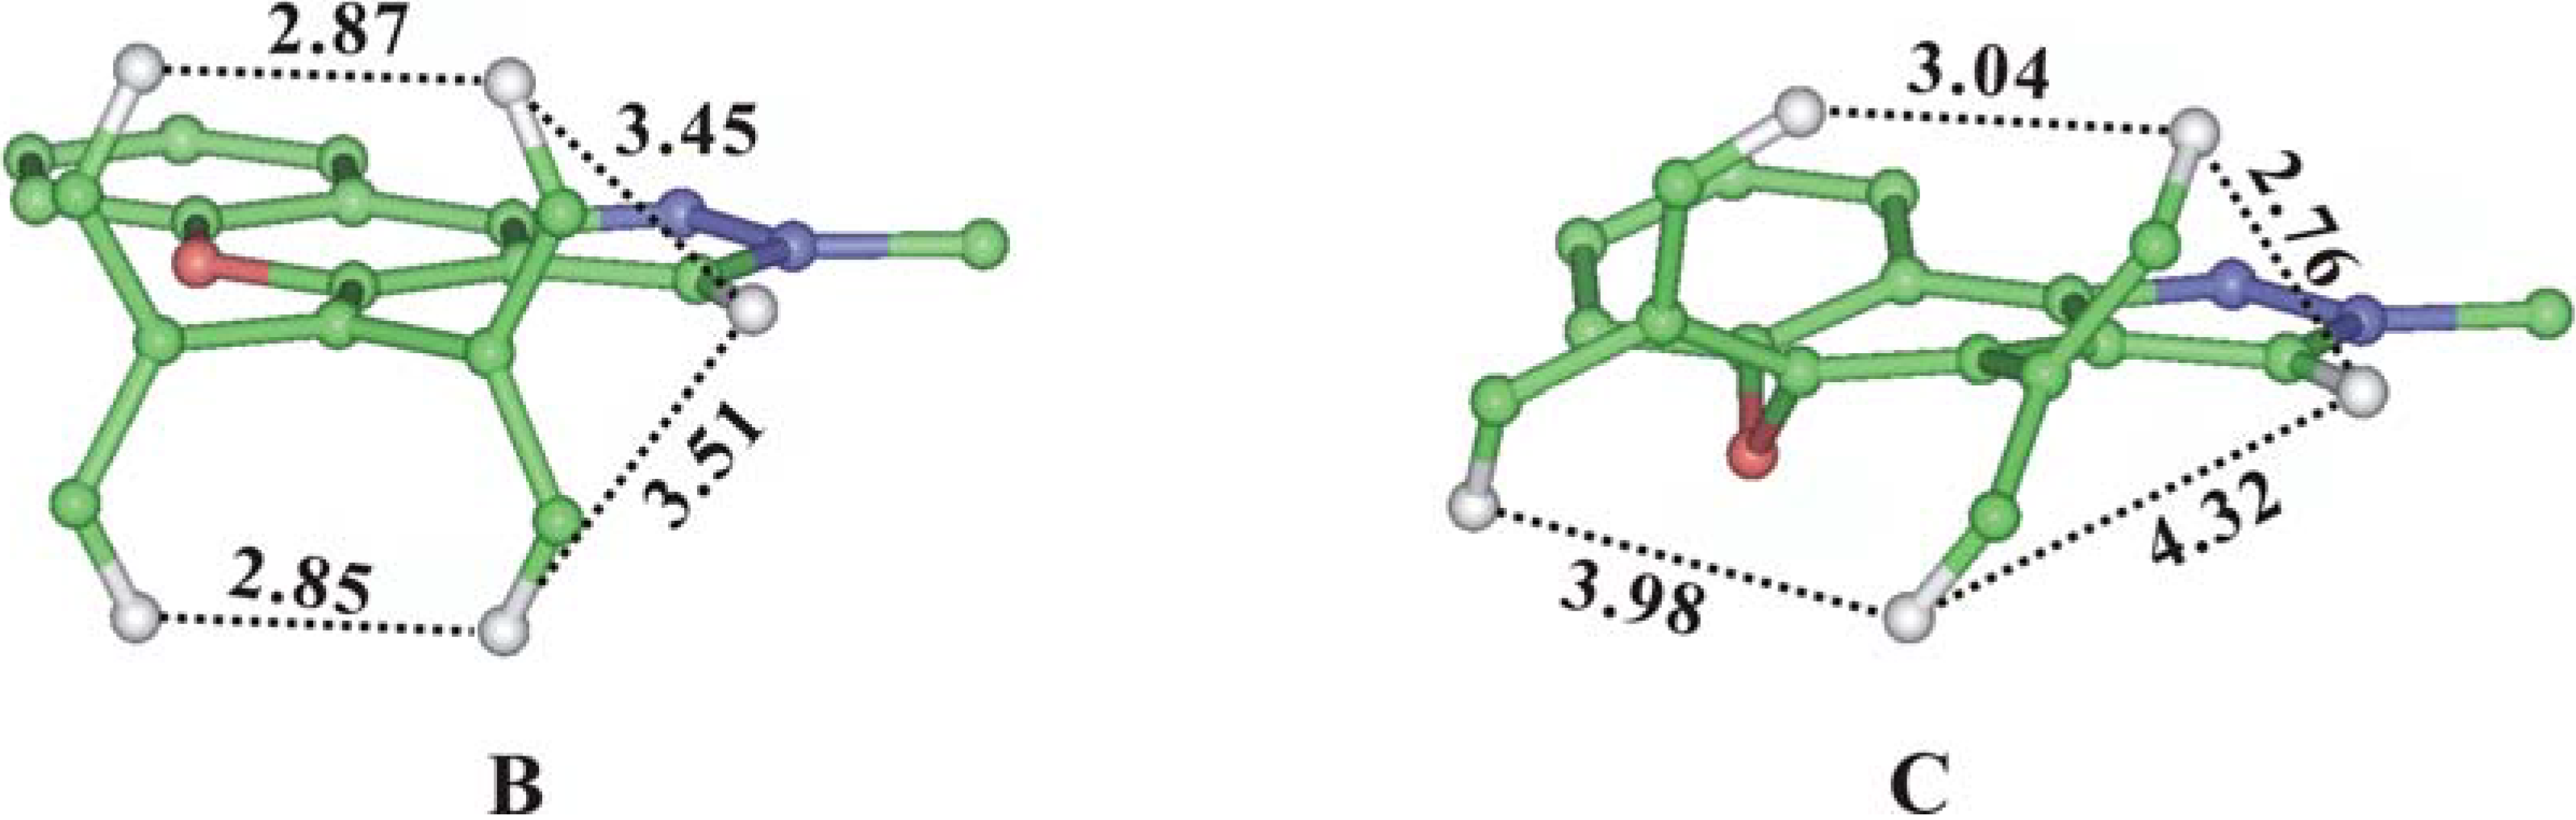
We could conclude from the formulae of compounds
B and
C that these two compounds could not be distinguished by chemical shift differences. We therefore performed a simple energy minimization using the Insight II software and measured the specific distances before performing the homonuclear experiments such as NOESY or ROESY. Unfortunately the distances were all in the same scale and the possibility of solving the structural problem with NOESY experiments became uncertain (
Figure 3).
Figure 2.
Possible Mechanism of the Palladium Catalyzed Cyclization.
Figure 2.
Possible Mechanism of the Palladium Catalyzed Cyclization.
Figure 3.
Energy Minimized Structure and Specific Proton Distances of Compound B and C (some heavy atoms and hydrogens were removed from the view for clarity).
Figure 3.
Energy Minimized Structure and Specific Proton Distances of Compound B and C (some heavy atoms and hydrogens were removed from the view for clarity).
The HMBC Spectrum
In our assignment approach, the HMBC spectrum was used to check the assignment correctness as normally used in proton-abundant systems and all signals of the spectrum were not assigned. But as the HMBC spectrum utilizes the long-range heteronuclear couplings to establish connectivity, it could be a possible solution to the configuration determination problem for this proton-deficient system. The signal intensity of the HMBC spectrum is a function of the n-bond coupling constant, which can be presented by the following expression [
10]:
where the
nJCH is the n-bond heteronuclear coupling constant and Δ
2 is the long-range delay and Δ
2=1/(2×
nJCH). From the intensity expression we could deduce that for a fixed Δ
2 delay, the peak intensities in a HMBC spectrum are directly related to the n-bond coupling constants.
The magnitude of
nJCH could be affected by various factors, such as the hybridization of carbon, substitution electronegativity, steric constrains and so on [
11]. Considering the similar structures and substitution in both compounds, the C7 and C8 carbons should have comparable
nJCH to other protons. For example, in compound
B, C7-H20 with a
3JCH should be a strong peak, while in compound
C this peak should be a weak one (
4JCH). Therefore, it is possible to solve the configuration problem with HMBC by selecting appropriate cross peaks and examining their intensities.
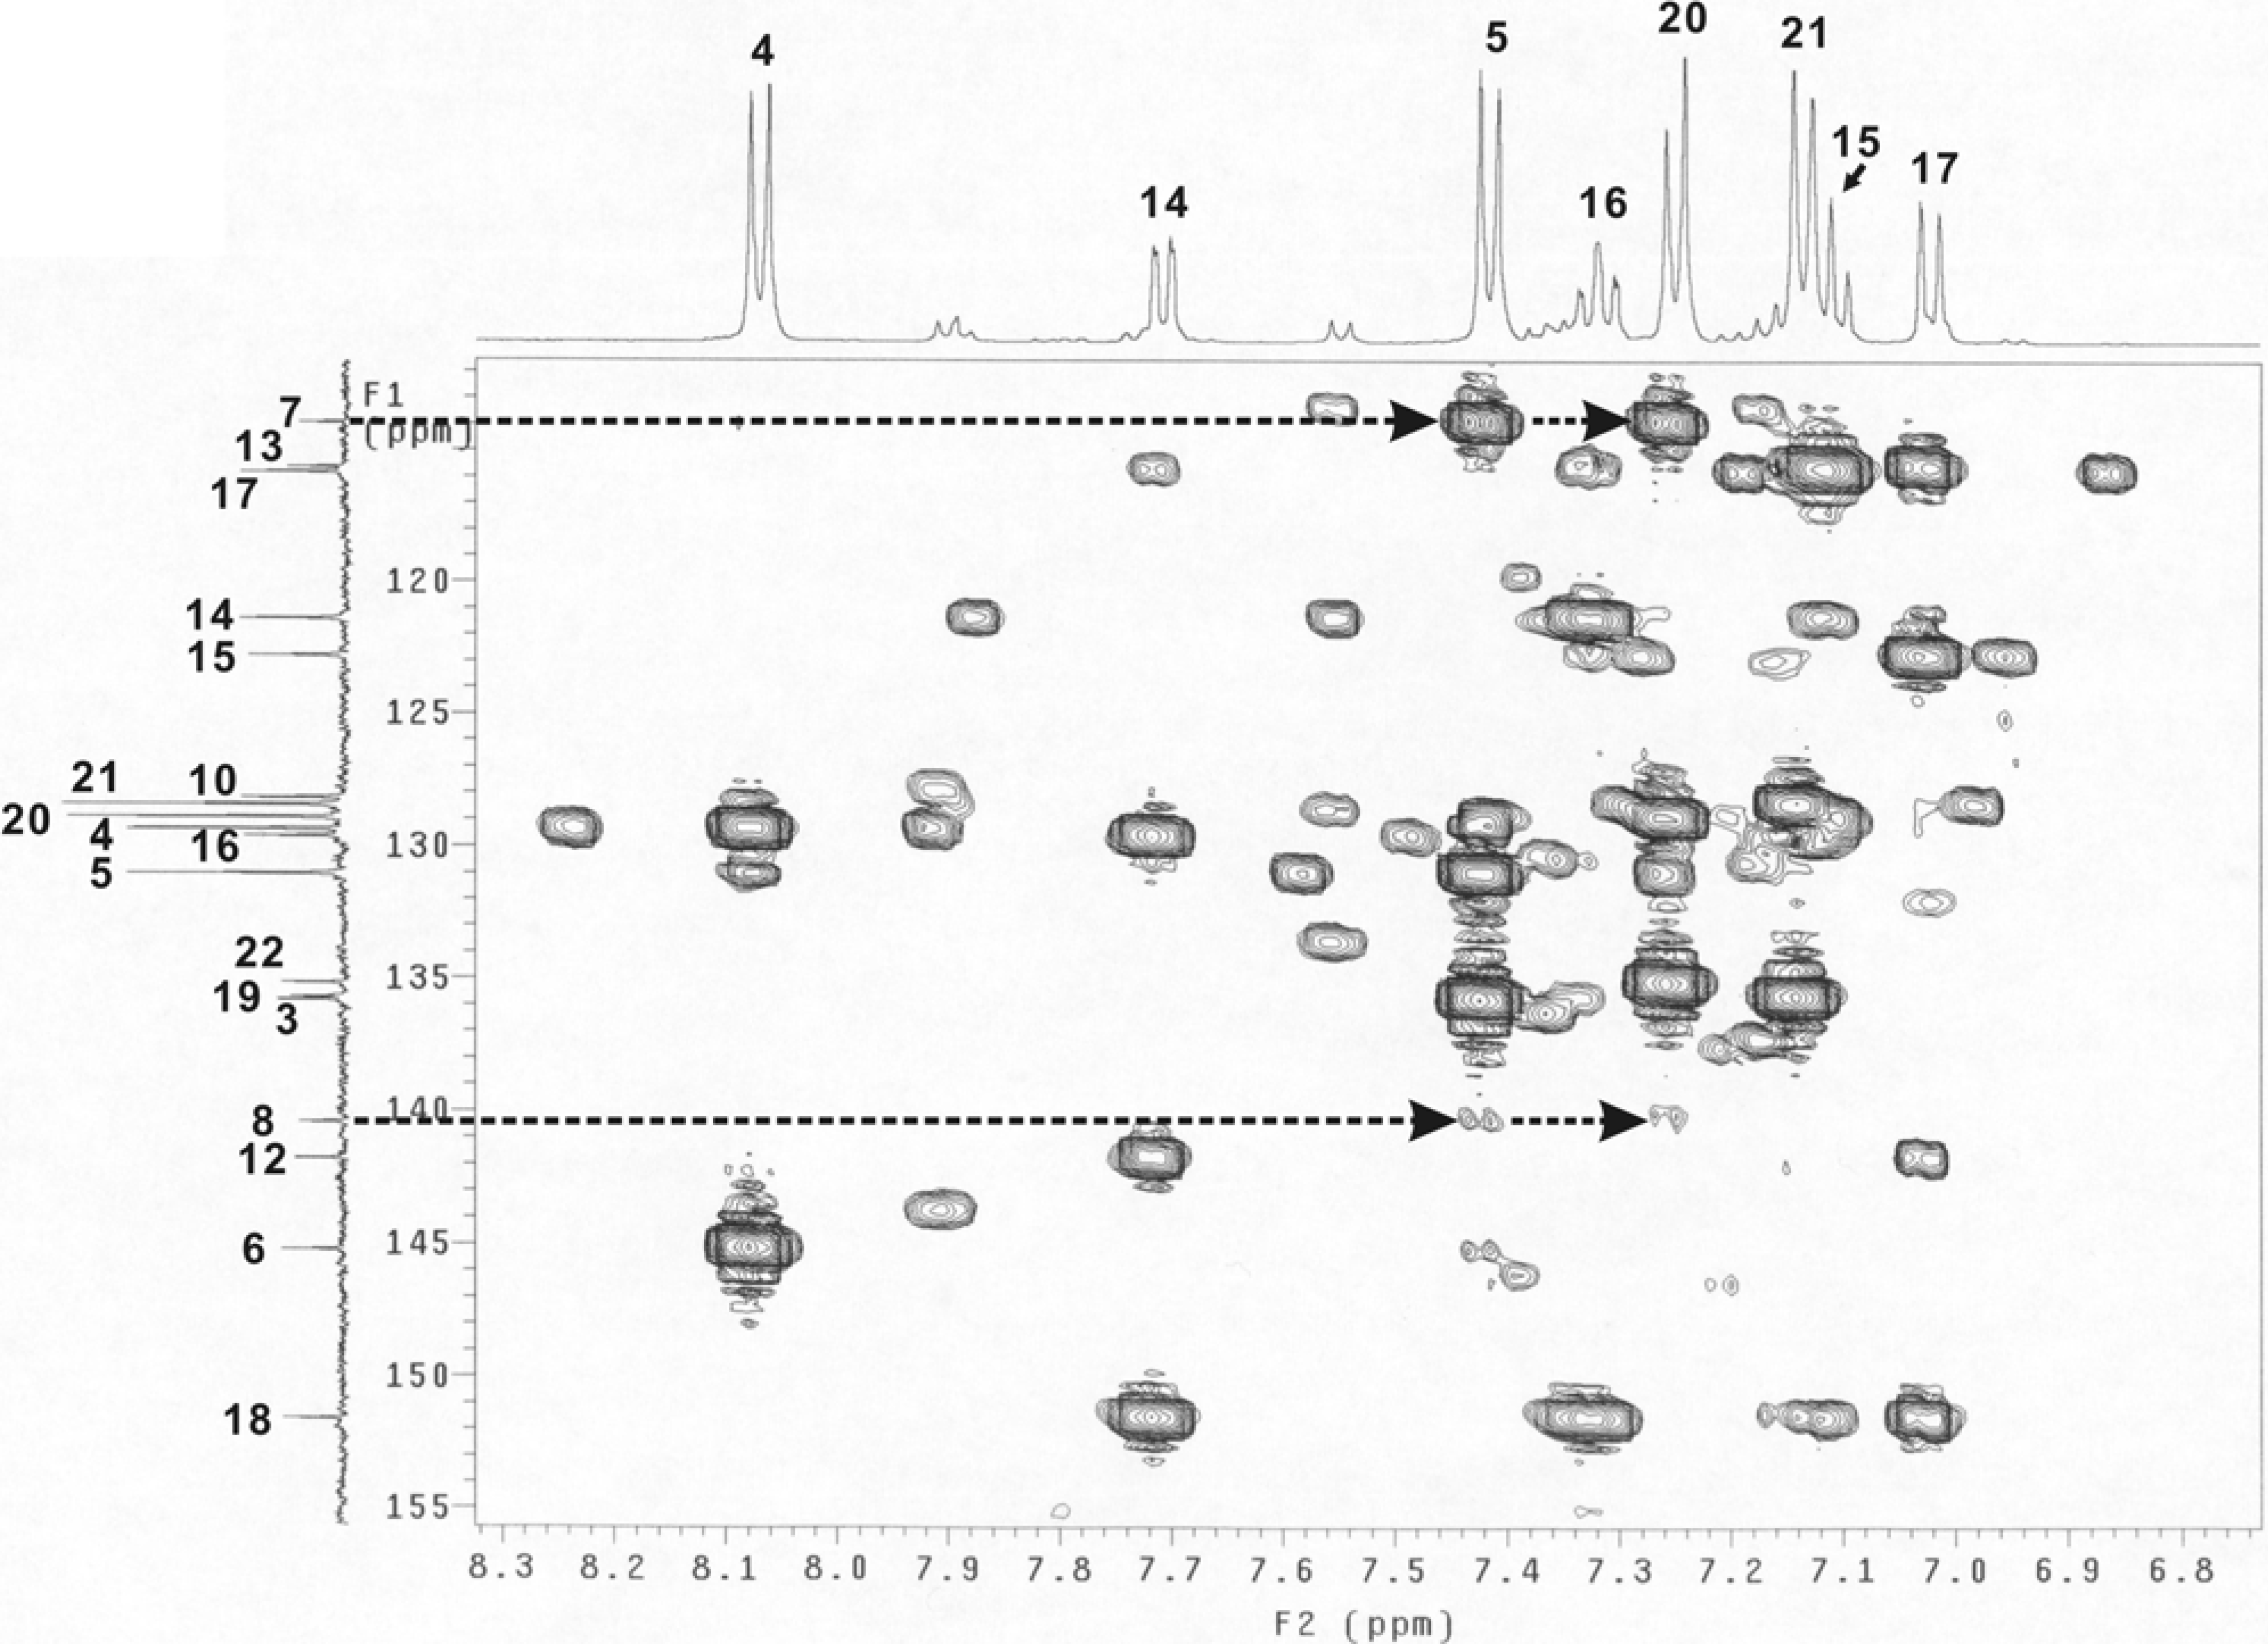
Figure 4.
Part of the HMBC spectrum (dashed lines with arrows indicating the cross peaks of C7-H5, C7-H20, C8-H5 and C8-H20).
Figure 4.
Part of the HMBC spectrum (dashed lines with arrows indicating the cross peaks of C7-H5, C7-H20, C8-H5 and C8-H20).
In the experimental conditions, the Δ
2 value is set to 60 ms. This value is optimized for those long-range couples with a coupling constant around 8 Hz (6-10 Hz), since the pairs with smaller coupling constants could not build up sufficiently in such a short delay time, while those with larger coupling constants would decay away in the Δ
2 delay. The typical
2JCH and
4JCH is around 1-2 Hz for aromatic systems and cis-alkenes [
12], and the signals for the two or four bond connectivity are expected to be weak peaks in the HMBC spectrum. The three bond connectivity signals, with a typical
3JCH around 8 Hz [
12], are expected to appear in the spectrum as strong peaks.
For compounds
B and
C, the signal intensities of C7 and C8 to H5 and H20 should be different, as indicated by the predicted results shown in
Table 2. A part of the HMBC spectrum which included the cross peaks of C7-H5, C7-H20, C8-H5 and C8-H20 is shown in
Figure 4. The peak intensities were almost the same for the C7-H5 and C7-H20 (appearing as strong peaks) and for that of the C8-H5 and C8-H20 (as weak peaks). These results indicated that H5 and H20 were three bonds away from C7 while the distances to C20 involved four bonds. The experimental data therefore was a good match with the predicted results for compound
B.
Table 2.
Predicted HMBC Peak Intensities for Compounds B and C.
Table 2.
Predicted HMBC Peak Intensities for Compounds B and C.
| Position | Predicted Result |
|---|
| Compound B | Compound C |
|---|
| C7 | C8 | C7 | C8 |
|---|
| H5 | Strong | Weak | Strong | Weak |
| H20 | Strong | Weak | Weak | Strong |
Molecular Modeling of Regioselectivity
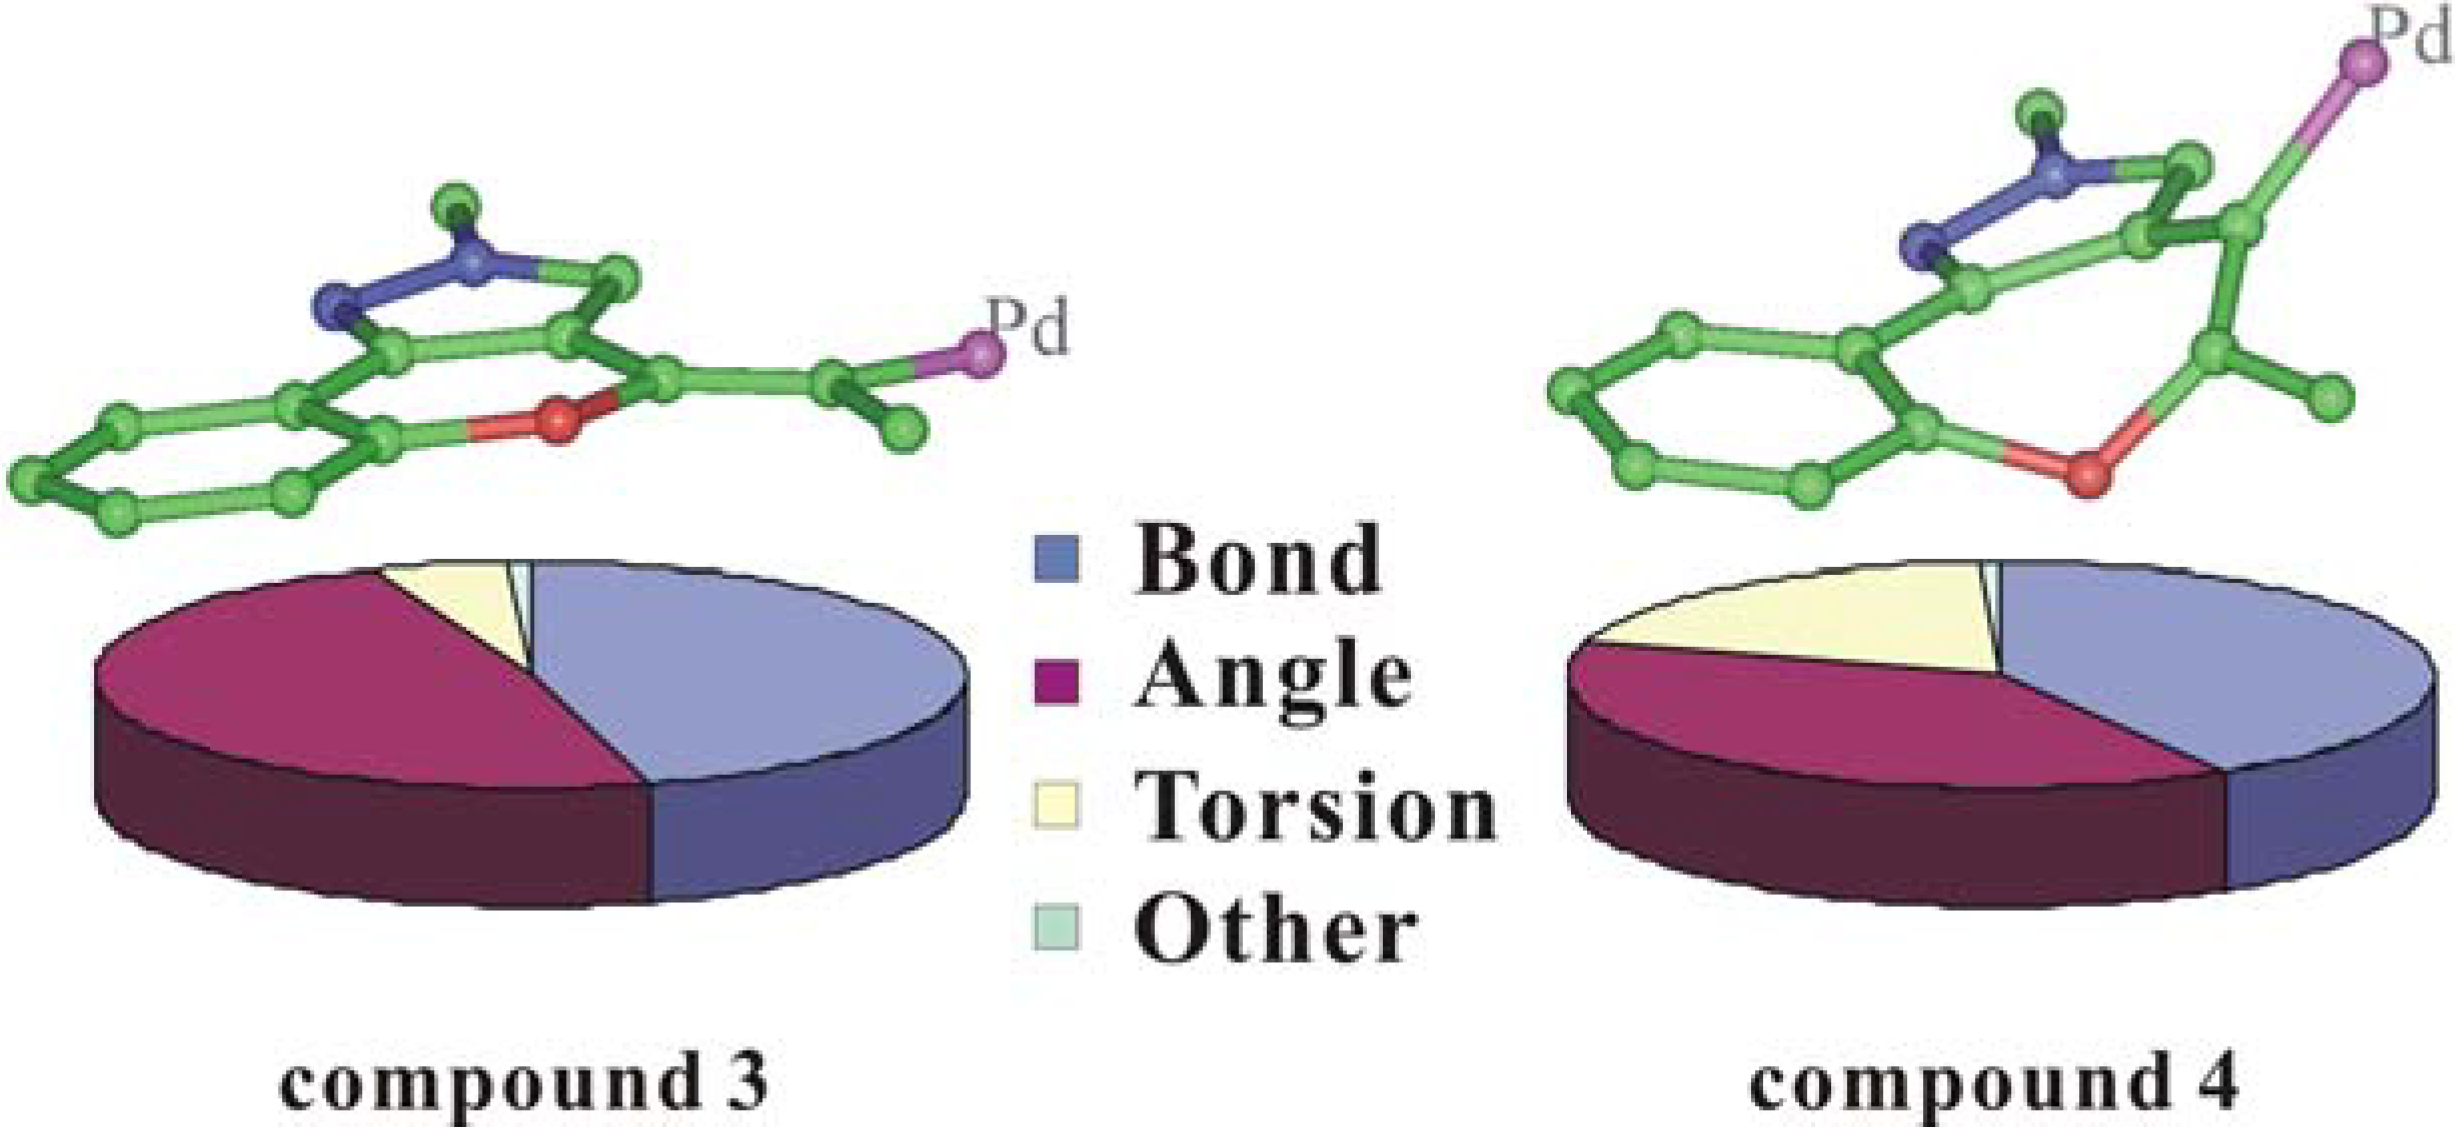
To further understand the observed product, a potential energy calculation was performed for compounds
3,
4,
B and
C with the Insight II software package using the cvff force field. The total potential energy includes the overall internal energy and the overall nonbonded energy. Compounds
3 and
4 had very similar nonbonded energies (137.367 kcal/mol versus 139.481 kcal/mol) while the internal energy was their main distinguishing feature (141.394 kcal/mol versus 171.863 kcal/mol). Analysis of the components of the internal energy found a significant difference (Δ = 26.861 kcal/mol) in the torsion energy between the intermediates
3 and
4 (
Figure 5). This may be due to the distorted conjugated plane of the compound
4 around the 7-member-ring and the twisted double-bond newly formed (
Figure 5), resulting from the introduction of the palladium bulky group. And the torsion difference is also the predominant contribution to the total potential energy difference (Δ = 32.582 kcal/mol).
Loss of the palladium and its ligand would not alleviate the distortion (cf.
Figure 3 and
Figure 5), leading to the compound
C with a similar torsion energy (34.138 kcal/mol in compound
4 and 34.228 kcal/mol in compound
C). The unusual high torsion energy of compound
4 and
C indicated that the space between the pyrazole ring and the benzyl group was insufficient to comfortably accommodate a bulky group, as it was in the 6-member-ring compounds
3 and
B. Thus, the transient state of the intramolecular cyclization which might prefer maintaining a flat conjugated plane selected the pathway leading to compound
B with less torsion energy (8.017 kcal/mol).
Conclusions
In summary, the configuration of the representative compound was successfully solved by analysis of the HMBC spectrum. The characteristic double-strong and double-weak cross peak pattern for C7 and C8 could be used for further configuration determination for other pyrazolo[3,4]pyran derivatives from the palladium catalyzed cyclization reaction mentioned above. An analysis of the reaction procedure with the potential energy by molecular modeling gave a set of data with accordance to the HMBC analysis. In general, for the proton-deficient system, while the configuration is difficult to determine with the homonuclear methods such as NOESY and coupling constant measurement experiments, the analysis of the HMBC spectrum proved to be an efficient solution.
Figure 5.
Internal Energy Components and Energy Minimized Structures for Compounds 3 and 4 (some bulky groups and hydrogens were removed from the view for clarity).
Figure 5.
Internal Energy Components and Energy Minimized Structures for Compounds 3 and 4 (some bulky groups and hydrogens were removed from the view for clarity).
Experimental
All NMR spectra were recorded on a Varian INOVA 500 spectrometer in DMSO-d6 at 300 K with the proton resonance at 499.8877381 MHz. Chemical shifts were referenced to 0.1% internal TMS at 0 ppm and solvent signal at 39.5 ppm for the 1H and 13C experiments, respectively. The one-dimensional 1H spectrum was acquired with a spectra width of 4753 Hz and that for the 13C spectrum was 32,000 Hz. 32k and 64k complex data points were recorded for the 1D 1H and 13C spectra, respectively, and Fourier transformed after zero-filling. Two-dimensional HSQC and HMBC spectrum were acquired using state-TPPI for quadrature detection in the indirectly detected dimension, with 256 increments in t1 and 2,048 data points in the t2 domain, and the spectral width was 5,000 Hz and 30,165.9 Hz for the directly and indirectly detected dimension respectively. Two-dimensional time domain data were then Fourier transformed to a 2,048×2,048 data matrix after appropriate window function and zero-filling. All spectra were Fourier transformed with the VNMR software (Varian Co. Ltd.). The pulse programs were taken from the standard Varian pulse sequence library.
Molecular modeling was preformed on a SGI Origin2000 workstation. Calculations were carried out with the Discover3 module of the Insight II package (Accelrys Inc.) The initial molecules were optimized with minimization and molecular dynamics. The cvff force field was selected for potential energy calculation base on the optimized molecules. Potential energies of compounds 3, 4, B, C and two model compounds, with the benzyl and ligated palladium groups replaced by protons, were calculated for analysis (data not shown for brevity).


