
An Entropy-Based Network Anomaly Detection Method


Abstract
:
1. Introduction
- Section 2 reviews related work in the area of network anomaly detection.
- Section 3 introduces the definition of Shannon entropy and describes Renyi and Tsallis generalizations. Brief overview as well as comparison of entropy measures are provided.
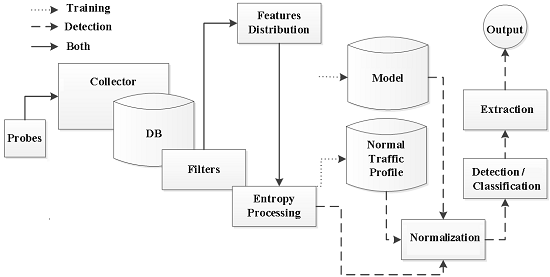
- Section 4 presents the architecture of the proposed method. Detailed specification as well as results of implementation are given.
- Section 5 refers to the dataset developed in order to evaluate a performance of the proposed method.
- Section 6 presents results of verification of the method.
- Section 7 finishes this article providing conclusions and short summary. It also outlines further work.
2. Related Work
2.1. General Overview of Network Anomaly Techniques
2.2. Closely Related Work
2.2.1. Detection via Counters
2.2.2. Detection via Feature Distributions
Shannon Entropy
Generalized entropy
Others Techniques
3. Entropy
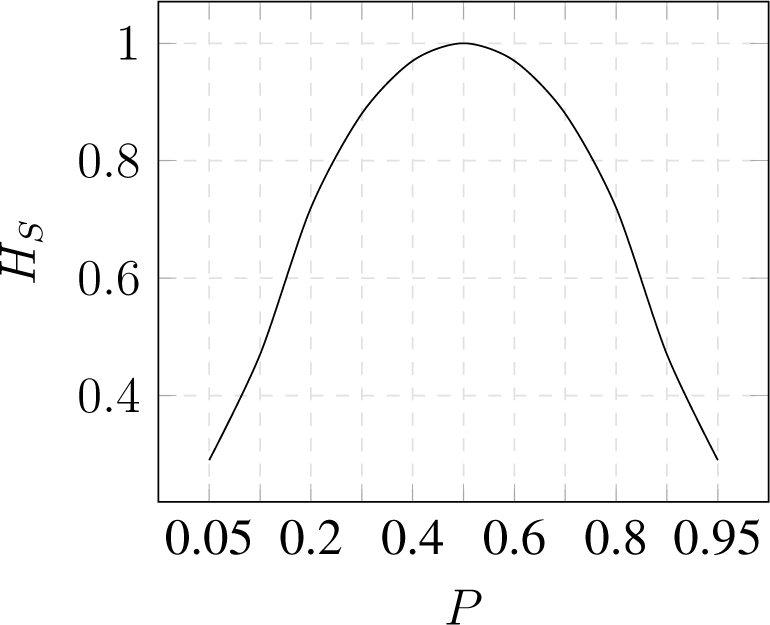
3.1. Shannon Entropy
- Nonnegativity ;
- Symmetry Hs(p(x1), p(x2), …) = Hs(p(x2), p(x1), …);
- Maximality ;
- Additivity Hs(X, Y) = Hs(X) + Hs(Y) if X and Y are independent variables.
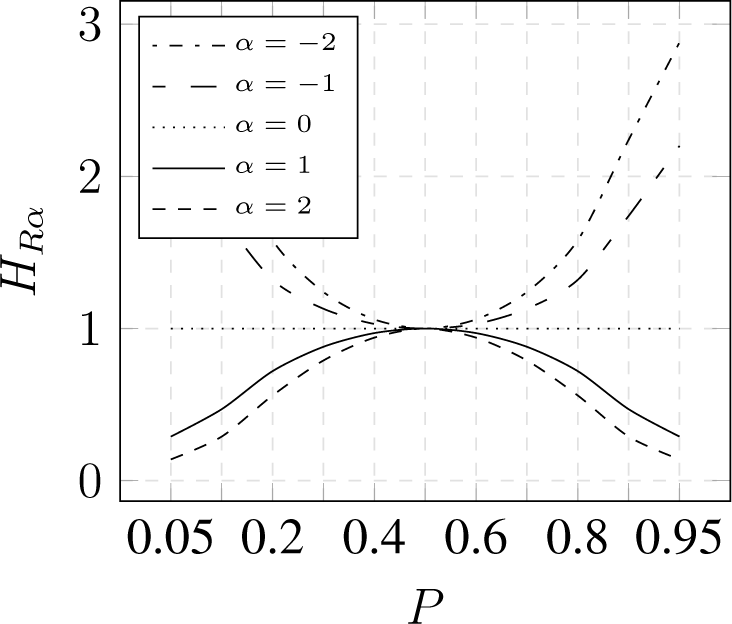
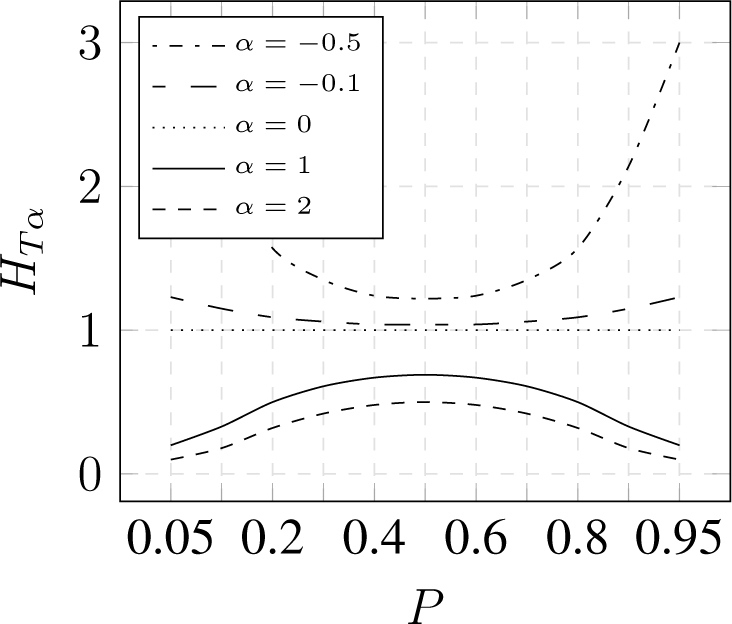
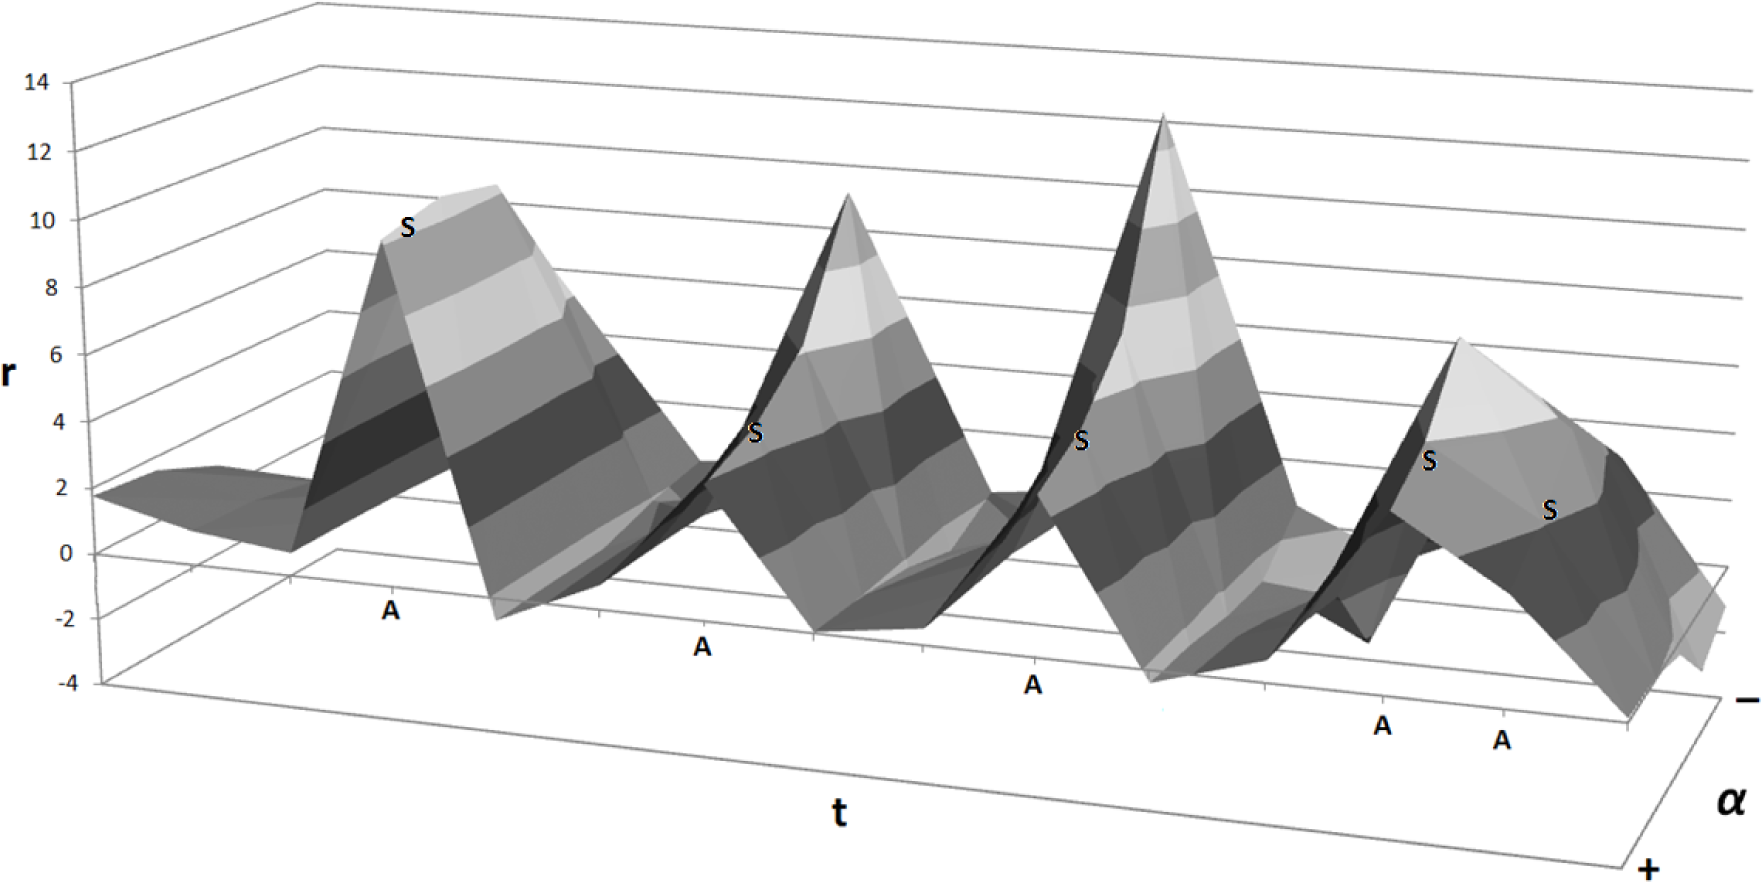
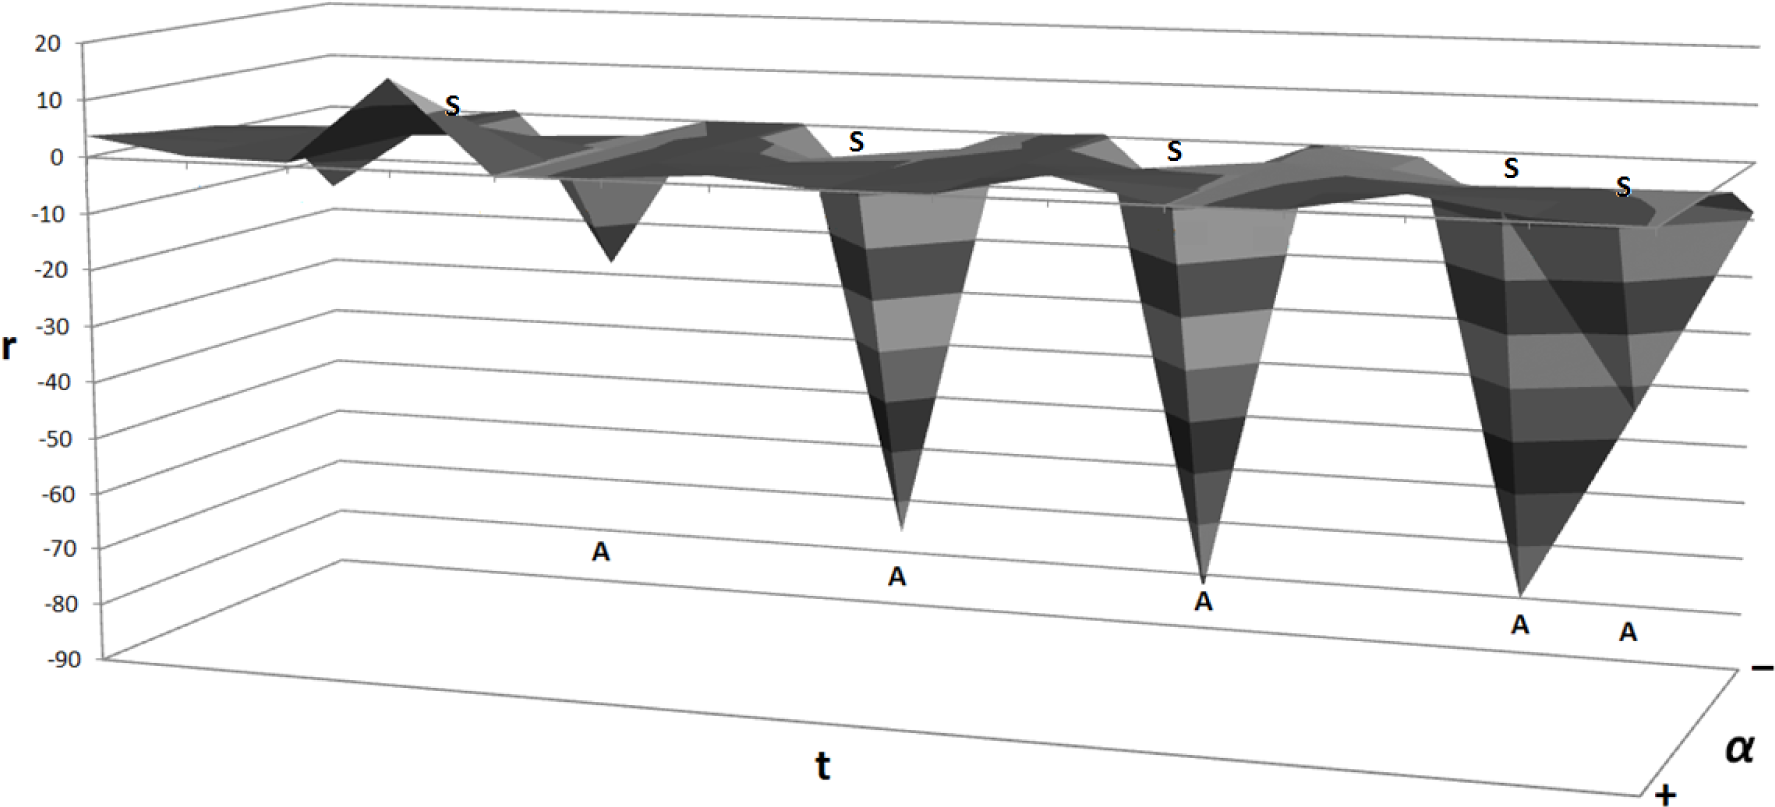
3.2. Parameterized Entropy
- expose concentration for α > 1 and dispersion for α < 1,
- converge to Shannon entropy for α → 1,
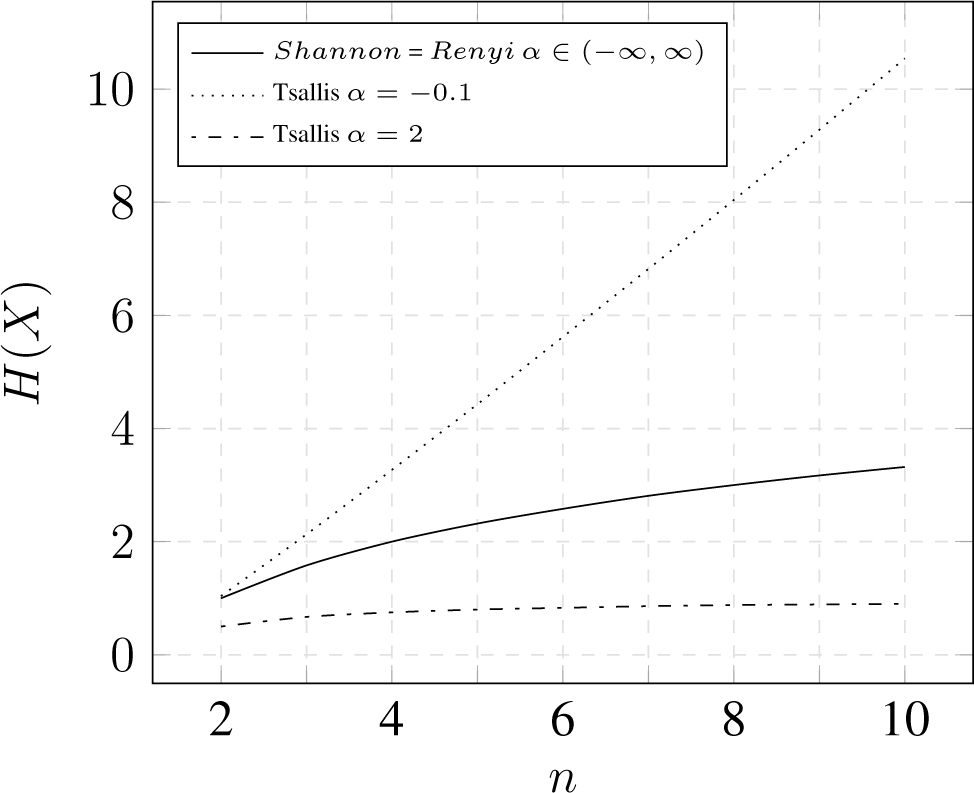
3.3. Comparison
3.3.1. Binominal Distribution
3.3.2. Uniform Distribution
3.3.3. Impact of Frequent and Rare Events
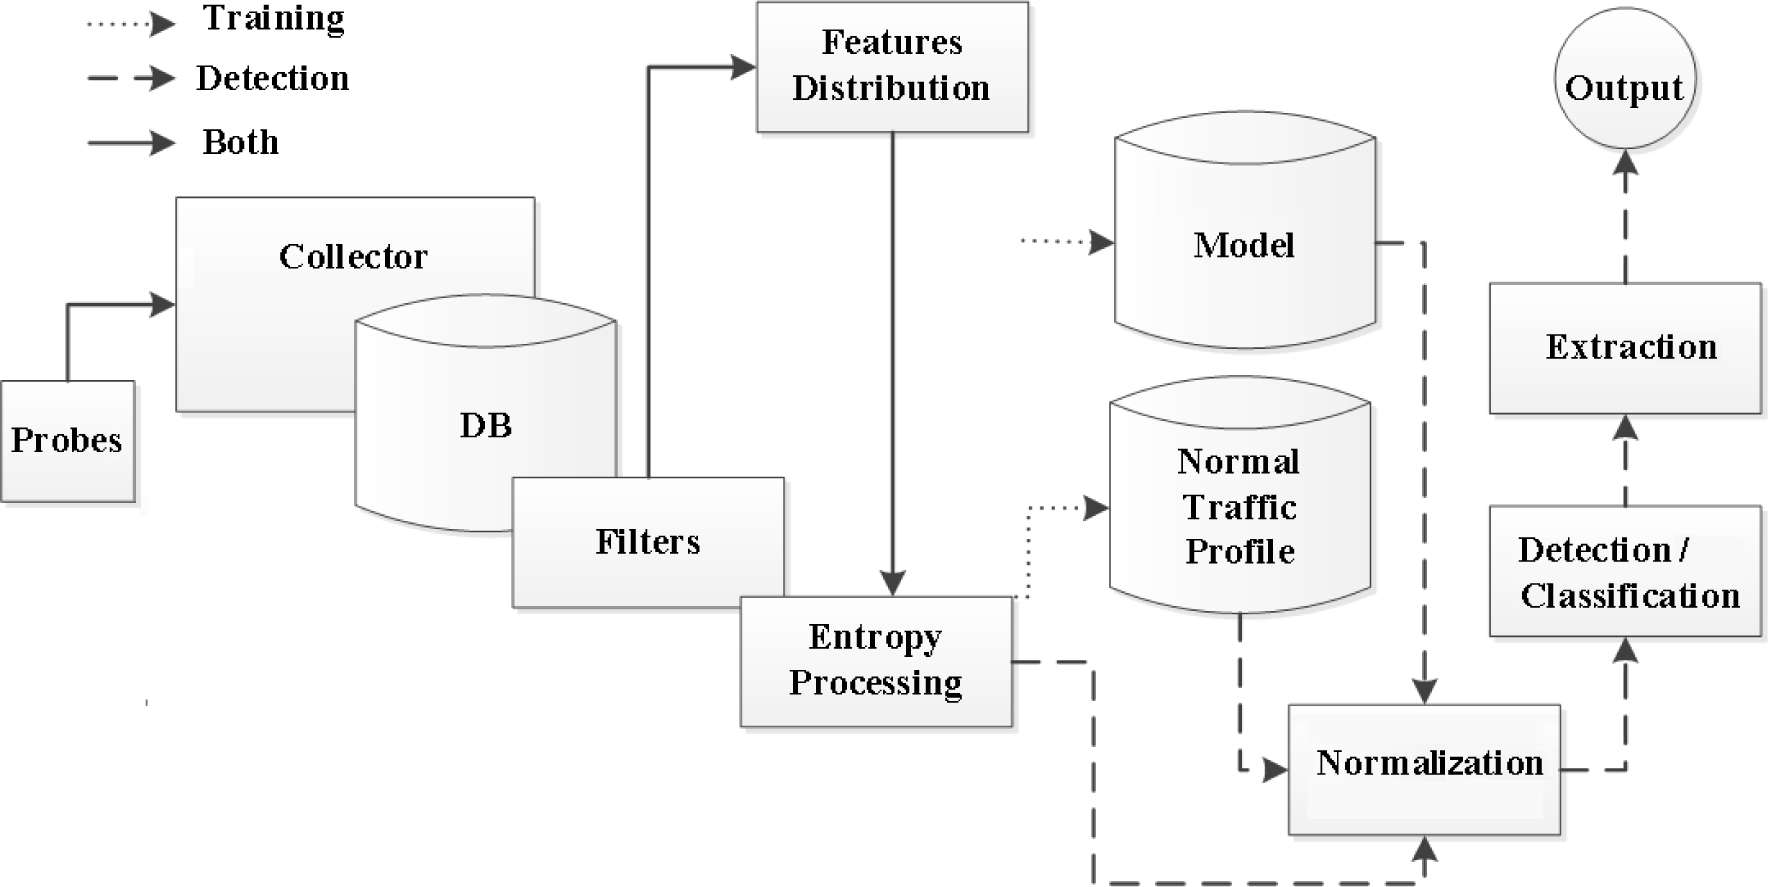
4. Anode—Entropy-Based Network Anomaly Detector
4.1. Architecture
4.2. Implementation
5. Dataset
5.1. Origin of the Idea
- limited availability of such datasets;
- the lack of proper labeling in shared datasets;
- the fact that most of available datasets are obsolete in terms of legitimate traffic and anomalies;
- the absence of realistic data in synthetic datasets;
- small number of dataset with flows (conversion from packets is needed, labels are lost);
- incompleteness of data (narrow range of anomalies, lack of anomalies related to botnet-like malware);
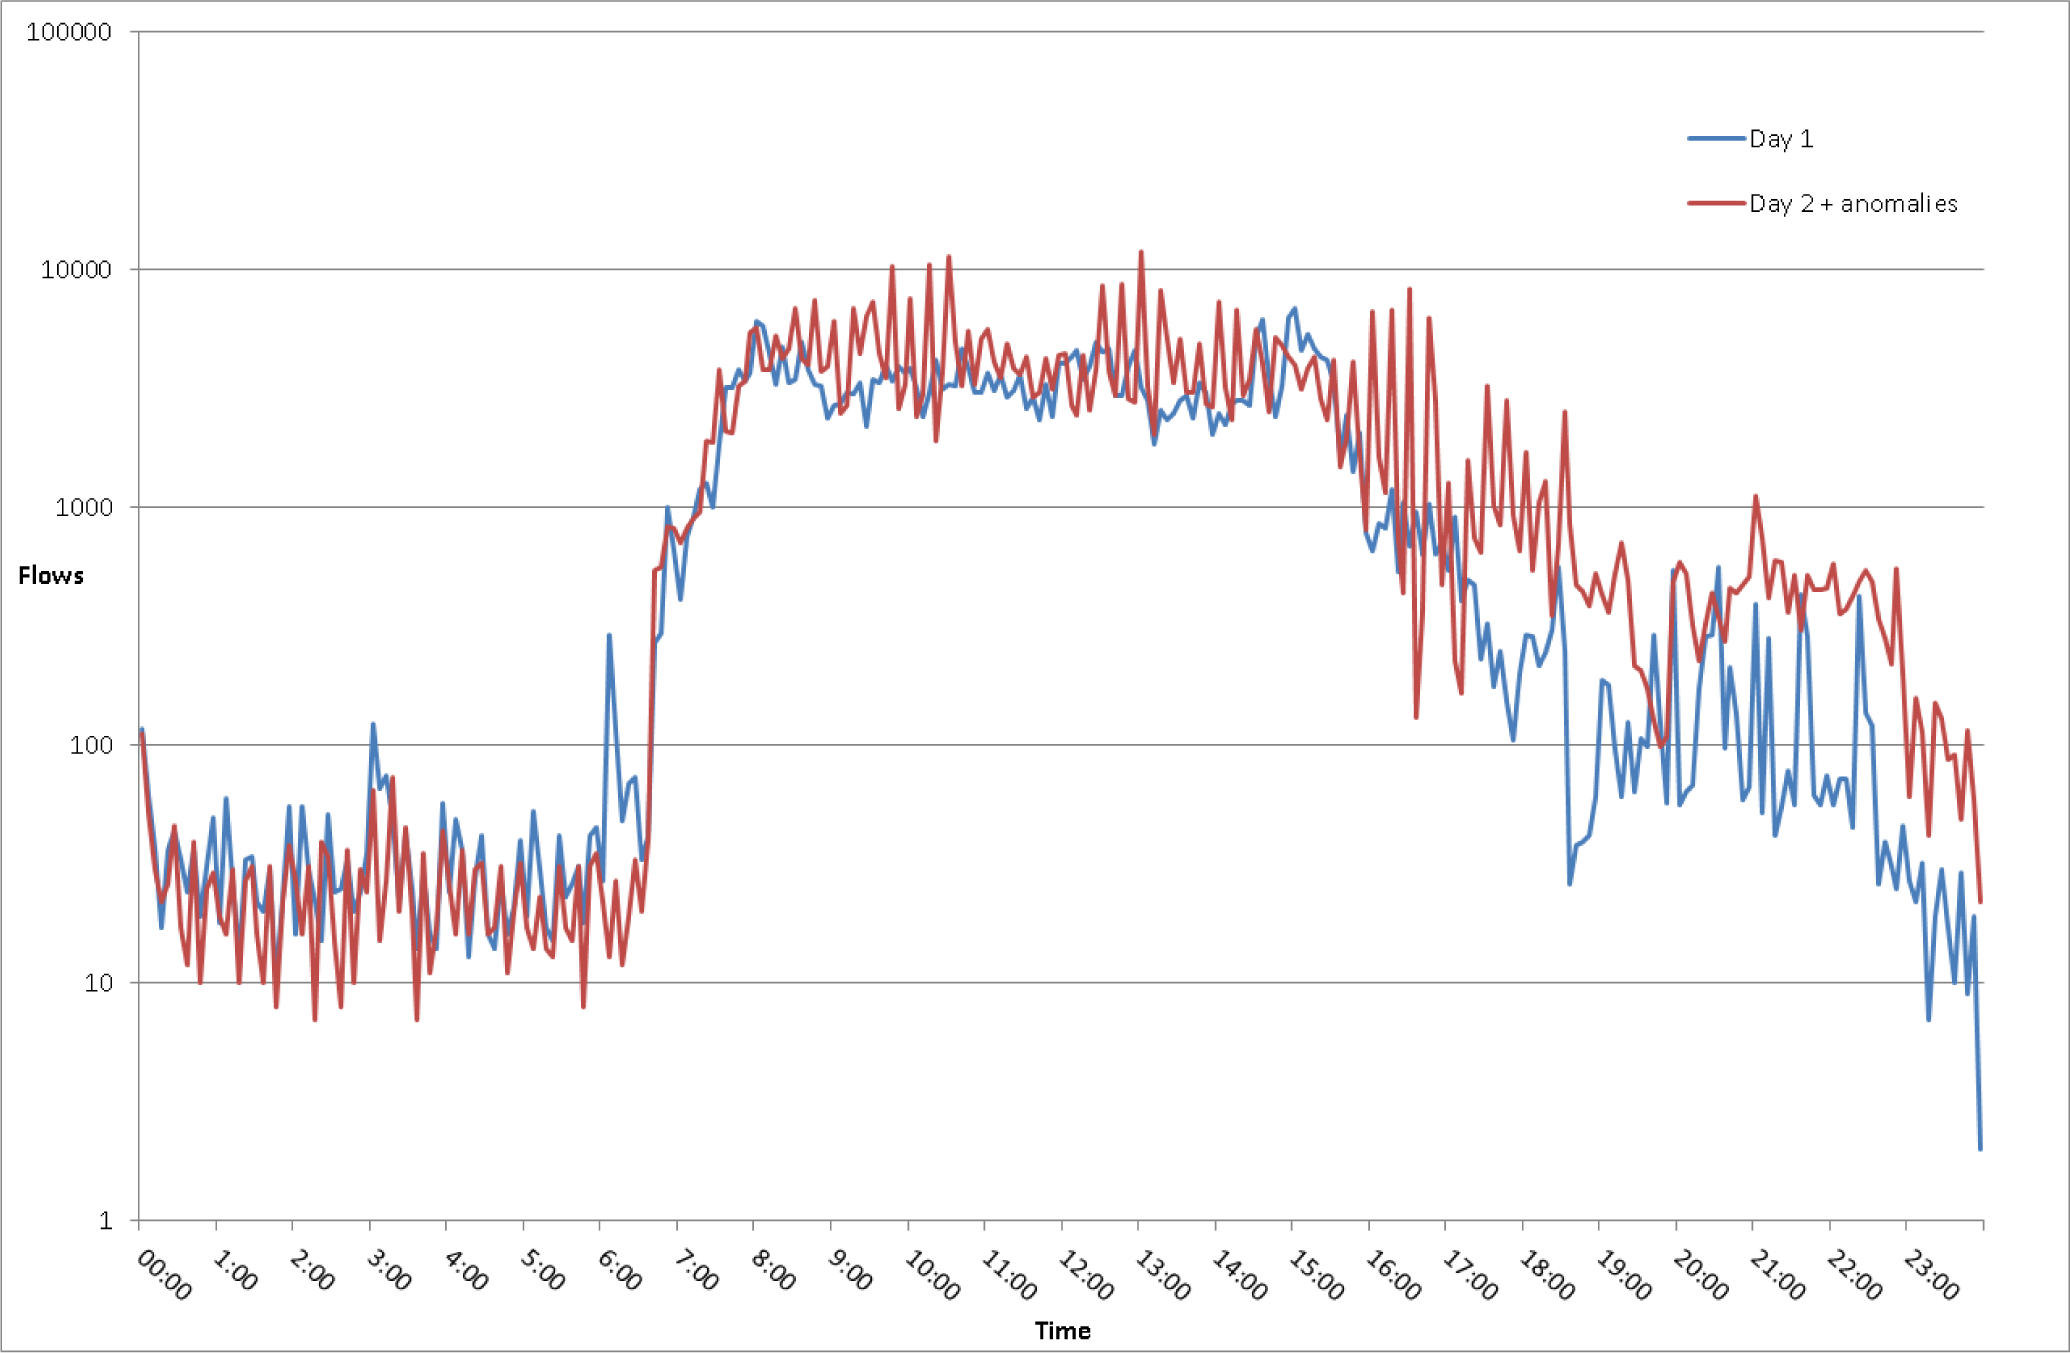
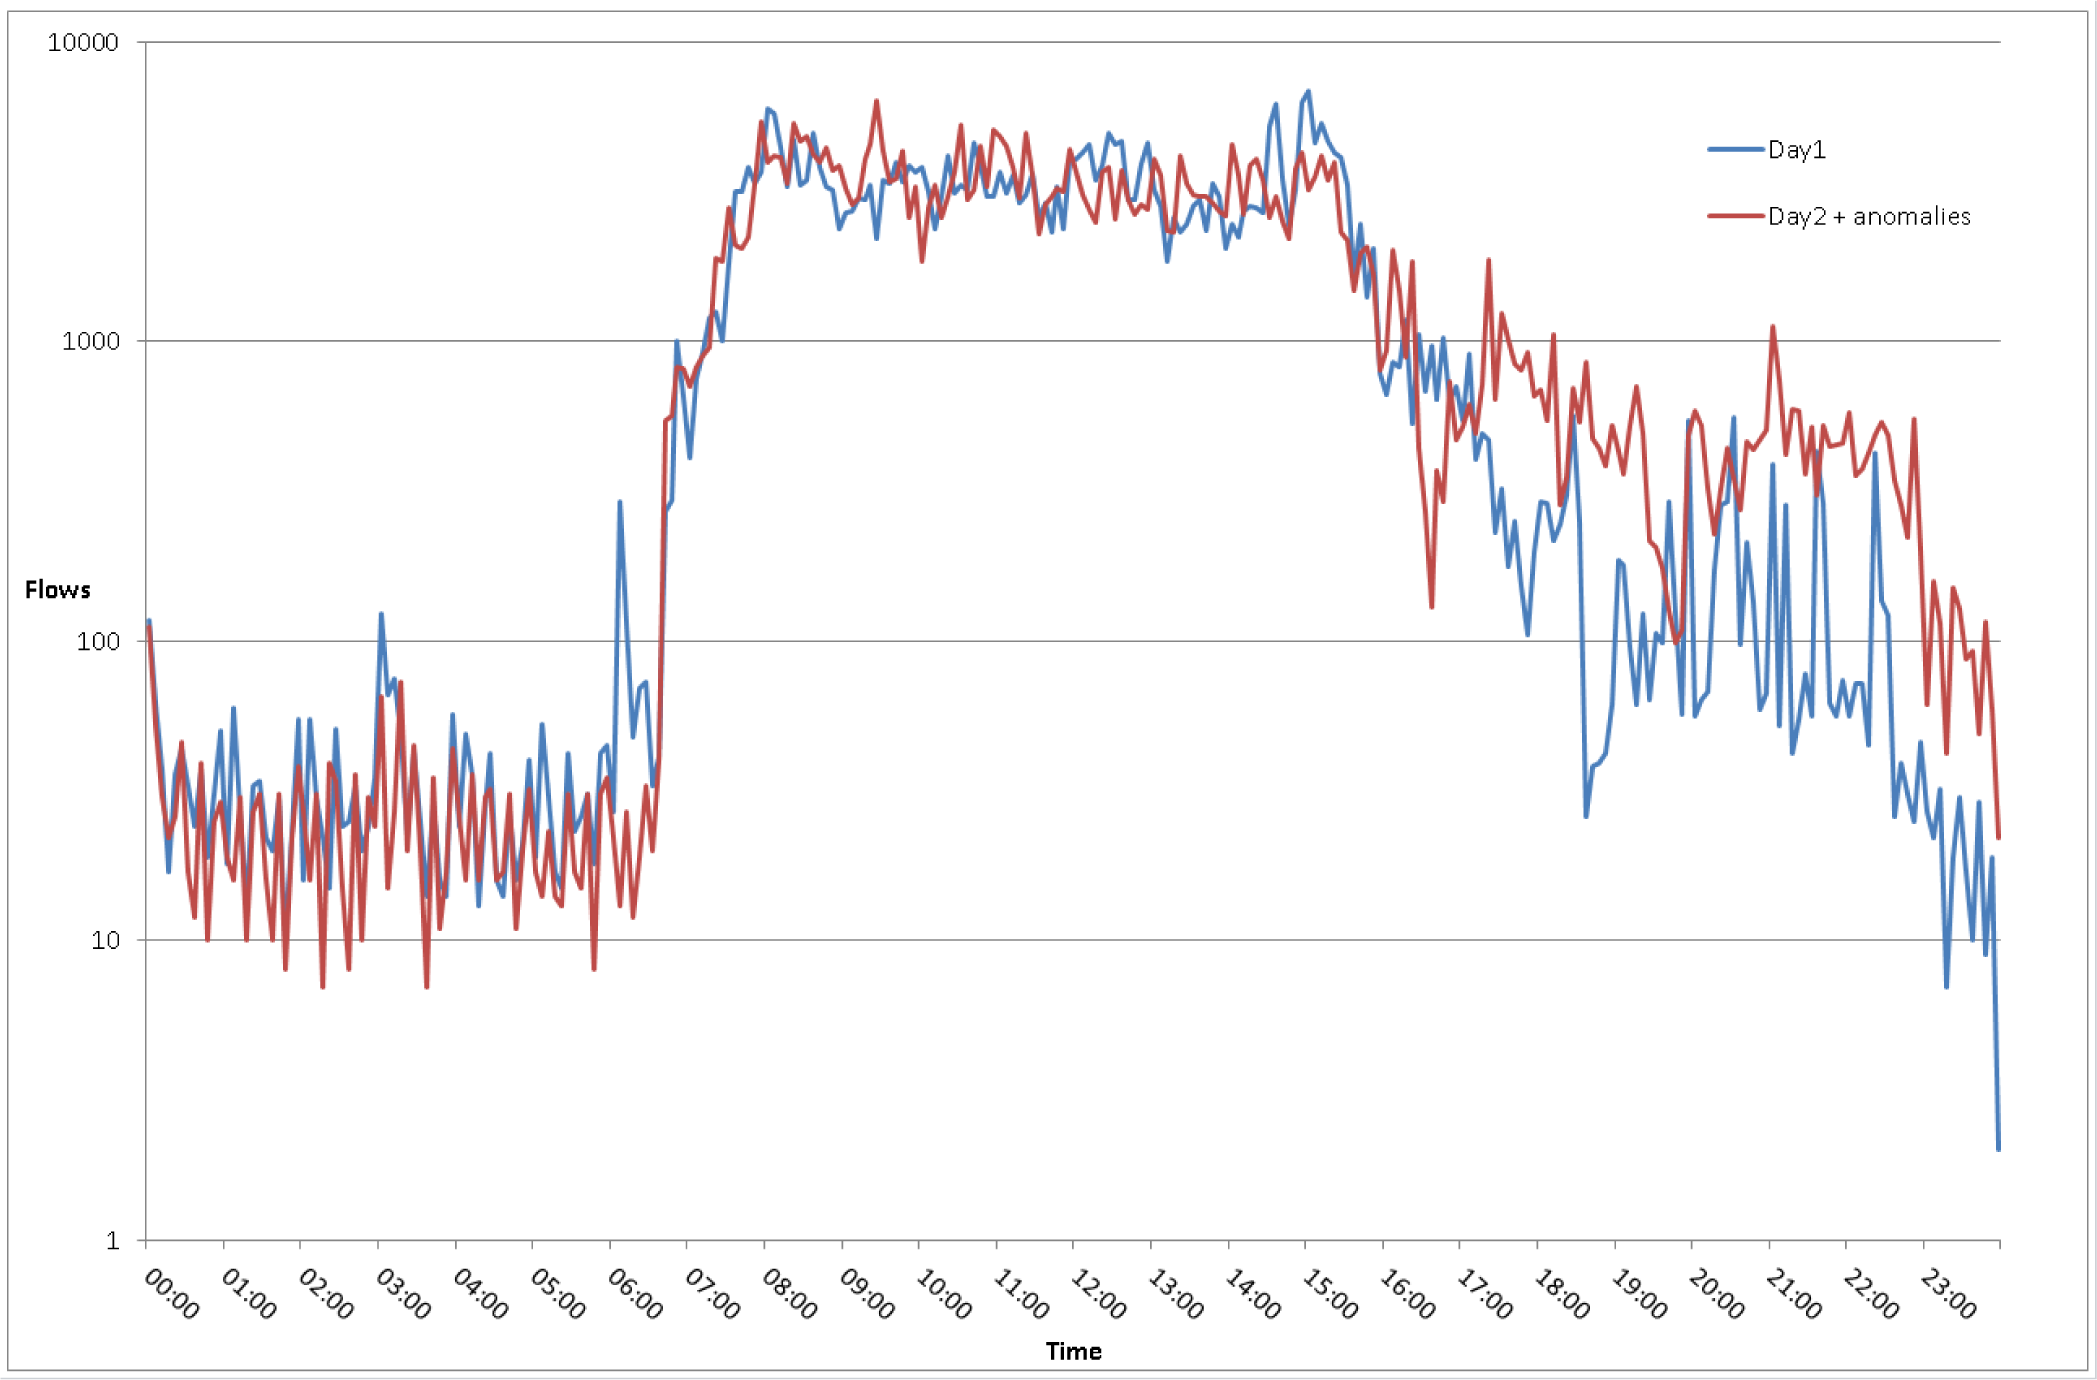
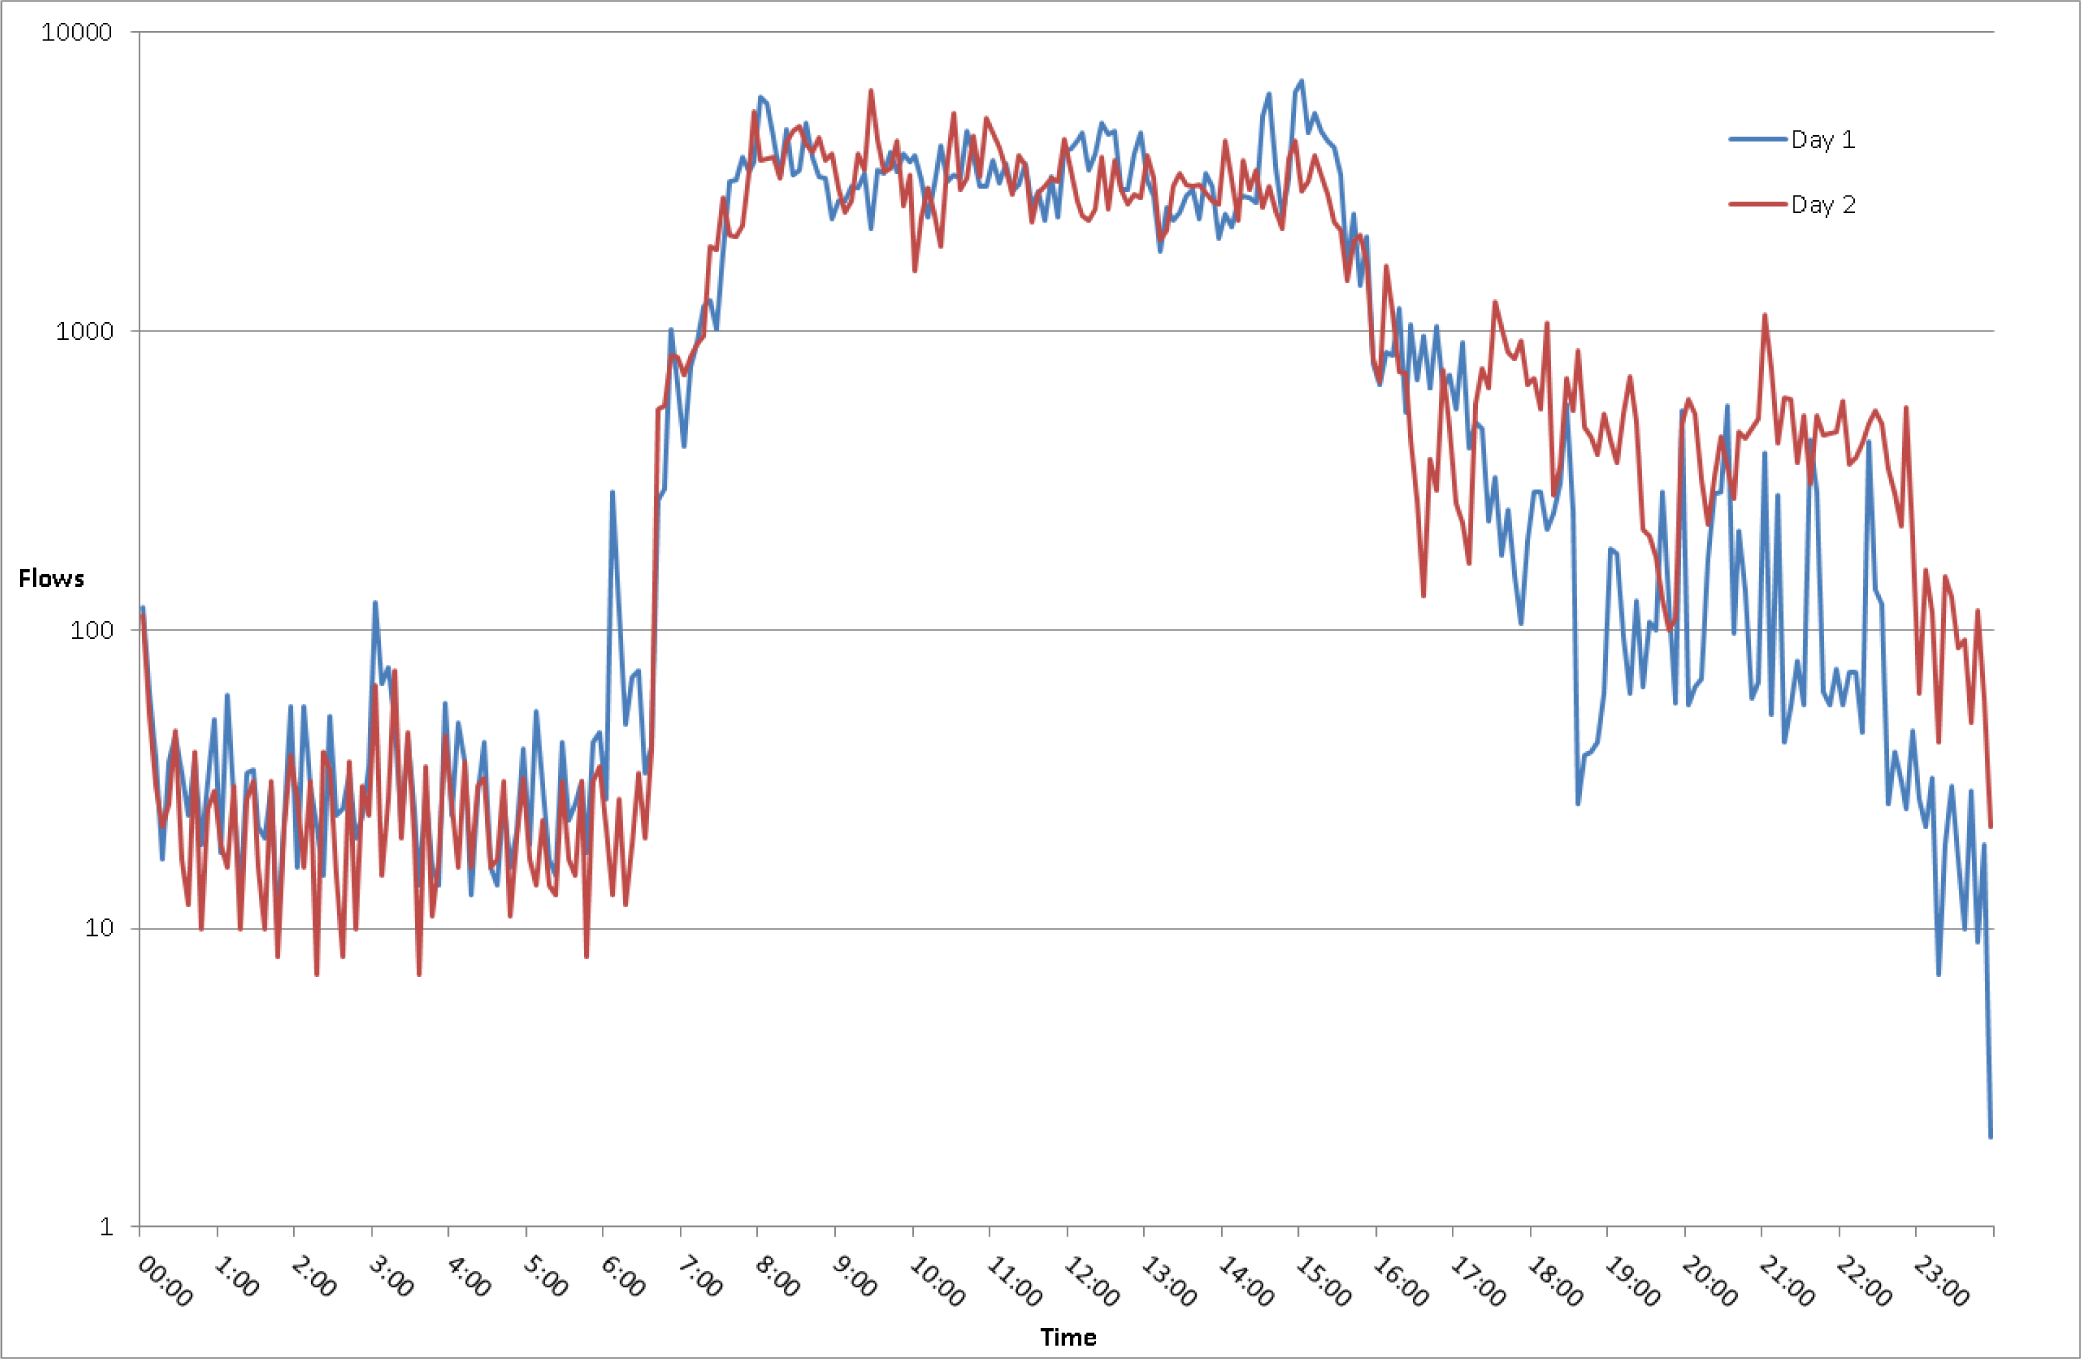
5.2. Legitimate Traffic
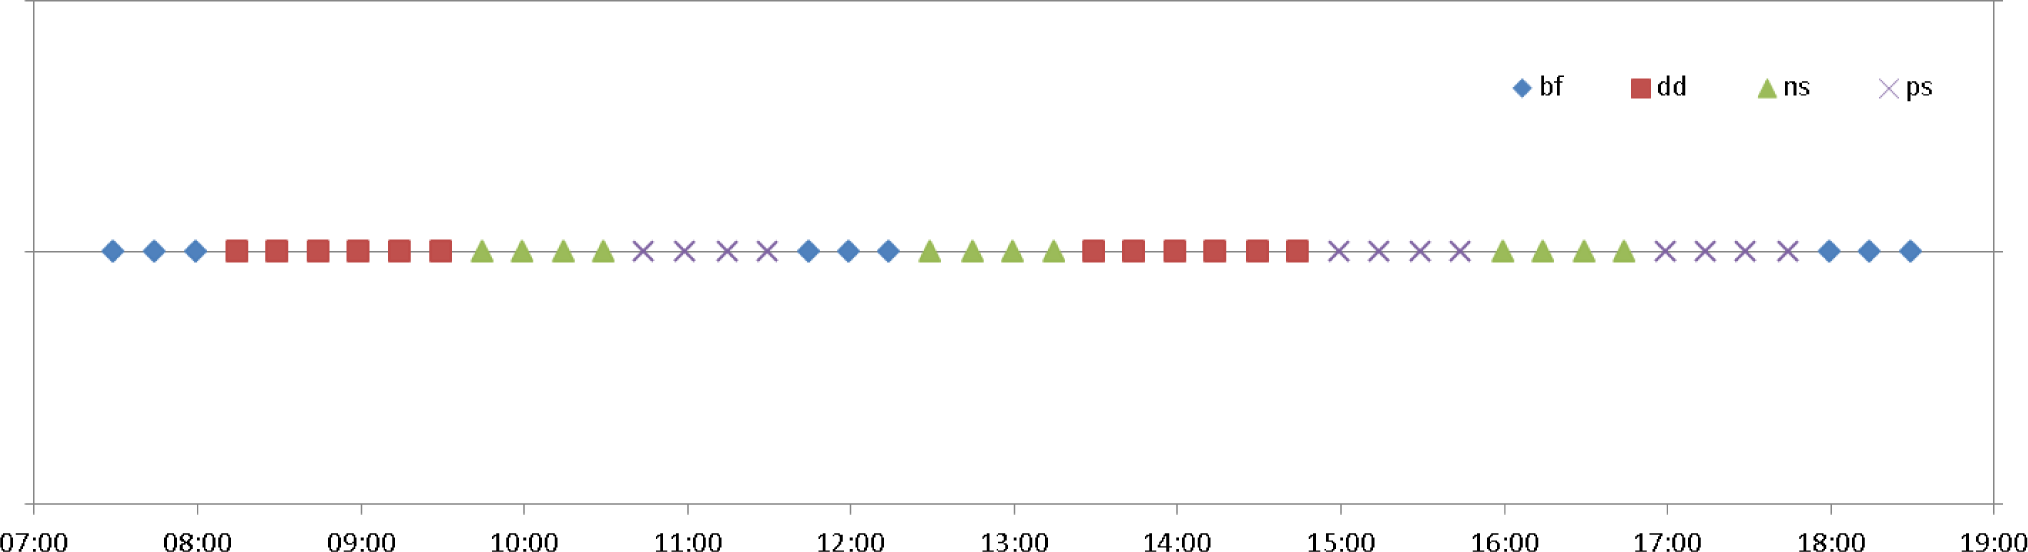
5.3. Scenario 1
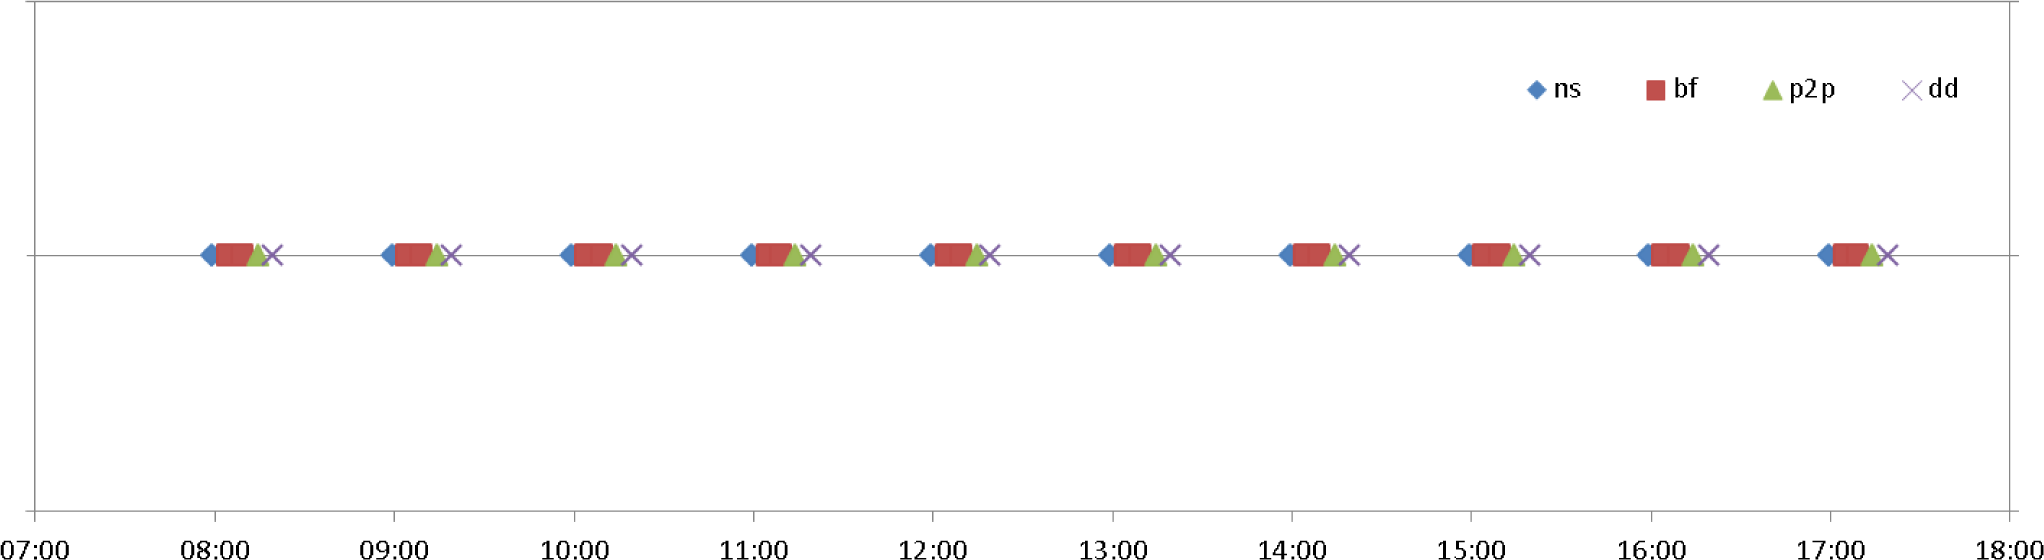
5.4. Scenario 2
- One of the host in local network gets infected with a botnet-like malware. In order to propagate via network it starts scanning his neighbors. Malware is looking for hosts running Remote Desktop Protocol (RDP) services. RDP is a proprietary protocol developed by Microsoft, which provides a user with a graphical interface to connect to another computer over a network. RDP servers are built into Windows operating systems. By default, the server listens on TCP/UDP port 3389.
- Hosts serving Remote Desktop services are attacked with a dictionary attack (similarly to the technique found in MORTO worm [127]).
- After successful dictionary attack vulnerable machines are infected and become a member of botnet.
- A peer-to-peer communication based on UDP transport protocol is established among infected hosts.
- On C&C server command botnet members start a low rate Distributed Denial of Service attack called Slowrolis [128] on an external HTTP server. After a few min the server is blocked.
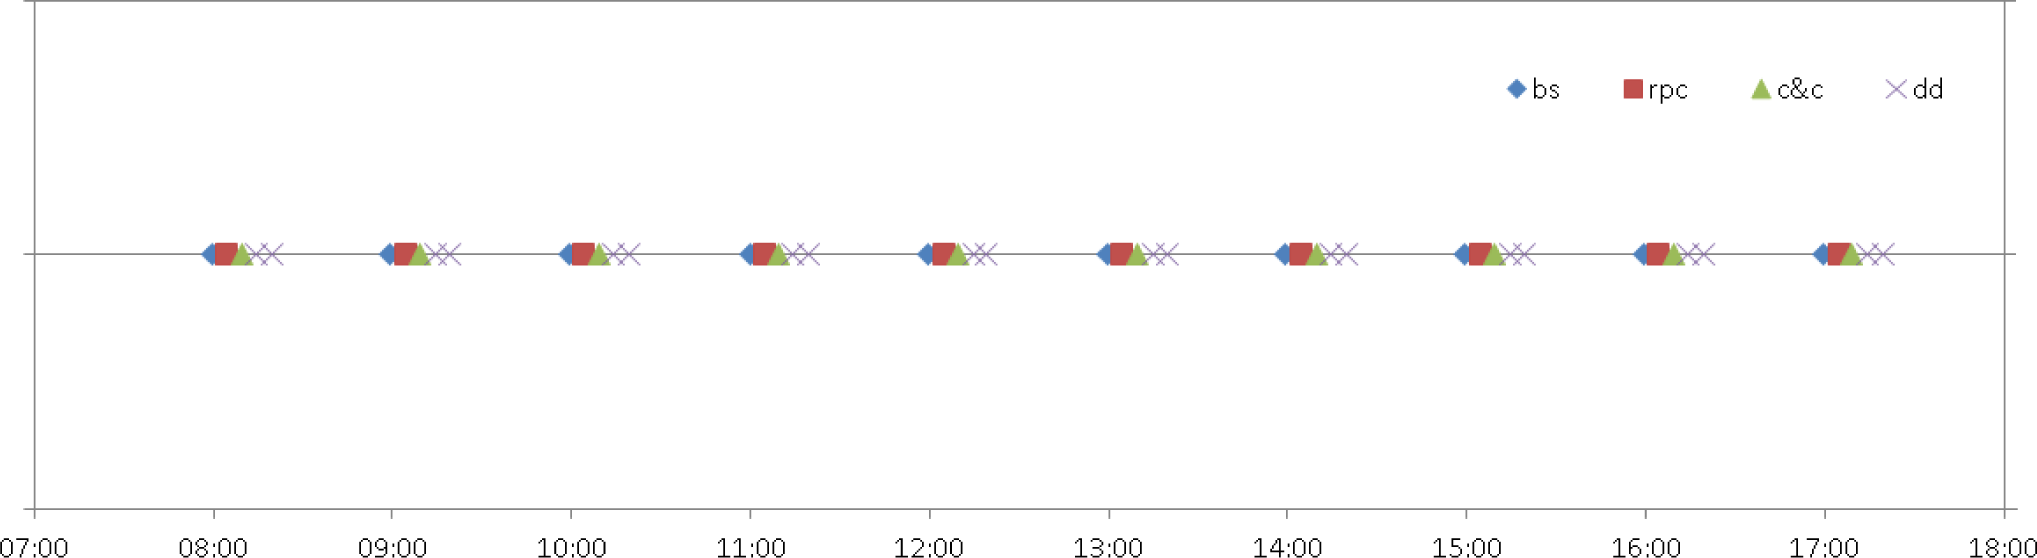
5.5. Scenario 3
- One of the local host which is infected with a modern botnet malware starts scanning his neighbors in order to propagate via network. It uses similar network propagation mechanism as it is employed in Stuxnet worm [129,130]. Malware is looking for hosts with open TCP and UDP ports reserved for Microsoft Remote Procedure Call (RPC). In Windows RPC is an interprocess communication mechanism that enables data exchange and invocation of functionality residing in a different process localy or via network. The list of ports used to initiate a connection with RPC is as follows: UDP – 135, 137, 138, 445, TCP – 135, 139, 445, 593.
- Hosts with an open RPC ports are attacked with a specially crafted RPC requests.
- After successful attack, vulnerable machines are infected and become a member of botnet.
- A direct communication to a single C&C server is established on each infected host.
- On C&C server command botnet members start a DDoS amplification attack based on Network Time Protocol (NTP). This attack is targeted to an external server. Botnet members send packets with a forged source IP address (set to this used by the victim). Because the source IP address is forged the remote server replies and sends data to the victim. Moreover attack is amplified via NTP. Thus attackers send a small (234 bytes) packet “from” a forged source IP address with a command to get a list of interacting machines and NTP server sends a large (up to 200 times bigger) reply to the victim. As a result attackers turn small amount of bandwidth coming from a few machines into a significant traffic load hitting the victim. More details regarding NTP amplification in DDoS attacks can be found in [131].
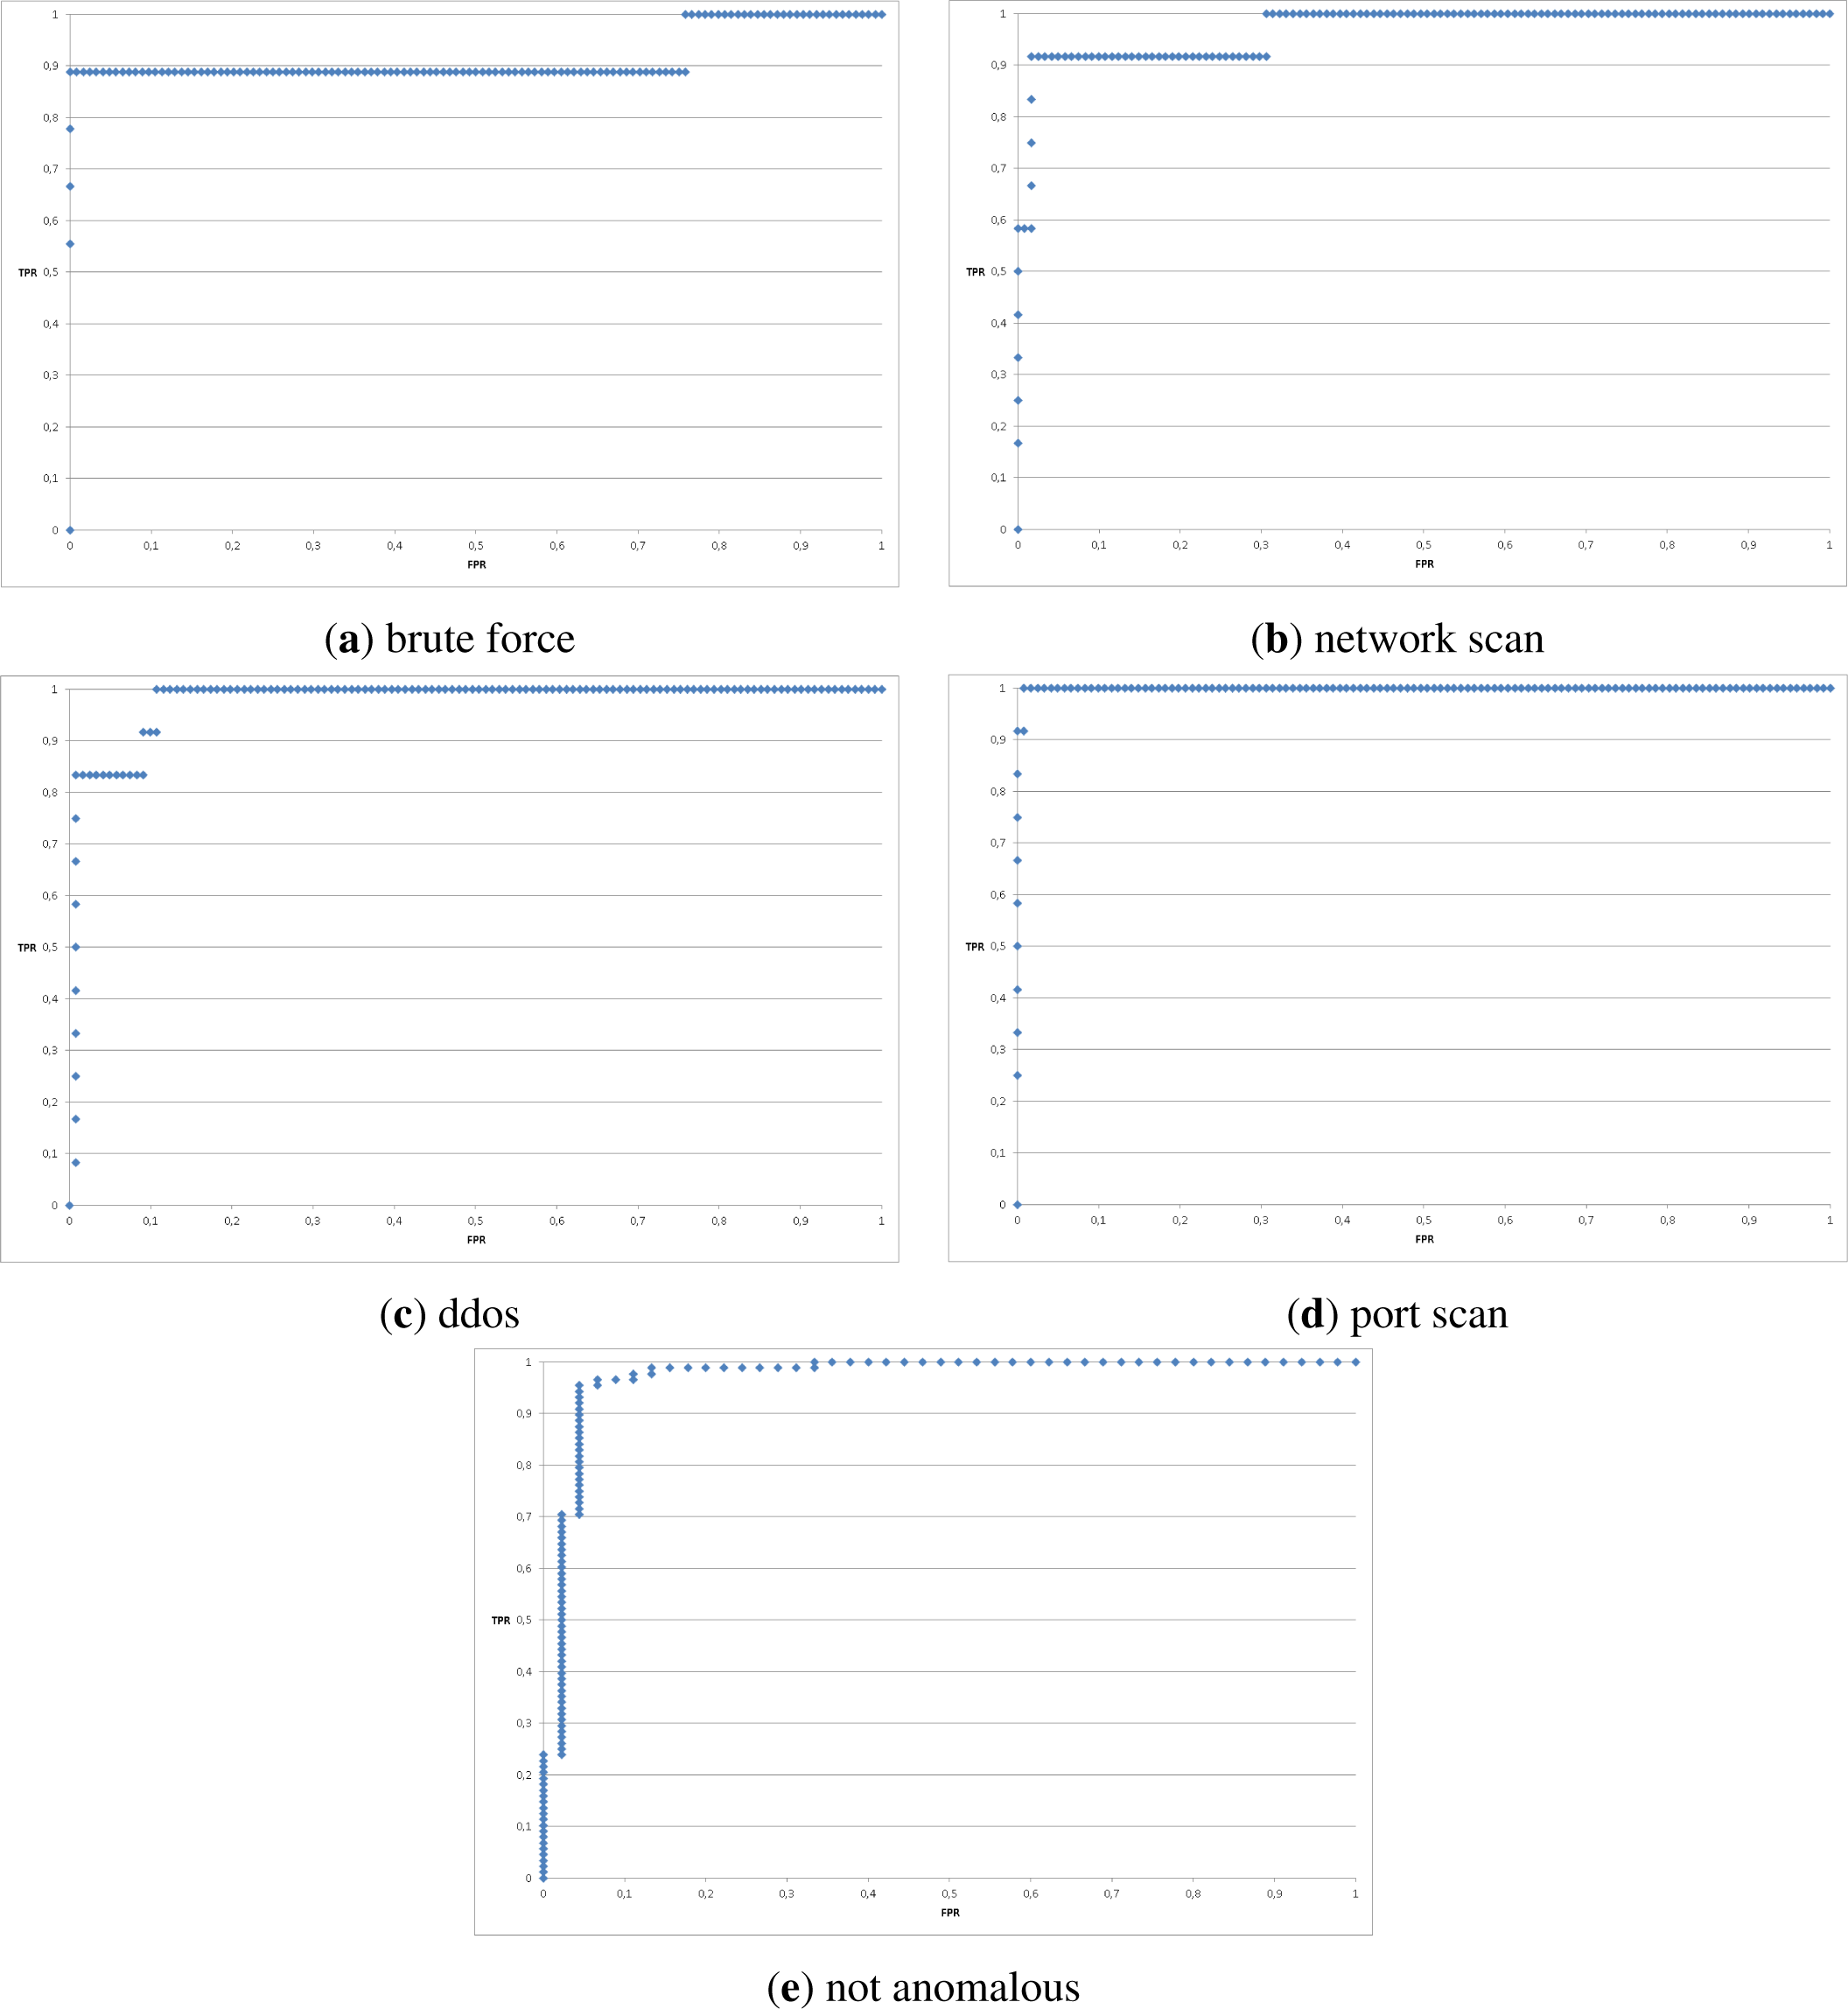
6. Verification of the Approach
6.1. Correlation
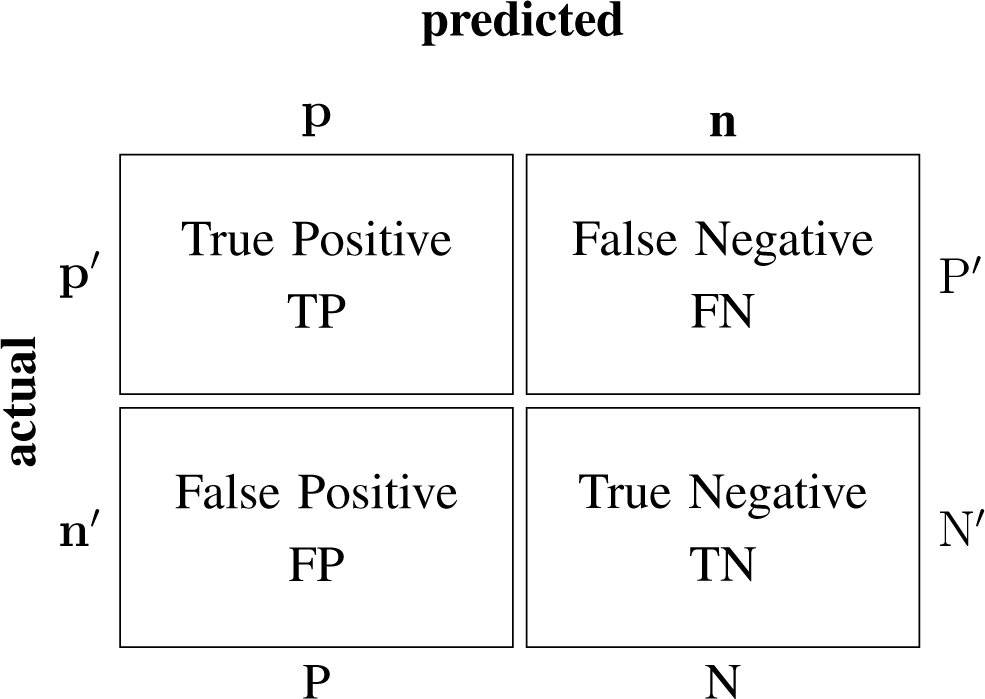
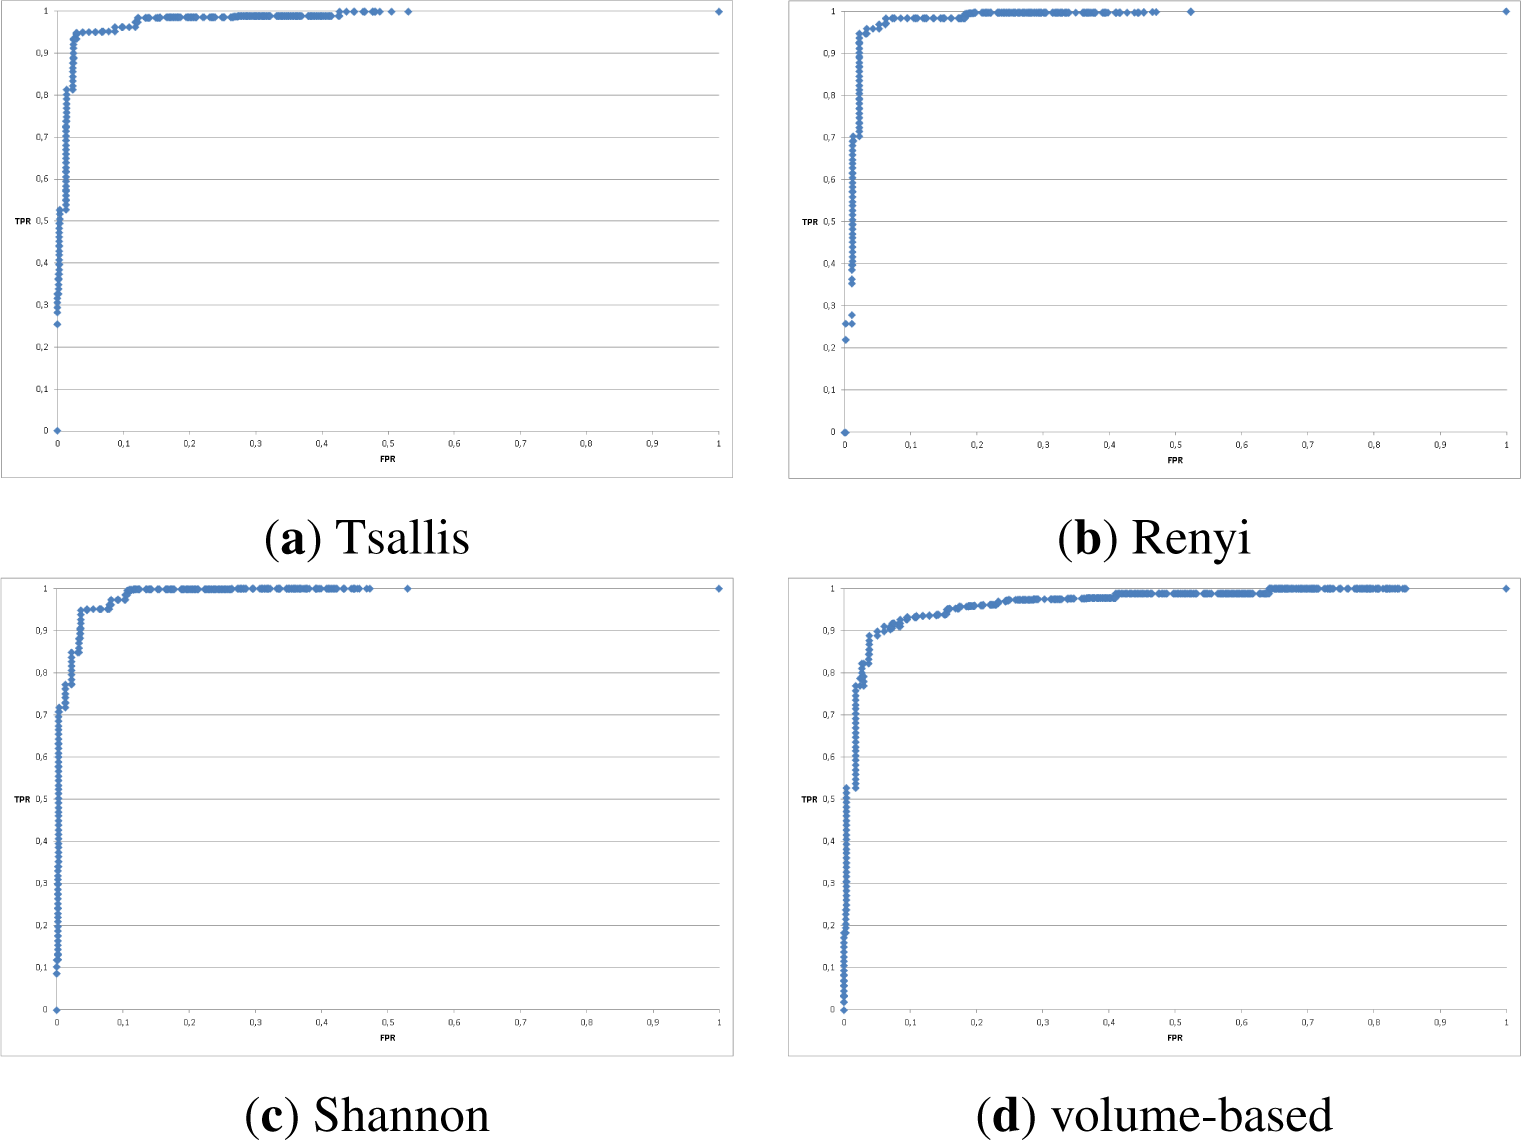
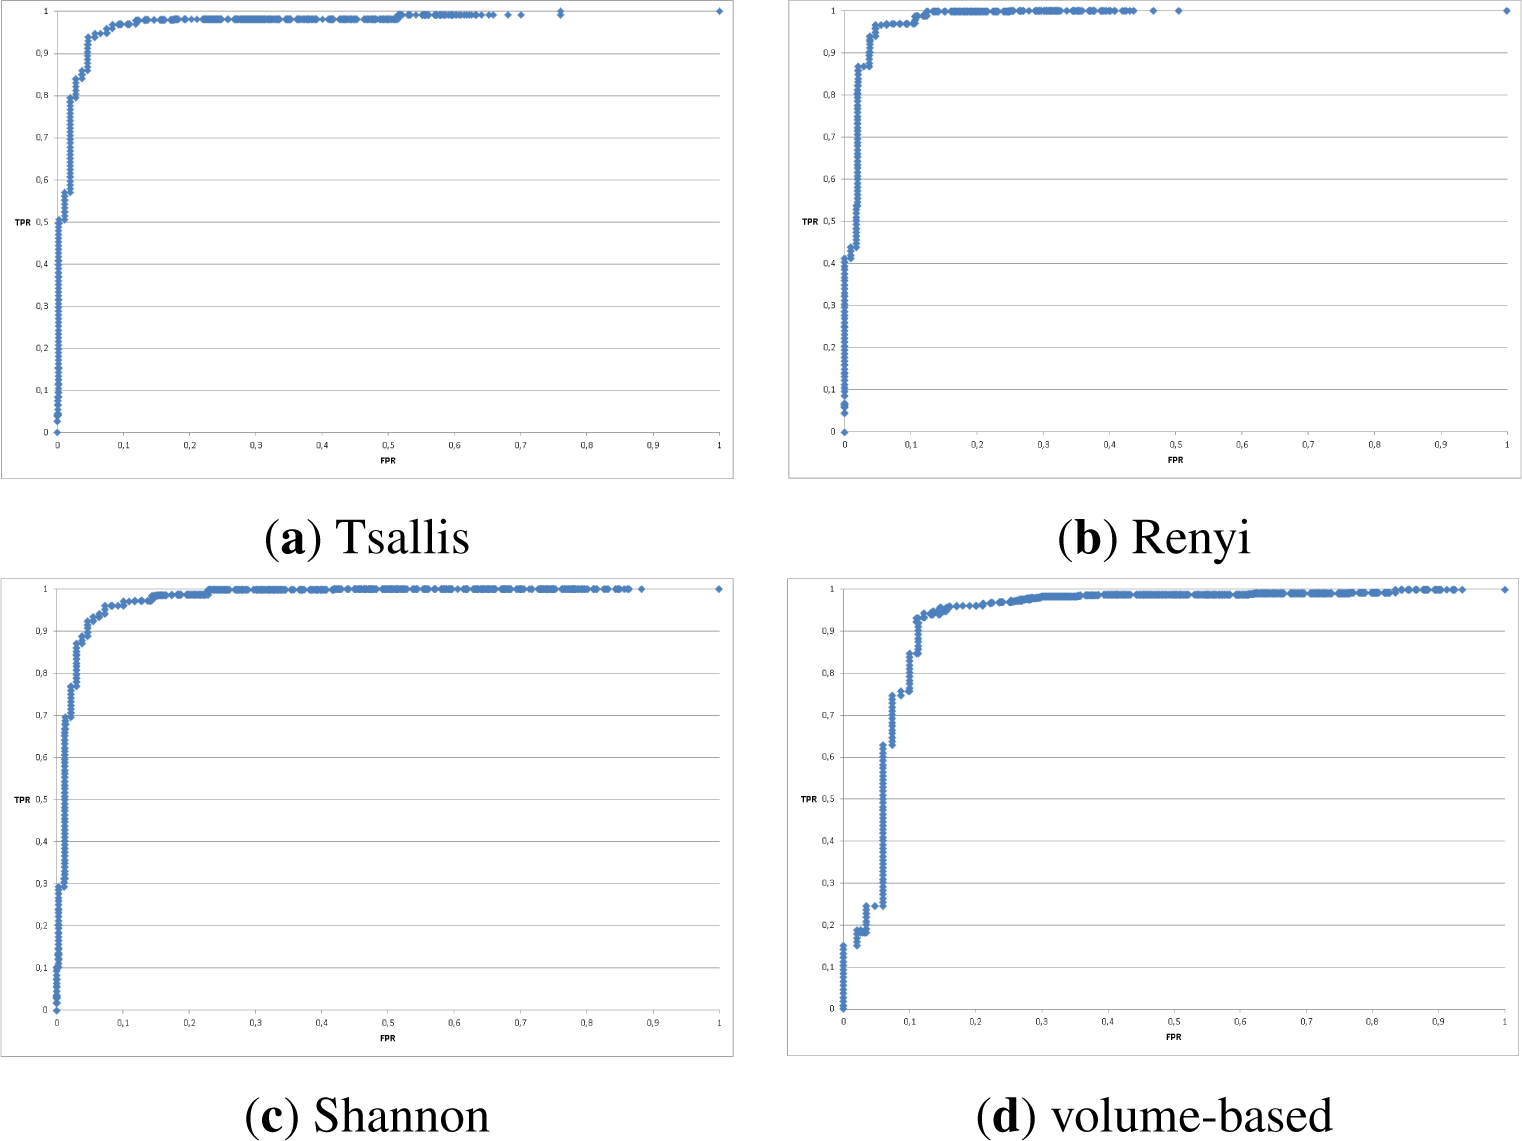
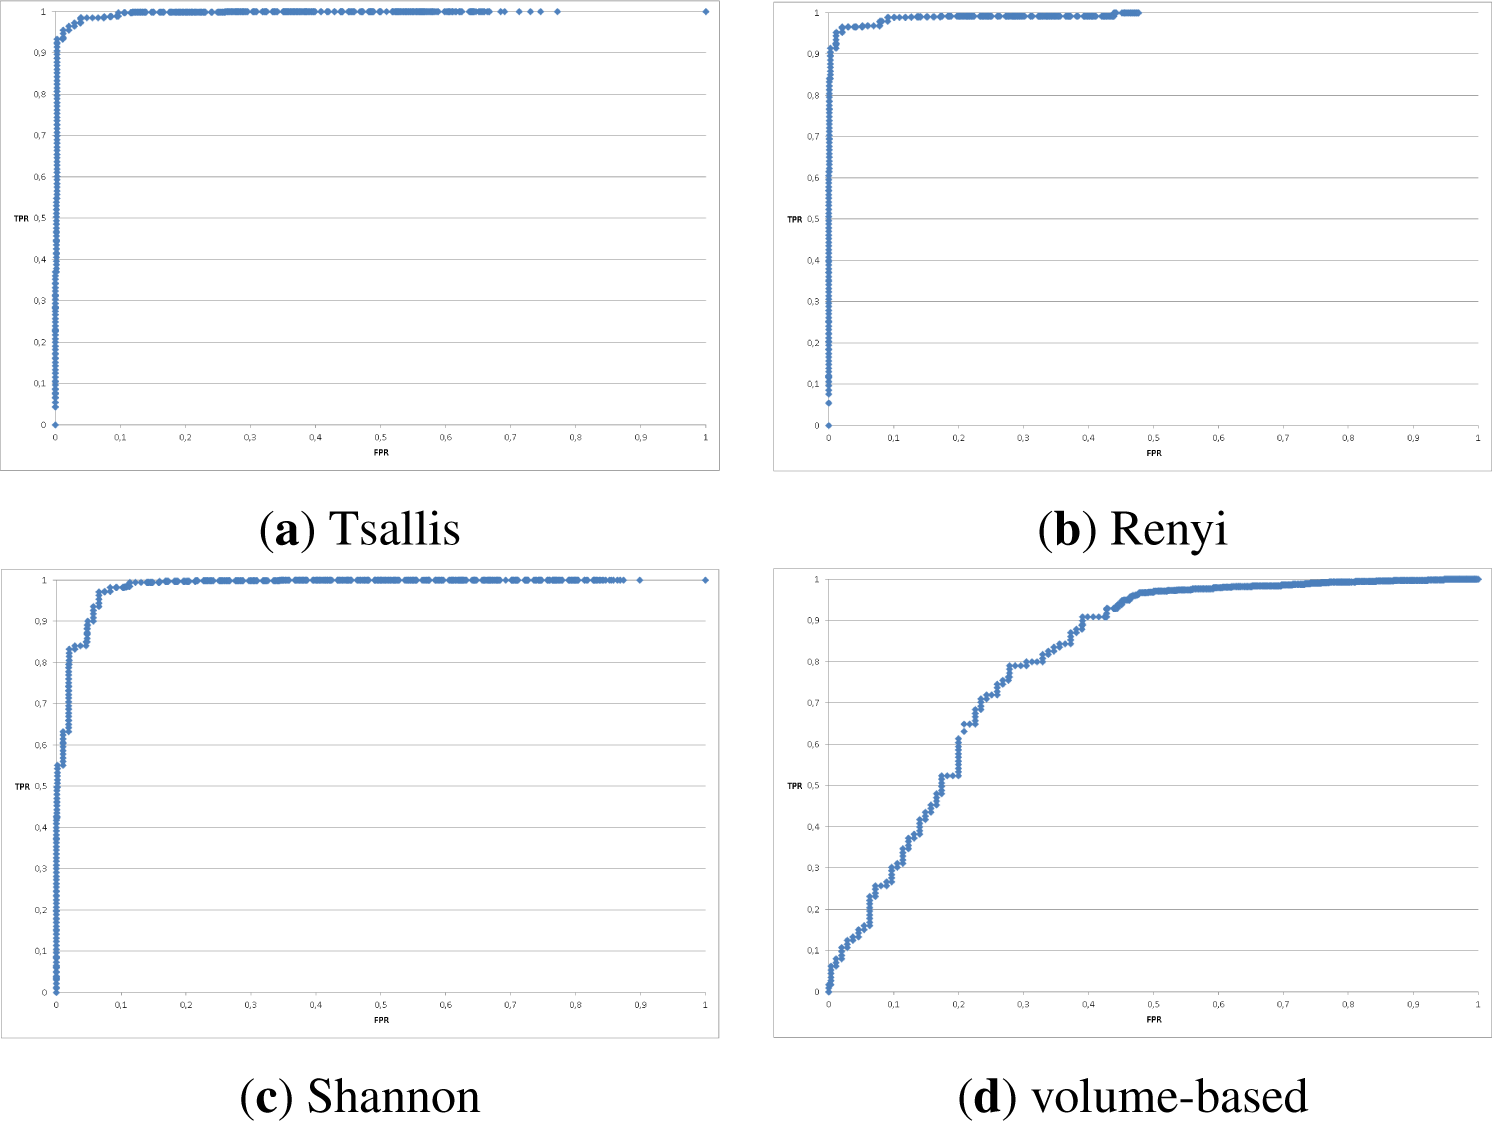
6.2. Performance Evaluation
- Take n binary classifiers (one for each class);
- For the ith classifier, let the positive examples be all the points in class i, and let the negative examples be all the points not in class i;
- Let fi be the ith classifier; Classify with the following rule:
7. Summary
7.1. Conclusions
- Tsallis and Renyi entropy performed best;
- Shannon entropy turned out to be worse both in Accuracy and False Positive Rate as well as weighted ROC curves;
- the volume-based approach performed poorly;
- using a broad spectrum of network traffic feature is essential to successfully detect and classify different types of anomalies; this was proved both by results of features correlation and good results of classification of different anomalies in tested scenarios;
- using α-values from a set {−2, −1, 0, 1, 2} is a proper choice; it was proved by results of α-values correlation and good results of classification of different anomalies in tested scenarios; using a bigger set of α values is redundant; using one α-value is not enough to recognize different types of anomalies;
- the most suitable classifier (among popular classifiers employed in Weka) to our approach is the SimpleLogistic which relay on linear regression.
7.2. Further Work
Acknowledgments
Author Contributions
Conflicts of Interest
References
- Denning, D.E. An intrusion-detection model. IEEE Trans. Softw. Eng. 1987, 13, 222–232. [Google Scholar]
- Li, Z.; Das, A.; Zhou, J. USAID: Unifying Signature-Based and Anomaly-Based Intrusion Detection. In Advances in Knowledge Discovery and Data Mining; Ho, T., Cheung, D., Liu, H., Eds.; Volume 3518, Lecture Notes in Computer Science; Springer: Berlin/Heidelberg, Germany, 2005; pp. 702–712. [Google Scholar]
- Cheng, T.H.; Lin, Y.D.; Lai, Y.C.; Lin, P.C. Evasion Techniques: Sneaking through Your Intrusion Detection/Prevention Systems. IEEE Commun. Surv. Tutor. 2012, 14, 1011–1020. [Google Scholar]
- Jasiul, B.; Śliwa, J.; Gleba, K.; Szpyrka, M. Identification of malware activities with rules. Proceedings of the 2014 Federated Conference on Computer Science and Information Systems (FedCSIS), Warsaw, Poland, 7–10 September 2014; Ganzha, M., Maciaszek, L., Paprzycki, M., Eds.; pp. 101–110.
- Gascon, H.; Orfila, A.; Blasco, J. Analysis of update delays in signature-based network intrusion detection systems. Comput. Secur. 2011, 30, 613–624. [Google Scholar]
- Eimann, R. Network Event Detection with Entropy Measures. Ph.D. Thesis, University of Auckland, Auckland, New Zealand, 2008. [Google Scholar]
- Wagner, A.; Plattner, B. Entropy Based Worm and Anomaly Detection in Fast IP Networks. Proceedings of the 14th IEEE International Workshops on Enabling Technologies: Infrastructure for Collaborative Enterprise (WETICE’05), Linköping University, Linköping, Sweden, 13–15 June 2005; pp. 172–177.
- Nychis, G.; Sekar, V.; Andersen, D.G.; Kim, H.; Zhang, H. An Empirical Evaluation of Entropy-based Traffic Anomaly Detection. Proceedings of the 8th ACM SIGCOMM Conference on Internet Measurement (IMC ’08), Vouliagmeni, Greece, 20–22 October 2008; pp. 151–156.
- Tellenbach, B. Detection, Classification and Visualization of Anomalies using Generalized Entropy Metrics. Ph.D. Thesis, ETH, Zürich, Switzerland, 2012. [Google Scholar]
- Xiang, Y.; Li, K.; Zhou, W. Low-Rate DDoS Attacks Detection and Traceback by Using New Information Metrics. IEEE Trans. Inf. Forensics Secur. 2011, 6, 426–437. [Google Scholar]
- Kopylova, Y.; Buell, D.A.; Huang, C.T.; Janies, J. Mutual information applied to anomaly detection. J. Commun. Netw. 2008, 10, 89–97. [Google Scholar]
- HP—The Bot Threat. Available online: http://www.bitpipe.com/detail/RES/1384218191_706.html accessed on 16 April 2015.
- Sophos—Security Threat Report 2014 Smarter, Shadier, Stealthier Malware. Available online: https://cccure.training/m/articles/view/Sophos-Security-Threat-Report-2014 accessed on 16 April 2015.
- Scanlon, M.; Kechadi, M.T. The Case for a Collaborative Universal Peer-to-Peer Botnet Investigation Framework. Proceedings of the 9th International Conference on Cyber Warfare and Security (ICCWS 2014), Purdue University, West Lafayette, IN, USA, 24–25 March 2014; pp. 287–293.
- Tellenbach, B.; Burkhart, M.; Sornette, D.; Maillart, T. Beyond Shannon: Characterizing Internet Traffic with Generalized Entropy Metrics. Proceedings of the 10th International Conference on Passive and Active Network Measurement (PAM’09), Seoul, Korea, 1–3 April 2009; pp. 239–248.
- NfSen—Netflow Sensor. Available online: http://nfsen.sourceforge.net accessed on 16 April 2015.
- Barford, P.; Kline, J.; Plonka, D.; Ron, A. A Signal Analysis of Network Traffic Anomalies. Proceedings of the 2nd ACM SIGCOMM Workshop on Internet Measurement (IMW ’02), Marseille, France, 6–8 November 2002; pp. 71–82.
- Kim, M.S.; Kong, H.J.; Hong, S.C.; Chung, S.H.; Hong, J. A flow-based method for abnormal network traffic detection. Presented at IEEE/IFIP Network Operations and Management Symposium (NOMS 2004), Seoul, Korea, 19–23 April 2004; pp. 599–612.
- NtopNg—High-Speed Web-based Traffic Analysis and Flow Collection. Available online: http://www.ntop.org accessed on 16 April 2015.
- Witten, I.H.; Frank, E.; Hall, M.A. Data Mining: Practical Machine Learning Tools and Techniques, 3rd ed; Morgan Kaufmann Publishers Inc: San Francisco, CA, USA, 2011. [Google Scholar]
- Bhattacharyya, D.K.; Kalita, J.K. Network Anomaly Detection: A Machine Learning Perspective; Chapman & Hall/CRC: Boca Raton, FL, USA, 2013. [Google Scholar]
- Aggarwal, C. Outlier Analysis; Springer: New York, NY, USA, 2013. [Google Scholar]
- Hastie, T.; Tibshirani, R.; Friedman, J. The Elements of Statistical Learning: Data Mining, Inference and Prediction, 2 ed; Springer: New York, NY, USA, 2009. [Google Scholar]
- Chandola, V.; Banerjee, A.; Kumar, V. Anomaly Detection: A Survey. ACM Comput. Surv. 2009, 41, 15:1–15:58. [Google Scholar]
- Hodge, V.; Austin, J. A Survey of Outlier Detection Methodologies. Artif. Intell. Rev. 2004, 22, 85–126. [Google Scholar]
- Estevez-Tapiador, J.M.; Garcia-Teodoro, P.; Diaz-Verdejo, J.E. Anomaly Detection Methods in Wired Networks: A Survey and Taxonomy. Comput. Commun. 2004, 27, 1569–1584. [Google Scholar]
- Patcha, A.; Park, J.M. An Overview of Anomaly Detection Techniques: Existing Solutions and Latest Technological Trends. Comput. Netw. 2007, 51, 3448–3470. [Google Scholar]
- Callegari, C. Statistical approaches for network anomaly detection. Proceedings of the 4th International Conference on Internet Monitoring and Protection (ICIMP), Venice/Mestre, Italy, 24–28 May 2009.
- Callado, A.; Kamienski, C.; Szabo, G.; Gero, B.; Kelner, J.; Fernandes, S.; Sadok, D. A Survey on Internet Traffic Identification. IEEE Commun. Surv. Tutor. 2009, 11, 37–52. [Google Scholar]
- Garcia-Teodoro, P.; Diaz-Verdejo, J.; Macia-Fernandez, G.; Vazquez, E. Anomaly-based network intrusion detection: Techniques, systems and challenges. Comput. Secur. 2009, 28, 18–28. [Google Scholar]
- Bhuyan, M.; Bhattacharyya, D.; Kalita, J. Network anomaly detection: methods, systems and tools. IEEE Commun. Surv. Tutor. 2013, 16, 1–34. [Google Scholar]
- Sperotto, A.; Schaffrath, G.; Sadre, R.; Morariu, C.; Pras, A.; Stiller, B. An Overview of IP Flow-Based Intrusion Detection. IEEE Commun. Surv. Tutor. 2010, 12, 343–356. [Google Scholar]
- Huang, L.; Nguyen, X.; Garofalakis, M.; Jordan, M.; Joseph, A.D.; Taft, N. In-Network PCA and Anomaly Detection; Technical Report UCB/EECS-2007-10; EECS Department, University of California: Berkeley, CA, USA, 2007. [Google Scholar]
- Shyu, M.-L.; Chen, S.-C.; Sarinnapakorn, K.; Chang, L. A novel anomaly detection scheme based on principal component classifier. Proceedings of IEEE Foundations and New Directions of Data Mining Workshop, in conjunction with the Third IEEE International Conference on Data Mining (ICDM’03), Melbourne, FL, USA, 19–22 November 2003; pp. 171–179.
- Lee, Y.J.; Yeh, Y.R.; Wang, Y.C.F. Anomaly Detection via Online Oversampling Principal Component Analysis. IEEE Trans. Knowl. Data Eng. 2013, 25, 1460–1470. [Google Scholar]
- Lu, W.; Ghorbani, A.A. Network Anomaly Detection Based on Wavelet Analysis. EURASIP J. Adv. Sig. Proc. 2009, 2009. [Google Scholar] [CrossRef]
- Lu, W.; Tavallaee, M.; Ghorbani, A.A. Detecting Network Anomalies Using Different Wavelet Basis Functions. Proceedings of Sixth Annual Conference on Communication Networks and Services Research (CNSR 2008), Halifax, Nova Scotia, Canada, 5–8 May 2008; pp. 149–156.
- Limthong, K.; Watanapongse, P.; Kensuke, F. A wavelet-based anomaly detection for outbound network traffic. Presented at 8th Asia-Pacific Symposium on Information and Telecommunication Technologies (APSITT), Kuching, Sarawak, Malaysia, 15–18 June 2010; pp. 1–6.
- Ye, N.; Zhang, Y.; Borror, C.M. Robustness of the Markov-chain model for cyber-attack detection. IEEE Trans. Reliab. 2004, 53, 116–123. [Google Scholar]
- Sha, W.; Zhu, Y.; Huang, T.; Qiu, M.; Zhu, Y.; Zhang, Q. A Multi-order Markov Chain Based Scheme for Anomaly Detection. Proceedings of IEEE 37th Annual Computer Software and Applications Conference, COMPSAC Workshops 2013, Kyoto, Japan, 22–26 July 2013; pp. 83–88.
- Syarif, I.; Prugel-Bennett, A.; Wills, G. Unsupervised Clustering Approach for Network Anomaly Detection. In Networked Digital Technologies; Volume 293, Communications in Computer and Information Science; Springer: Berlin/Heidelberg, Germany, 2012; pp. 135–145. [Google Scholar]
- Riad, A.; Elhenawy, I.; Hassan, A.; Awadallah, N. Visualize Network Anomaly Detection By Using K-Means Clustering Algorithm. Int. J. Comput. Netw. Commun. 2013, 5. [Google Scholar] [CrossRef]
- Bazan, J.; Szpyrka, M.; Szczur, A.; Dydo, L.; Wojtowicz, H. Classifiers for Behavioral Patterns Identification Induced from Huge Temporal Data. Fundam. Inform. 2015, in press. [Google Scholar]
- Kind, A.; Stoecklin, M.P.; Dimitropoulos, X. Histogram-based Traffic Anomaly Detection. IEEE Trans. Netw. Serv. Manag. 2009, 6, 110–121. [Google Scholar]
- Soule, A.; Salamatia, K.; Taft, N.; Emilion, R.; Papagiannaki, K. Flow Classification by Histograms: Or How to Go on Safari in the Internet. Proceedings of the Joint International Conference on Measurement and Modeling of Computer Systems (SIGMETRICS-Performance 2004), Columbia University, New York, NY, USA, 12–16 June 2004; pp. 49–60.
- Stoecklin, M.P.; Le Boudec, J.Y.; Kind, A. A Two-layered Anomaly Detection Technique Based on Multi-modal Flow Behavior Models. Proceedings of the 9th International Conference on Passive and Active Network Measurement (PAM’08), Cleveland, OH, USA, 29–30 April 2008; pp. 212–221.
- Brauckhoff, D.; Dimitropoulos, X.; Wagner, A.; Salamatian, K. Anomaly Extraction in Backbone Networks Using Association Rules. Proceedings of the 9th ACM SIGCOMM Conference on Internet Measurement Conference (IMC ’09), Chicago, IL, USA, 4–6 November 2009; pp. 28–34.
- Iglesias, F.; Zseby, T. Entropy-Based Characterization of Internet Background Radiation. Entropy 2014, 17, 74–101. [Google Scholar]
- Harrington, D.; Presuhn, R.; Wijnen, B. An Architecture for Describing Simple Network Management Protocol (SNMP) Management Frameworks. Available online: http://www.ietf.org/rfc/rfc3411.txt accessed on 16 April 2015.
- Claise, B. Cisco Systems NetFlow Services Export Version 9. Available online: http://tools.ietf.org/html/rfc3954 accessed on 16 April 2015.
- Kambourakis, G.; Kolias, C.; Gritzalis, S.; Park, J.H. DoS attacks exploiting signaling in {UMTS} and {IMS}. Comput. Commun. 2011, 34, 226–235. [Google Scholar]
- Choi, K.; Chen, X.; Li, S.; Kim, M.; Chae, K.; Na, J. Intrusion Detection of NSM Based DoS Attacks Using Data Mining in Smart Grid. Energies 2012, 5, 4091–4109. [Google Scholar]
- Liu, Y.; Xiong, N.; Park, J.; Yang, C.; Xu, K. Fair incentive mechanism with pyramidal structure for peer-to-peer networks. IET Commun. 2010, 4, 1–12. [Google Scholar]
- Lee, D.C.; Park, B.; Kim, K.E.; Lee, J.J. Fast Traffic Anomalies Detection Using SNMP MIB Correlation Analysis. Proceedings of the 11th International Conference on Advanced Communication Technology (ICACT’09), Phoenix Park, Korea, 15–18 February 2009; 1, pp. 166–170.
- Casas, P.; Fillatre, L.; Vaton, S.; Nikiforov, I. Volume Anomaly Detection in Data Networks: An Optimal Detection Algorithm vs. the PCA Approach. In Traffic Management and Traffic Engineering for the Future Internet; Valadas, R., Salvador, P., Eds.; Volume 5464, Lecture Notes in Computer Science; Springer: Berlin/Heidelberg, Germany, 2009; pp. 96–113. [Google Scholar]
- Plixer Scrutinizer—Incydent Response System. Available online: http://www.plixer.com accessed on 16 April 2015.
- Peassler PRTG—Network Monitor. Available online: http://www.paessler.com accessed on 16 April 2015.
- Solarwinds Network Traffic Analyzer. Available online: http://www.solarwinds.com accessed on 16 April 2015.
- Invea-Tech FlowMon. Available online: https://www.invea.com accessed on 16 April 2015.
- AKMA Labs FlowMatrix. Available online: http://www.akmalabs.com accessed on 16 April 2015.
- Jingle, I.; Rajsingh, E. ColShield: An effective and collaborative protection shield for the detection and prevention of collaborative flooding of DDoS attacks in wireless mesh networks. Human-centric Comput. Inf. Sci. 2014, 4. [Google Scholar] [CrossRef]
- Zhou, W.; Jia, W.; Wen, S.; Xiang, Y.; Zhou, W. Detection and defense of application-layer {DDoS} attacks in backbone web traffic. Future Gener. Comput. Syst. 2014, 38, 36–46. [Google Scholar]
- Brauckhoff, D.; Tellenbach, B.; Wagner, A.; May, M.; Lakhina, A. Impact of Packet Sampling on Anomaly Detection Metrics. Proceedings of the 6th ACM SIGCOMM Conference on Internet Measurement (IMC ’06), Rio de Janeiro, Brazil, 25–27 October 2006; pp. 159–164.
- Lakhina, A.; Crovella, M.; Diot, C. Mining Anomalies Using Traffic Feature Distributions. Proceedings of the 2005 Conference on Applications, Technologies, Architectures, and Protocols for Computer Communications (SIGCOMM’05), Philadelphia, PA, USA, 22–26 August 2005; pp. 217–228.
- Shannon, C. A Mathematical Theory of Communication. Bell Syst. Tech. J. 1948, 27, 379–423. [Google Scholar]
- Baez, J.C.; Fritz, T.; Leinster, T. A Characterization of Entropy in Terms of Information Loss. Entropy 2011, 13, 1945–1957. [Google Scholar]
- Lee, W.; Xiang, D. Information-theoretic measures for anomaly detection. Proceedings of 2001 IEEE Symposium on Security and Privacy, Oakland, CA, USA, 14–16 May 2001; pp. 130–143.
- Grünwald, P.; Vitányi, P. Kolmogorov Complexity and Information Theory. With an Interpretation in Terms of Questions and Answers. J. Logic Lang. Inf. 2003, 12, 497–529. [Google Scholar]
- Teixeira, A.; Matos, A.; Souto, A.; Antunes, L. Entropy Measures vs. Kolmogorov Complexity. Entropy 2011, 13, 595–611. [Google Scholar]
- Ranjan, S.; Shah, S.; Nucci, A.; Munafo, M.; Cruz, R.; Muthukrishnan, S. DoWitcher: Effective Worm Detection and Containment in the Internet Core. Proceedings of 26th IEEE International Conference on Computer Communications (INFOCOM 2007), Anchorage, AL, USA, 6–12 May 2007; pp. 2541–2545.
- Gu, Y.; McCallum, A.; Towsley, D. Detecting Anomalies in Network Traffic Using Maximum Entropy Estimation. Proceedings of the 5th ACM SIGCOMM Conference on Internet Measurement (IMC ’05), Berkeley, CA, USA, 19–21 October 2005; pp. 32–32.
- Speidel, U.; Eimann, R.; Brownlee, N. Detecting network events via T-entropy. Proceedings of 6th International Conference on Information, Communications Signal Processing, Singapore, Singapore, 10–13 December 2007; 2007; pp. 1–5. [Google Scholar]
- Eimann, R.; Speidel, U.; Brownlee, J. A T-entropy Analysis of the Slammer Worm Outbreak. Proceedings of Asia-Pacific Network Operations and Management Symposium, Okinawa, Japan, 27–30 September 2005; pp. 434–445.
- Titchener, M.R.; Nicolescu, R.; Staiger, L.; Gulliver, T.A.; Speidel, U. Deterministic Complexity and Entropy. Fundam. Inform. 2005, 64, 443–461. [Google Scholar]
- Pawelec, J.; Bereziński, P.; Piotrowski, R.; Chamela, W. Entropy Measures For Internet Traffic Anomaly Detection. Proceedings of 16th International Conference on Computer Systems Aided Science, Industry and Transport (TransComp), hlcity, country, date 2012; pp. 309–318.
- Tsallis, C. Possible generalization of Boltzmann-Gibbs statistics. J. Stat. Phys. 1988, 52, 479–487. [Google Scholar]
- Tsallis, C. The Nonadditive Entropy Sq and Its Applications in Physics and Elsewhere: Some Remarks. Entropy 2011, 13, 1765–1804. [Google Scholar]
- Prehl, J.; Essex, C.; Hoffmann, K.H. Tsallis Relative Entropy and Anomalous Diffusion. Entropy 2012, 14, 701–716. [Google Scholar]
- Renyi, A. Probability Theory; Enlarged version of Wahrscheinlichkeitsrechnung, Valoszinusegszamitas and Calcul des probabilites. English translation by Laszlo Vekerdi; North-Holland: Amsterdam, The Netherlands, 1970. [Google Scholar]
- Csiszár, I. Axiomatic Characterizations of Information Measures. Entropy 2008, 10, 261–273. [Google Scholar]
- Ziviani, A.; Gomes, A.; Monsores, M.; Rodrigues, P. Network anomaly detection using nonextensive entropy. IEEE Commun. Lett. 2007, 11, 1034–1036. [Google Scholar]
- Shafiq, M.Z.; Khayam, S.A.; Farooq, M. Improving Accuracy of Immune-inspired Malware Detectors by Using Intelligent Features. Proceedings of the 10th Annual Conference on Genetic and Evolutionary Computation (GECCO ’08), Atlanta, GA, USA, 12–16 July 2008; pp. 119–126.
- Lima, C.F.L.; de Assis, F.M.; de Souza, C.P. A Comparative Study of Use of Shannon, Rényi and Tsallis Entropy for Attribute Selecting in Network Intrusion Detection. Proceedings of the 13th Intl Conf. on Intelligent Data Engineering and Automated Learning (IDEAL’12), Natal, Brazil, 29–31 August 2012; pp. 492–501.
- Tellenbach, B.; Burkhart, M.; Schatzmann, D.; Gugelmann, D.; Sornette, D. Accurate Network Anomaly Classification with Generalized Entropy Metrics. Comput. Netw. 2011, 55, 3485–3502. [Google Scholar]
- Zhang, J.; Chen, X.; Xiang, Y.; Zhou, W.; Wu, J. Robust Network Traffic Classification. IEEE/ACM Trans. Netw. 2014, PP, 1–1. [Google Scholar]
- Clausius, R.; Hirst, T. The Mechanical Theory of Heat: With its applications to the steam-engine and to the physical properties of bodies; J. van Voorst: London, UK, 1867. [Google Scholar]
- Karmeshu, J. Entropy Measures, Maximum Entropy Principle and Emerging Applications; Springer: New York, NY, USA, 2003. [Google Scholar]
- Harremoes, P.; Topsoe, F. Maximum Entropy Fundamentals. Entropy 2001, 3, 191–226. [Google Scholar]
- Kullback, S. Information Theory and Statistics; Wiley: New York, NY, USA, 1959. [Google Scholar]
- Cover, T.; Thomas, J. Elements of Information Theory; Wiley: Hoboken, NJ, USA, 2006. [Google Scholar]
- Maszczyk, T.; Duch, W. Comparison of Shannon, Renyi and Tsallis Entropy Used in Decision Trees. In Artificial Intelligence and Soft Computing—ICAISC 2008; Rutkowski, L., Tadeusiewicz, R., Zadeh, L., Zurada, J., Eds.; Volume 5097, Lecture Notes in Computer Science; Springer: Berlin/Heidelberg, Germany, 2008; pp. 643–651. [Google Scholar]
- Marco, M. A step beyond Tsallis and Rényi entropies. Phys. Lett. A 2005, 338, 217–224. [Google Scholar]
- Wȩdrowska, E. Miary entropii i dywergencji w analizie struktur; Wydawnictwo Uniwersytetu Warminsko-Mazurskiego: Olsztyn, Poland, 2012. [Google Scholar]
- Softflowd—Flow-based Network Traffic Analyser. Available online: http://code.google.com/p/softflowd/ accessed on 16 April 2015.
- Gigamon—SPAN Port Or TAP? White Paper. Available online: https://www.netdescribe.com/downloads/span_port_or_tap_web.pdf accessed on 16 April 2015.
- Trammell, B.; Wagner, A.; Claise, B. Flow Aggregation for the IP Flow Information Export (IPFIX) Protocol. Available online: http://tools.ietf.org/html/rfc7015 accessed on 16 April 2015.
- Reimann, C.; Filzmoser, P.; Garrett, R.G. Background and threshold: critical comparison of methods of determination. Sci. Total Environ. 2005, 346, 1–16. [Google Scholar]
- Szpyrka, M.; Jasiul, B.; Wrona, K.; Dziedzic, F. Telecommunications Networks Risk Assessment with Bayesian Networks. In Computer Information Systems and Industrial Management; Saeed, K., Chaki, R., Cortesi, A., Wierzchoń, S., Eds.; Volume 8104, Lecture Notes in Computer Science; Springer; Berlin/Heidelberg, Germany, 2013; pp. 277–288. [Google Scholar]
- Hall, M.; Frank, E.; Holmes, G.; Pfahringer, B.; Reutemann, P.; Witten, I. The WEKA Data Mining Software: An Update. SIGKDD Explor. Newslett. 2009, 11, 10–18. [Google Scholar]
- Jasiul, B.; Szpyrka, M.; Śliwa, J. Detection and Modeling of Cyber Attacks with Petri Nets. Entropy 2014, 16, 6602–6623. [Google Scholar]
- Jasiul, B.; Szpyrka, M.; Śliwa, J. Malware Behavior Modeling with Colored Petri Nets. In Computer Information Systems and Industrial Management; Saeed, K., Snasel, V., Eds.; Volume 8838, Lecture Notes in Computer Science; Springer: Berlin/Heidelberg, Germany, 2014; pp. 667–679. [Google Scholar]
- Jasiul, B.; Szpyrka, M.; Śliwa, J. Formal Specification of Malware Models in the Form of Colored Petri Nets. In Computer Science and its Applications; Park, J.J.J.H., Stojmenovic, I., Jeong, H.Y., Yi, G., Eds.; Volume 330, Lecture Notes in Electrical Engineering; Springer; Berlin/Heidelberg, Germany, 2015; pp. 475–482. [Google Scholar]
- ACM Sigcomm Internet Traffic Archive. Available online: http://www.sigcomm.org/ITA accessed on 16 April 2015.
- Lawrence Berkeley National Laboratory/International Computer Science Institute Enterprise Tracing. Available online: http://www.icir.org/enterprise-tracing/ accessed on 16 April 2015.
- SimpleWeb. Available online: http://www.simpleweb.org/wiki/Traces accessed on 16 April 2015.
- Center for Applied Internet Data Analysis (CAIDA). Available online: http://www.caida.org/data/overview accessed on 16 April 2015.
- Cluster of European Projects aimed at Monitoring and Measurement (MoMe). Available online: http://www.ist-mome.org/database/MeasurementData accessed on 16 April 2015.
- Waikato Internet Traffic Storage (WITS). Available online: http://wand.net.nz/wits accessed on 16 April 2015.
- UMass Trace Repository (UMass). Available online: http://traces.cs.umass.edu accessed on 16 April 2015.
- Verizon Data Breach Investigations Report. Available online: http://www.verizonenterprise.com/DBIR/2014/(accessed accessed on 16 April 2015.
- Symantec Internet Security Threat Report. Available online: http://www.symantec.com/security_response/publications/threatreport.jsp accessed on 16 April 2015.
- CERT Poland Raport. Availableonline: http://www.cert.pl/PDF/Report_CP_2013.pdf accessed on 16 April 2015.
- Saad, S.; Traore, I.; Ghorbani, A.A.; Sayed, B.; Zhao, D.; Lu, W.; Felix, J.; Hakimian, P. Detecting P2P botnets through network behavior analysis and machine learning. Proceedings of 2011 Ninth Annual International Conference on Privacy, Security and Trust (PST), Montreal, QC, Canada, 19–21 July 2011; pp. 174–180.
- García, S.; Grill, M.; Stiborek, J.; Zunino, A. An Empirical Comparison of Botnet Detection Methods. Comput. Secur. 2014, 45, 100–123. [Google Scholar]
- Sperotto, A.; Sadre, R.; Vliet, F.; Pras, A. A Labeled Data Set for Flow-Based Intrusion Detection. Proceedings of the 9th IEEE International Workshop on IP Operations and Management (IPOM ’09), Venice, Italy, 29–30 October 2009; Springer: Berlin/Heidelberg, Germany, 2009; pp. 39–50. [Google Scholar]
- Bereziński, P.; Pawelec, J.; Małowidzki, M.; Piotrowski, R. Entropy-Based Internet Traffic Anomaly Detection: A Case Study. Proceedings of the Ninth International Conference on Dependability and Complex Systems DepCoS-RELCOMEX, Brunów, Poland, 30 June – 4 July 2014; Zamojski, W., Mazurkiewicz, J., Sugier, J., Walkowiak, T., Kacprzyk, J., Eds.; Springer: Cham, Switzerland, 2014; 286, pp. 47–58. [Google Scholar]
- Haines, J.; Lippmann, R.; Fried, D.; Zissman, M.; Tran, E.; Boswell, S. 1999 DARPA Intrusion Detection Evaluation: Design and Procedures; Technical Report 1062; MIT Lincoln Laboratory: Lexington, MA, USA, 2001. Available online: https://www.ll.mit.edu/mission/communications/cyber/CSTcorpora/files/TR-1062.pdf accessed on 16 April 2015.
- The Third International Knowledge Discovery and Data Mining Tools (KDD) Cup 1999 Data. Available online: http://kdd.ics.uci.edu/databases/kddcup99/kddcup99.html accessed on 16 April 2015.
- Tavallaee, M.; Bagheri, E.; Lu, W.; Ghorbani, A.A. A Detailed Analysis of the KDD CUP 99 Data Set. Proceedings of the 2nd IEEE Intl Conference on Computational Intelligence for Security and Defense Applications, Ottawa, ON, Canada, 8–10 July 2009; pp. 53–58.
- McHugh, J. Testing Intrusion Detection Systems: A Critique of the 1998 and 1999 DARPA Intrusion Detection System Evaluations As Performed by Lincoln Laboratory. ACM Trans. Inf. Syst. Secur. 2000, 3, 262–294. [Google Scholar]
- Mahoney, M.V.; Chan, P.K. An Analysis of the 1999 DARPA/Lincoln Laboratory Evaluation Data for Network Anomaly Detection. In Recent Advances in Intrusion Detection; Vigna, G., Kruegel, C., Jonsson, E., Eds.; Volume 2820, Lecture Notes in Computer Science; Springer: Berlin/Heidelberg, Germany, 2003; pp. 220–237. [Google Scholar]
- Thomas, C.; Sharma, V.; Balakrishnan, N. Usefulness of DARPA dataset for intrusion detection system evaluation. SPIE Proc. 2008. [Google Scholar] [CrossRef]
- Brauckhoff, D.; Wagner, A.; May, M. FLAME: A Flow-level Anomaly Modeling Engine. Proceedings of the Conference on Cyber Security Experimentation and Test (CSET’08), San Jose, CA, USA, 28 July 2008; pp. 1–6.
- Brauckhoff, D. Network traffic anomaly detection and evaluation. Ph.D. Thesis, ETH Zürich, Switzerland, 2010. [Google Scholar]
- Shiravi, A.; Shiravi, H.; Tavallaee, M.; Ghorbani, A.A. Toward Developing a Systematic Approach to Generate Benchmark Datasets for Intrusion Detection. Comput. Secur. 2012, 31, 357–374. [Google Scholar]
- Bereziński, P.; Szpyrka, M.; Jasiul, B.; Mazur, M. Network Anomaly Detection Using Parameterized Entropy. In Computer Information Systems and Industrial Management; Saeed, K., Snasel, V., Eds.; Volume 8838, Lecture Notes in Computer Science; Springer: Berlin/Heidelberg, Germany, 2014; pp. 465–478. [Google Scholar]
- Tomer, B. Morto Post Mortem: Dissecting a Worm. Available online: http://blog.imperva.com/2011/09/morto-post-mortem-a-worm-deep-dive.html accessed on 16 April 2015.
- Damon, E.; Dale, J.; Laron, E.; Mache, J.; Land, N.; Weiss, R. Hands-on Denial of Service Lab Exercises Using SlowLoris and RUDY. Proceedings of the 2012 Information Security Curriculum Development Conference (InfoSecCD ’12), Kennesaw, GA, USA, 12–13 October 2012; pp. 21–29.
- Bencsáth, B.; Pék, G.; Buttyán, L.; Félegyházi, M. The Cousins of Stuxnet: Duqu, Flame, and Gauss. Future Internet 2012, 4, 971–1003. [Google Scholar]
- Denning, D.E. Stuxnet: What Has Changed? Future Internet 2012, 4, 672–687. [Google Scholar]
- Kührer, M.; Hupperich, T.; Rossow, C.; Holz, T. Exit from Hell? Reducing the Impact of Amplification DDoS Attacks. Proceedings of the 23rd USENIX Security Symposium, San Diego, CA, USA, 20–22 August 2014.
- Hauke, J.; Kossowski, T. Comparison of Values of Pearson’s and Spearman’s Correlation Coefficients on the Same Sets of Data. Quaest. Geogr. 2011, 30, 87–93. [Google Scholar]
- Davis, J.; Goadrich, M. The Relationship Between Precision-Recall and ROC Curves. Proceedings of the 23rd International Conference on Machine Learning (ICML’06), Pittsburgh, PA, USA, 25–29 June 2006; pp. 233–240.
- Wu, Y.; Cai, S.; Yang, S.; Zheng, F.; Xiang, N. Classification of Knee Joint Vibration Signals Using Bivariate Feature Distribution Estimation and Maximal Posterior Probability Decision Criterion. Entropy 2013, 15, 1375–1387. [Google Scholar]
- Rifkin, R. MIT—Multiclass Classification. Available online: http://www.mit.edu/~9.520/spring09/Classes/multiclass.pdf accessed on 16 April 2015.
- Sumner, M.; Frank, E.; Hall, M. Speeding up Logistic Model Tree Induction. Proceedings of 9th European Conference on Principles and Practice of Knowledge Discovery in Databases, Porto, Portugal, 3–7 October 2005; pp. 675–683.
- Seber, G.; Lee, A. Linear Regression Analysis; Wiley Series in Probability and Statistics; Wiley: Hoboken, NJ, USA, 2012. [Google Scholar]
- Landwehr, N.; Hall, M.; Frank, E. Logistic Model Trees. Mach. Learn. 2005, 59, 161–205. [Google Scholar]
- Madjarov, G.; Kocev, D.; Gjorgjevikj, D.; Deroski, S. An Extensive Experimental Comparison of Methods for Multi-label Learning. Pattern Recogn. 2012, 45, 3084–3104. [Google Scholar]
- MEKA: A Multi-label Extension to WEKA. Available online: http://meka.sourceforge.net/ accessed on 16 April 2015.


| X | “10.1.0.1” | “10.1.0.2” | “10.1.0.3” | “10.1.0.4” | “10.1.0.5” |
| p(X = x) | 0.96 | 0.01 | 0.01 | 0.01 | 0.01 |
| α | −2 | 2 |
|---|---|---|
| p(xi) | ||
| 0.96 | 1.08 | 0.92 |
| 0.01 | 10000 | 0.0001 |
| Feature | Probability mass function |
|---|---|
| src(dst)address(port) | |
| flows duration | |
| packets, bytes | |
| in(out)-degree |
| Type/kind | No. of flows | Duration [s] | No. of victims | No. of attackers |
|---|---|---|---|---|
| SSH brute force (bf) | ||||
| 1 | 1K | 300 | 1 | 1 |
| 2 | 1K | 100 | 1 | 1 |
| TCP SYN flood DDoS (dd) | ||||
| 1 | 2K | 200 | 1 | 50 |
| 2 | 2K | 200 | 1 | 250 |
| 3 | 3K | 300 | 1 | 50 |
| 4 | 3K | 300 | 1 | 250 |
| 5 | 4K | 400 | 1 | 50 |
| 6 | 4K | 400 | 1 | 250 |
| SSH network scan (ns) | ||||
| 1 | 6K | 60 | 6K | 1 |
| 2 | 6K | 300 | 6K | 1 |
| 3 | 8K | 80 | 8K | 1 |
| 4 | 8K | 400 | 8K | 1 |
| Port scan (ps) | ||||
| 1 | 1K | 50 | 1 | 1 |
| 2 | 1K | 100 | 1 | 1 |
| 3 | 2K | 100 | 1 | 1 |
| 4 | 2K | 200 | 1 | 1 |
| Type | No. of flows | Duration [s] | No. of victims | No. of attackers |
|---|---|---|---|---|
| Network scan (ns) | 252 | 200 | 252 | 1 |
| RDP brute force (bf) | 720 | 550 | 53 | 1 |
| Botnet p2p (p2p) | 150 | 185 | 15 | 15 |
| Slowrolis DDoS (dd) | 1124 | 117 | 15 | 1 |
| Type | No. of flows | Duration [s] | No. of victims | No. of attackers |
|---|---|---|---|---|
| Block scan (bs) | 1.5K | 80 | 168 | 1 |
| RPC attack (rpc) | 650 | 200 | 90 | 1 |
| Botnet C&C communication (c&c) | 125 | 190 | 63 | 1 |
| NTP DDoS (dd) | 2.9K | 580 | 1 | 63 (spoofed to 1) |
| α = −3 | α = −2 | α = −1 | α = 0 | α = 1 | α = 2 | α = 3 | ||
|---|---|---|---|---|---|---|---|---|
| Pearson | α = −3 | 1 | 0.99 | 0.96 | 0.66 | 0.12 | −0.06 | −0.09 |
| α = −2 | – | 1 | 0.98 | 0.69 | 0.13 | −0.06 | −0.09 | |
| α = −1 | – | – | 1 | 0.75 | 0.16 | −0.05 | −0.08 | |
| α = 0 | – | – | – | 1 | 0.44 | 0.18 | 0.12 | |
| α = 2 | – | – | – | – | – | 1 | 0.97 | |
| α = 3 | – | – | – | – | – | – | 1 | |
| Spearman | α = −3 | 1 | 0.97 | 0.837 | 0.46 | 0.06 | −0.09 | −0.11 |
| α = −2 | – | 1 | 0.94 | 0.57 | 0.1 | −0.07 | −0.1 | |
| α = −1 | – | – | 1 | 0.72 | 0.15 | −0.06 | −0.09 | |
| α = 0 | – | – | – | 1 | 0.49 | 0.2 | 0.15 | |
| α = 2 | – | – | – | – | – | 1 | 0.9 | |
| α = 3 | – | – | – | – | – | – | 1 | |
| Pearson | src ip | dst ip | src port | dst port | in-degree | out-degree |
|---|---|---|---|---|---|---|
| src ip | 1 | 0.89 | 0.89 | 0.91 | 0.37 | 0.35 |
| dst ip | – | 1 | 0.98 | 0.89 | 0.27 | 0.55 |
| src port | – | – | 1 | 0.86 | 0.15 | 0.5 |
| dst port | – | – | – | 1 | 0.41 | 0.53 |
| ind-egree | – | – | – | – | 1 | 0.27 |
| out-degree | – | – | – | – | – | 1 |
| Spearman | src ip | dst ip | src port | dst port | in-degree | out-degree |
| src ip | 1 | 0.9 | 0.85 | 0.87 | 0.47 | 0.69 |
| dst ip | – | 1 | 0.96 | 0.89 | 0.43 | 0.83 |
| src port | – | – | 1 | 0.83 | 0.3 | 0.69 |
| dst port | – | – | – | 1 | 0.53 | 0.12 |
| in-degree | – | – | – | – | 1 | 0.48 |
| out-degree | – | – | – | – | – | 1 |
| Pearson | src ip | dst ip | src port | dst port | in-degree | out-degree |
|---|---|---|---|---|---|---|
| src ip | 1 | −0.07 | −0.34 | −0.02 | −0.07 | 0.44 |
| dst ip | – | 1 | −0.29 | 0.05 | 0.08 | −0.28 |
| src port | – | – | 1 | −0.42 | 0.59 | −0.04 |
| dst port | – | – | – | 1 | −0.39 | 0.01 |
| in-degree | – | – | – | – | 1 | 0.03 |
| out-degree | – | – | – | – | – | 1 |
| Spearman | src ip | dst ip | src port | dst port | in-degree | out-degree |
| src ip | 1 | 0.03 | −0.21 | 0.07 | 0.21 | 0.37 |
| dst ip | – | 1 | −0.31 | 0.07 | 0.08 | −0.35 |
| src port | – | – | 1 | −0.55 | 0.64 | 0.23 |
| dst port | – | – | – | 1 | 0.52 | 0.76 |
| in-degree | – | – | – | – | 1 | 0.18 |
| out-degree | – | – | – | – | – | 1 |
| Name | Formula |
|---|---|
| True Positive Rate (TPR) eqv. with Recall, Sensitivity | |
| True Negative Rate (TNR) eqv. with Specificity | |
| Positive Predictive Value (PPV) eqv. with Precision | |
| Negative Predictive Value (NPV) | |
| False Positive Rate (FPR) eqv. with Fall-out | |
| False Discovery Rate (FDR) | |
| False Negative Rate (FNR) | |
| Accuracy (ACC) | |
| F1 score – harmonic mean of Precision and Recall |
| ZeroR | Bayes Network | Decision Tree J48 | Random Forest | Simple Logistic | ||
|---|---|---|---|---|---|---|
| Accuracy | Tsallis | 0.66 | 0.89 | 0.90 | 0.93 | 0.93 |
| Renyi | 0.66 | 0.88 | 0.89 | 0.90 | 0.93 | |
| Shannon | 0.66 | 0.84 | 0.86 | 0.90 | 0.92 | |
| volume-based | 0.66 | 0.72 | 0.77 | 0.76 | 0.80 | |
| FPR | Tsallis | 0.66 | 0.07 | 0.08 | 0.07 | 0.06 |
| Renyi | 0.66 | 0.08 | 0.09 | 0.11 | 0.09 | |
| Shannon | 0.66 | 0.08 | 0.11 | 0.12 | 0.08 | |
| volume-based | 0.66 | 0.21 | 0.15 | 0.22 | 0.20 | |
| ZeroR | Bayes Network | Decision Tree J48 | Random Forest | Simple Logistic | ||
|---|---|---|---|---|---|---|
| Accuracy | Tsallis | 0.68 | 0.82 | 0.84 | 0.85 | 0.91 |
| Renyi | 0.68 | 0.83 | 0.88 | 0.89 | 0.92 | |
| Shannon | 0.68 | 0.77 | 0.8 | 0.84 | 0.89 | |
| volume-based | 0.68 | 0.68 | 0.73 | 0.78 | 0.80 | |
| FPR | Tsallis | 0.68 | 0.22 | 0.14 | 0.27 | 0.11 |
| Renyi | 0.68 | 0.15 | 0.12 | 0.2 | 0.11 | |
| Shannon | 0.68 | 0.29 | 0.21 | 0.28 | 0.15 | |
| volume-based | 0.68 | 0.68 | 0.2 | 0.15 | 0.28 | |
| ZeroR | Bayes Network | Decision Tree J48 | Random Forest | Simple Logistic | ||
|---|---|---|---|---|---|---|
| Accuracy | Tsallis | 0.68 | 0.83 | 0.83 | 0.87 | 0.93 |
| Renyi | 0.68 | 0.83 | 0.83 | 0.85 | 0.94 | |
| Shannon | 0.68 | 0.76 | 0.8 | 0.85 | 0.90 | |
| volume-based | 0.68 | 0.68 | 0.62 | 0.65 | 0.66 | |
| FPR | Tsallis | 0.68 | 0.13 | 0.17 | 0.22 | 0.1 |
| Renyi | 0.68 | 0.13 | 0.16 | 0.22 | 0.06 | |
| Shannon | 0.68 | 0.23 | 0.16 | 0.22 | 0.13 | |
| volume-based | 0.68 | 0.68 | 0.57 | 0.45 | 0.67 | |
| TPR/FPR | |||
|---|---|---|---|
| Scenario1 | Scenario2 | Scenario3 | |
| brute force | 0.78/0 | 1/0.01 | – |
| network scan | 0.92/0.02 | 0.9/0 | – |
| port scan | 0.92/0.01 | – | – |
| block scan | – | – | 0.9/0.01 |
| DDoS | 0.67/0.01 | 0.9/0 | 0.9/0.01 |
| p2p | – | 0.3/0.02 | – |
| c&c | – | – | 0.9/0.01 |
| RPC exploitation | – | – | 0.7/0.01 |
| not anomalous | 0.98/0.13 | 0.97/0.16 | 0.97/0.08 |
© 2015 by the authors; licensee MDPI, Basel, Switzerland This article is an open access article distributed under the terms and conditions of the Creative Commons Attribution license (http://creativecommons.org/licenses/by/4.0/).
Share and Cite
Bereziński, P.; Jasiul, B.; Szpyrka, M. An Entropy-Based Network Anomaly Detection Method. Entropy 2015, 17, 2367-2408. https://doi.org/10.3390/e17042367
Bereziński P, Jasiul B, Szpyrka M. An Entropy-Based Network Anomaly Detection Method. Entropy. 2015; 17(4):2367-2408. https://doi.org/10.3390/e17042367
Chicago/Turabian StyleBereziński, Przemysław, Bartosz Jasiul, and Marcin Szpyrka. 2015. "An Entropy-Based Network Anomaly Detection Method" Entropy 17, no. 4: 2367-2408. https://doi.org/10.3390/e17042367
APA StyleBereziński, P., Jasiul, B., & Szpyrka, M. (2015). An Entropy-Based Network Anomaly Detection Method. Entropy, 17(4), 2367-2408. https://doi.org/10.3390/e17042367