Article

Collaborative Performance Research on Multi-level Hospital Management Based on Synergy Entropy-HoQ

Department of Industrial Engineering and Engineering Management, Sichuan University, Chengdu 610064, China
*
Author to whom correspondence should be addressed.
Entropy 2015, 17(4), 2409-2431; https://doi.org/10.3390/e17042409
Submission received: 6 January 2015 / Revised: 25 March 2015 / Accepted: 15 April 2015 / Published: 20 April 2015
(This article belongs to the Special Issue Entropy, Utility, and Logical Reasoning)

Abstract

:
Because of the general lack of multi-level hospital management collaboration performance effectiveness research, this paper proposes a multi-level hospital management Synergy Entropy-House of Quality (HoQ) Measurement Model by innovatively combining the House of Quality (HoQ) measure model with a Synergy Entropy computing principle. Triangular fuzzy functions are used to determine the importance degree parameter of each hospital management element which combined with the results from the Synergy Entropy evaluation of the hospital management elements, arrive at a comprehensive collaborative computation result for the various elements, ensuring results objectivity. Finally, the analysis of the collaborative research on multi-level hospital management demonstrated the scientific effectiveness of the hospital management Synergy Entropy-House of Quality (HoQ) Measurement Model.

1. Introduction

The use of scientific management theory and methods is often emphasized in hospital management as it can give full play to the overall collaborative operational functions to allow for a full examination of hospital planning resources, such as staff, materials and information. The main purpose of such examinations is to provide patients with quality health care services and to meet the patient needs. However, medical institutions often suffer from a lack of adequate health care resources, have a lack of grading for collaborative work and have no clear guidelines for service provision, all of which make it difficult to achieve a scientific, rational and efficient use of the medical and health resources.
National health service sustainable development and hospital and medical management have been widely researched. Shusaku and Shoji used data mining methods to extract information stored in a hospital information systems and applied exploratory data analysis techniques and a generalized linear model to optimize the hospital’s management [1]. From the perspective of improving patient satisfaction, Rozenblum, Lisby, Hockey et al. conducted a survey in four academic hospitals in Denmark, Israel, the United Kingdom and the United States to analyze the relationship between hospital management and front-line clinicians, and demonstrated that patient satisfaction was influenced by clinician attitudes and the hospital construction management plan [2]. Using an integration of genetic algorithms and a binary particle swarm optimization algorithm, Chiu et al. proposed an RFID network layout method, and conducted optimization research on hospital management information transmission network issues [3]. Inter-hospital ambulance transfer problems were analyzed by Nakamura et al. using a discrete event simulation model, game theory and other research tools, the results from which showed that centralized resource sharing and collaboration had a significant impact on reducing hospital ambulance transfer times [4]. Tianlin et al. theoretically analyzed the necessity for hospital management innovations, and described hospital management innovation methods and basic practice principles [5].
Management process research on collaborative synergy management is a mature field of study. Kapucu and Arslan based on research into leadership, decision-making and collaborative relationships between the government and aid organizations, found that synergy management using collaborative networks could improve emergency management efficiency through the effective use of emergency resources [6]. Feng and Zhuowen conducted a comprehensive analysis of a multi-project collaborative management system, analyzed multi-project synergy generation and recommended measures to achieve enterprise-wide multi-project collaborative management using a multi-project collaborative management model [7]. Comfort et al. assessed the emergency response capacity of communities through the establishment of a dynamic simulation system model, and found that the transfer of and access to key information was helpful in improving community organizational network collaboration performance [8].
Although there has been significant research and made a significant contribution in the aspect of improving patient satisfaction, advancing operational efficiency of the hospital and hospital management innovations in most cases, researchers have researched hospitals as independent individuals and from a theoretical or data driven perspective, so the issue of effective collaborative management between hospitals and medical services has not been fully tapped. In addition, although collaborative management thinking is quite mature, research on hospital collaborative management is rare, meaning that it is difficult to give an accurate picture of the situation in multi-level hospitals, or have definitive opinions about the administrative and collaborative performances between hospitals and health care providers. In view of this, and on the basis of previous studies, this paper analyzes hospital management from the perspective of collaborative management, and proposes a multi-level hospital management Synergy Entropy-House of Quality Measurement Model by introducing collaborative entropy theory. It is hoped that this model can provide a reference for improving hospital management and the coordination efficiency of organizations based on the synergy calculation.
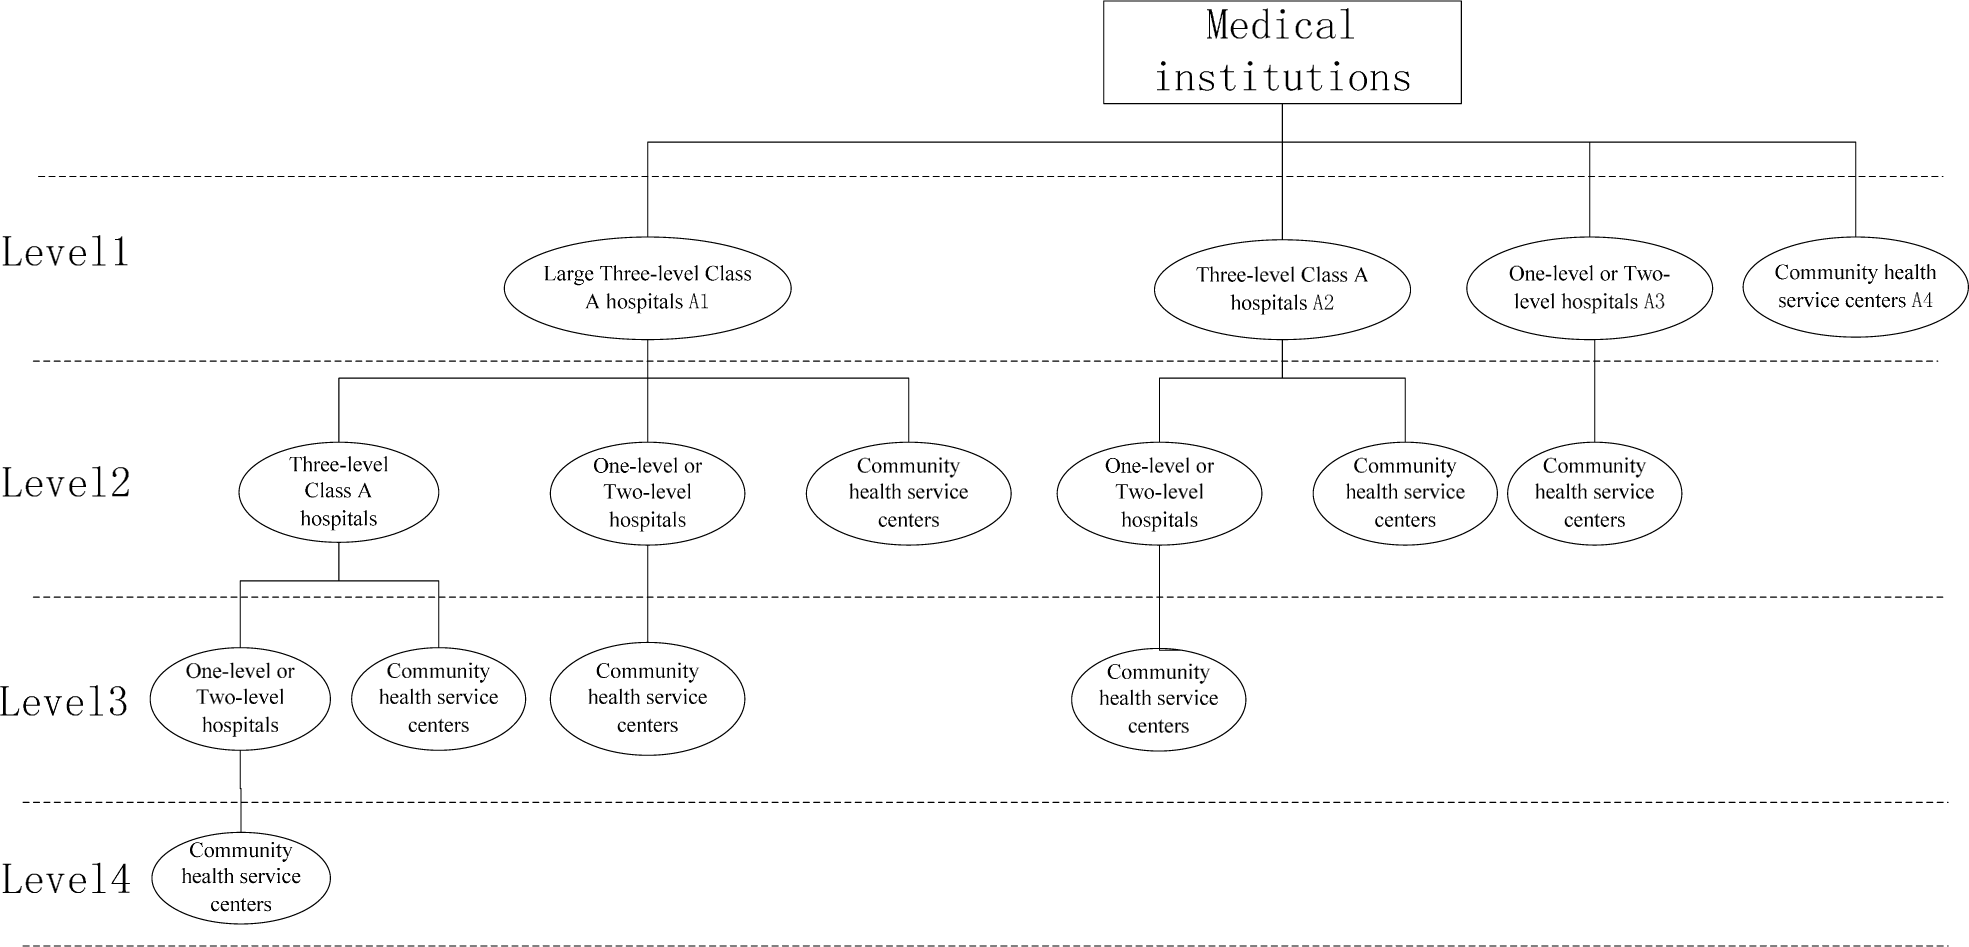
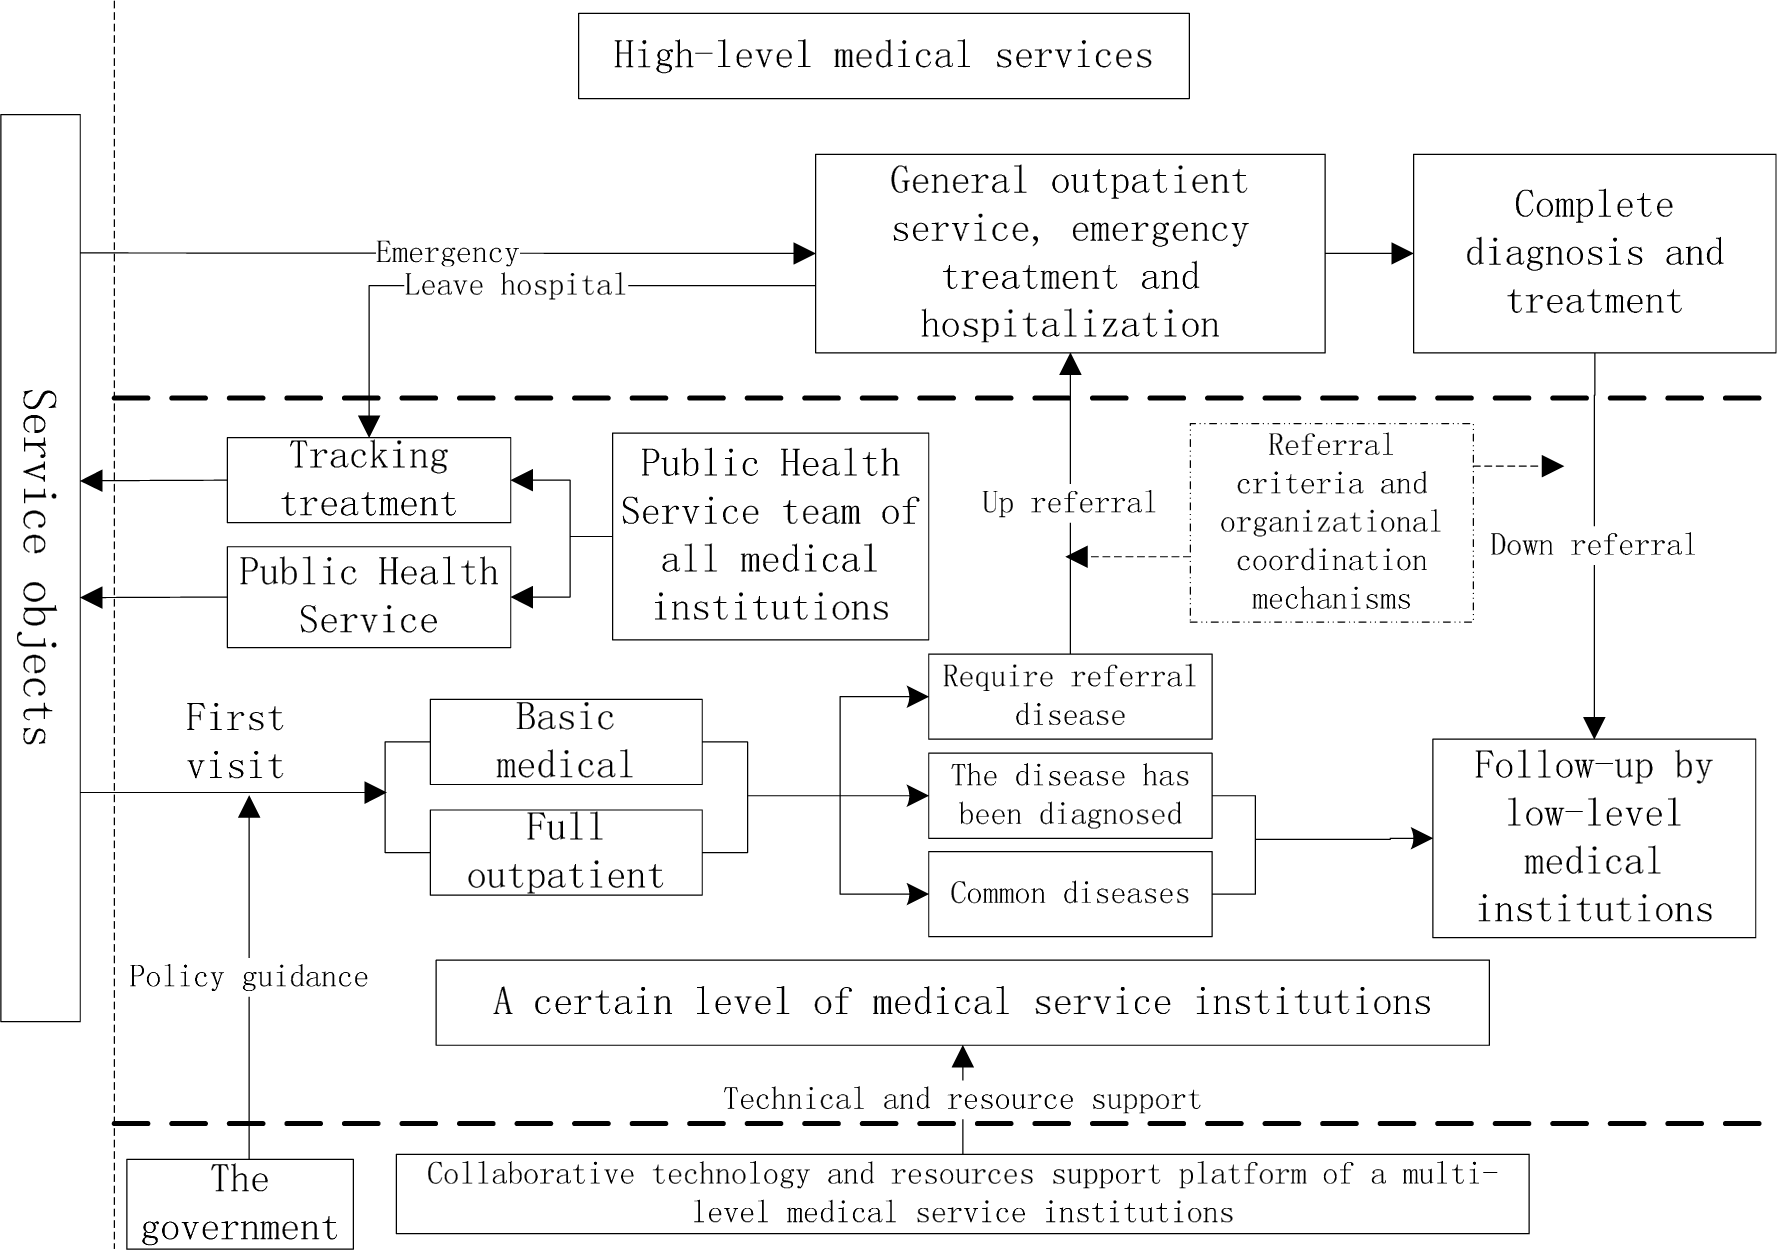
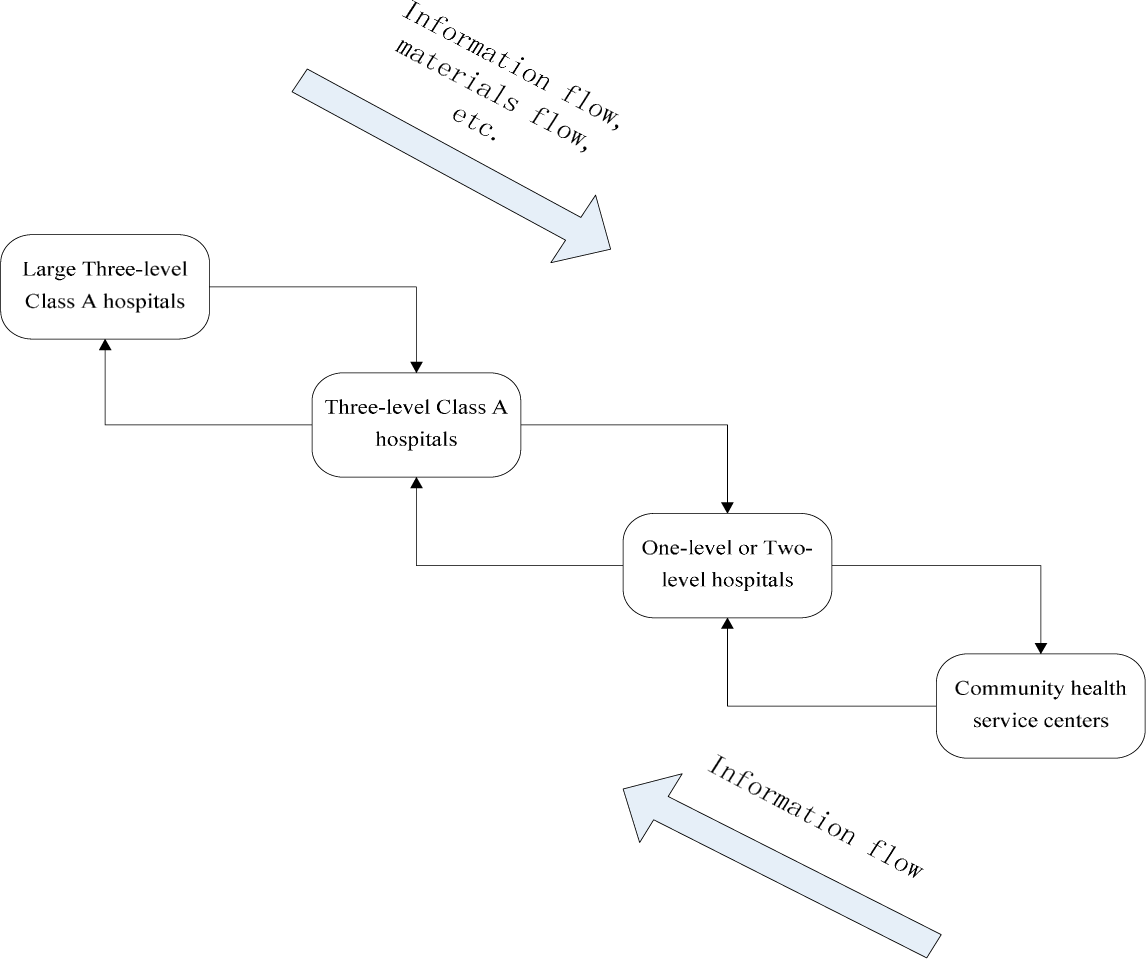
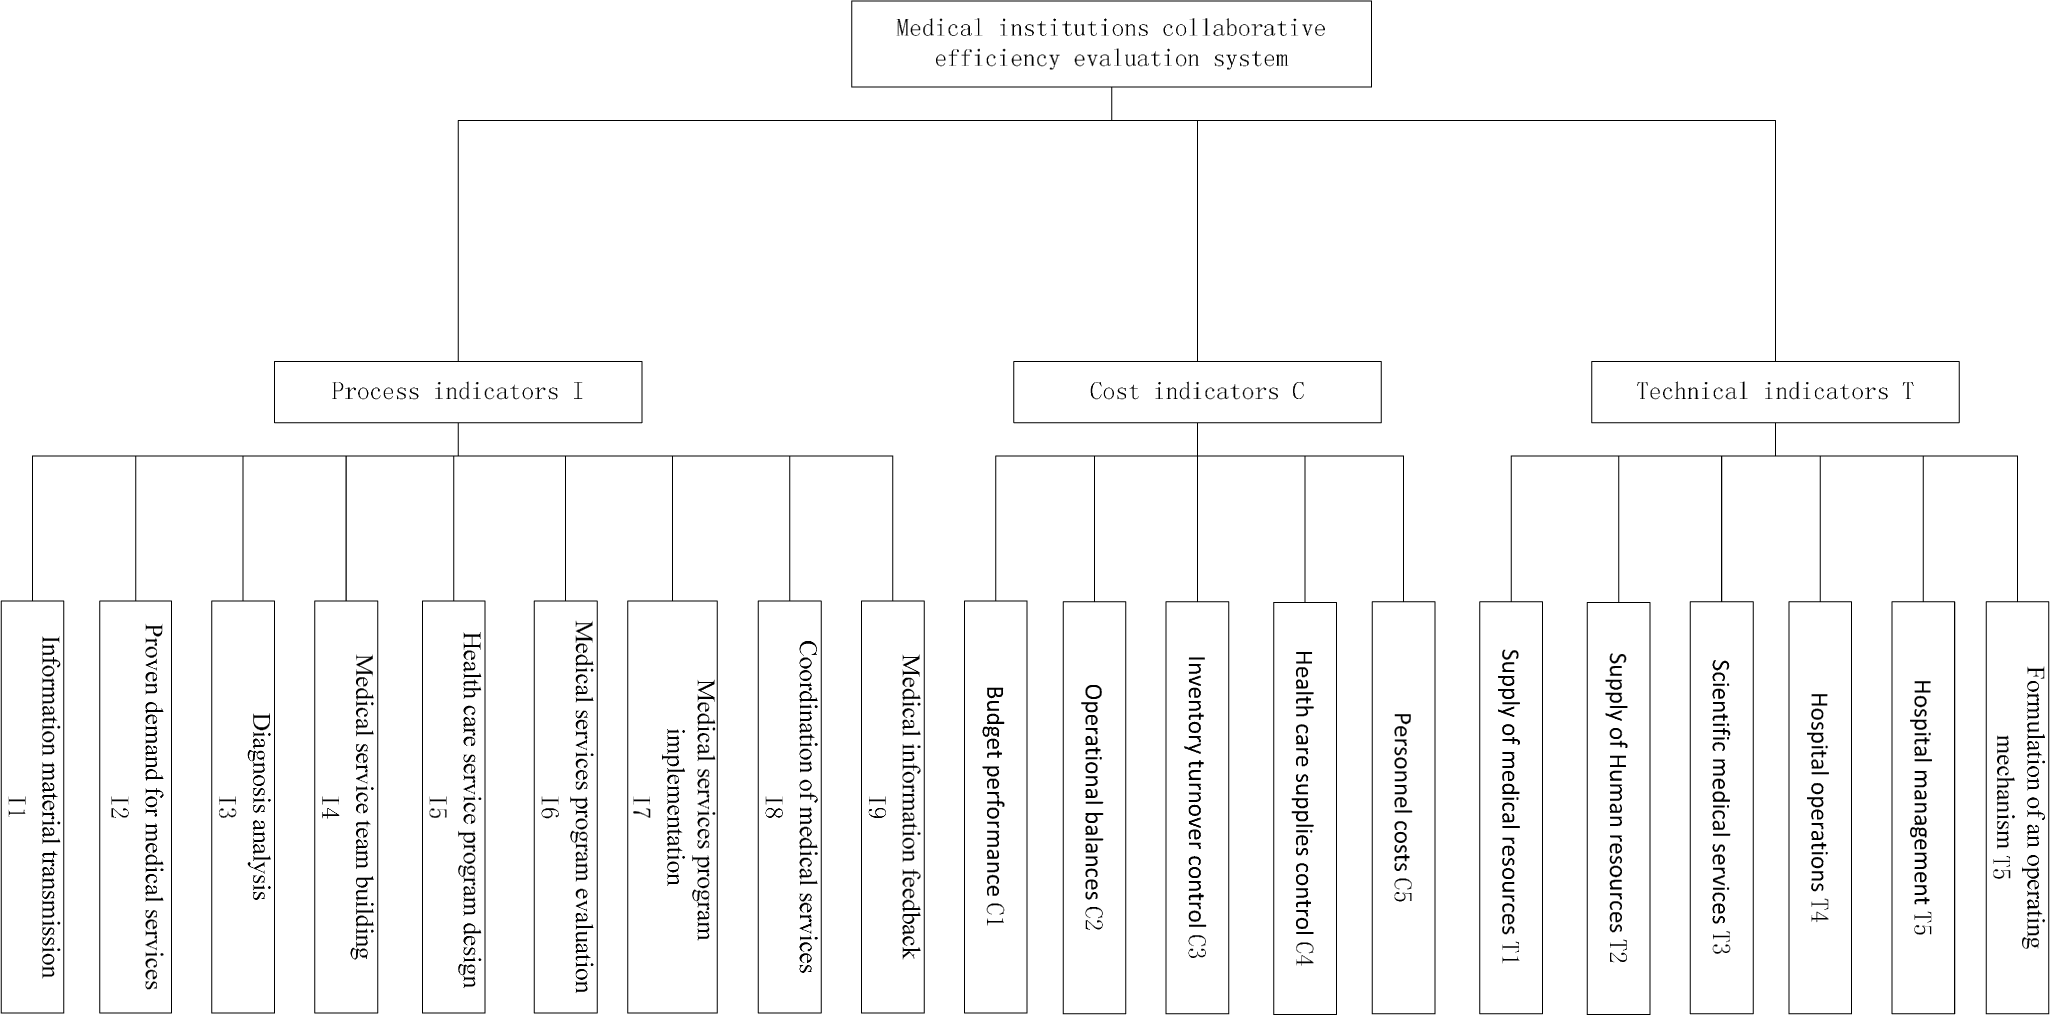
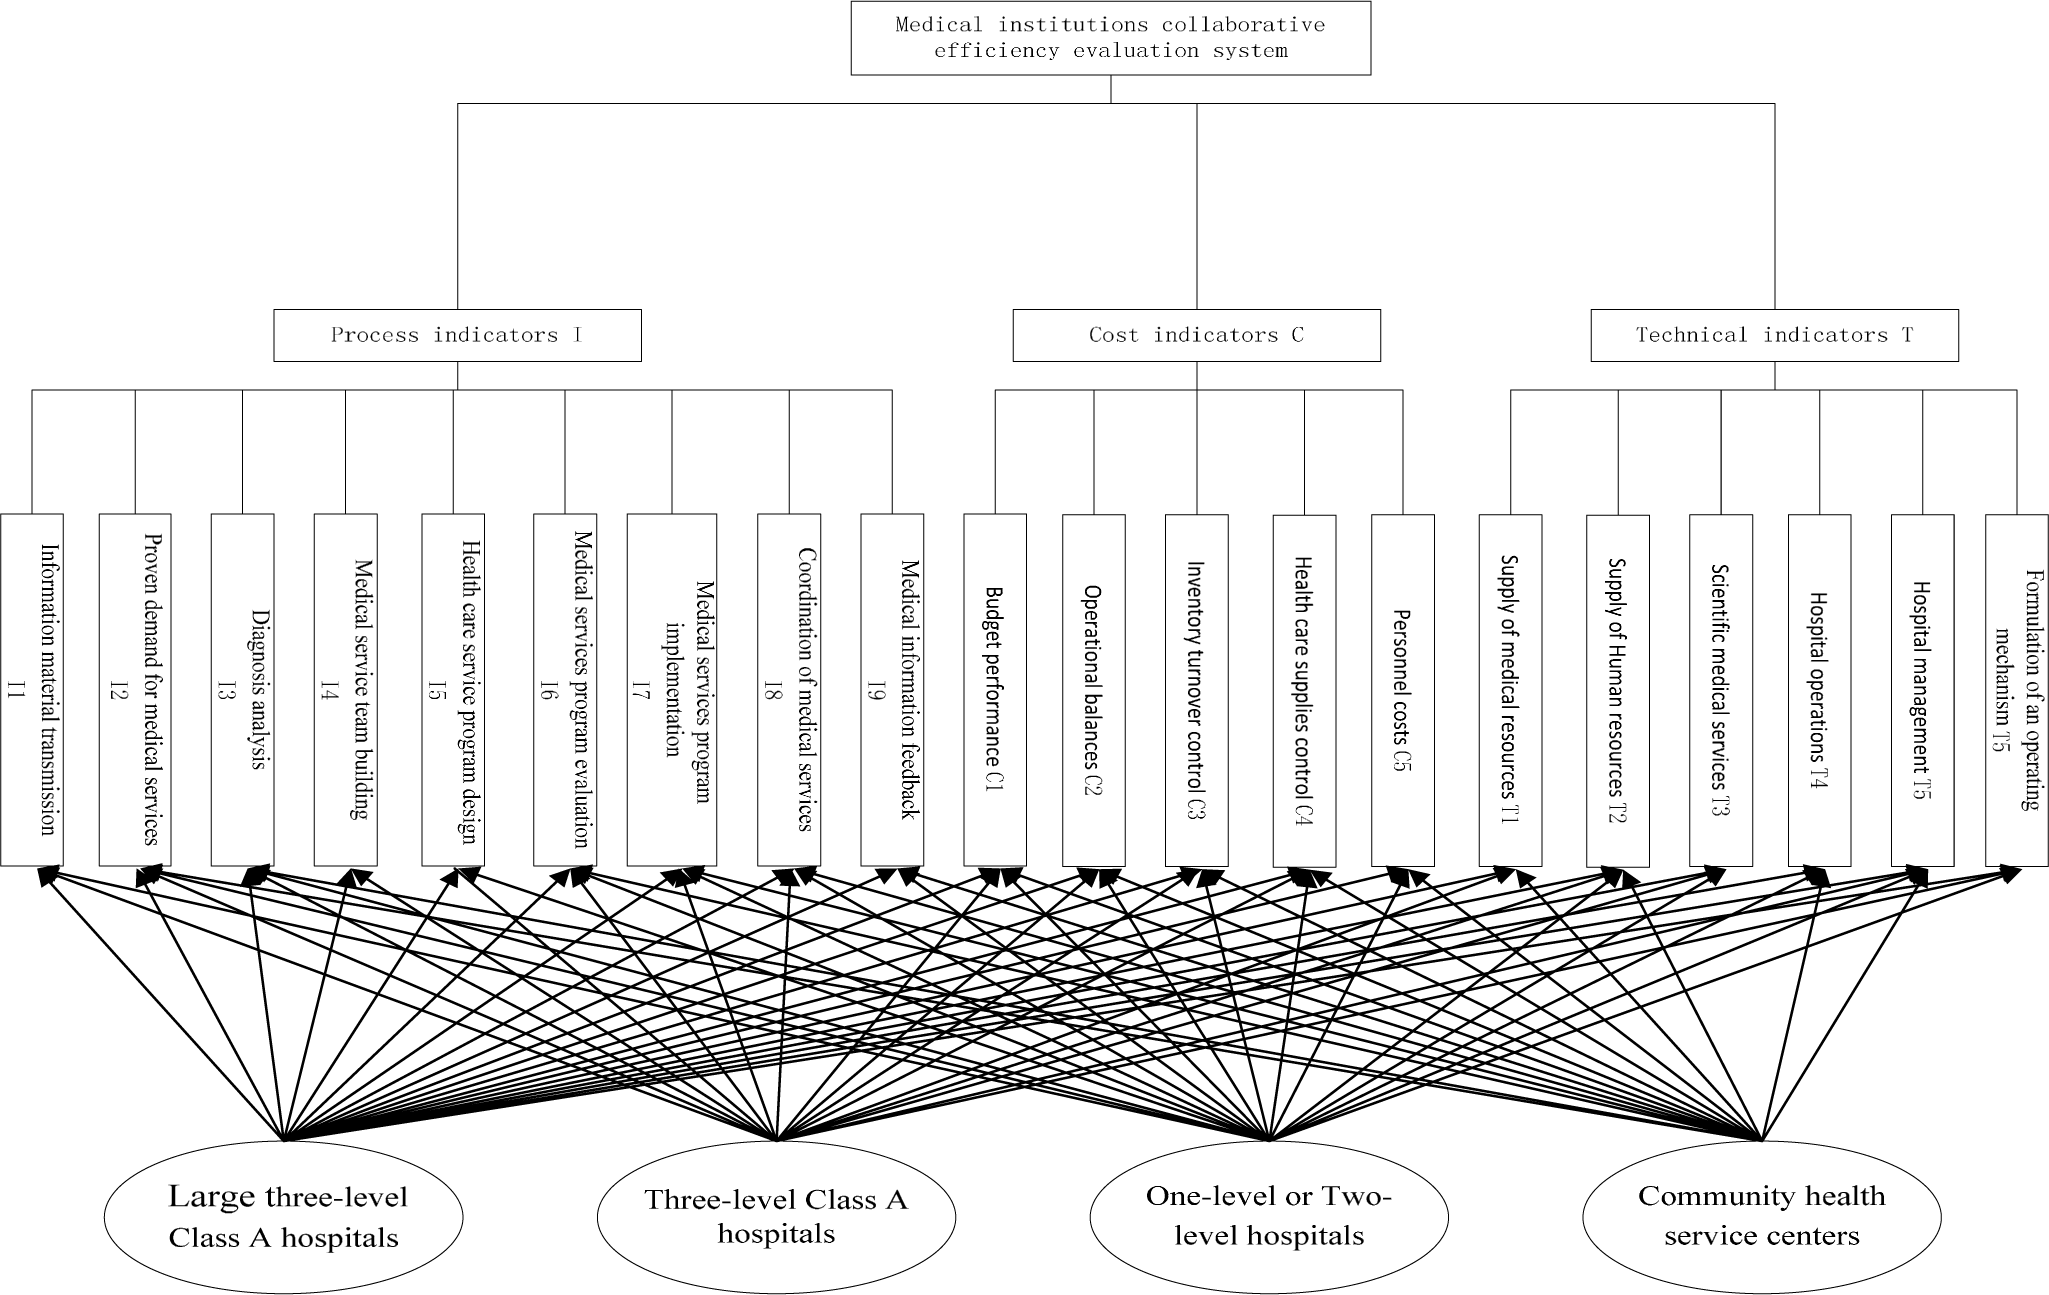
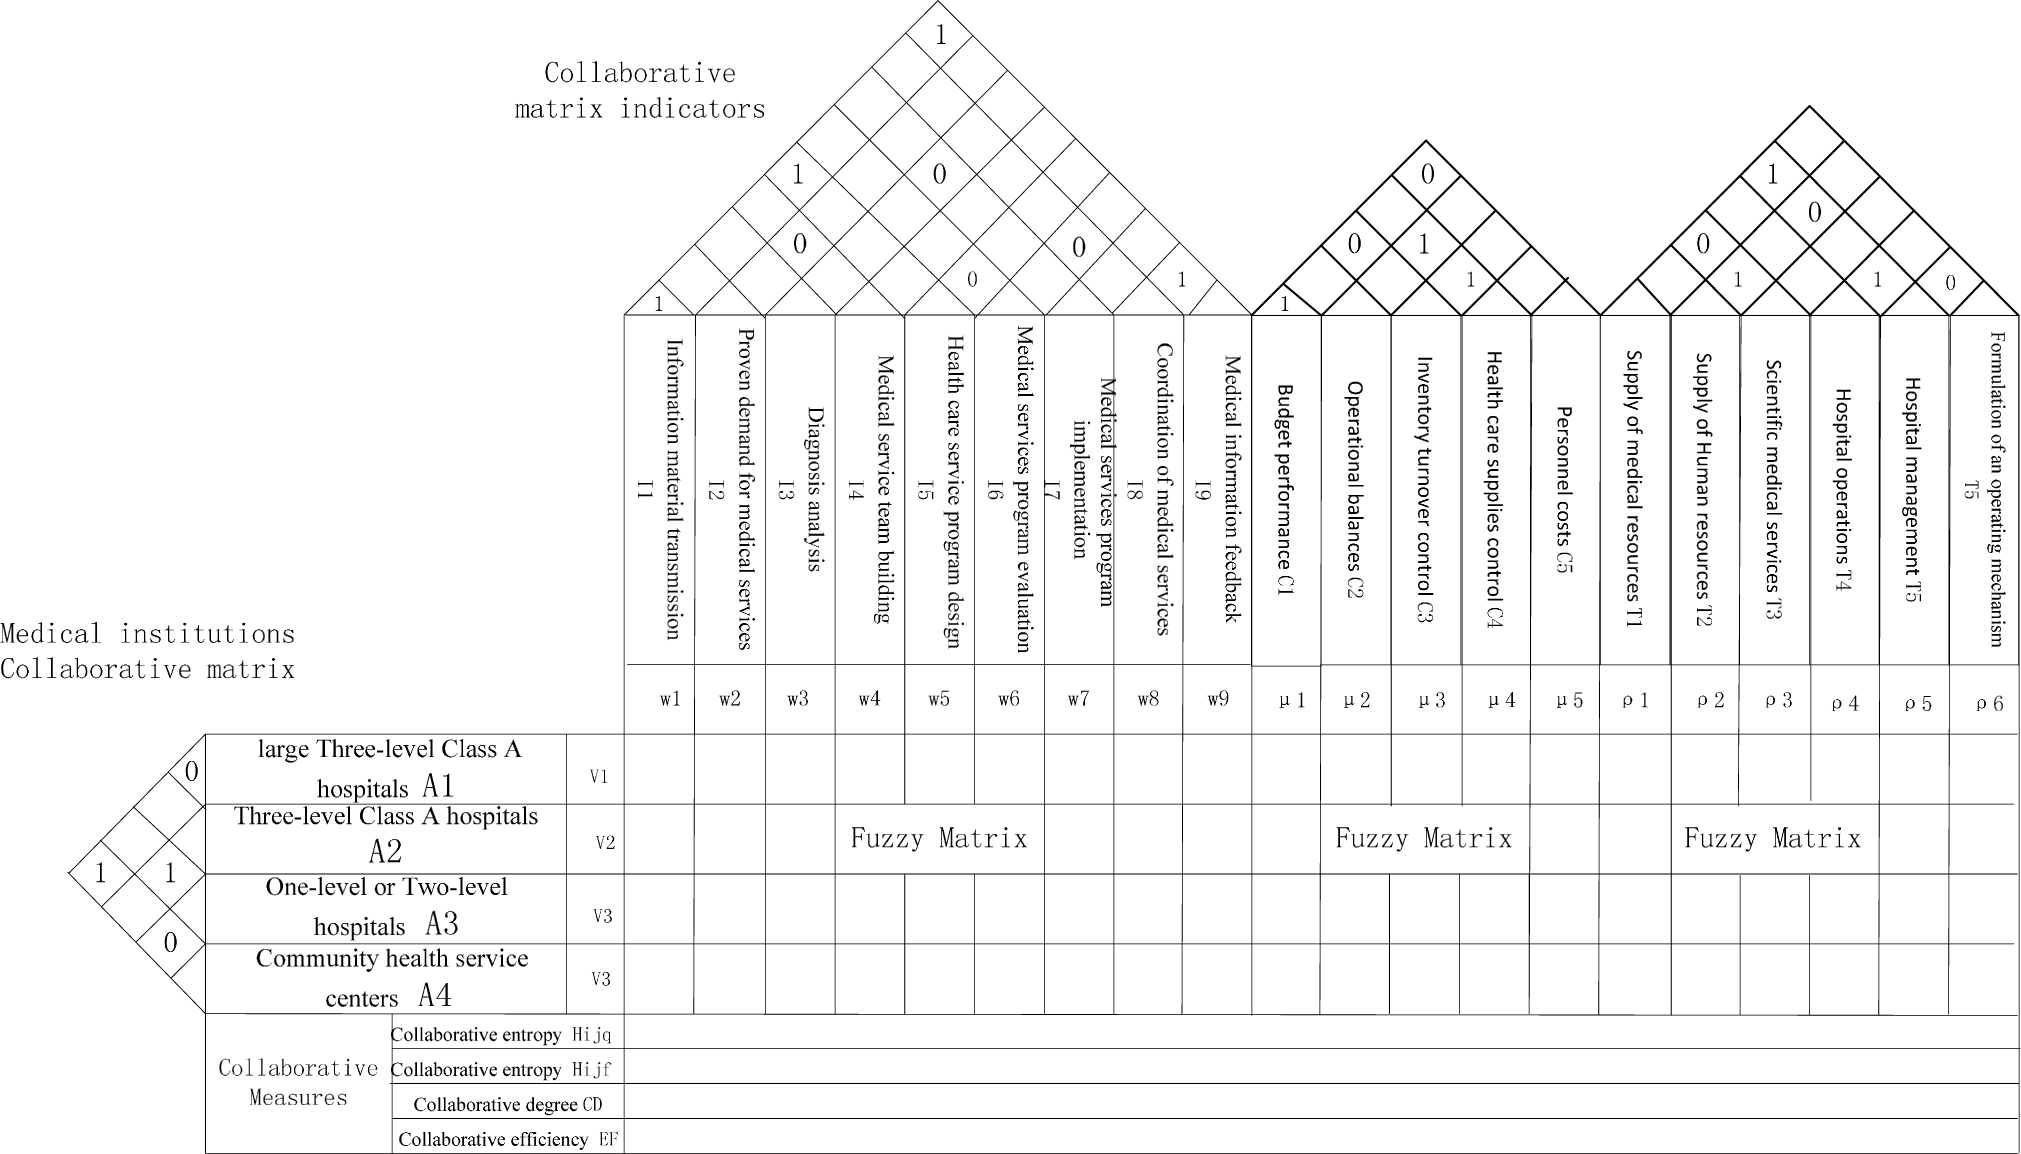
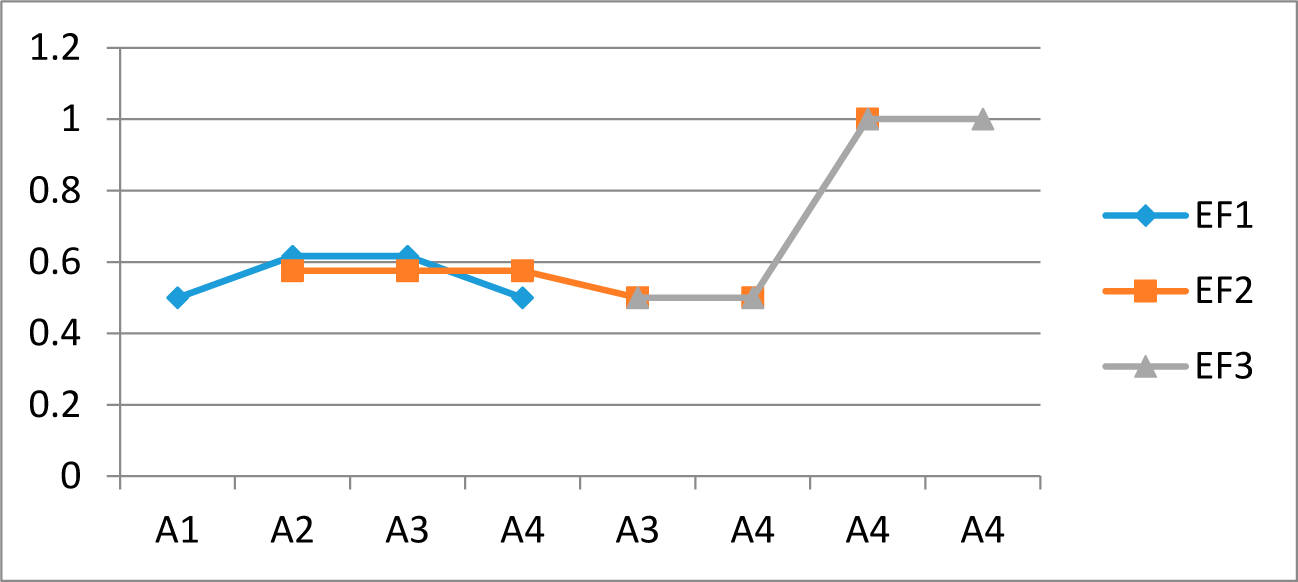
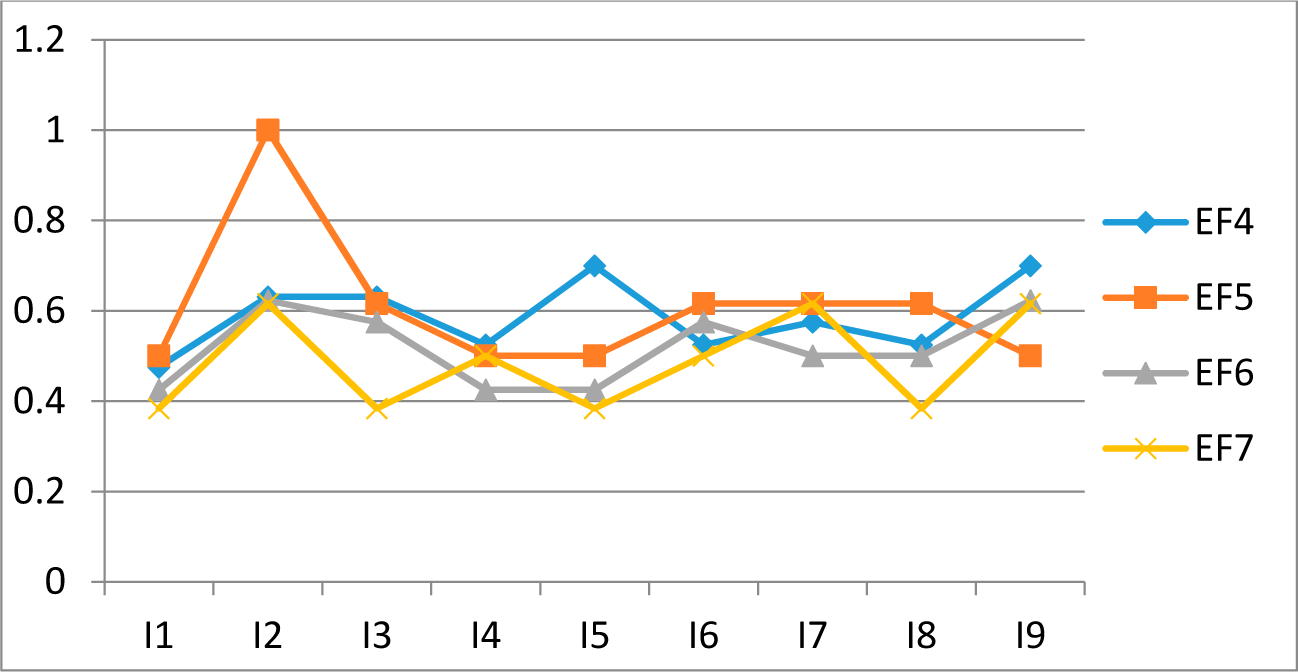
In Section 2, the paper establishes a structure of Multi-level medical institutions through on-the-spot investigation in medical institutions of Sichuan province. Furthermore, basic medical services and activities of medical institutions were analyzed, on this basis, the paper constructs the research framework of collaborative management research of multi-level medical institutions. In Section 3, this paper introduces the concept of Synergy Entropy and House of Quality, build a Synergy Entropy-House of Quality Measurement Model, and the specific steps and measure principle measure was introduced. Finally, through case analysis of a certain level of medical institutions in Sichuan province to verify the Synergy Entropy-House of Quality Measurement Model is scientific and effective.

2. Hospital Collaborative Management Analysis

2.1. Structural Analysis of Hospital Level

With the gradual reform of the national health care system in China, health care organizations have a hierarchal arrangement. However, due to differences in the technical skill of personnel and the service level in the different health care organization levels, there is a lack of information sharing resources and management coordination mechanisms. Therefore, an effective analysis of the information and resource sharing among medical institutions across all levels and the degree of organization and coordination is difficult. Medical institutions are classified across four grades; Large Three-level Class A hospitals, Three-level Class A hospitals, One-level or Two-level hospitals and Community health service centers. Based on multi-level medical organizations research, it has been found that the hospitals are both independent and interrelated, and lower-level medical institutions are often subject to controls and restraints from the higher-level medical institutions. Confronted with the contradictions between the demand for medical services and the limited medical resources, the state has deepened health system reform by initiating collaboration between the multi-level health care services. This allowed for the promotion of a longitudinal flow of medical resources by assisting Three-level Class A hospitals to play a leading regional medical role based on their professional and technical advantages, and to develop medical models for such elements as the medical grades, sub-acute and chronic treatments, and two-way referral medical models. Based on the research into the medical services, this paper has established a structural chart (Figure 1), an information resources flow diagram (Figure 2) and a two-way referral pattern for a multi-level town medical service (Figure 3) for the different medical institution levels, allowing for an examination of the information resource sharing and collaborative management status between these medical institutions to determine the extent of multi-level medical services collaboration and medical resources sharing.
As shown in Figure 2, high-level medical institutions offer information resources to lower-level medical institutions, and lower-level medical institutions send feedback to the higher-levels. There is an information feedback loop mechanism between the various medical institution levels, effectively promoting the sharing of medical resources, and the orderly convergence of medical services.
Figure 3 shows a two-way referral pattern for a multi-level town medical service. Its working mode assists high-level medical institutions play a central leading role in a more effective way through the establishment of a more comprehensive service model and a more ordered convergence of the health care system, which encompasses general medical care, rehabilitation, nursing requirements, and an achievement of a division of labor in medical institutions at all levels, thus promoting a more rational two-way flow of medical resources.

2.2. Hospital Collaborative Evaluation System Decomposition

This paper focuses on medical work process efficiency, cost efficiency and technical efficiency in reference to previous studies [9]. For medical process efficiency, the medical work involves an extensive range of medical needs for different patient problems, and medical institutions at all levels need to provide appropriate medical assistance through the establishment of appropriate programs. Research has found that although medical programs at all medical institution levels are affected by resources such as supplies and information, the main sharing was in information material transmission, medical service demand, diagnostic analysis, medical service team building, health care service program design, medical service program evaluation, medical services coordination and medical information feedback [10]. The hospital cost efficiency level is based on hospital financial data provided by the research objective. This paper determines an indicator system, which includes budget performance, operational balances, inventory turnover control, health care supply control and personnel costs, to measure the cost synergy efficiency of the hospitals [11,12]. At the hospital technical efficiency level, the evaluation indicators to allow for an examination of synergistic efficiency are; the supply of medical resources, the supply of human resources, the scientific medical services, hospital operations, hospital management, and the formulation of an operating mechanism [13,14]. From this information, we developed a medical institution, collaborative efficiency evaluation system component diagram as shown in Figure 4.
Figure 4 reflects the overall level of the coordinated medical service operations from material information delivery and proven demand to the provision of medical services. It can be seen that there are close interactive links between the various stages. Therefore, to tap the intrinsic relationships in the index and the relationships between the index and the various product design stages, this paper uses the concept of quality housing and entropy collaboration, to analyze the inherent synergy between the various medical institution levels and medical and management work stages, as shown in Figure 5.

3. Hospital Management Collaborative Efficiency Measurement Based on the Collaborative Entropy-House of Quality

3.1. Synergy Entropy-House of Quality Measurement Model

To appropriately evaluate the coordination between the different levels and services so as to assist all medical institutions coordinate their management and to provide them with a reference tool, a sophisticated system is needed. This paper used the synergy entropy section of the House of Quality Measurement Model, as it allows for an accurate detailed analysis of both the medical work and the coordination management performance [15,16]. The Synergy entropy-House of Quality Measurement Model is shown in Figure 6.
Entropy is able to provide an efficient information measurement [17,18] regarding the ordered degree of organization. In modern management systems, the internal and external environment is always changing, which results in an increase in information uncertainty. These uncertainties are able to be described using entropy. From dissipative theory, the value of entropy is in its ability to present information sequentially. The chaotic system degree is high when the entropy is high, and vice versa [1922]. In this study, entropy is used to measure the sequential degree between the organizations as the coordination process is considered to be similar to the system sequential degree. Therefore, the entropy principal can be used to simply measure the medical work coordination efficiency, with smaller entropy indicating a better management coordination system.
As shown in Figure 6, the Synergy Entropy-House of Quality Measurement Model is made up of a medical institutions coordination matrix, a indicators coordination matrix and a fuzzy matrix. Between the medical institutions coordination matrix and the medical work coordination matrix, a comparison matrix is also developed. In the fuzzy matrix, the medical institutions and medical work have differently weighted results because of the differences in emphasis. Therefore, a relationship matrix using triangular fuzzy functions is constructed to allow for a judgment on the relative importance of the medical work and to determine the coordination efficiency. Figure w j ( j = 1 , 2 , , 9 ) represents the importance weight in the medical process. μ j ( j = 1 , 2 , , 5 ) represents the importance weight in the cost control indicators. ρ j ( j = 1 , 2 , , 6 ) represents the importance weight in the technical support index indicators. v i ( i = 1 , 2 , , 4 ) represents the hierarchal medical institutions relative importance weight.
Although this paper’s measurements are based on field research data and the multi-level medical institutions’ management reporting data, the selection and quantification of the indicators remain problematic as they are often ill-defined and difficult to quantify. In this paper, the primary reason for the selection of a fuzzy model for the index data processing was that multi-level medical collaborative performance evaluations were found to have a certain ambiguity, so it was difficult to objectively define and quantify the indicators’ data completely. For instance, the classification of the indicators for proven demand for medical services and the medical services program evaluation were based on the subjective judgment of experts, thus were, to some extent, ambiguous. Secondly, using the fuzzy matrix has significant advantages when using the disposal index data, as it allows for a combination of the qualitative analysis with a quantitative index calculation, making it easy to use specific figures to indicate the differences between the various indices and all-levels of the medical institutions. Simultaneously, by calculating the index in the form of index weights to determine the importance of the evaluation system, the advantages of describing the system features quantitatively can be seen [2325].

3.2. Hospital Management Collaborative Entropy Measurement Based on the Collaborative Entropy-House of Quality

According to the entropy evaluation principle, the specific steps can be divided into two parts:

3.2.1. Medical Institutions and Medical Work Stages Importance Parameter Calculations

Medical institutions at all levels as well as the various stages of medical and management work have a discrepant importance parameter determined by the different degrees of information resource sharing and software and hardware support. Therefore, to determine an objective result, a triangular fuzzy matrix is used to calculate the weights for the medical institutions at all levels and the various medical work stages. The triangular fuzzy matrix is able to transform the uncertain factors into certain values and transform those factors that can be only be evaluated by natural language into quantitative indicators [2628]. In the modality, D s = [ d yj L , d yj M , d yj N ], d yj L represents a conservative evaluation of the y-th expert for the j-th index, while d yj M is the most likely value and d yj N is the most optimistic assessment value. According to the position of the experts in the group, the final score is calculated based on a synthetic scoring matrix. The Equation for this is:
D s ˜ = E × D s
P = ( d ˜ j L + 2 d ˜ j M + d ˜ j N ) / 4 , j = 1 , 2 n
In Equation (1), E is the weight vector for an expert, where Ds is the initial score matrix and D s ˜ is the implicit synthetic scoring matrix. In Equation (2), d ˜ j L, d ˜ j M, d ˜ j N are the conservative values, most likely values and the most optimistic evaluation values for the implicit synthetic evaluation scoring matrix, respectively, and P is the final evaluation score.
After the evaluation of medical institutions and medical work stages, vi, the medical institution weight vectors, and wj, the weight vectors for each stage of medical work, are obtained through calculations based on the entropy weight principle.

3.2.2. Hospital Management Collaborative Entropy Calculation

The systematic relationship and synergies between the medical institutions and the various medical and management work stages reflect the synergy between the internal interactions. A collaboration impact matrix is then established, which reflects the relationships between the various work stages and the medical institutions:
ϕ = [ λ 11 λ 12 λ 1 k λ 21 λ 22 λ 2 k λ s 1 λ s 2 λ sk ] nn
In the collaboration matrix:
λ sk = { 1 s and k is in the collaborative state 0 otherwise s k λ sk = { 1 elements in the lowest level 0 elements in other levels s = k
Assume that medical institution M i has established j work stages, so X ijq represents the fully collaborative state for the number of work stages j in medical institution M i; X ijf represents a non-collaborative state for the number of work stages j in medical institution M i; the total number of work stages is X ij = X ijq + X ijf. The equation for calculating the entropy for the collaborative multi-level hospital management is:
H ijq = X ijq X ij log X ijq X ij
The equation for the non- collaborative entropy multi-level hospital management is:
H ijf = X ijf X ij log X ijf X ij
Accordingly, CD, the level of collaboration for hospital management elements of the same level, can be determined:
CD = 1 H ijq maxH ijq
In Equation (6), maxH ijq indicates the largest collaborative entropy for the hospital management elements at the same level.
Collaborative efficiency can be expressed as:
EF = 1 H ijq H ijq + H ijf
The integrated collaborative entropy for the hospital management elements at all levels is:
B = μ i H ij
In Equation (8), μ i indicates the importance of each element in the hospital collaborative management.

4. Case Analysis

4.1. Hospital Management Parameter Calculation

Multi-level medical institutions in Chengdu, Sichuan were selected for the study in this paper. The hierarchical institutions were chosen according to the nature of work at all levels of medical institutions and included; Large Three-level Class A hospitals (A1), Three-level Class A hospitals (A2), One-level or Two-level hospitals (A3) and community health service centers (A4). This study divided the medical work into information material transfer (I1), demand for medical services (I2), diagnostic analyses (I3), , and feedback (I9), which are the nine medical service process stages, divided the cost work into budget performance(C1), , personnel costs(C5), which are the five medical cost control stages, and divided the technical work into medical The supply of resources (T1), , Formulation of an operating mechanism (T6), which are six technical support stages.
For the fuzzy trigonometric calculation principles, four experts were invited from four medical institution levels and the importance of the medical institution levels as well as the various medical and management work stages were scored. The four experts had over 10 years’ experience in health care and were from Large Three-level Class A hospitals, where they had been working in medical resource scheduling or hospital operations management for more than five years. They all had an in-depth understanding of the operations resource management of the hospital and have published many articles, which meant they had extensive experience to be able to develop the rating matrix evaluation score for multi-level hospital management. For the one-level or two-level hospitals and the community health service centers, two experts who had medical clinical work experience were asked to assist with the research, which meant that there was a certain objectivity for the development of the rating matrix for certain medical work in the medical centers. Because of the excessive calculations, the Large Three-level Class A hospitals were taken as examples and the scores calculated at various medical work stages. The 10-point benchmark results were as follows:
D 1 = [ [ 2 . 5 , 4 , 7 ] [ 4 , 6 , 6 . 5 ] [ 3 , 4 . 5 , 7 ] [ 6 , 7 . 5 , 8 ] [ 1 , 2 . 5 , 4 ] [ 6 , 7 , 8 ] [ 4 . 5 , 6 , 8 ] [ 2 . 5 , 7 , 8 ] [ 7 , 7 . 5 , 8 ] [ 3 , 4 . 5 , 5 . 5 ] [ 3 , 3 . 5 , 5 ] [ 2 , 3 , 4 ] [ 5 , 5 . 5 , 6 . 5 ] [ 3 , 3 . 5 , 4 . 5 ] [ 3 , 5 , 7 ] [ 3 , 5 , 6 ] [ 6 . 5 , 7 , 9 . 5 ] [ 4 , 5 , 6 ] [ 4 , 6 , 7 ] [ 2 . 5 , 3 . 5 , 4 . 5 ] [ 1 . 5 , 3 , 4 . 5 ] [ 6 , 7 , 8 . 5 ] [ 2 , 2 . 5 , 3 ] [ 2 . 5 , 4 . 5 , 5 ] [ 6 . 5 , 7 , 8 . 5 ] [ 5 . 5 , 6 , 7 ] [ 3 , 6 , 6 . 5 ] [ 3 . 5 , 4 . 5 , 5 ] [ 4 , 4 . 5 , 5 ] [ 1 , 2 , 3 ] [ 4 , 5 . 5 , 6 ] [ 4 , 5 , 6 ] [ 3 . 5 , 4 , 5 ] [ 4 . 5 , 5 , 7 ] [ 3 , 6 , 8 ] [ 4 , 6 , 8 ] ]
The importance proportion for each expert in the expert group based on a comprehensive survey of four experts in terms of age, professionalism and experience was determined for E = [ 0 . 25 0 . 3 0 . 15 0 . 3 ]. Then, a fuzzy synthetic matrix D 1 ˜ was obtained for the Large Three-level Class A hospitals (A1) in accordance with Equation (1):
D 1 ˜ = [ [ 3 . 2 , 4 . 5 , 6 ] [ 3 . 5 , 4 . 4 , 5 . 3 ] [ 1 . 9 , 3 . 2 , 4 . 5 ] [ 5 . 1 , 6 . 2 , 7 ] [ 2 . 7 , 3 . 6 , 4 . 6 ] [ 3 . 8 , 5 . 1 , 6 . 4 ] [ 4 . 4 , 5 . 6 , 7 . 2 ] [ 4 . 3 , 6 . 6 , 8 . 3 ] [ 4 . 3 , 6 . 1 , 7 . 2 ] ]
Equation (2) was calculated to obtain the Large Three-level Class A hospital (A1) scores for each work process stage:
P A 1 = [ 4 . 6 4 . 4 3 . 2 6 . 1 3 . 6 5 . 1 5 . 7 6 . 5 5 . 9 ]
The evaluation scores at the various medical process stages at the different medical institution levels A2, A3, A4 were sequentially obtained, as shown in Table 1, and the evaluation scores for the cost efficiency and technical efficiency indexes are as shown in Tables 2 and 3:
The weight vector for the work stages in the collaborative management process were obtained based on the entropy calculation method:
w j = [ 0 . 0680 0 . 0893 0 . 1417 0 . 1040 0 . 1227 0 . 0850 0 . 1177 0 . 1134 0 . 1582 ] μ j = [ 0 . 2028 0 . 1970 0 . 1207 0 . 2813 0 . 1982 ] ρ j = [ 0 . 1491 0 . 1724 0 . 1683 0 . 1273 0 . 2099 0 . 1730 ]
Similarly, a scoring matrix for the collaborative management in four medical institutions was determined based on the triangular fuzzy function and the entropy value empowerment principle, as shown in Table 4.
According to the medical institution layering in Figure 1 and the scores from the medical institutions in Table 4, this paper successively obtained scoring matrices for the second level and third level medical institutions (shown in Tables 5 and 6), and, based on entropy evaluation methods, this paper obtained a weight vector v i ( 1 ) for the first level medical institutions A 1 ( 1 ) A 4 ( 2 ), a weight vector v i ( 2 ) for the second level medical institutions A 12 ( 2 ), A 13 ( 2 ), A 14 ( 2 ), A 23 ( 2 ) , A 24 ( 2 ), A 34 ( 2 ) and a weight vector v i ( 3 ) for the second level medical institutions A 123 ( 3 ), A 124 ( 3 ), A 134 ( 3 ), A 234 ( 3 ):
v i ( 1 ) = [ 0 . 2590 0 . 2315 0 . 2731 0 . 2363 ] v i ( 2 ) = [ 0 . 1548 0 . 1921 0 . 1537 0 . 1921 0 . 1537 0 . 1537 ] v i ( 3 ) = [ 0 . 3053 0 . 2316 0 . 2316 0 . 2316 ]

4.2. Hospital Management Synergy Efficiency Evaluation

Data in this paper are derived from actual surveys of hospital operations and multi-level management reports. According to the synergistic relationship between medical institutions at all levels as well as between the various stages of medical work, this paper analyzed the synergistic relationship between the medical institutions at all levels and between the various medical work stages, and a synergies influence matrix was created between the organizations. ϕ ( 1 ) indicates the synergistic influence of the matrix between the first-level medical institutions (as shown in Figure 1); ϕ 1 ( 2 ) indicates the synergistic influence of the matrix between the second-level medical institutions and the Large Three-level Class A hospitals in the first level; ϕ 2 ( 2 ) indicates the synergistic influence of the matrix of the second-level medical institutions and the Three-level Class A hospitals in the first level; ϕ 1 ( 3 ) indicates the synergistic influence of the matrix between the third-level medical institutions and the Three-level Class A hospitals in the second level; and ϕ 4 indicates the synergistic influence of the matrix between the various medical work stages; ϕ 5is the synergistic influence matrix for the cost efficiency indexes, and ϕ 6is the synergistic influence matrix for the technical efficiency indexes. As there is only one community health service center on the fourth level, the synergies with the other medical institutions is considered to be 0, so this calculation is not included here. Based on research information from the medical institutions and medical work stages, the synergistic influence matrix was developed, as shown below:
ϕ ( 1 ) = [ 0 1 1 0 1 0 1 1 1 1 0 1 0 1 1 0 ] , ϕ 1 ( 2 ) = [ 0 1 1 1 0 1 1 1 0 ] , ϕ 2 ( 2 ) = [ 1 0 0 1 ] , ϕ 1 ( 3 ) = [ 1 0 0 1 ] ϕ 4 = [ 1 1 0 0 0 0 0 1 1 1 1 1 1 1 0 0 1 1 0 1 1 1 1 1 1 0 1 0 1 1 1 1 0 1 0 0 0 1 1 1 1 1 1 1 1 0 0 1 0 1 1 1 0 1 0 0 1 1 1 1 1 0 1 1 1 0 0 1 0 0 1 1 1 1 1 0 1 1 1 1 1 ] , ϕ 5 = [ 1 1 0 1 0 1 1 0 0 1 0 0 1 0 1 1 0 0 1 1 0 1 1 1 1 ] , ϕ 6 = [ 1 0 1 1 0 1 0 1 1 1 1 0 1 1 1 0 1 1 1 1 0 1 1 0 0 1 1 1 1 1 1 0 1 0 1 1 ]
The collaborative entropy, cooperative degree and collaborative efficiency were all separately calculated using Equations (4)(7). The relative weight vector for each hospital management element was obtained using a fuzzy trigonometric method, and the integrated collaborative entropy B for management elements at all levels was obtained using Equation (8), the results for which are shown in Table 7.
In Table 7, the collaborative entropy for B 1 was calculated using Equation (8) ( B = v i H ij), where vi represents the weight vector for the importance of the medical institutions at all levels; and Hij is the collaborative entropy for the medical institutions at different levels. Similarly, collaborative index tables for the medical institutions on the other levels were calculated, as shown in Tables 812.
After the calculations for the various medical work stage collaborative entropy and the medical institution collaborative efficiency calculations, a comprehensive study was conducted to assess the collaborative relationship between the medical institutions at all levels and the various medical work stages to determine the overall coordination for the medical management process performance. Depending on the specific medical work at the medical institutions, a collaborative influence matrix was built. ξ 1 ( y ) = ( I j , A i ( y ) ) j × i was the collaborative influence matrix for the specific medical work at the y-level medical institutions ξ 2 ( y ) = ( C j , A i ( y ) ) j × i was the collaborative influence matrix for the specific cost control at the y-level medical institutions; ξ 3 ( y ) = ( T j , A i ( y ) ) j × i was the collaborative influence matrix for the specific technical support at the y-level medical institutions, the results for which are shown below:
ξ 1 ( 1 ) = [ 1 1 0 0 1 1 1 1 1 1 1 0 1 0 1 0 1 1 0 0 1 1 0 1 1 0 1 1 1 1 0 0 1 1 1 1 ] , ξ 1 ( 2 ) = [ 1 0 0 0 1 0 1 1 1 1 1 0 1 1 0 0 1 1 0 1 0 0 0 1 1 0 0 0 0 1 1 0 1 1 1 0 0 1 1 1 0 0 1 0 0 0 1 1 1 1 1 1 0 1 ] , ξ 1 ( 3 ) = [ 0 0 1 0 1 1 0 1 1 0 0 0 1 0 1 0 0 0 1 0 0 1 0 1 1 1 1 0 0 0 1 0 1 1 0 1 ] ξ 2 ( 1 ) = [ 1 1 0 0 1 1 1 1 1 1 0 1 1 1 1 1 1 0 0 1 ] , ξ 2 ( 2 ) = [ 1 0 0 0 0 1 1 1 1 1 1 0 1 0 1 0 1 0 1 1 1 1 1 1 0 0 1 0 1 1 ] . ξ 2 ( 3 ) = [ 1 1 1 0 0 1 1 0 0 1 0 1 0 1 0 1 1 0 0 0 ] ξ 3 ( 1 ) = [ 1 1 0 0 1 1 1 1 1 1 1 1 1 1 0 1 1 1 0 0 1 1 1 0 ] , ξ 3 ( 2 ) = [ 1 1 0 0 1 0 0 1 1 0 0 1 1 0 1 1 1 1 0 1 0 1 1 1 1 1 1 1 0 0 1 0 0 1 1 0 ] , ξ 3 ( 3 ) = [ 0 1 1 0 0 1 0 1 1 0 0 1 1 1 1 0 0 0 1 0 1 1 0 0 ]
In the matrix, “1” represents the direct or indirect medical work stages that the medical institutions were involved in and “0” represents the direct or indirect specific medical work stages that the medical institutions were not involved in.
The weight vectors for the various medical stages were already known:
w j = [ 0 . 0680 0 . 0893 0 . 1417 0 . 1040 0 . 1227 0 . 0850 0 . 1177 0 . 1134 0 . 1582 ]
The collaborative relationships between certain medical stages at the medical institutions at all levels were then calculated using Equations (4)(8), as shown in Table 13.
In a similar way, the cost collaborative efficiency index and the technical collaborative efficiency index for the medical institutions at all levels were obtained, as shown in Tables 14 and 15:

4.3. Result Analysis

From the calculation results in Tables 715, a comparison chart for the integration of the collaborative degree and collaborative efficiency was built as shown in Table 16:
As can be seen in Table 16, from the perspective of the collaborative EF efficiency, the synergy index between the different level hospitals, the synergy index between the medical work and the overall collaborative efficiency between the hospitals and the medical work all range from 40%–60%. This indicates that the comprehensive collaborative efficiency is at a middle level, with a maximum synergistic efficiency being 100%, so the collaborative management between the various management elements still has room for improvement. Therefore, the hospitals need to implement the necessary measures to improve the management between the various elements and to improve hospital management performance coordination. The collaborative efficiencies between the medical institutions and the medical costs and the medical technical work ranged from 50%–90%, indicating that the medical institutions had a superior level of cost control and technical support. From the point of view of overall CD coordination, the degree of coordination between hospitals was B1 < B2 < B3, the lower the level of the medical institution, the greater the degree of coordination, which is largely because of the limited resource information lower-level medical institutions have access to. Therefore, the low-level medical institutions turn to the high-level institutions for medical resources, which indicates that there was frequent contact between the lower-level medical institutions, increasing the degree of coordination. The collaborative degree between the medical institutions and the medical work was B5 > B6 > B7, The collaborative degree between the medical institutions and the medical costs was B10 > B11 > B12, and the collaborative degree between the medical institutions and the medical technical work was B13 > B14 > B15, which was closely related to the management level of the hierarchal medical institutions, so the higher the level of medical institution, the higher the level of management, the more perfect the facilities, the stronger the medical work planning, and the higher the synergy between the hospitals and the medical work stages. On the contrary, the lower the level of medical institution, the weaker the planned medical work stages, and the lower the collaborative performance between the hospitals and the medical work. The collaborative computation results for the medical institution levels and the various medical work stages were further broken down to obtain Figures 710:
In Figure 7, the collaborative efficiency of the first-level medical institutions (EF1) did not fluctuate greatly, with the range being only from 0.50 to 0.62, indicating that the difference between the medical institutions was not large. However, when it comes to the second-level (EF2) and third-level (EF3), the collaborative efficiency between the community health service centers and the second-level institutions as well as the third-level medical institutions was large because of the influence of the lack of information and resources. Based on a comparison of EF1, EF2 and EF3, however, it can be concluded that the low level medical institutions had a higher collaborative efficiency than the high level medical institutions.
In Figure 8, generally speaking, the curve for the medical work internal collaborative efficiency had a small fluctuation, and the collaborative efficiency of the different work stages was good, indicating that the medical institutions had good planning and the convergence of the various medical work stages was close. However, it can be seen from the collaborative efficiency curve for the medical institutions and the medical work, high level medical institutions has a better performance than those at the lower level in terms of work interoperability, which is further indicated by the small curve fluctuation (EF5>EF6>EF7).
As can be observed visually in Figures 9 and 10, the medical institutions at the high level have higher collaborative efficiencies for cost control (EF10 > EF11 > EF12) and technical support (EF13 > EF14 > EF15) than medical institutions at the low level, which can also be seen in the comprehensive collaborative efficiencies.
Based on the specific analysis of the synergy efficiencies at all medical institution and medical work levels (Table 13 and Figure 8), the factors that influence these synergy efficiencies at all medical institution levels can be elucidated; focused information materials transfer I1, building of health care teams I4, medical service program assessments I5, collaborative medical care I8 and other aspects. Those collaborative efficiency indicators with a low value indicate that there are some problems in the effectiveness of the delivery of materials, the timeliness of patient medical referrals and treatment and services interoperability, and that these are the key issues affecting the cooperative performance at medical institutions. This indicates that this research into the medical institutions still has room for further improvement. When it comes to the medical institutions and the medical cost work collaborative efficiency (Table 14 and Figure 9), inventory turnover control C3 and personals costs C5 were found to be weak compared to other work, and that the key indicators needed to enhance the collaborative efficiency of medical institutions are the mobilizing of supplies and a reduction in personnel turnover. The hospital management indicator T5 was found to be the key indicator affecting the collaborative efficiency of medical institutions and medical technical work (Table 15 and Figure 10), which suggests that the management hierarchy between the medical institutions still needs to be strengthened. To solve the above problems, the recommendations for enhancing the collaborative performance of medical institutions are as follows:
  • Develop a reasonable communication and coordination mechanism. As the primary agents for the hospital management development, the Large Three-level Class A hospitals should play a central and leading role in the establishment of a reasonable hospital management internal communication mechanism, improve patient referral work, ensure adequate and regular communication between all levels of medical institutions, and achieve a two-way referral mode for patients from all medical institution levels.
  • Develop an effective mechanism for information sharing. To establish adequate service concepts for inter-agency hospital management and information sharing mechanisms to strengthen collaboration within the different agency operations and achieve health care resource sharing, an information sharing resource platform needs to be developed to facilitate a two-way flow of resources with information oriented towards patient demands.
  • Improve the existing health care protection mechanism. To reduce the time lost in the patient referral process, a medical services team which has efficient coordination and effective health care programs needs to be developed to ensure the timely and effective treatment of patients, to improve the synergy between the operational performances of the medical institutions, and to improve the medical service support mechanisms.

5. Conclusions

It is vital to constantly improve hospital management and improve coordination to improve the provision of medical services, and to promote a rational flow of medical resources. In this paper, a Synergy Entropy and House of Quality analysis model was established based on collaborative entropy, which was used in the comprehensive analysis of the collaborative relationship between the different medical institution levels and various medical work stages. This allowed for the inherent synergies between the various elements of hospital management to be illuminated, the collaborative hospital management performance to be evaluated, and the circulation of medical resources to be promoted. From this analysis the following conclusions were made:
  • Using the concept of quality house and collaborative entropy principles, this paper transformed the qualitative analysis regarding hospital synergy performance management elements to quantitative calculations and established a quality house evaluation model for hospital management, providing a new method for the evaluation and optimization of hospital management collaborative performance.
  • Using the collaborative calculation principle from the House of Quality analysis model, this paper evaluated hospital management effectively, rationally analyzed the synergies between the multi-level medical institutions and the medical work and also more efficiently reflected the hospital management synergy between the various elements using a cooperative and collaborative degree concept.
  • The analyses for the overall coordination degree and collaboration efficiency of each hospital management element was consistent with the detailed analysis of the results between the various elements, indicating that the quality of the housing cooperative evaluation model evaluation results had a better consistency, but also reflected the higher effectiveness of the collaborative entropy principle compared to traditional qualitative analysis, thereby providing a more persuasive evaluation for the performance of hospital management collaborative research.
In this paper, the synergy entropy and House of Quality principle was used to investigate hospital management collaborative performance. This paper transformed traditional qualitative analysis into quantitative values, and compared the importance parameters for all medical institution levels and medical work stages with the entropy results, allowing for an improved calculation of the overall coordination and synergistic efficiency of the various elements. The use of the triangular fuzzy function reduced the subjective influence of the evaluation process to some extent. However, some subjectivity still exists, so the evaluation process still has room for improvement. Therefore, further improvement in the accuracy of hospital collaboration performance evaluation and the development of a stronger synergy entropy and House of Quality analysis model are key directions for the future.

Acknowledgments

This research is funded by the National Nature Science Foundation of China (71131006, 71401019), Postdoctoral Science Special Foundation of Sichuan Province and the Fundamental Research Funds for the Central Universities (skzx2013-dz07, skqy201223), Foundation of Research Center for Systems Science & Enterprise Development (Xq14C03).

Author Contributions

The study was designed by Lei Chen in collaboration with all co-authors. Data was collected by Xuedong Liang and Lei Chen. The first and final drafts were written by Lei Chen and Xuedong Liang. The draft questions were critiqued by Xuedong Liang and Tao Li. The results were analyzed by Lei Chen and Xuedong Liang. The project and key elements of the research were reviewed by Xuedong Liang. The writing work of corresponding parts and the major revisions of this paper were completed by Lei Chen and Tao Li. All authors have read and approved the final manuscript.

Conflicts of Interest

The authors declare no conflict of interest.

References

  1. Tsumoto, S.; Hirano, S. Hospital management based on data mining. Proceedings of the 8th International Conference on Intelligent Systems Design and Applications (ISDA 2008), Kaohsiung, Taiwan, 26–28 November 2008; pp. 257–262.
  2. Rozenblum, R.; Lisby, M.; Hockey, P.M.; Levtzion-Korach, O.; Salzberg, C.A.; Efrati, N.; Lipsitz, S.; Bates, D.W. The patient satisfaction chasm: The gap between hospital management and frontline clinicians. BMJ Qual. Saf. 2012, 22, 242–250. [Google Scholar]
  3. Chiu, C.-Y.; Shih, P.-C.; Kuo, I-T.; Ke, C.-H. RFID reader network optimization for hospital management. Proceedings of the 2014 IEEE 18th International Conference on Computer Supported Cooperative Work in Design (CSCWD), Hsinchu, Taiwan, 21–23 May 2014; pp. 603–608.
  4. Hagtvedt, R.; Ferguson, M.; Griffin, P.; Jones, G.T.; Keskinocak, P. Cooperative strategies to reduce ambulance diversion. Austin, TX, USA; IEEE: Piscataway, NY, USA; pp. 1861–1874.
  5. Tan, T.; Chen, C.; Li, X.; Yi, W.; Liao, S. Practice and Exploration of hospital management concept innovation. Chin. Hosp. Manag. 2009, 3, 38–39. [Google Scholar]
  6. Kapucu, N.; Arslan, T.; Demiroz, F. Collaborative emergency management and national emergency management network. Disaster Prev. Manag. 2010, 19, 452–468. [Google Scholar]
  7. Feng, J.; Zhang, Z. Collaborative Management of multiple projects. Chin. High-Tech Enterp. 2009, 1, 167–169. [Google Scholar]
  8. Comfort, L.K.; Ko, K.; Zagorecki, A. Coordination in Rapidly Evolving Disaster Response Systems: The Role of Information. Am. Behav. Sci. 2004, 48, 295–313. [Google Scholar]
  9. Wan, T.T.H. Evidence-Based Health Care Management: Multivariate Modeling Approaches, 1st ed; Springer America: New York, NY, USA, 2006; pp. 187–202. [Google Scholar]
  10. Liu, Z.L.; Li, X.Y.; Li, J.H. Optimization the hospital process by hospital information system LU Fusheng. Chin. Hosp. 2006, 6, 35–36, In Chinese. [Google Scholar]
  11. Tang, M.; Dong, J.; Hu, Dan. Study of cost control and management of public hospital. Mod. Hosp. Sep. 2012, 12, 124–126. [Google Scholar]
  12. Zhao, X.; Li, H.; Ai, S.; Wen, J.; Zhao, F. Current status in research for hospital cost control in abroad. Chongqing Med. 2009, 1, 6–7, In Chinese. [Google Scholar]
  13. Tang, X.; Liao, J.; Zhong, R.-B.; Zhang, J.; Quan, T.; Zhang, J.-Y.; Han, L.; Cao, Q. Technical efficiency and its influencing factors of public hospitals in Sichuan province based on DEA-Tobit two-step method. J. Pract. Clin. Hosp. 2010, 6, 101–104, In Chinese. [Google Scholar]
  14. Tang, X.; Pan, X.P.; Liao, J.; Kuang, J.Q.; Quan, T.; Zhong, R.B.; Zhang, J. Study on Influencing Factors of Technical Efficiency in Public Hospitals. Chin. Health Econ. 2011, 30, 56–57. [Google Scholar]
  15. Mu, R.; Zhang, J.T.; Wang, Z.B. Design requirements weight calculation method based on hierarchical house of quality. Comput. Integr. Manuf. Syst. 2008, 6, 1189–1193. [Google Scholar]
  16. Li, Y.L.; Tang, J.F.; Yao, J.M.; Xu, J. House of Quality Construction Progress. Mech. Eng. 2009, 3, 57–70. [Google Scholar]
  17. Jiang, D.F.; Xiong, L.; Yue, Y. Evaluation model based on collaborative entropy. Comput. Integr. Manuf. Syst. 2012, 11, 2522–2529. [Google Scholar]
  18. Shannon, C.E. A mathematical theory of communication. Bell Syst. Tech. J. 1948, 27, 379–423. [Google Scholar]
  19. Zhang, X.W. What is the Entropy? Entropy and Interdisciplinary Science; Meteorological Press: Beijing, China, 1988. [Google Scholar]
  20. Zhang, T.N.; Cheng, B.Y.; Zhang, Y.J. Brusselator model research of enterprise management entropy based on dissipative structures. Manag. Technol. 2010, 3, 103–108. [Google Scholar]
  21. Guo, W.G. Enterprise Incentive Mechanism based on Management entropy and Management theory of dissipative structures. Enterp. Econ. 2009, 2, 62–65. [Google Scholar]
  22. Kostic, M.M. The Elusive Nature of Entropy and Its Physical Meaning. Entropy 2014, 16, 953–967. [Google Scholar]
  23. Zhao, Z.Q.; Ma, S.Q.; Lei, Y.L. Fuzzy Matrix Fuzzy Measure and Its Integral. J. Hainan Norm. Univ. (Natl. Sci.) 2014, 27. [Google Scholar]
  24. Xu, K.-L.; Wang, Y.-J.; Chen, B.-Z. Multi-Objective Fuzzy Assessment Models and Calculate Method of Assessment Grade. J. Northeast. Univ. (Natl. Sci.) 2001, 22, 568–571, In Chinese. [Google Scholar]
  25. Li, S.F.; Yang, N.D.; Liu, X.G. Complexity Fuzzy Evaluation of NPD Projects Based on Entropy and Evidence theory. J. Ind. Eng. Eng. Manag. 2013, 27. [Google Scholar]
  26. Gao, B.H.; He, W.W.; Zheng, L. Fuzzy comprehensive evaluation of green degree triangular fuzzy function based on a combination of weight. Logist. Technol. 2012, 13. [Google Scholar]
  27. Wang, X. Triangular fuzzy function method of Multiple Attribute Decision Making. J. Liaoning Tech. Univ. (Natl. Sci.) 2010, 5, 850–853, In Chinese. [Google Scholar]
  28. Qin, J.Y.; Meng, F.Y.; Zeng, X.L. A new method of Triangular fuzzy number Multiple Attribute Decision Making. Proceedings of the 26th Chinese Control Conference, Zhangjiajie, Hunan, China, July 26–31 2007; IEEE: Piscataway, NY, USA; pp. 408–411.
Figure 1. Structure of multi-level medical institutions.
Entropy 17 02409f1
Figure 2. Information resources flow diagram.
Entropy 17 02409f2
Figure 3. Two-way referral pattern for multi-level medical service.
Entropy 17 02409f3
Figure 4. Structure of collaborative efficiency evaluation system.
Entropy 17 02409f4
Figure 5. Medical Institutions and collaborative indexes.
Entropy 17 02409f5
Figure 6. Synergy Entropy-House of Quality Measurement Model.
Entropy 17 02409f6
Figure 7. Medical Institutions Internal Collaborative Efficiency Diagram.
Entropy 17 02409f7
Figure 8. Medical Institutions and Process Collaboration Diagram.
Entropy 17 02409f8
Figure 9. Medical Institutions and Cost Control Collaboration Diagram.
Entropy 17 02409f9
Figure 10. Medical Institutions and Technical Support Collaboration Diagram.
Entropy 17 02409f10
Table 1. Score Matrix at the Various Stages of Medical Process.
I1I2I3I4I5I6I7I8I9
Expert 14.64.43.26.13.65.15.76.55.9
Expert 23.43.84.75.12.64.63.74.33.5
Expert 34.26.53.14.86.33.44.75.27.8
Expert 41.62.27.43.75.12.84.73.96.4
Table 2. Score Matrix at the Various Stages of Medical Cost Control.
C1C2C3C4C5
Expert 14.34.72.26.64.6
Expert 23.75.83.75.74.6
Expert 34.43.53.64.84.3
Expert 44.63.22.45.73.7
Table 3. Score Matrix at the Various Stages of Medical Technical Support.
T1T2T3T4T5T6
Expert 15.66.44.43.15.64.5
Expert 24.75.23.22.74.63.9
Expert 32.83.55.13.26.34.4
Expert 43.84.25.45.75.76.8
Table 4. Scoring Matrix of the First-Level Medical Institution.
A 1 ( 1 ) A 2 ( 2 ) A 3 ( 3 ) A 4 ( 4 )
Expert 16.65.44.26.1
Expert 25.43.85.74.7
Expert 34.25.54.15.3
Expert 44.64.26.43.7
Table 5. Scoring Matrix of the Second-level Medical Institutions.
A 12 ( 2 ) A 13 ( 2 ) A 14 ( 2 ) A 23 ( 2 ) A 24 ( 2 ) A 34 ( 2 )
Expert 15.44.26.14.26.16.1
Expert 23.85.74.75.74.74.7
Expert 35.54.15.34.15.35.3
Expert 44.26.43.76.43.73.7
Table 6. Scoring Matrix of the Third-Level Medical Institution.
A 123 ( 3 ) A 124 ( 3 ) A 134 ( 3 ) A 234 ( 3 )
Expert 14.26.16.16.1
Expert 25.74.74.74.7
Expert 34.15.35.35.3
Expert 46.43.73.73.7
Table 7. Collaborative Index of the First-level Medical Institutions.
A 1 ( 1 ) A 2 ( 1 ) A 3 ( 1 ) A 4 ( 1 )B1
collaborative entropy Hijq0.15050.09370.09370.15050.1218
collaborative entropy Hijf0.15050.15050.15050.15050.1505
collaborative degree CD100.37740.377400.1097
collaborative efficiency EF10.50000.61630.61630.50000.5527
Table 8. Collaborative Index of the Second-level Medical Institutions.
A 12 ( 2 ) A 13 ( 2 ) A 14 ( 2 ) A 23 ( 2 ) A 24 ( 2 ) A 34 ( 2 )B2
collaborative entropy Hijq0.11740.11740.11740.15050.150500.1108
collaborative entropy Hijf0.15900.15900.15900.15050.150500.1316
collaborative degree CD20.21990.21990.21990010.2638
collaborative efficiency EF20.57530.57530.57530.50000.500010.5429
Table 9. Collaborative Index of the Third-level Medical Institutions.
A 123 ( 3 ) A 124 ( 3 ) A 134 ( 3 ) A 234 ( 3 )B3
collaborative entropy Hijq0.15050.1505000.0808
collaborative entropy Hijf0.15050.1505000.0808
collaborative degree CD300110.4631
collaborative efficiency EF30.50000.5000110.5000
Table 10. Collaborative Index of Process of Medical Work.
I1I2I3I4I5I6I7I8I9B4
collaborative entropy Hijq0.15650.08490.08490.14180.04550.14180.11740.14180.04550.0997
collaborative entropy Hijf0.14180.14520.14520.15650.10600.15650.15900.15650.10600.1390
collaborative degree CD400.45750.45750.09390.70930.09390.24980.09390.70930.3029
collaborative efficiency EF40.47540.63100.63100.52460.69970.52460.57530.52460.69970.5823
Table 11. Collaborative Index of Cost Control.
C1C2C3C4C5B5
collaborative entropy Hijq0.13310.13310.15920.13310.07750.1252
collaborative entropy Hijf0.15920.15920.13310.15920.13980.1552
collaborative degree CD50.16400.164000.16400.51320.2136
collaborative efficiency EF50.54460.54460.45540.54460.64340.5535
Table 12. Collaborative Index of Technical Support.
T1T2T3T4T5T6B6
collaborative entropy Hijq0.11740.11740.06600.11740.06600.11740.098
collaborative entropy Hijf0.15900.15900.12970.15900.12970.15900.1479
collaborative degree CD6000.437800.437800.1562
collaborative efficiency EF60.57530.57530.66270.57530.62270.57530.6015
Table 13. Collaborative Index for the Multi-level Medical Institutions and the Various Medical Process Stages.
Hospital LevelI1I2I3I4I5I6I7I8I9B7
L1Hijq0.150500.09370.15050.15050.09370.09370.150500.0937
Hijf0.150500.15050.15050.15050.15050.15050.150500.1133
CD7010.3774000.37740.3774010.3774
EF70.500010.61630.50000.50000.61630.61630.500010.5473

Hospital LevelI1I2I3I4I5I6I7I8I9B8

L2Hijq0.15900.06600.11740.15900.15900.11740.15050.15050.06600.1246
Hijf0.11740.12970.15900.11740.11740.15900.15050.15050.12970.1375
CD800.58490.2616000.26160.05350.05350.58490.2164
EF80.42470.66270.57530.42470.42470.57530.50000.50000.66270.5246

I1I2I3I4I5I6I7I8I9B9

L3Hijq0.15050.09370.15050.15050.15050.15050.09370.15050.09370.1298
Hijf0.09370.15050.09370.15050.09370.15050.15050.09370.15050.1252
CD900.377400000.377400.37740.1375
EF90.38370.61630.38370.50000.38370.50000.61630.38370.61630.4910
Table 14. Collaborative Index for the Multi-level Medical Institutions and Various Cost Control Stages.
Hospital LevelC1C2C3C4C5B10
L1Hijq0.150500.093700.15050.0717
Hijf0.150510.150510.15050.5568
CD10010.2772100.5236
EF100.500010.616310.50000.8859

C1C2C3C4C5B11

L2Hijq0.15900.06600.150500.15050.0932
Hijf0.11740.12970.150510.15050.3787
CD1200.58490.053510.05350.4138
EF110.42470.66270.500010.50000.8025

C1C2C3C4C5B12

L3Hijq0.09370.15050.15050.15050.15050.1390
Hijf0.15050.15050.15050.15050.09370.1392
CD120.377400000.0754
EF120.61630.50000.50000.50000.38370.5003
Table 15. Collaborative Index for the Multi-level Medical Institutions and Various Technical Support Stages.
Hospital LevelT1T2T3T4T5T6B13
L1Hijq0.1505000.09370.15050.09370.0822
Hijf0.1505110.15050.15050.15050.4399
CD130110.377410.37740.4538
EF130.5000110.61630.50000.61630.8426

Hospital LevelT1T2T3T4T5T6B14

L2Hijq0.15050.15050.06600.11740.11740.11740.1194
Hijf0.15050.15050.12970.15900.15900.15900.1513
CD14000.56150.21990.21990.21990.2066
EF140.50000.50000.66270.57520.57520.57520.5589

T1T2T3T4T5T6B15

L3Hijq0.15050.15050.15050.09370.15050.15050.1433
Hijf0.15050.15050.15050.15050.09370.15050.1386
CD140000.2199000.0478
EF140.50000.50000.50000.61630.38370.50000.4917
Table 16. Comparison Chart of Integration, Collaborative degree and Collaborative Efficiency.
Collaborative Index of Medical InstitutionCollaborative Index of Process WorkCollaborative Index of Cost WorkCollaborative Index of Technical WorkCollaborative Index of Medical Institution and Process Work

B1B2B3B4B5B6B7B8B9
CD0.10970.30290.46310.30290.21360.15620.37740.21640.1375
EF0.55270.58230.50000.58230.55350.60150.54730.52460.4910

Collaborative Index of Medical Institution and Cost WorkCollaborative Index of Medical Institution and Technical Work

B10B11B12B13B14B15
CD0.52360.41380.07540.45380.20660.0478
EF0.88590.80250.50030.84260.55890.4917

