Article

Implication of Negative Entropy Flow for Local Rainfall

1
State Key Laboratory of Severe Weather, Chinese Academy of Meteorological Sciences, Beijing 100081, China
2
Sanshui Meteorological Bureau, Foshan 528300, Guangdong, China
*
Author to whom correspondence should be addressed.
Entropy 2013, 15(9), 3449-3457; https://doi.org/10.3390/e15093449
Submission received: 24 May 2013 / Revised: 15 August 2013 / Accepted: 19 August 2013 / Published: 30 August 2013

Abstract

:
The relation between the atmospheric entropy flow field and local rainfall is examined in terms of the theory of dissipative structures. In this paper, the entropy balance equation in a form suitable for describing the entropy budget of the Earth’s atmosphere is derived starting from the Gibbs relation, and, as examples, the entropy flows of the two severe weather events associated with the development of an extratropical cyclone and a tropical storm are calculated, respectively. The results show that negative entropy flow (NEF) has a significant effect on the precipitation intensity and scope with an apparent matching of the NEF’s pattern with the rainfall distribution revealed and, that the diagnosis of NEF is able to provide a good indicator for precipitation forecasting.
PACS Codes:
89.20.-a Interdisciplinary applications of physics

1. Introduction

Entropy is a core concept in classical thermodynamics and statistical physics. According to the second law of thermodynamics, an isolated system will evolve spontaneously to the equilibrium with maximum entropy in which the order of the system is a minimum [1,2,3]. Therefore negative entropy flow (NEF) for an open system through its boundaries is very important for the system to remain far from equilibrium.
As shown in classical thermodynamics, changes in entropy for an open system consist of two contributory parts: one is entropy flow caused by positive or negative entropy exchange with its surroundings; and, the other is positive definite entropy production owing to irreversible processes within the system. This can be described by the entropy balance equation (EBE) for entropy per unit volume, S, which, using the local equilibrium assumption, is of the form:
S t =   d i v   J S + σ
where σ denotes entropy production, and the “div”-term is entropy flow with denoting partial differentiation [3,4]. The “div”-term in Equation (1) describes just the entropy flow entering into a system through the boundaries from its surroundings.
Entropy is relevant for the order in a system and so the evolution of an atmospheric system, as a thermodynamic many-body system, should be related to entropy flow from the environment. For example, a thin layer of fluid originally at rest, with a free surface at a lower temperature T1, heated from its bottom at a higher temperature T2 (Figure 1) was investigated by Bénard in 1900. He found that a rather regular cellular pattern of hexagonal convective cells was abruptly organised when the temperature difference (T2 – T1) reaching the value of the threshold of primary instability [2,3,5,6]. This suggests that every system that obtains heat at a higher temperature but loses heat at a lower temperature will undergo a net negative entropy flow process.
Figure 1. Schematic diagram for Bénard convection as the prototype of self-organization.
Entropy 15 03449 g001
In Bénard’s case, the entropy exchange ( δ s e ) of the system with its environment or entropy flow entering into the system through its boundaries can be expressed mathematically as the following Equation (2):
δ s e = Q 2 T 2 Q 1 T 1 = T 1 T 2 T 1 T 2 Q < 0
where Q1 and Q2 are the heat fluxes through the top and bottom of the layer of fluid, respectively, and Q is the flux when the system becomes steady so that Q = Q1 = Q2. Later Schrödinger stated in his monograph “What Is Life?” in 1940s that life’s existence depends on its continuous gain of ‘negentropy’ from its surroundings, implying that negative entropy flow (NEF) is something very significant for a system, whether it is living or nonliving [2,5,7,8,9,10]. That is, NEF will cause a system initially at equilibrium or even at rest to be organized, or lead a system already at non-equilibrium to a state further from equilibrium.
Although atmospheric processes such as condensation and evaporation are crucial to the entropy budget [11,12] it only causes changes in entropy production and is independent of entropy flow. As a result, only the entropy flow characteristic of a system is considered in this paper.
The atmosphere has been viewed as a giant thermodynamic engine in which disorganized heat energy is transformed into the organized kinetic energy of the winds in terms of the second law of thermodynamics. On the other hand, the general circulation of the atmosphere can be regarded as simply being driven by temperature differences between the polar and equatorial regions [13].
In recent years, some previous studies reviewed atmospheric systems in the light of non-linear non-equilibrium thermodynamics and reached a number of conclusions, such as: the numerical simulation of the atmospheric circulation improved dramatically when the second law of thermodynamics is incorporated into a global spectrum model [14]; and, the forecast accuracy of a meso-scale numerical weather prediction model is enhanced by introducing a physics-based diffusion scheme [15,16].
This paper is aimed at deriving the EBE for calculating instantaneous entropy flow fields related to two severe weather events, one associated with the development of an extratropical cyclone and another to a tropical storm, to discuss the relationship between NEF and the precipitation intensity and distribution associated with these two atmospheric systems and to investigate the possibility whether the evolution of NEF fields is able to provide some useful information for precipitation forecasting. The extratropical cyclone occurred in early November in northern China and had severe weather due to mixed rain-snow processes and was characterized by strong precipitation intensity, broad range, early first snowfall occurrence, multiple precipitating hydrometeors coexistence with dramatic temperature drops and gales. The tropical storm selected is a severe tropical storm named Bilis which made landfall on Fujian, China in 2006, and was the worst such disaster in East China in the last ten years as it caused the most deaths.

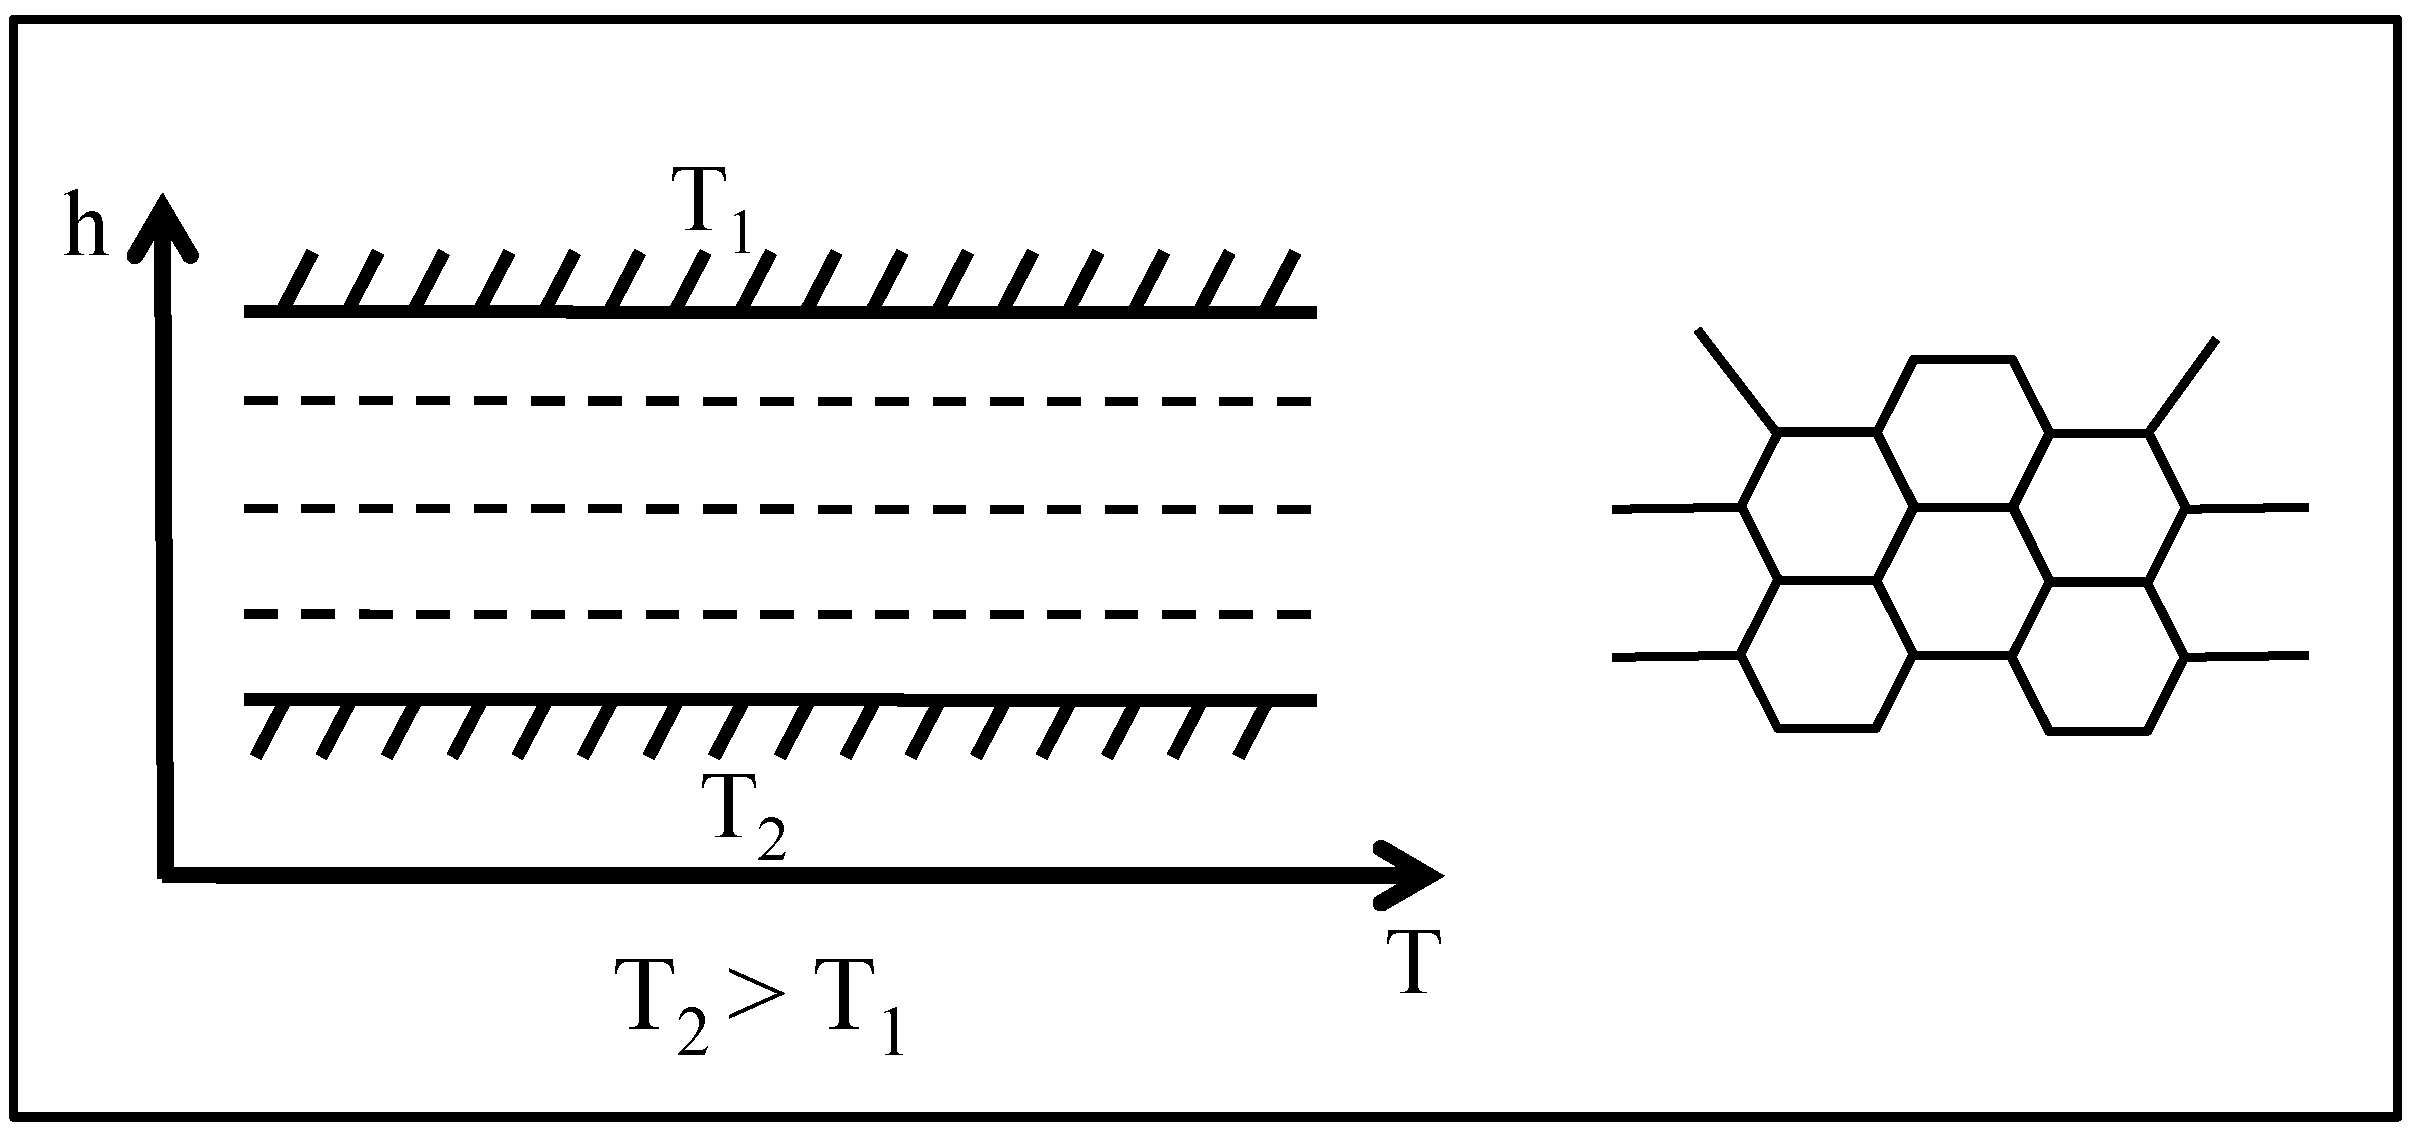
2. Entropy Balance Equation

The general EBE can easily be found in the literature [3] and here the specific EBE in a form suitable for describing the entropy budget of the atmosphere is derived starting from the Gibbs relation.
The Gibbs relation under the assumption of local equilibrium (e.g., [2]) can be written in terms of the change of entropy per unit mass, s, as follows:
d s d t = 1 T d u d t + p T d α d t k μ k T d N k d t
where T is the temperature; p the pressure; u the inner energy per unit mass; α = ρ 1 the specific volume with ρ being the total density; N k and μ k the fractional mass and the chemical potential for the kth component, respectively, in which N k = ρ k / ρ with ρ k the density of component k such that ρ = k ρ k and k N k = 1 . The three individual derivatives in the right-hand side of Equation (3) can be found through the first law of thermodynamics, the continuity equation and the component balance equation. Substituting for the three derivatives in the right-hand side of Equation (3) and turning the derivation of entropy into the local derivative, we have:
S t = d i v ( S V + 1 T J q k μ k T J k ) + σ
where σ is called entropy production while the “div” term is entropy flow, with S = ρ s being the entropy per unit volume and V the velocity. The heat flow J q can be approximately written, according to the Onsager relation [17], as
J q = ρ λ ˜ T x j
where λ ˜ is the thermal conductivity; and the diffusive flow J k for component k is defined as:
J k = ρ k ( V k V )
where V is the velocity for the mass center and V k the velocity of component k related to V by V = ρ k V k / ρ . In this paper the component of liquid water has been omitted owing to the liquid water content (about 5 g·m−3 on the average over the tropics) being much less than the density of either vapor or dry air [18,19] and only two components are taken into account, which are vapor and dry air with the corresponding density being ρ v and ρ d , and fractional mass N v (= q the specific humidity) and N d (= l − q), respectively. Usually the velocity V v for vapor is assumed to be the same as V d for dry air so that J k = 0 in our case. Therefore, the entropy s per unit mass consists accordingly of sq for vapor and sd for dry air with the result that:
s = s q + s d = q ( C p v ln T R v ln e ) + ( 1 q ) [ C p d ln T R d ln ( p e ) ]
where Cpv and Cpd are the specific heat at constant pressure for vapor and dry air, respectively; e the vapour pressure; while, Rv and Rd are the gas constant for vapor and dry air, respectively.
It should be noted that the formulas above are derived in the Cartesian coordinates. On the other hand, the NCEP/NCAR reanalysis data used in this paper are on constant pressure layers, and thus it is necessary to transform the expression of entropy flow into that in the p-coordinates. As a consequence:
d i v J s = ρ s u x ρ s v y + ρ g ρ s ω p + x ( ρ λ ˜ T T x ) + y ( ρ λ ˜ T T y ) + ρ λ ˜ g 2 [ ρ 2 T 2 T p 2 + T p ( ρ 2 / T ) p ]
where J s denotes the entropy flow vector; u and v are the velocities in the x- and y-direction at constant pressure layers, respectively; ω the vertical velocity in the p-coordinates; and, g the gravitational acceleration. Equation (8) is the basic formula for calculating entropy flow employed in this paper. Also, in this paper only the entropy flows on the layer of 950 hPa are taken into account since this lower layer is more representative for describing the evolution of a vortex system as shown in previous studies [19,20,21,22].

3. Results

These entropy flows associated with the two vortex systems are evaluated in this paper using Equation (8) above with emphases on the layer of 950 hPa and based on the National Centers for Environmental Prediction/National Center for Atmospheric Research (NCEP/NCAR) 1 × 1 (latitude-longitude) resolution reanalysis data [23]. The precipitation data are from the conventional meteorological observations.

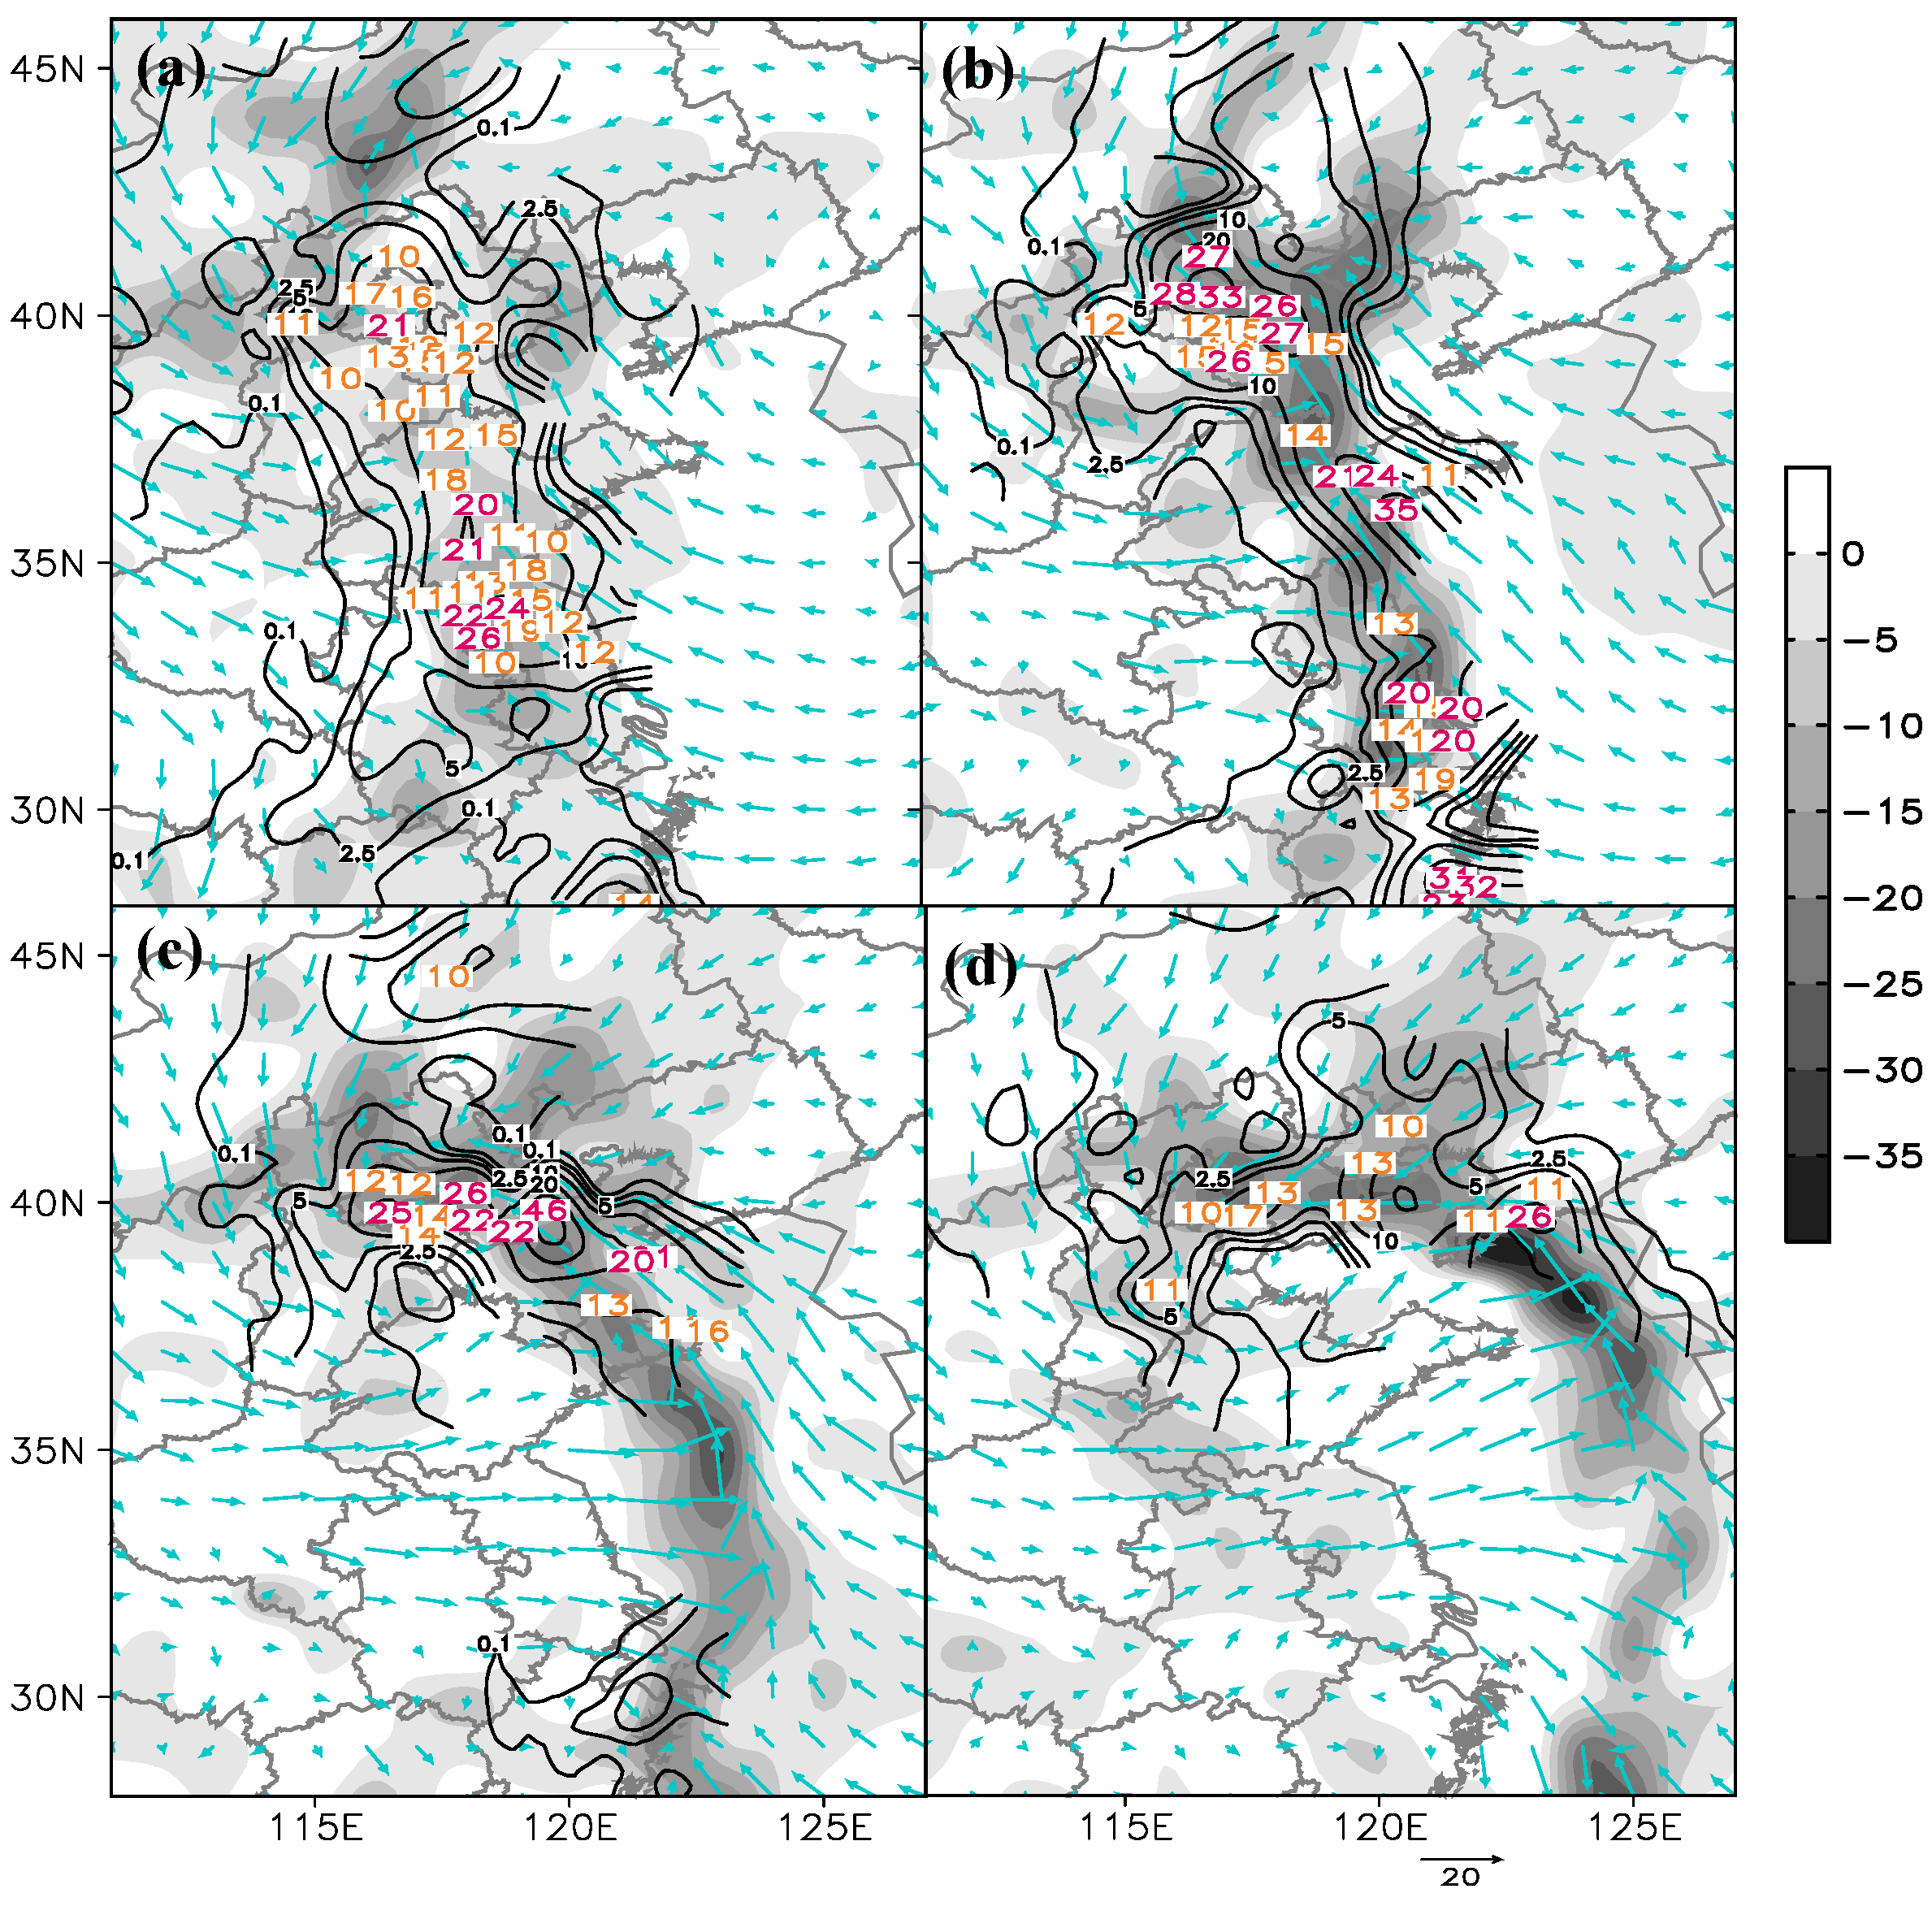
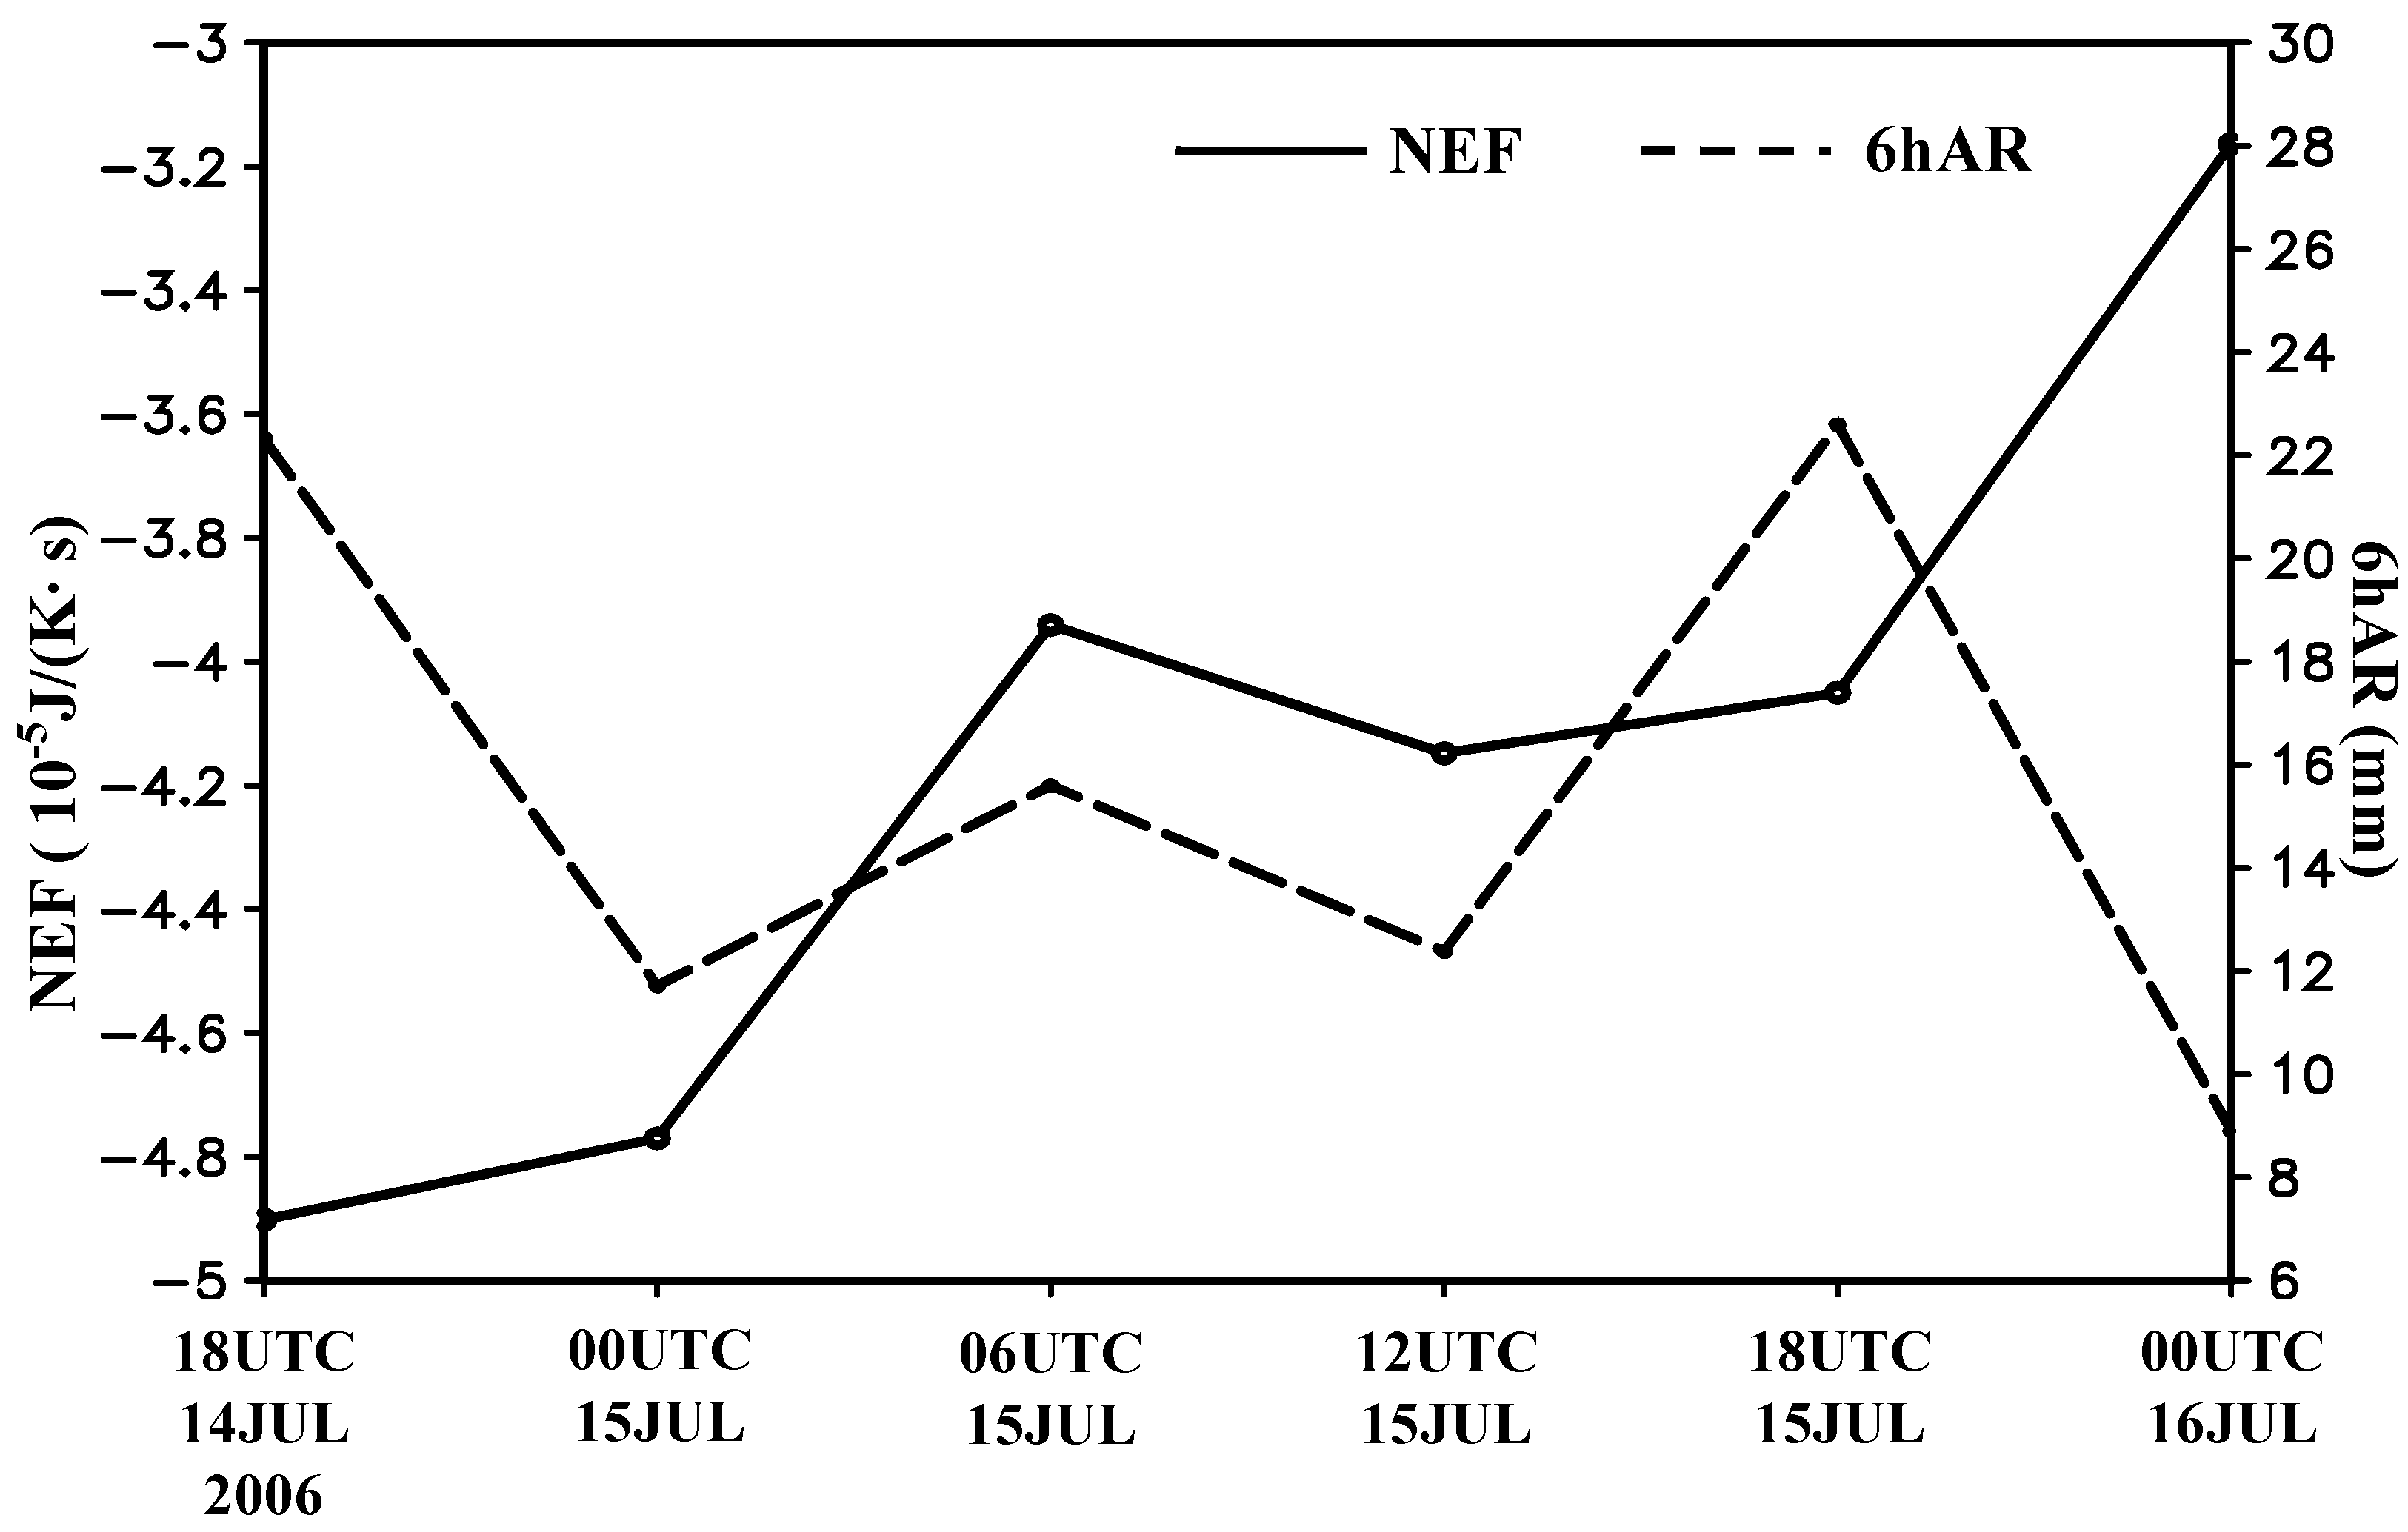
3.1. Extratropical Cyclone
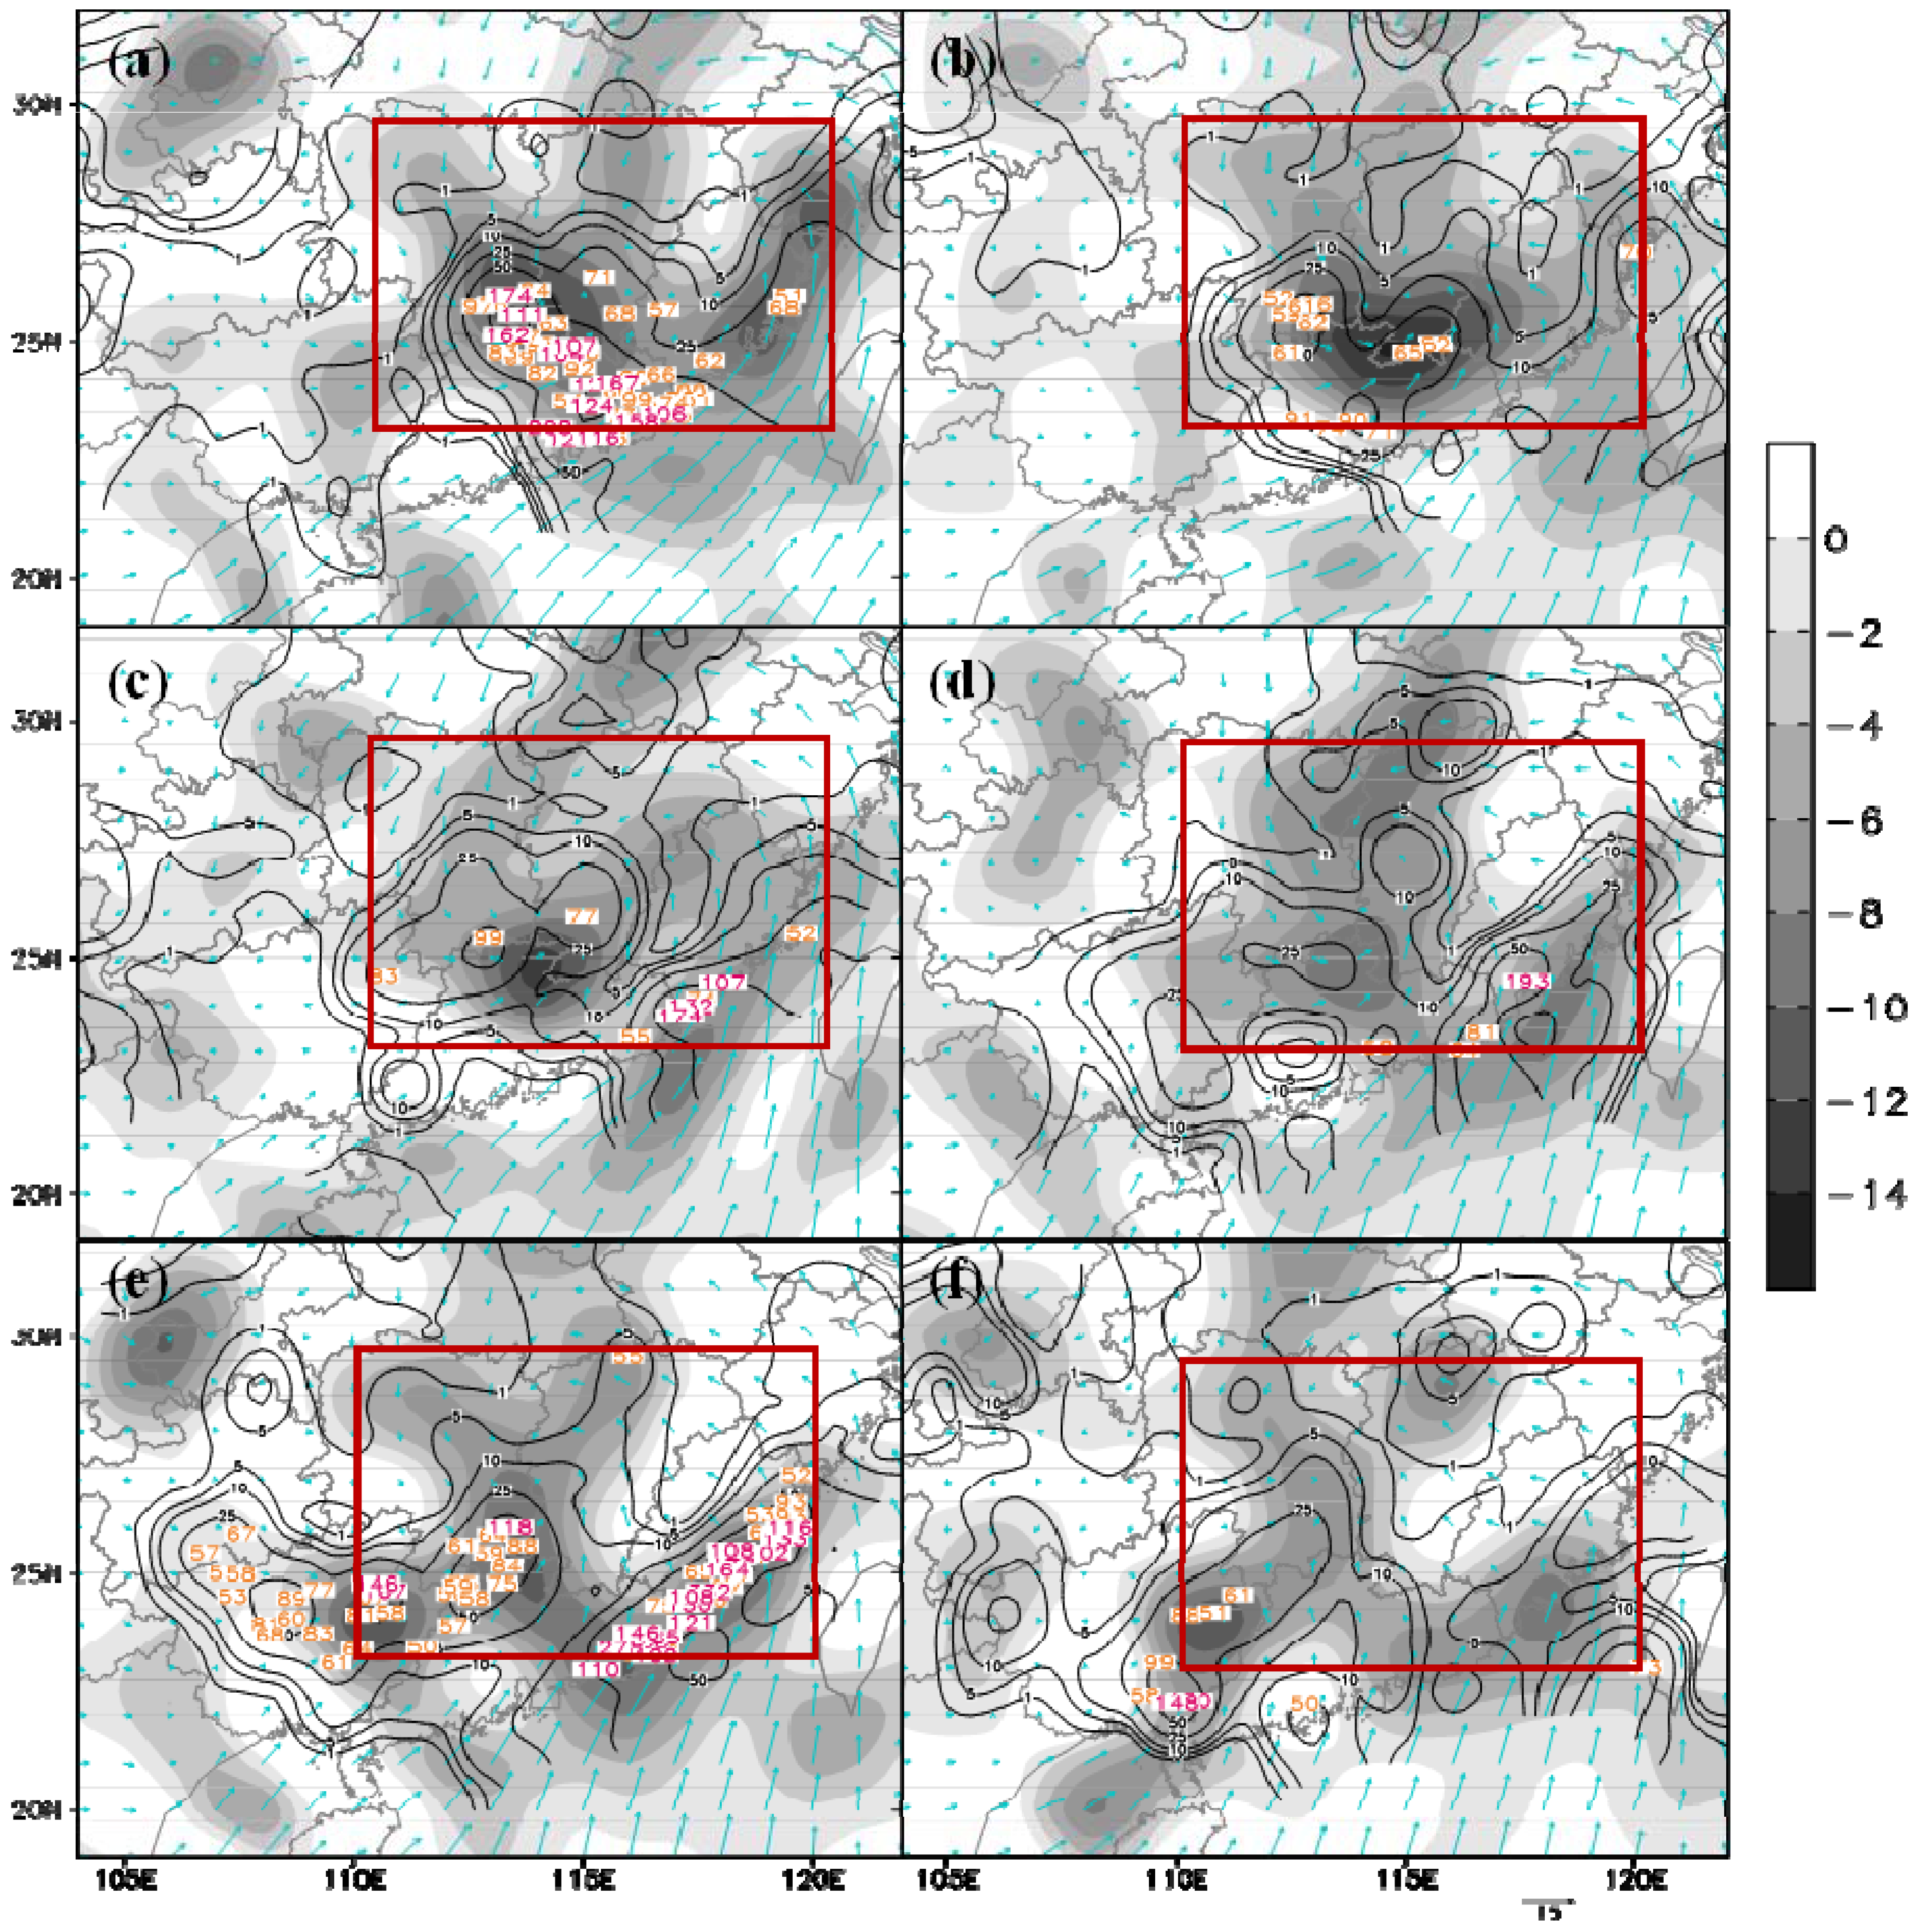
The first mixed rainfall-snowfall event is related to an extratropical cyclone that occurred from 3 to 5 November 2012 in North China, which is relatively earlier compared with the first snow in other years. The particular distributions of precipitating hydrometeors were caused largely by the development of the cyclone interacting with a strong frontal cold air burst, leading to very complicated weather changes during the period from 06:00 UTC 3 November to 06:00 UTC 4 November.
Figure 2 shows the negative entropy flow field at 950 hPa with the corresponding thenceforth rainfall distribution for the region around North China centered near Beijing City from 06:00 UTC 3 November to 06:00 UTC 4 November at 6 h intervals.
Figure 2. Negative entropy flow field (shading in 10-5J/(K·s)), wind field (vector) at 950 hPa for the times of (a) 0600, (b) 1200, (c) 1800 UTC 3, and (d) 0000 UTC4 November 2012 and the corresponding thenceforth 6 h accumulative rainfall distributions (solid line in mm, rainfalls larger than 10 mm are numbered) for the region around North China centered near Beijing City.
Entropy 15 03449 g002
It is seen from Figure 2 that the patterns of NEF at 950 hPa are well matched with the thenceforth 6 h accumulated rainfall (6 hAR) fields. Both the NEF and 6 hAR at 0600 UTC 3 November have a north-south distribution while as NEF becomes more intense, so too does 6 hAR. Note that the 6 hAR fields have no observations over the oceans. Compared the patterns of NEF field at 950 hPa with the ones of the corresponding thenceforth 6 h accumulative rainfall (6 hAR) (Figure 2), it is found from Figure 2 that these two patterns are well-matched with each other. As an example, at 0600 UTC 3 November, the NEF field as is seen in Figure 2a is of near north-south distribution, which is quite similar to the pattern of the thenceforth 6hAR for the period from 0600 to 1200 UTC 3 November seen in Figure 2a that is of near north-south distribution as well.
Figure 3. Negative entropy flow field (shading in 1 × 10⁻⁵ J/(K·s)), wind field (vector) at 950 hPa for the period from 1800 UTC 14 to 0000 UTC 16 July 2006 at 6 h intervals and the corresponding thenceforth 6 h accumulative rainfall distributions (solid line in mm, rainfalls larger than 50 mm are numbered) for the region in southern China. The areas in the rectangle are the areas defined in Figure 4.
Entropy 15 03449 g003
On the other hand, the stronger the intensity of NEF is, the more the rainfall is, which can be distinctly seen via comparing respectively between (a) and (b). Also, through carefully examining (c) and (d) similar conclusions can be reached for the other occasions (notice that the rainfall patterns are incomplete owing to a shortage of records over the ocean).

3.2. Tropical Storm

Tropical Storm Bilis, called TS Bilis hereafter, was the worst such disaster in eastern China in the last ten years as it caused the most deaths. TS Bilis struck land on Fujian, China on 14 July 2006, and caused direct economic losses of RMB ¥34.83 billion, 654 deaths and 208 missing persons.
Since more data can be acquired after its landing, the analysis in this paper will be focused on the period from 1800 UTC 14 July to 0000 UTC 16 July 2006. It is seen from Figure 3 that the patterns of NEF are also similar to the corresponding thenceforth 6 hAR fields (Figure 3a–f). Thus at 1800 UTC 14 July 2006 (Figure 3a) there is an arc-shaped band of NEF contained by isoline of −800 × 10−5 J/(K·s) with large values near the TS Bilis center, and this corresponds well with the 25 mm 6 hAR field.

4. Discussion and Conclusions

It is seen based on the results above that the precipitation is significantly related to the NEF. On the other hand, for a specific area (e.g., the area 23–30 °N, 110–120 °E in the case of the TS Bilis), the NEF within it is also well matched with the thenceforth 6 h accumulative precipitation as shown in the Figure 4. in which the first and last periods are especially prominent in terms of the decreased NEF corresponding to the decreased thenceforth 6 h accumulative precipitation.
Figure 4. Changes in the averaged negative entropy flow (solid line in 1 × 10⁻⁵J/(K·s)) at 950 hPa and the averaged thenceforth 6 h accumulative precipitation (dashed line in mm) over the area (23–30 °N, 110–120 °E) from 1800 UTC 14 July to 0000 UTC 16 July 2006.
Entropy 15 03449 g004
In classical thermodynamics, entropy is regarded as a measure of the degree of disorder with regard to a system and, NEF entering into an open system from its surroundings will cause a decrease in entropy within the system and thus drive the system further away from equilibrium, leading the system to becoming more ordered or stronger in intensity. As far as these two computational results in this paper are concerned, it could be understood that larger NEF will drive a system further from equilibrium as shown by the second law of thermodynamics, and thus more complicated structures with a higher degree of order may form within it, resulting eventually in more severe weather events, including severe rainfalls to occur in the corresponding zones to the larger NEF areas.
The nonlinear non-equilibrium thermodynamics points out that, for an open system, strong enough NEF from its surroundings may drive the system to a state so far from equilibrium to form complex dissipative structures, which is consistent with the principle of the second law of thermodynamics. This study applies entropy flow analysis based on the entropy balance equation derived from the Gibbs relation to two storm cases using the NCEP/NCAR reanalysis data. This analysis indicates a strong match between NEF and the thenceforth 6h accumulated rainfall distribution and suggests that NEF evolution may be a useful indicator for short-range severe precipitation forecasting. These results coming from the two cases could be applied to other events. On the other hand, whether thenceforth 6 h or a longer leading time is reasonable for our application purposes is worthy of further research.

Acknowledgements

This work was jointly supported by the National Natural Science Foundation of China under Grant 41075048, the R & D Special Fund for Public Welfare Industry (meteorology) by the Ministry of Finance and the Ministry of Science and Technology under Grant GYHY201006006, and the State Key Basic Research Development Program under Grant 2012CB417204.

Conflicts of Interest

The authors declare no conflict of interest.

References

  1. Prigogine, I. Thermodynamics of irreversible processes. Bull. Class. Sci. Acad. Roy. Belg. 1945, 31, 600–621. [Google Scholar]
  2. Prigogine, I. Introduction to Thermodynamics of Irreversible Processes; Charles, C., Ed.; Thomas: Springfield, IL, USA, 1955; pp. 9–31. [Google Scholar]
  3. Ruelle, D.P. Extending the definition of entropy to nonequilibrium steady states. Proc. Natl. Acad. Sci. 2003, 100, 3054–3058. [Google Scholar] [CrossRef] [PubMed]
  4. De Groot, S.R.; Mazur, P. Non-Equilibrium Thermodynamics; North-Holland Publishing Company: Amsterdam, The Netherlands, 1962; pp. 410–425. [Google Scholar]
  5. Glansdorff, P.; Prigogine, I. Thermodynamic Theory of Structure, Stability and Fluctuations; Wiley Interscience: New York, NY, USA, 1971; pp. 16–19. [Google Scholar]
  6. Eckert, K.; Bestehorn, M.; Thess, A. Square cells in surface-tension-driven Bénard convection: Experiment and theory. J. Fluid Mech. 1998, 356, 155–197. [Google Scholar] [CrossRef]
  7. Grinstein, G.; Linsker, R. Comments on a derivation and application of the “maximum entropy production” principle. J. Phys. A: Math. Theor. 2007, 40, 9717–9720. [Google Scholar] [CrossRef]
  8. Schrödinger, E. What Is Life? (first published in 1944); Cambridge University Press: Cambridge, UK, 1992; pp. 19–25. [Google Scholar]
  9. Olby, R. Schrödinger’s problem: What is life? J. Hist. Biol. 1971, 4, 119–148. [Google Scholar] [CrossRef] [PubMed]
  10. Katchalsky, A.; Curran, P.F. Non-Equilibrium Thermodynamics in Biophysics; Harvard University Press: Cambridge, MA, USA, 1965. [Google Scholar]
  11. Beretta, G.P. Modeling non-equilibrium dynamics of a discrete probability distribution: General rate equation for maximal entropy generation in a maximum-entropy landscape with time-dependent constraints. Entropy 2008, 10, 160–182. [Google Scholar] [CrossRef]
  12. Fraedrich, K.; Blender, R. Scaling of atmosphere and ocean temperature correlations in observations and climate models. Phys. Rev. Lett. 2003, 90, 1–4. [Google Scholar] [CrossRef]
  13. Tsonis, A.A. Introduction to Atmospheric Thermodynamics; Cambridge University Press: Cambridge, UK, 2002; pp. 69–72. [Google Scholar]
  14. Liu, C.; Liu, Y. An attempt at improving a global spectral model by incorporating the second law of thermodynamics. Geophys. Res. Lett. 2005. [Google Scholar] [CrossRef]
  15. Liu, C.; Liu, Y.; Kang, H. A new technique of physical dissipation and its application to a meso-scale numerical weather prediction model. Sci. China Ser. D 2002, 45, 769–780. [Google Scholar] [CrossRef]
  16. Liu, C.; Liu, Y.; Xu, H. A physics-based diffusion scheme for numerical models. Geophys. Res. Lett. 2006, L12805. [Google Scholar] [CrossRef]
  17. Onsager, L. Reciprocal relations in irreversible processes. I. Phys. Rev. 1931, 37, 405–426. [Google Scholar] [CrossRef]
  18. Mason, B.J. Physics of Clouds; Oxford University Press: London, UK, 1971; pp. 119–123. [Google Scholar]
  19. Liu, Y.; Zhang, D.-L.; Yau, M.K. A multiscale numerical study of Hurricane Andrew (1992), Part I: Explicit simulation and verification. Mon. Wea. Rev. 1997, 125, 3073–3093. [Google Scholar] [CrossRef]
  20. Liu, Y.; Liu, C. On the entropy flow properties of a severe tropical storm. Appl. Phys. Lett. 2007, 91, 014103. [Google Scholar] [CrossRef]
  21. Xu, H.; Liu, C. Entropy properties of a typhoon as simulated by a meso-scale model. Europhys. Lett. 2008, 83, 18001. [Google Scholar] [CrossRef]
  22. Liu, C.; Luo, Z.; Liu, Y.; Yu, H.; Zhou, X.; Wang, D.; Ma, L.; Xu, H. Implication of entropy flow for the development of a system as suggested by the life cycle of a hurricane. Mod. Phys. Lett. B 2010, 24, 1747–1757. [Google Scholar] [CrossRef]
  23. Kalnay, E.; Kanamitsu, M.; Kistler, R.; Collins, W.; Deaven, D.; Gandin, L.; Iredell, M.; Saha, S.; White, G.; Woollen, J.; et al. The NCEP/NCAR 40-year reanalysis project. B. Am. Meteorol. Soc. 1996, 77, 437–471. [Google Scholar] [CrossRef]

