Article

Protection Intensity Evaluation for a Security System Based on Entropy Theory

1
National Engineering Research Center for Multimedia Software, Wuhan University, Wuhan 430072, China
2
Information Technology Center, Jiujiang Univeristy, Jiujiang 332005, China
3
School of Computer, Wuhan Univeristy, Wuhan 430072, China
*
Author to whom correspondence should be addressed.
Entropy 2013, 15(7), 2766-2787; https://doi.org/10.3390/e15072766
Submission received: 7 May 2013 / Revised: 13 June 2013 / Accepted: 12 July 2013 / Published: 17 July 2013

Abstract

:
The protection effectiveness is an important metric to judge whether a security system is good or not. In this paper, a security system deployed in a guard field is regarded abstractly as a security network. A quantitative protection effectiveness evaluation method based on entropy theory is introduced. We propose the protection intensity model, which can be used to calculate the protection intensity of a stationary or moving object provided by a security system or a security network. Using the protection intensity model, an algorithm, specifically for finding the minimal protection intensity paths of a field deployed multiple security system, is also put forward. The minimal protection intensity paths can be considered as the effectiveness measure of security networks. Finally, we present the simulation of the methods and models in this paper.

1. Introduction

1.1. Motivation

Security is surely not a new concept. The idea of protecting cities through the construction of fortifications dates back thousands of years. Following the excavation of Jericho and analysis of the fortifications and artifacts located there, Kenyon [1] found that the earliest walls and towers of that ancient city dated to before 6,000 B.C. The walls of Jericho indicate that as long as mankind has been protecting people and property from adversaries there has existed a motivation to provide protection. As threats change, so must the safeguards. The events of 11 September 2001 came as a shocking indication that the threats against the World had changed dramatically. Security has emerged as a pressing social concern, and currently, the society security problem has been attached importance by many countries. In order to maintain social public safety, many security systems have been constructed in cities all around the World. A security system can be considered as a complex physical protection system, which is made up of securities or guards, architectures and electronic devices and consists of some subsystems, such as intrusion alarm systems, the video surveillance systems, the access control systems, the explosion-proof security check systems, etc. Security systems are deployed at different positions in an area, which can communicate and share data each other through the internet, and complete protection tasks cooperatively.
Security systems have three major functions: detection, defense and response [2]. Detection is the identification of an ongoing or imminent intrusion. Defense can be either the shielding of persons and assets from damage or the delay of an adversary’s access through a guard zone. Response involves actions to interdict an intruder. Recently, a flurry of research activity on security systems has commenced, especially in the area of assessment of protection effectiveness of a security system. Some of the developed countries with earlier applications of security systems, such as the United States, Australia, and the United Kingdom, have made some research achievements. The corresponding theoretical models and softwares have also been developed. Those researches are mainly focused on the effectiveness assessment of a security system using two ways. One way is the Delphi method, which is used to evaluate the effectiveness of a security system through establishing corresponding indicators based on expert opinions. The other way is to use a probability model and simulation experiments. There is no single objective solution for the effectiveness assessment of a security system. Some methods are based on the Delphi method or probability model or simulation experiments, but the efficiency of a security system is often determined based on expert opinions rather than an absolutely precise analysis. For example, use of the software packages “EASIˮ or “ASSESSˮ developed by Sandia Laboratories still requires experts to define several penetration paths that are considered crucial for protection of assets. However, even the best experts can overlook some less obvious attack routes. Therefore it is a challenge to minimize the subjectiveness during the process of the protection effectiveness assessment of a security system. Moreover, it is easy to judge whether security systems are good or not by comparison between their protection effectiveness, but it is difficult to estimate whether a security network, which consists of several security systems, is good or not through a simple comparison of their protection effectiveness and it is also hard to assess how well a security system can protect an object, moving on an arbitrary path, over a period of time.

1.2. Contribution

In this paper the security systems deployed in a guard zone are regarded abstractly as a diagram of a security network as shown in Figure 1. Each yellow filled circle represents a security system, and every triangle represents a protection target. According to the Shannon Information Theory, we use entropy to quantitatively measure the protection effectiveness of a security system and then put forward the protection intensity model of a security system, which firstly considers the impact of velocity. Using the protection intensity model we can calculate the protection intensity that a security system or a security network provides for a stationary object or a moving object in a guard zone and find the most vulnerable path of a security network from a starting point to a destination point. The protection intensity on the most vulnerable path is considered as the effectiveness measure of a security network.
Figure 1. The abstract diagram of security network.
Entropy 15 02766 g001

1.3. Paper Organization

The reminder of this paper is organized as follows: first we survey the related work. In Section 3, the effectiveness assessment model on the basis of the theory of the information entropy is given. In Section 4, the models and various definitions used to calculate the protection intensity are presented. In Section 5, we bring forward an efficient algorithm for protection intensity calculation specifically targeted for finding vulnerable paths. In Section 6, we present the simulation results to verify our results and extend them to a more general case. Finally, we draw our conclusions in Section 7.

2. Related Work

In the early 1970s, the U.S. Department of Energy’s Sandia National Laboratories [3] first introduced the basic concepts of the Physical Protection System, from which the security system evolved and put forward a model named adversary sequence diagram (ASD) [4], which was applied to the field of nuclear facilities protection. Physical security systems have received renewed interest since the events of September 11, 2001 and some researchers have made significant progress on this area. Garcia [2] gave an integrated approach to designing physical security systems. Of particular note are the chapters on evaluation an analysis of protective systems as well as effectiveness assessment. A cost-effectiveness approach was presented, and the measure of effectiveness employed for a physical protection system was the probability of interruption which was defined as the cumulative probability of dectection from the start of an adversary path to the point determined by the time available for response.
Hicks et al. [5] put forward a cost and performance analysis for a physical protection systems at the design stage. The system-level performance measure was risk which they defined as follows:
R i s k = p ( A ) × [ 1 p ( E ) ] × C
where p(A) is that probability that the attack on a facility will occur, p(E) is the probability that a physical protection system prevents an adversary from making an attack successfully, and C is the extent of consequence. Here, p(E) is defined as follows:
p ( E ) = p ( I ) × p ( N )
p(I) is the likelihood of interrupting the attack defined as the probability that response force will be in the right place in time in order to stop adversary’s advancing on the target. p(N) is the probability of neutralization of an adversary which is defined as the probability that response force will be physically stronger than the adversary to liquidate threats.
Doyon [6] presented a probabilistic network model for a system consisting of guards, sensors, and barriers. He determines analytic representations for determining probabilities of intruder apprehension in different zones between site entry and a target object. Fischer and Halibozek [7] presented a very subjective risk analysis approach to ranking threats using a probability matrix or a criticality matrix or a vulnerability matrix. Cost-effectiveness was discussed as possible measure of effectiveness evaluation of a security system.
Schneider and Grassie [8] presented a methodology in which countermeasures were developed in response to asset-specific vulnerabilities. They did allow for a “system level impression of overall cost and effectiveness” created by considering the interaction of the selected countermeasures. They discussed issues relating to cost-effectiveness tradeoffs individual countermeasures, but fail to give an overall security system evaluation scheme.
A small subset of the literature presented operations research techniques applied to analysis of physical security system. Kobza and Jacobson [9,10] put forward probability models for security systems with particular applications to aviation security. They are especially concerned with false clear and false alarm signals. They formulate an optimization problem to determine the minimum false alarm rate for a security system with a pre-specified false clear standard. Pollet and Cummins [11] put forward a effectiveness assessment framework of security systems, which considered not only the characteristics of a system, but also the risk outside.
In light of recent world events, much emphasis has been given to homeland security systems for antiterrorism purposes. Shan and Zhuang [12] considered the tradeoff between equity and efficiency in homeland security resource allocation and developed a novel model in which a government allocated defensive resources among multiple potential targets, while reserving a portion of defensive resources (represented by the equity coefficient) for equal distribution (according to geographical areas, population, density, etc.). In recent years, some researchers have considered that there was enormous uncertainty in the effectiveness evaluation of secrutiy systems, and they put forward some methods to reduce uncertainty. In 2011, Xu [13] thought that each individual component of the security system should be modeled, and he used the Dempster-Shafer (D-S) evidence theory to analyse potential threats. Zhuang and his colleagues also proposed methods such as bounded intervals [14], exogenous dynamics [15], games of imperfect information [16,17,18], to characterize uncertainty in effectiveness analysis, and in 2013 they presented an approach based on game theory and considered the cases where the defender had resource constraints [19]. In considering series systems, they differentiated between cases where atttackers had perfect knowledge of the system’s defenses or no prior knowledge of the defensive configuration. All in all, the above methods or models are still based on probability.

3. Protection Effectiveness Estimation of Security Systems Based on Entropy Theory

In this section, a quantitative effectiveness evaluation model for security systems on the basis of entropy theory is proposed.

3.1. Brief Effectiveness Estimation Method for a Security System

The effectiveness estimation method for a security system mainly includes three steps. The first step is Asset Identification. The second step is Threats Identification. The third step is Effectiveness Assessment of a Security System. These steps are shown in Figure 2.
Figure 2. The steps of the effectiveness estimation of a security system.
Entropy 15 02766 g002
The primary of purpose of a security system is the protection of an asset or a set of assets. These assets can include resources, personnel, facilities, homes, locations, or other items of value. Specificity in identifying assets ensures that the protection scope of a security system is not too broad or too narrow. Proper identification of assets can seek to prevent the unnecessary commitment of resources to protection and leaving items vulnerable that require additional protection. The identification of assets determines the purpose of a security system.
After identifying assets, threats must be identified. Some considerations used to identify threats are motivations for attacking assets or goals to be achieved through attacks. Information about a potential threat should consist of the type of threat, capabilities of potential intruders, and tactics commonly used by intruders. Information about a threat should be specific so as to allow for both the assessment of potential damage and the identification of techniques to counter threats. Threats identification is an important research field, which is beyond the scope of this paper.
Once threats are identified, the vulnerability of assets can be investigated through the protection effectiveness assessment of a security system. The effectiveness evaluation requires the analysis of the actions of the potential threats. The effectiveness assessment of a security system is often characterized in terms of likelihood, which is defined using probability.
Next, we demonstrate the protection effectiveness assessment with a simple example. A security system has three important objectives, which are detection, defense and response. The protection effectiveness of a security system can be determined by the three fators. We assume that there are three security systems defined as S1, S2 and S3 respectively. The effect weights of each factor are supposed to be same. The probability of each factor completing protection tasks are shown in Table 1. The average of the probability of the three factors is considered as the protection effectiveness of a security system.
Table 1. The effectiveness for each security system.
Security SystemDetectionDefenseResponseEffectiveness
S10.90.80.90.87
S20.70.750.850.77
S30.90.50.70.7
It is easy to find that the protection effectiveness assessment has uncertainty. In order to quantitatively analyze the effectiveness of a security system, it is necessary to use a scientific method to measure the uncertainty. In the next subsection, the method on the basis of entropy, which can be used to quantitatively evaluate the uncertainty, is introduced.

3.2. Introduction of Related Theories

Entropy, which was brought forward by French scientist Rudolf Clausius [20] in 1865, is a state function of the second law of thermodynamics. Austrian physicist Boltzmann [21] first used entropy to solve some statistical problems. From then on, entropy becomes a measure of disorder or uncertainty of systems. In 1948, American scientist Shannon [22] proposed the concept of information entropy, which can be used to measure the average information amount in the process of communication. Information entropy is also called Shannon entropy denoted by H(X), which is defined as:
Entropy 15 02766 i001
where p(xi) is the probability of the discrete random variable xi. If variable xi is continuous, Shannon entropy expression is as follows:
H ( X ) = ʃ p ( x ) log 2 p ( x ) d x
Due to the uncertainty of information transmission, Shannon entropy is used to measure the amount of information. The effectiveness of a security system is usually judged by the ratio of complition of a protection task, so there are a lot of uncertain factors that can affect the effectiveness of a security system. The higher the ratio of completion protection task is, the less the uncertainty associated with the effectiveness of a security system is. That means that the larger the protection effectiveness of a security system is, the lower the probability of failure to finish protection tasks. Similar to Shannon entropy, the uncertain factors can be measured by entropy.

3.3. Protection Effectiveness Evaluation Model Based on Entropy

The protection effectiveness can be measured by how much a security system reduces the uncertainty of protection tasks. In order to quantitatively evaluate the protection effectiveness of a security system, we use entropy to calculate the amount of uncertainty. Suppose that there are n independant factors that affect the protection ability of a security system. The probability of each factor to complete the task is expressed as Ri(i = 1,2,···,n), and the weight of every factor is ωi(i = 1,2,···,n). The protection effectiveness of a security system can be defined as:
Entropy 15 02766 i002
where Isi is the protection effectiveness of a security system. If the variable R is continuous function, the protection effectiveness of a security system is defined as follows:
I s i = ω i ʃ ln ( 1 R i ( x ) )

3.4. Mutual Protection of Multiple Security Systems

As shown in Figure 1, a security network is made up of multiple security systems. The protection effectiveness of a security network is associated with the most vulnerable path from starting point to destination. We suppose that there are n security systems, which are expressed as Si(i = 1,2,···,n), along the most vulnerable path. Pi(i = 1,2,···,n) is the probability of the security system Si(i = 1,2,···,n) to accomplish protection tasks. Isi(i = 1,2,···,n) represents the protection effectiveness of the security system Si(i = 1,2,···,n). Pi(i = 1,2,···,n) can be calculated by the following way:
I s i = ln ( 1 P i ) , P i = 1 e I s i
From the Equation (7), Pi(i = 1,2,···,n) is the logarithmic function on Isi(i = 1,2,···,n). The function curve is shown in Figure 3. If the security systems are independent each other, the protective effectiveness of the security network will be expressed as follows:
Entropy 15 02766 i003
Figure 3. The relationship between protection effectiveness and protection probability.
Entropy 15 02766 g003
If the security systems are not independent one another, mutual protection among the security systems will be considered. We use U(S1,S2,···,Sn) to represent the mutual protection uncertainty of the security systems. U(S1,S2,···,Sn) is defined as follows:
Entropy 15 02766 i004
The protection effectiveness of the security network is expressed as follows:
Entropy 15 02766 i005
Take the three security systems shown in Table 1 for example, we assume that the three security systems lie in the most vulnerable path of a security network and the effect weights of each factor are same. We use the models and the methods introduced in this section to evaluate the protection effectiveness. According to the Equation (5), we can get the protection effectiveness of the three security systems. From Equation (7) the protection probability Pi can be calculated. The results are shown in Table 2.
Table 2. A sample to evaluate the effectiveness and the protection probability.
Security SystemDetectionDefenseResponseEffectivenessPi
S10.90.80.92.07150.8744
S20.70.750.851.49580.7759
S30.90.50.71.39990.7534
If the three security systems are independent, according to Equation (8) the protection effectiveness of the security network is obtained as follows:
IS1 + IS2 + IS3 = 4.9672
If the three security systems are not independent, from Equation (9) the mutual protection uncertainty is obtained as follows:
U(S1,S2,S3) = 0.0617
From Equation (10) the protection effectiveness of the security network is obtained as follows:
I = 2.7855
Like many current effectiveness assessment models, the above example has a potential hypothesis that is that security systems must lie on the paths in a guard zone as shown in Figure 4. But according to the actual situation it is imposible to deploy security systems on each path. Moreover, adversaries will try their best to avoid security systems in generally. In the next section, we present the protection intensity evaluation model, which is closer to the actual situation. The model can be used to assess the protection intensity of a stationary or moving object at any position in a guard field, which is provided by the security systems deployed in the field.
Figure 4. A sample of a security network in a guard zone where security systems lie on each path.
Entropy 15 02766 g004

4. Protection Intensity Evaluation Model

Security systems genrerally have widely different theoretical and physical characteristics. Hence, numerous models of varying complexity can be constructed based on application needs and device features. Security systems share one facet in common, which is that protection ability diminishes as distance increases. A guard field is an area where security systems are deployed as shown in Figure 1.
For the sake of protection intensity calculations, protection intensity at each point in a guard field is hypothesized to be defined and non-negative. Having this in mind, for a security system si, the protection intensity evaluation model at an arbitrary point m is expressed as:
Entropy 15 02766 i006
where d(si,m) is the Euclidean distance between the security system si and the point m, Isi is the protection effectiveness of si, and positive ki is technology-dependent parameters of si.
In order to introduce the notion of protection intensity in a guard zone, the protection intensity of a given point m in the guard field F. Depending on the application and the function of security systems at hand, the protection intensity can be defined in several ways. Here, two methods for the evaluation of protection intensity: All Security Systems Protection Intensity (JA) and Closest Security Systems Protection Intensity (JC).

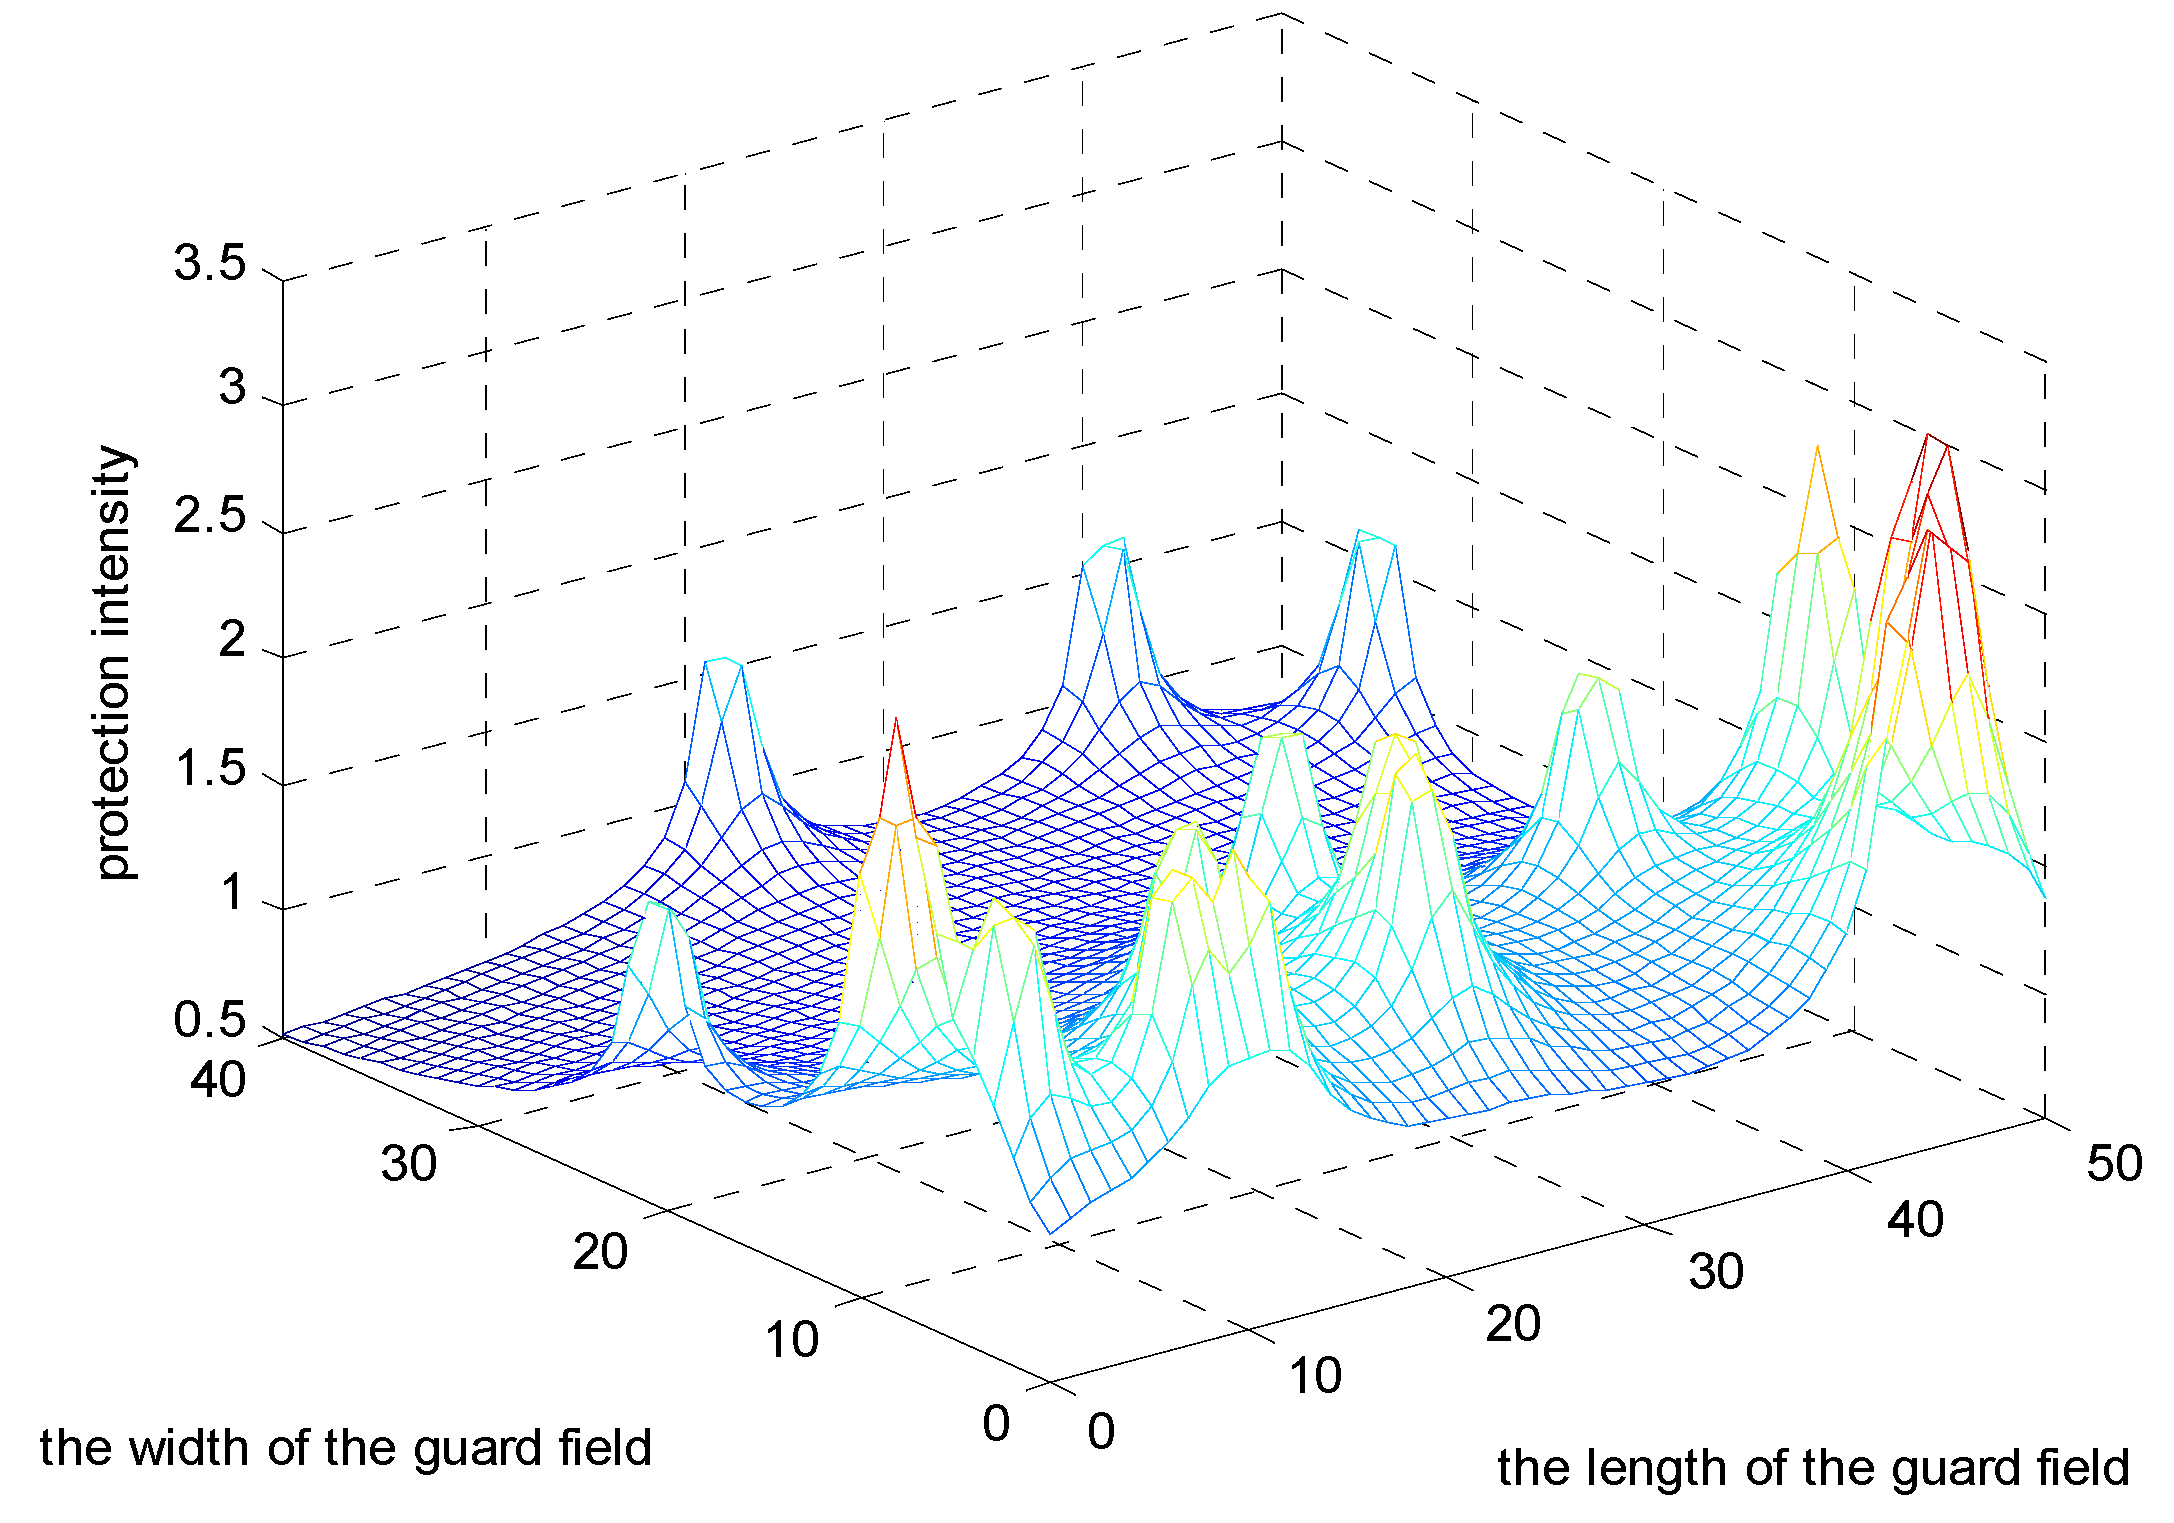
4.1. All Security Systems Protection Intensity

All Security Systems Field Intensity JA(F,m) for a point m in a guard zone F is defined as the effective protection measures at point m from all security systems in F. Assuming there are n active security systems, s1,s2,···sn, each contributing with the protection function, JA is expressed as:
Entropy 15 02766 i007

4.2. Closest Security Systems Protection Intensity

Closest Security Systems Protection Intensity JC(F,m) for a point m in a guard zone F is defined as the effective protection measures at point m from the closest security systems in F, i.e., the security system that has the smallest Euclidean distance from point m. JC is expressed as:
Entropy 15 02766 i008
where smin is the closest security system to m.

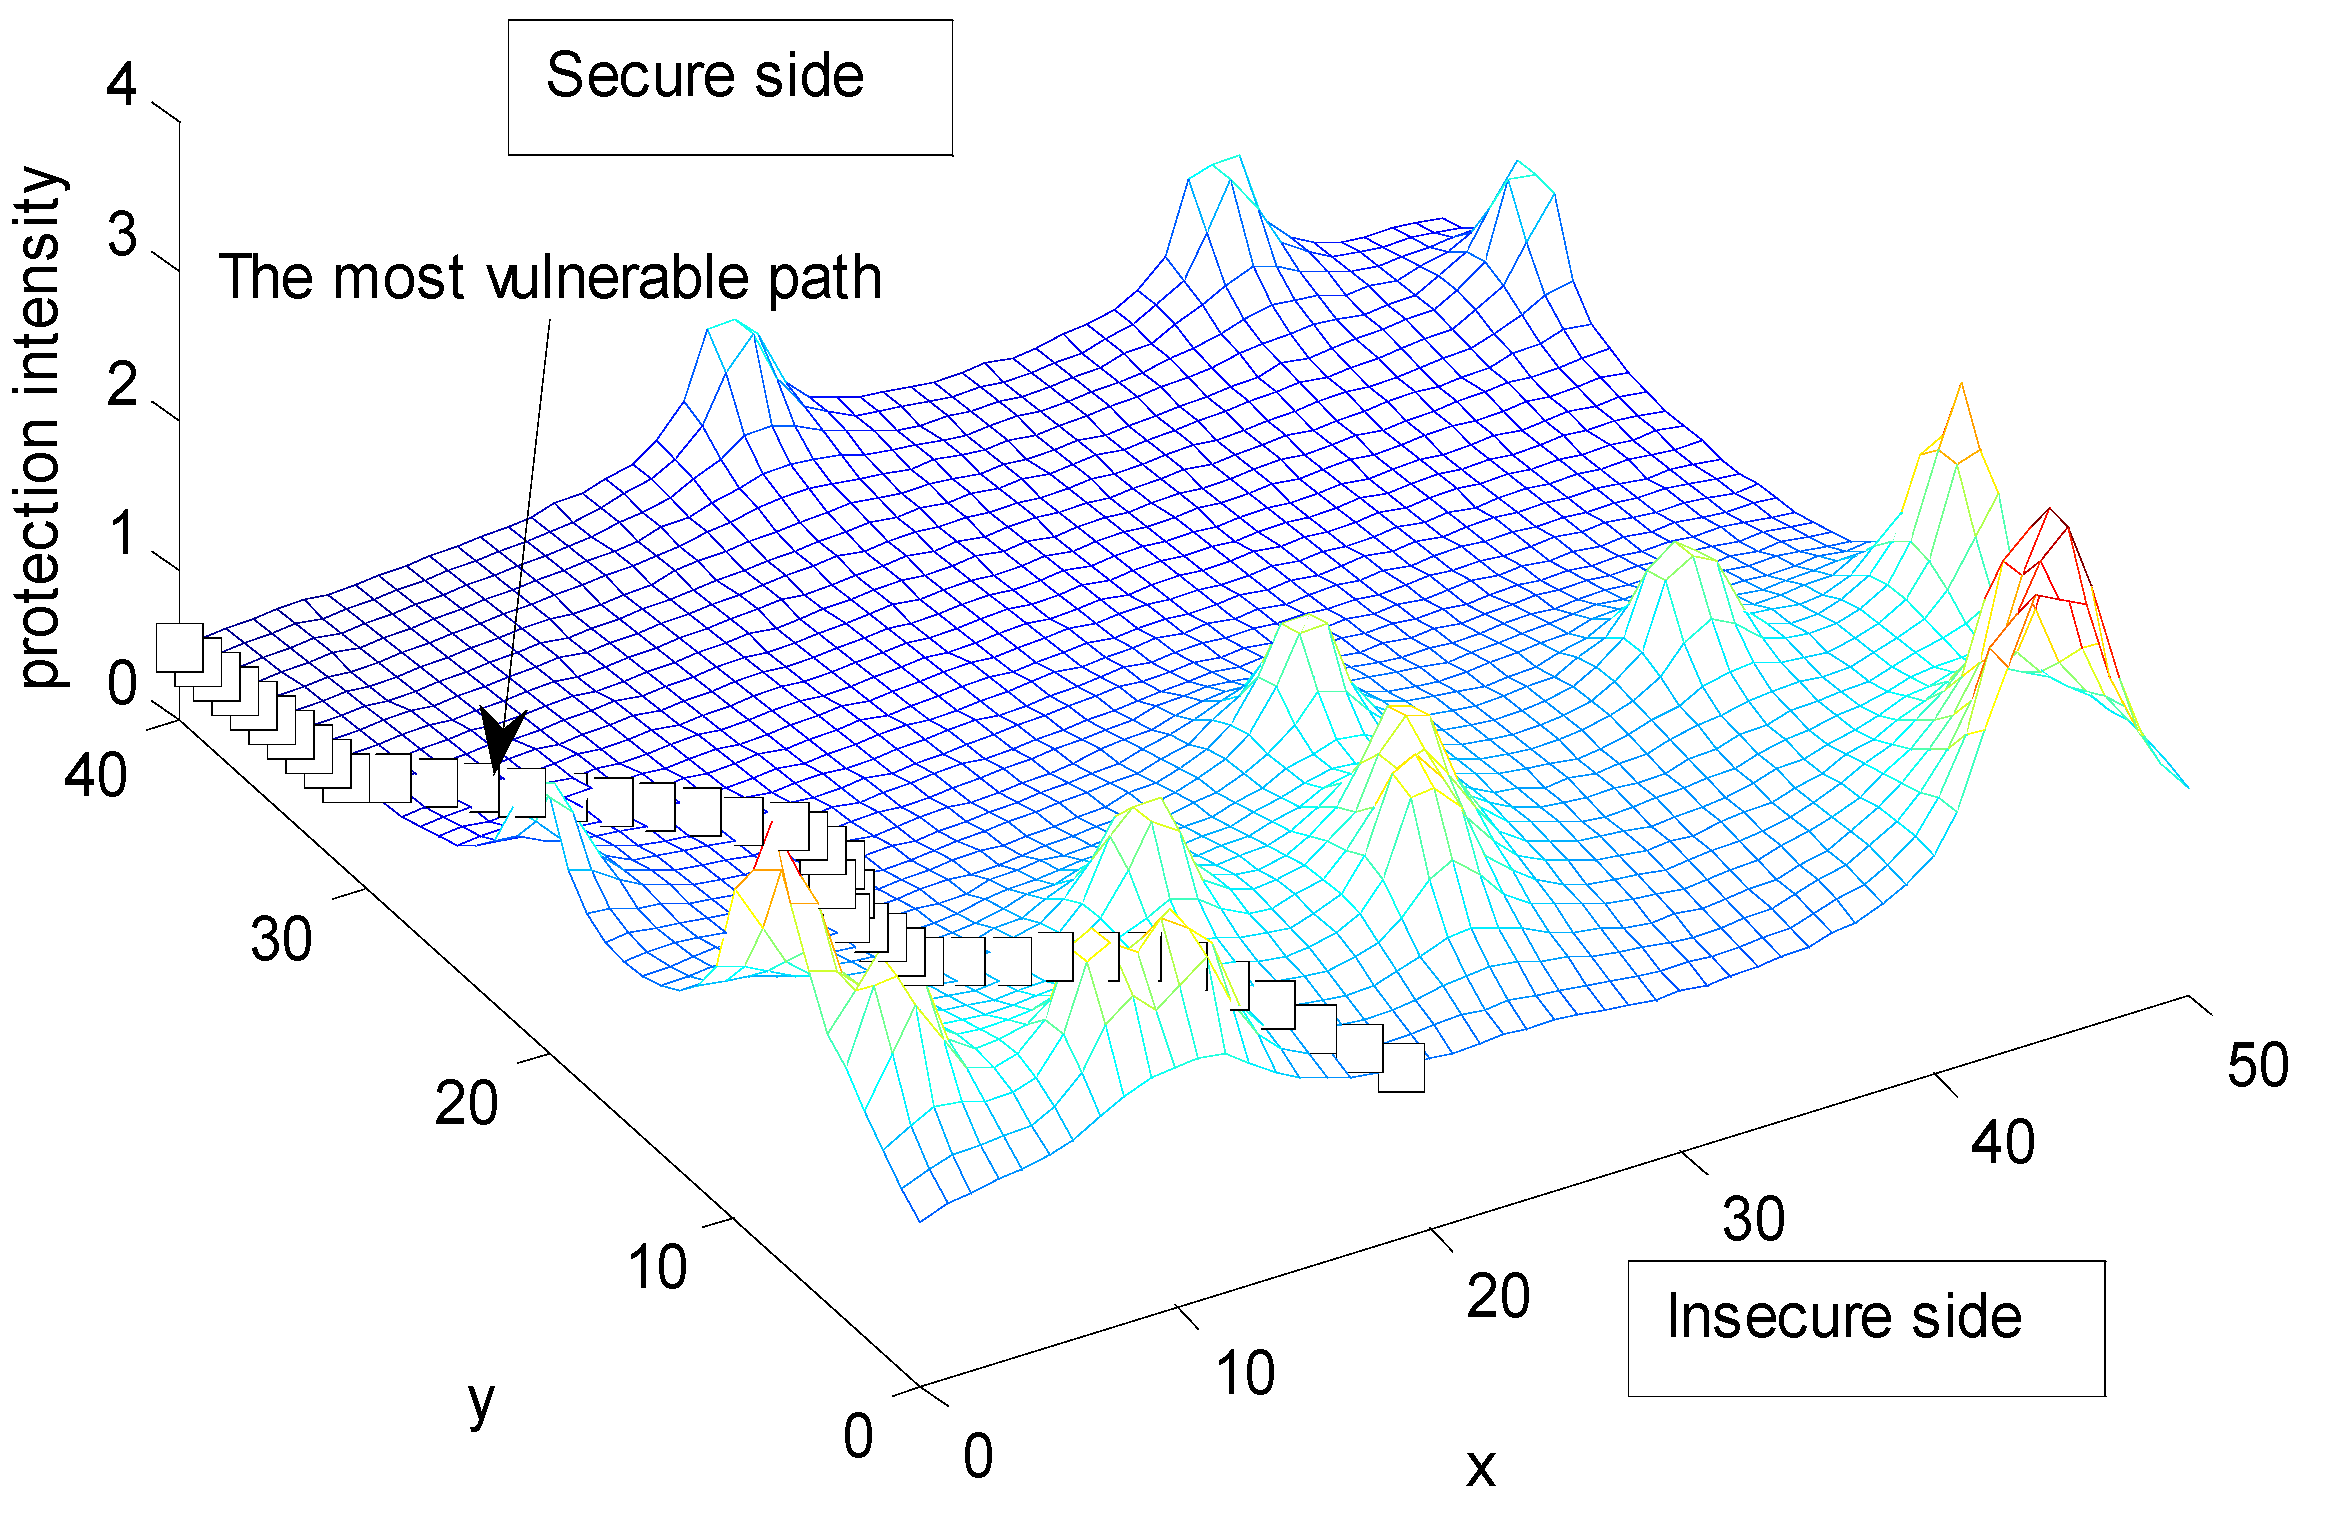
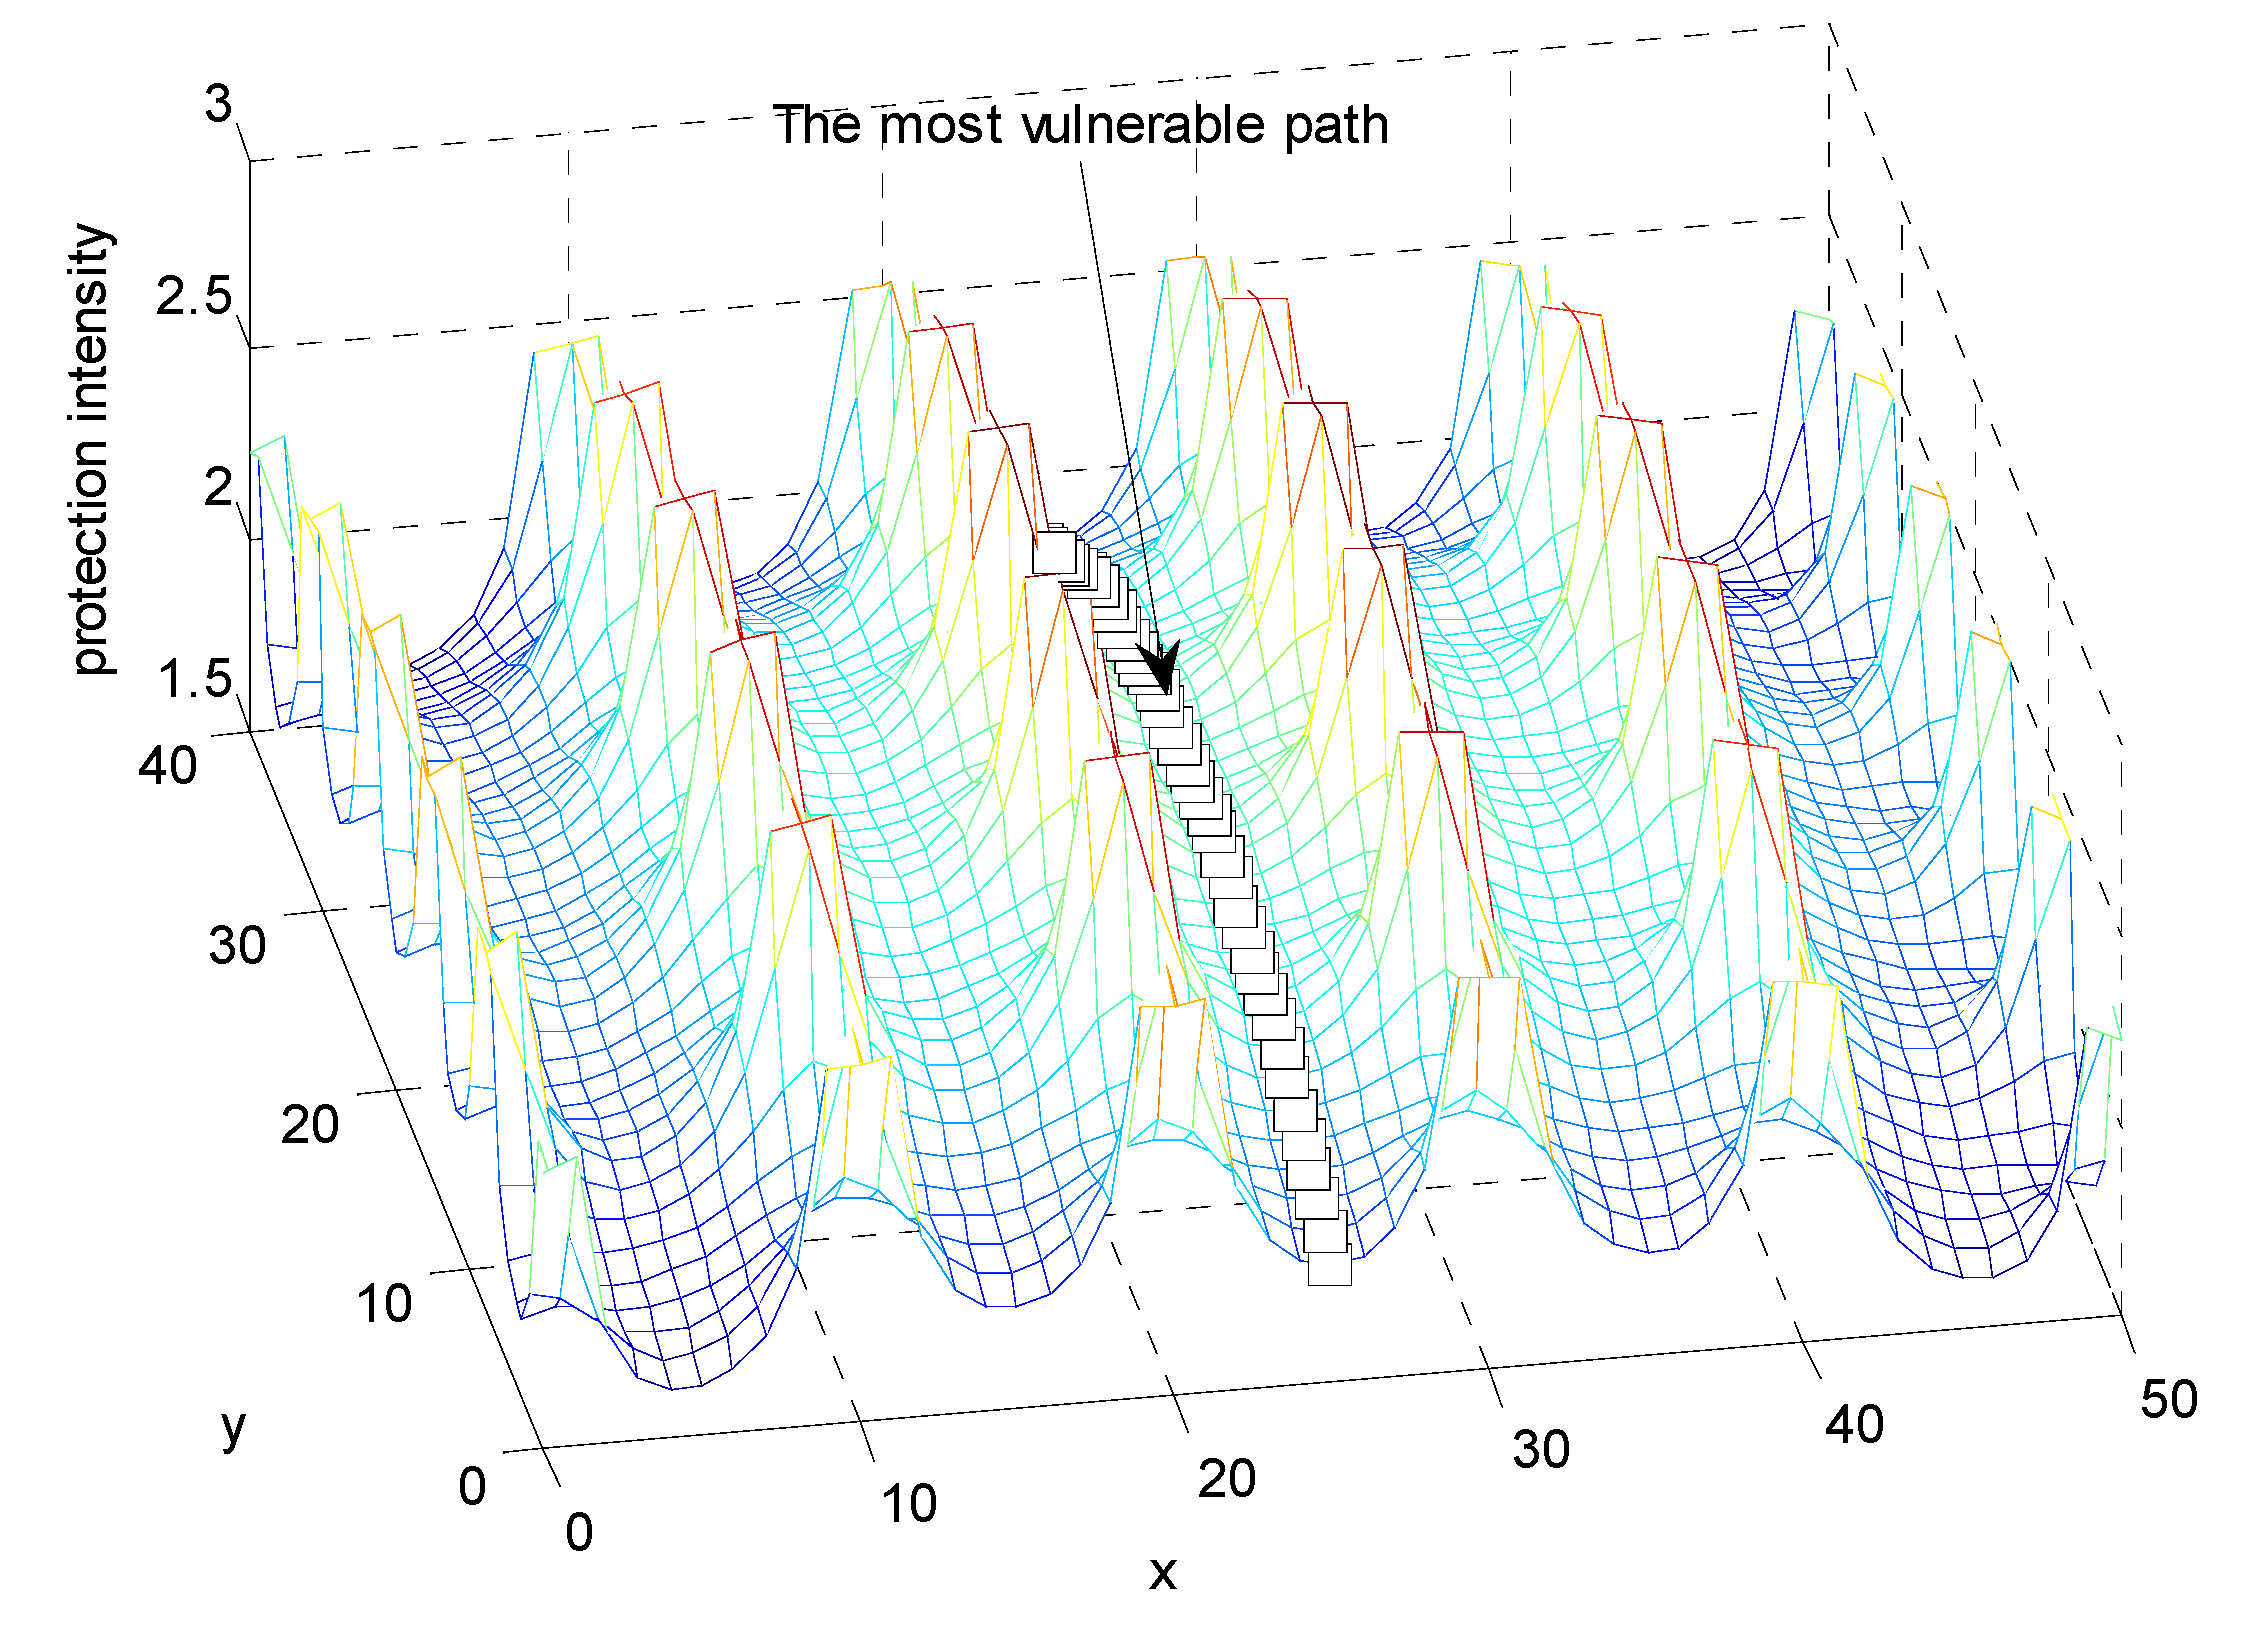
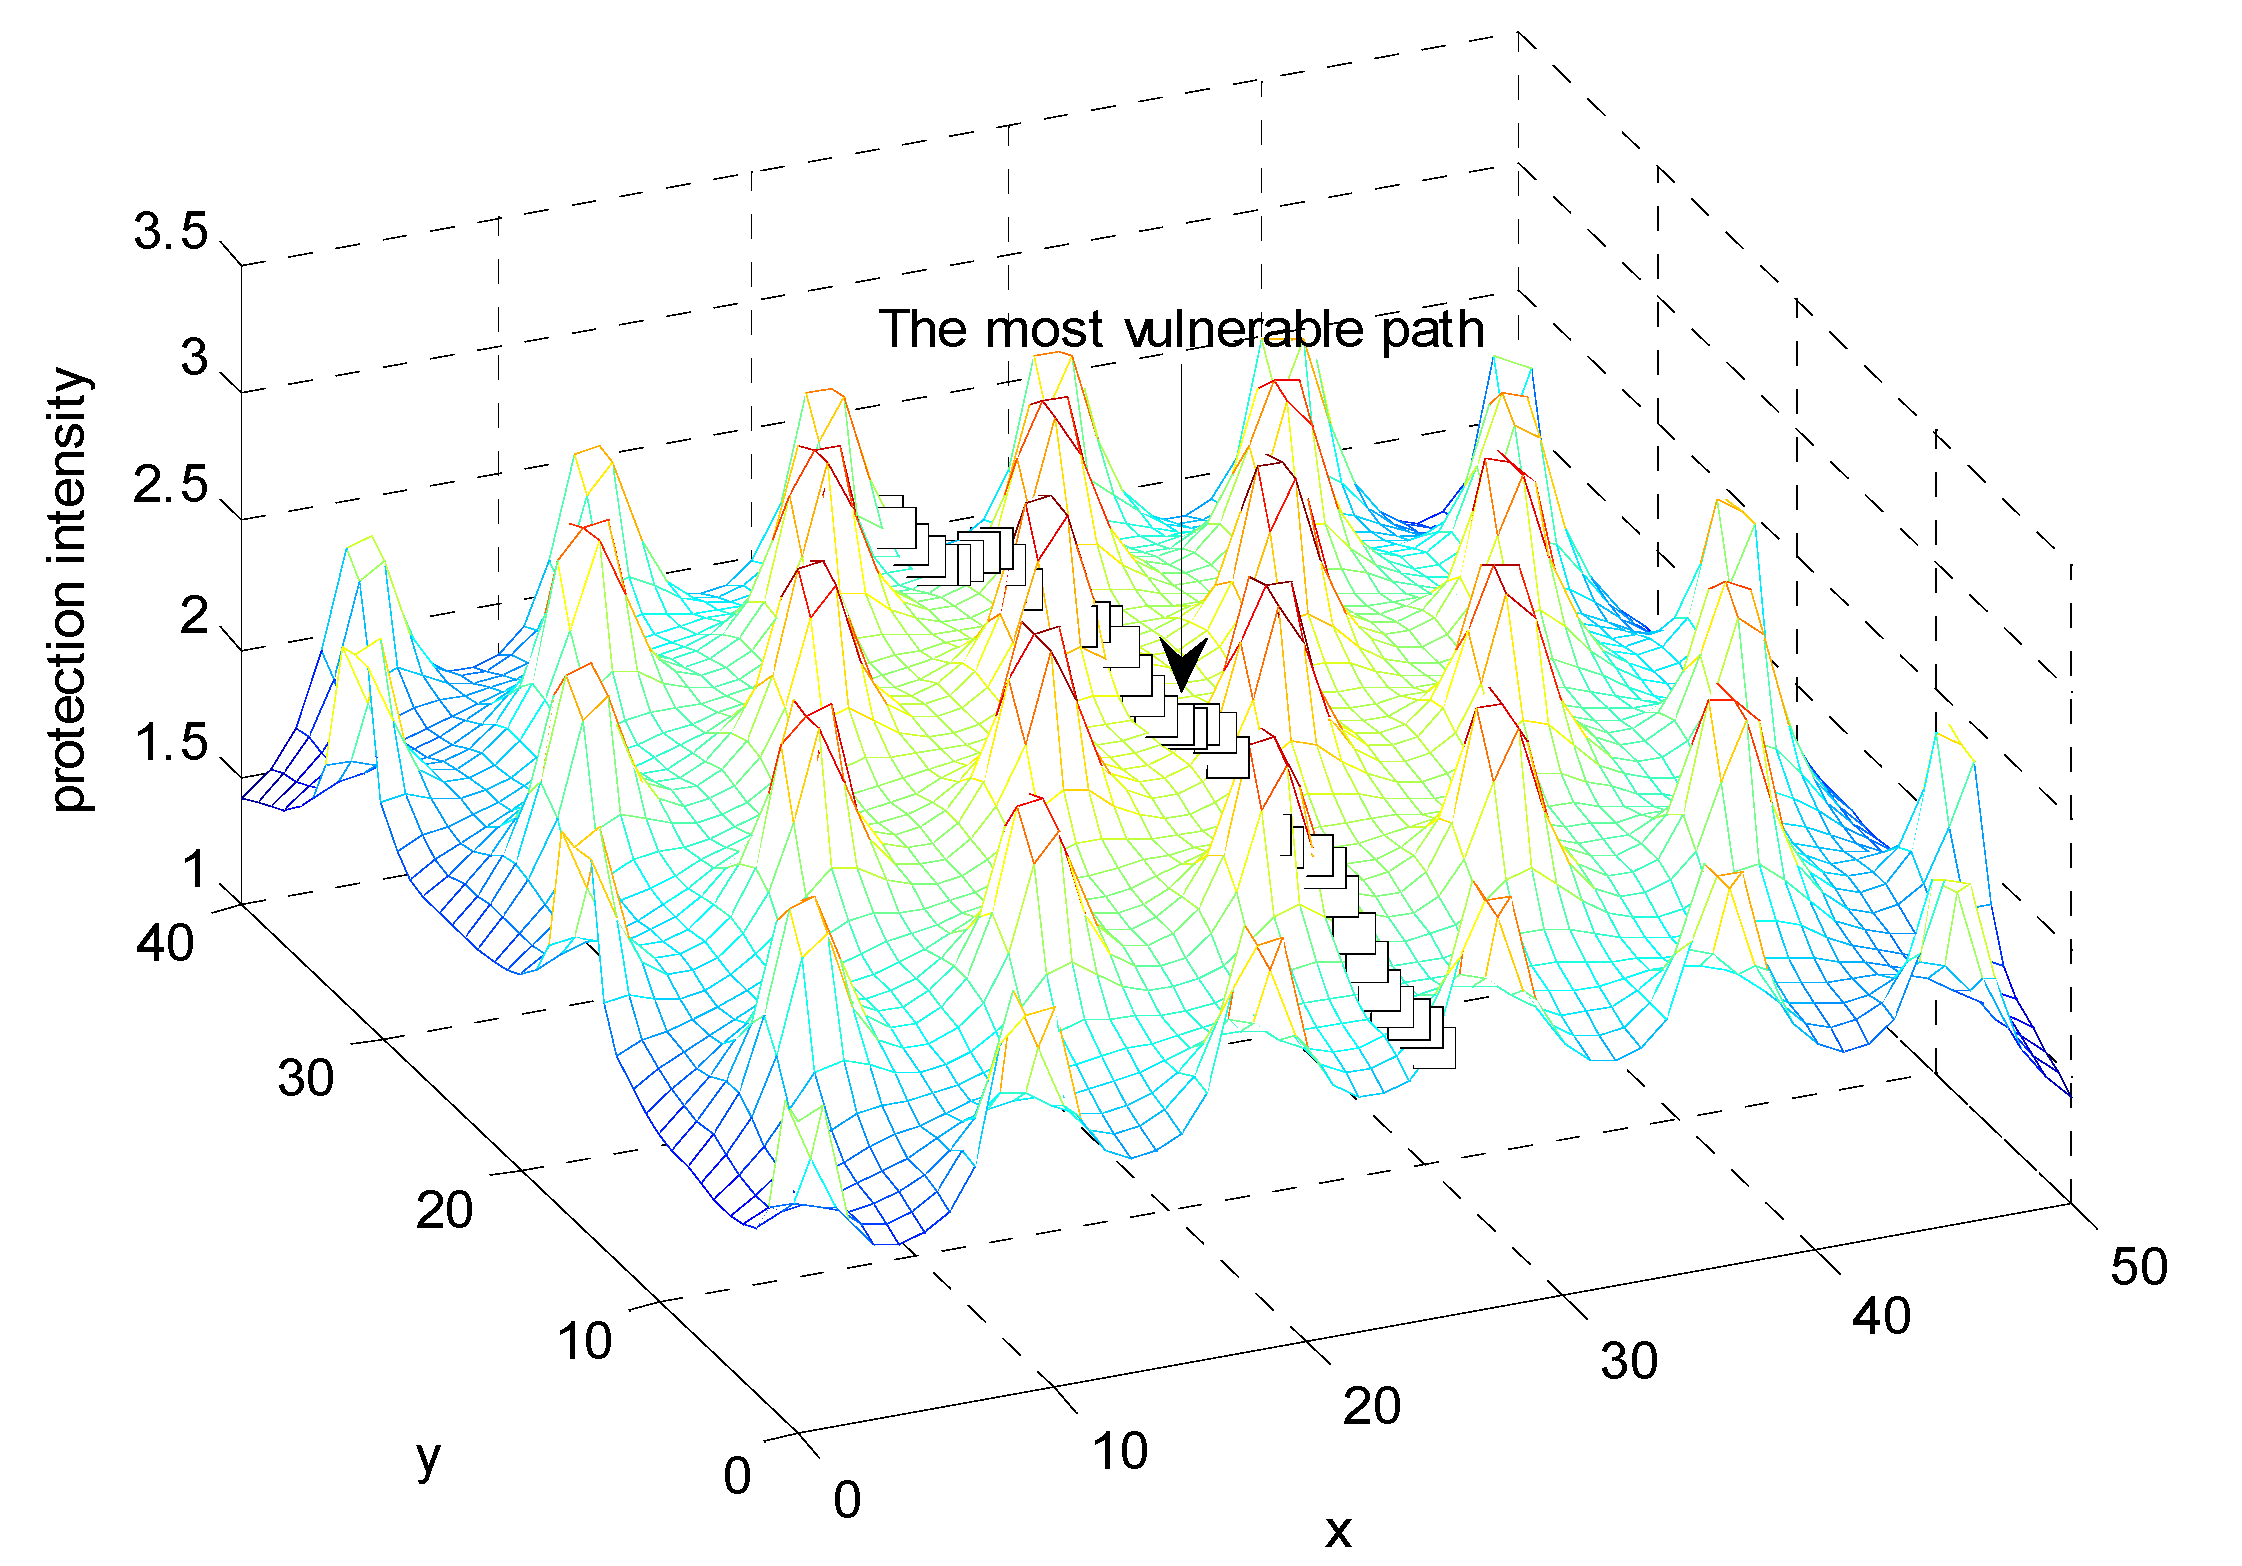
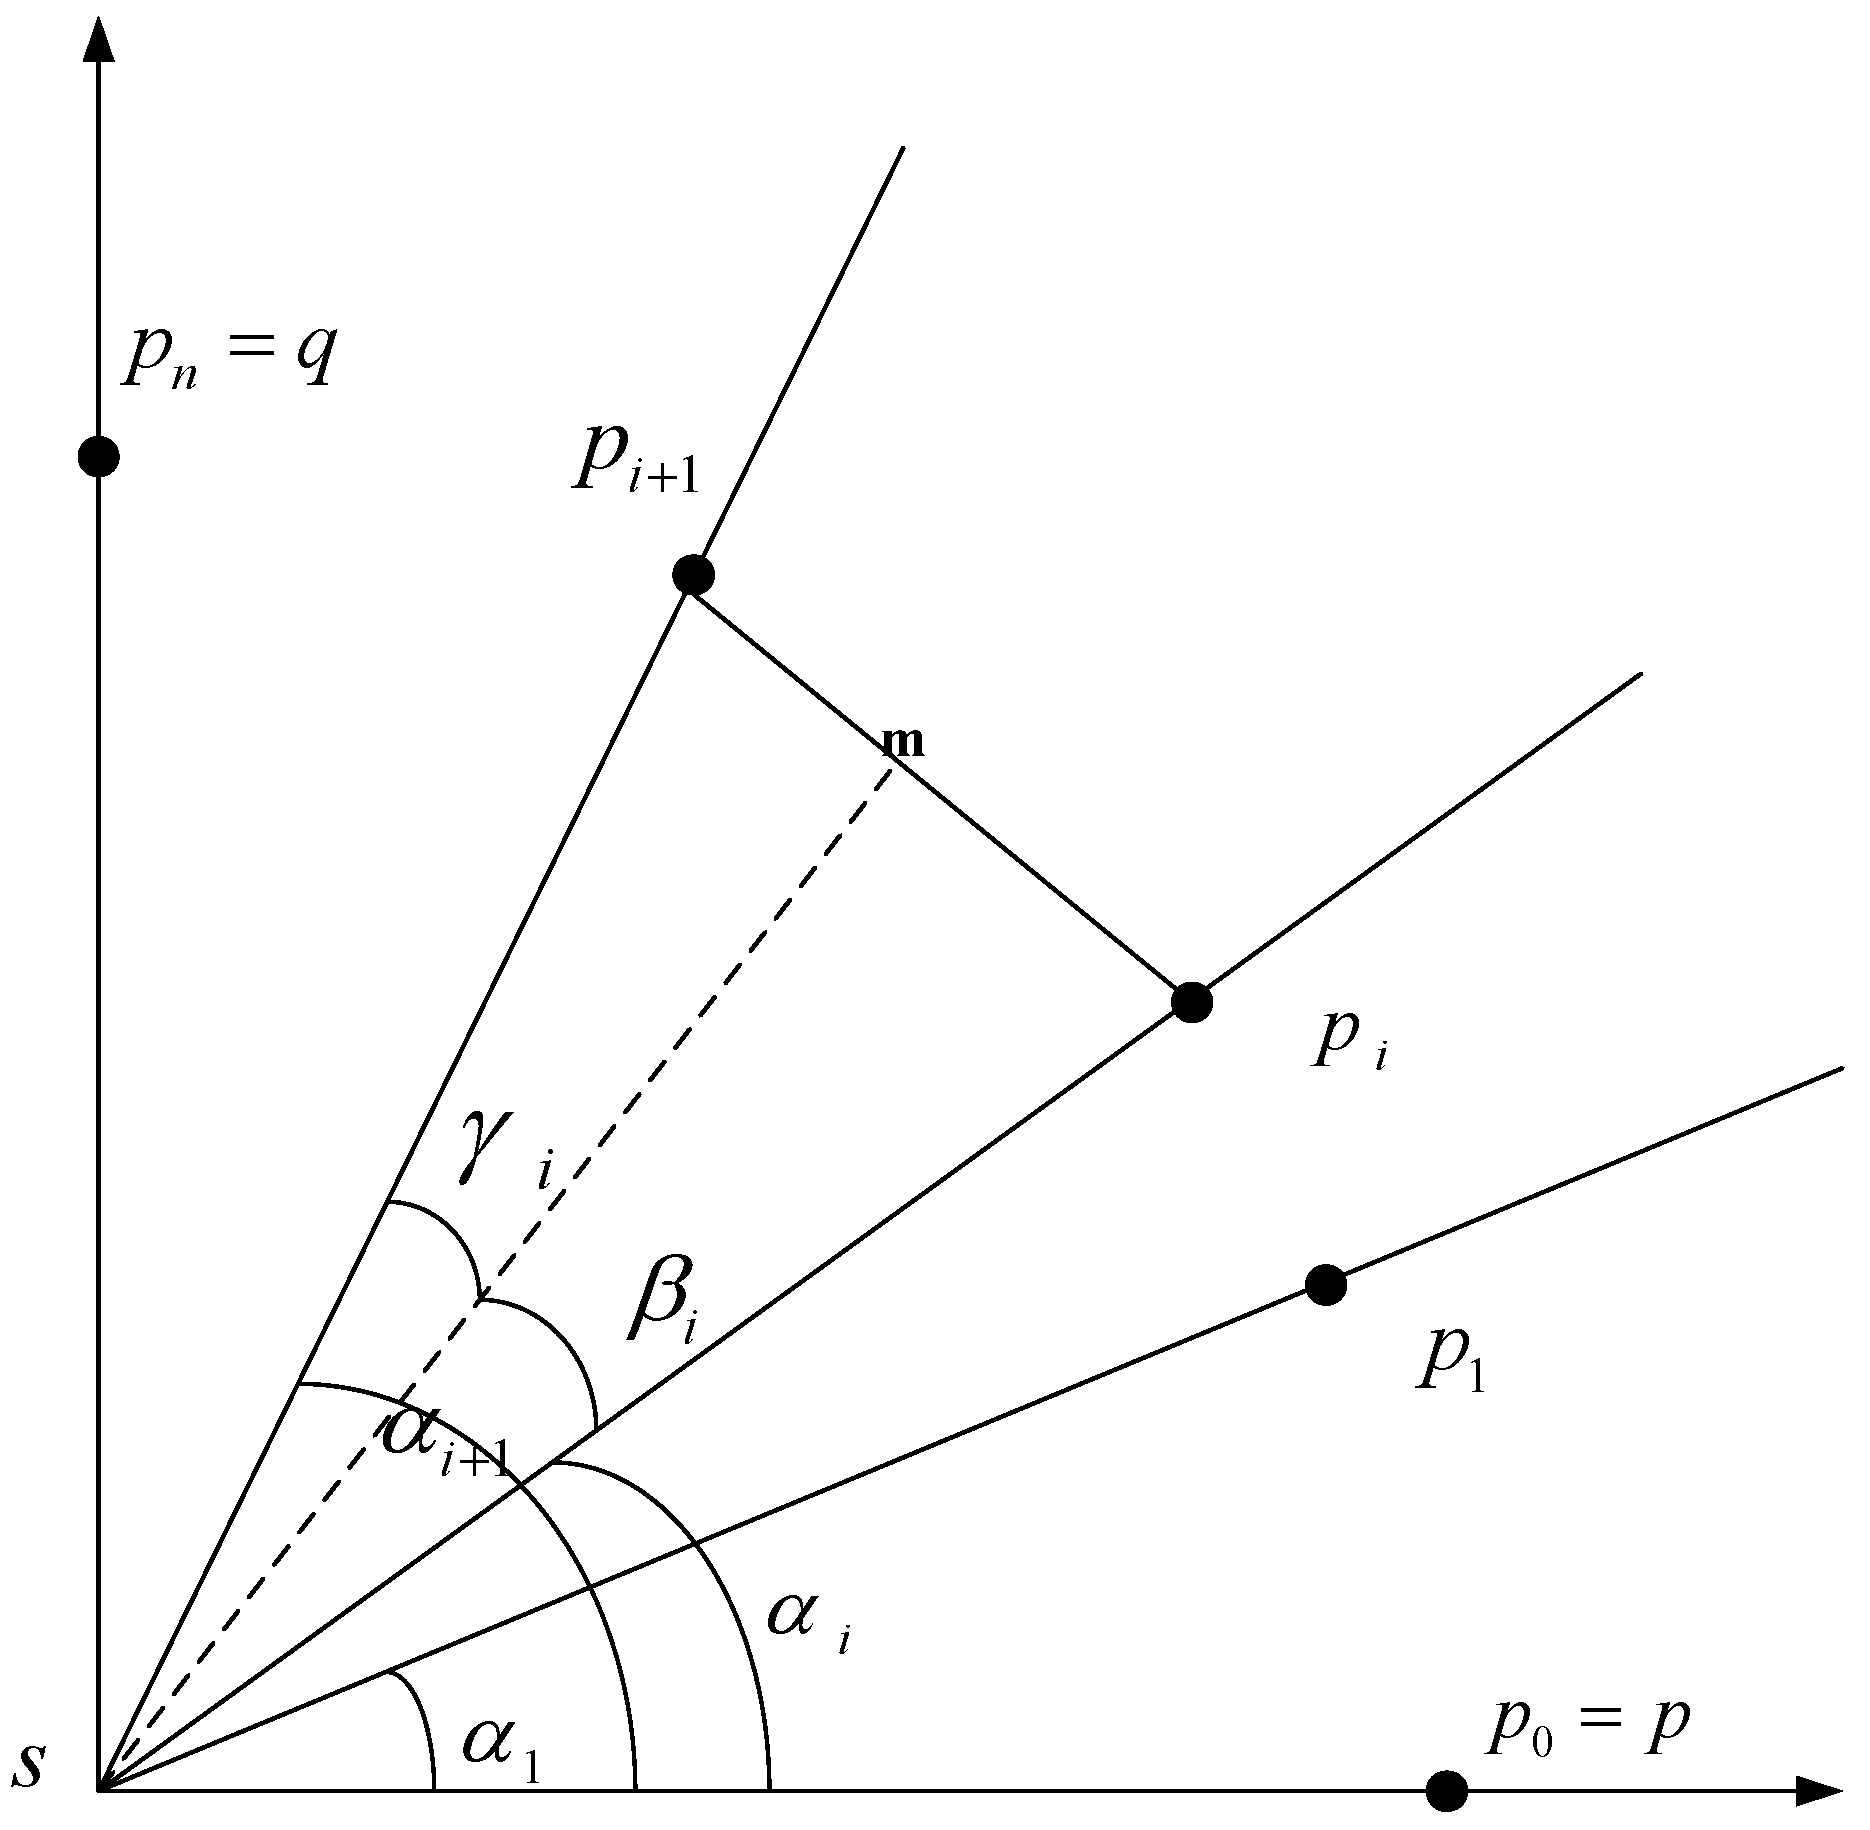
4.3. Path Protection Intensity

Path protection intensity is used to quantitatively evaluate how well a security network can protect a moving object. Obviously, a path with maximum path protection intensity is safest, whereas it is weakest. Suppose an object O is moving in the guard field F from point p(t1) to point p(t2) along the curve (or path) p(t) during the interval [t1,t2]. The protection intensity of this movement can be defined as follows:
Entropy 15 02766 i009
where the protection intensity J(F,p(t)) can either be JA(F,p(t)) or JC(F,p(t)) and dp(t)/dt is the element of arc length. For example, if p(t) = (x(t),y(t)), then:
Entropy 15 02766 i010
We start our discussion on path protection intensity by considering the simplest case. Suppose that there is only one security system at position (0,0) whose protection effectiveness is 1. The protection intensity function at point p(x,y) is expressed as follows:
Entropy 15 02766 i011
We study the question of how to travel from point p(1,0) to point q(x,y) with the minimum exposure, i.e., The continuous function E is minimized, which is defined as follows:
Entropy 15 02766 i012
Note that here the Closest Security Systems Field Intensity is equal to the All Security Systems Field Intensity, the protection effectiveness of the security system is supposed to be 1, and the parameter k is also supposed to be 1.
Lemma 1. If q = (1,0), then the minimum protection intensity path is Entropy 15 02766 i013, and the protection intensity along the path is Entropy 15 02766 i014.
Proof. Consider the lines that start from the origin, where the security system s is located, and intersect the x-axis, where the object is located, at angle αi, such that:
Entropy 15 02766 i015
.
Clearly, the path from point p(1,0) to q(0,1) with minimum protection intensity will intersect each line in order and only once. Let pi be the intersection point. The line segments pipi+1 is used to approximate the path between points pi and pi+1.
Draw lines perpendicular to line segments pipi+1 from origin s and name the intersection point m. The angles ∠pism and ∠pi+1sm by βi and γi as shown in Figure 5.
Figure 5. Proof for lemma 1.
Entropy 15 02766 g005
One can verity that the protection intensity from pi to m along the line segment is:
Entropy 15 02766 i016
where l is the distance between points m and pi. Similarly, we can get the protection intensity from m to pi+1 is:
Entropy 15 02766 i017
Therefore, the exposure of traveling from point pi to pi+1 is:
Entropy 15 02766 i018
Notice that since βi + γi = αi+1αi, which is a constant for a given set of:
Entropy 15 02766 i015
this protection intensity will be minimized if and only if βi = γi, which implies that the distance between s and p is equal to the distance between s and q. In other words, to reach the No. (i+1) line, which intersects the x-axis with angle , αi+1 from point pi, the best way is to move towards point pi+1 with the minimum protection intensity, the point that has the same distance from the security system as pi does.
As n → ∞, we can conclude that if the destination point q = (0,1), then the minimum protection intensity path is the quarter circle from p = (0,1) to q = (0,1) with center (0,0) and radius is equal to 1. This path can be expressed as Entropy 15 02766 i019.
Thus, the protection intensity is equal to:
Entropy 15 02766 i020
Notice that in the above proof, it is not necessary to have the starting point and ending point at (1,0) and (0,1). The only fact we utilize them is that they have the same distance to the security system. In general, we can get a theorem as follows:
Given a security system s and two points p and q, such that d(s,p) = d(s,q), then the minimum protection intensity path between p and q is the arc that is part of the circle centered on s and passing through p and q.

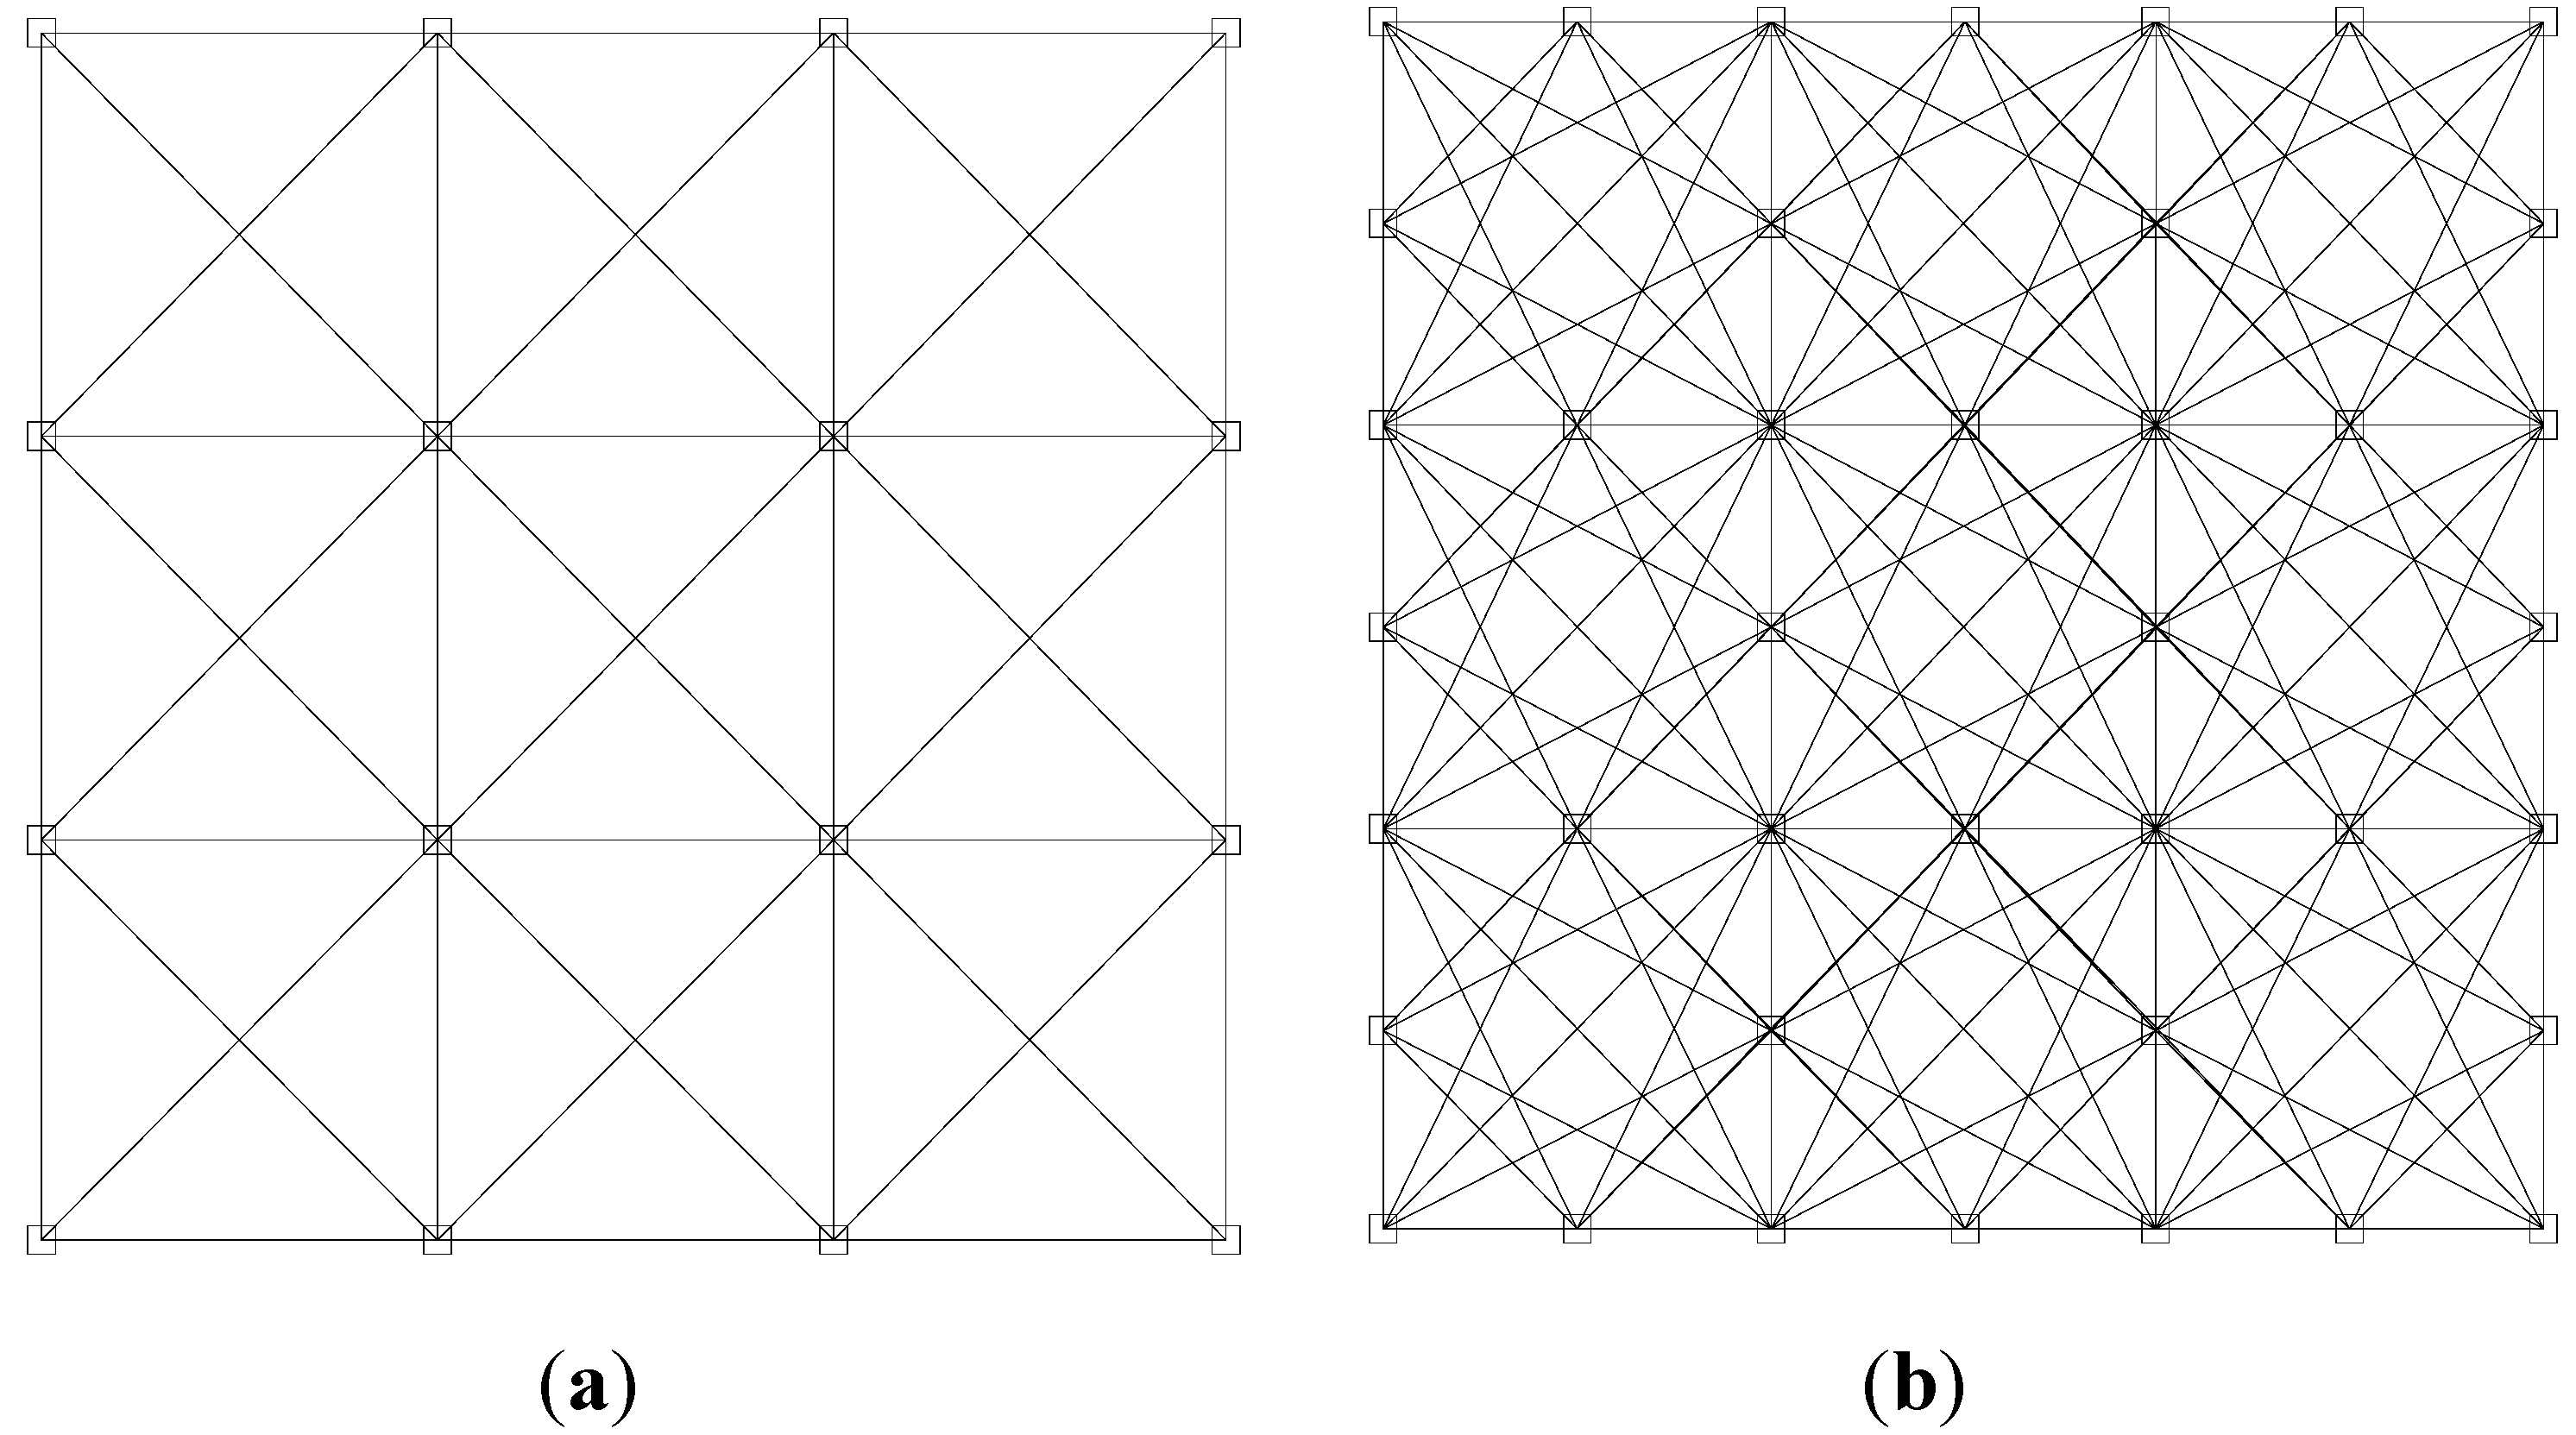
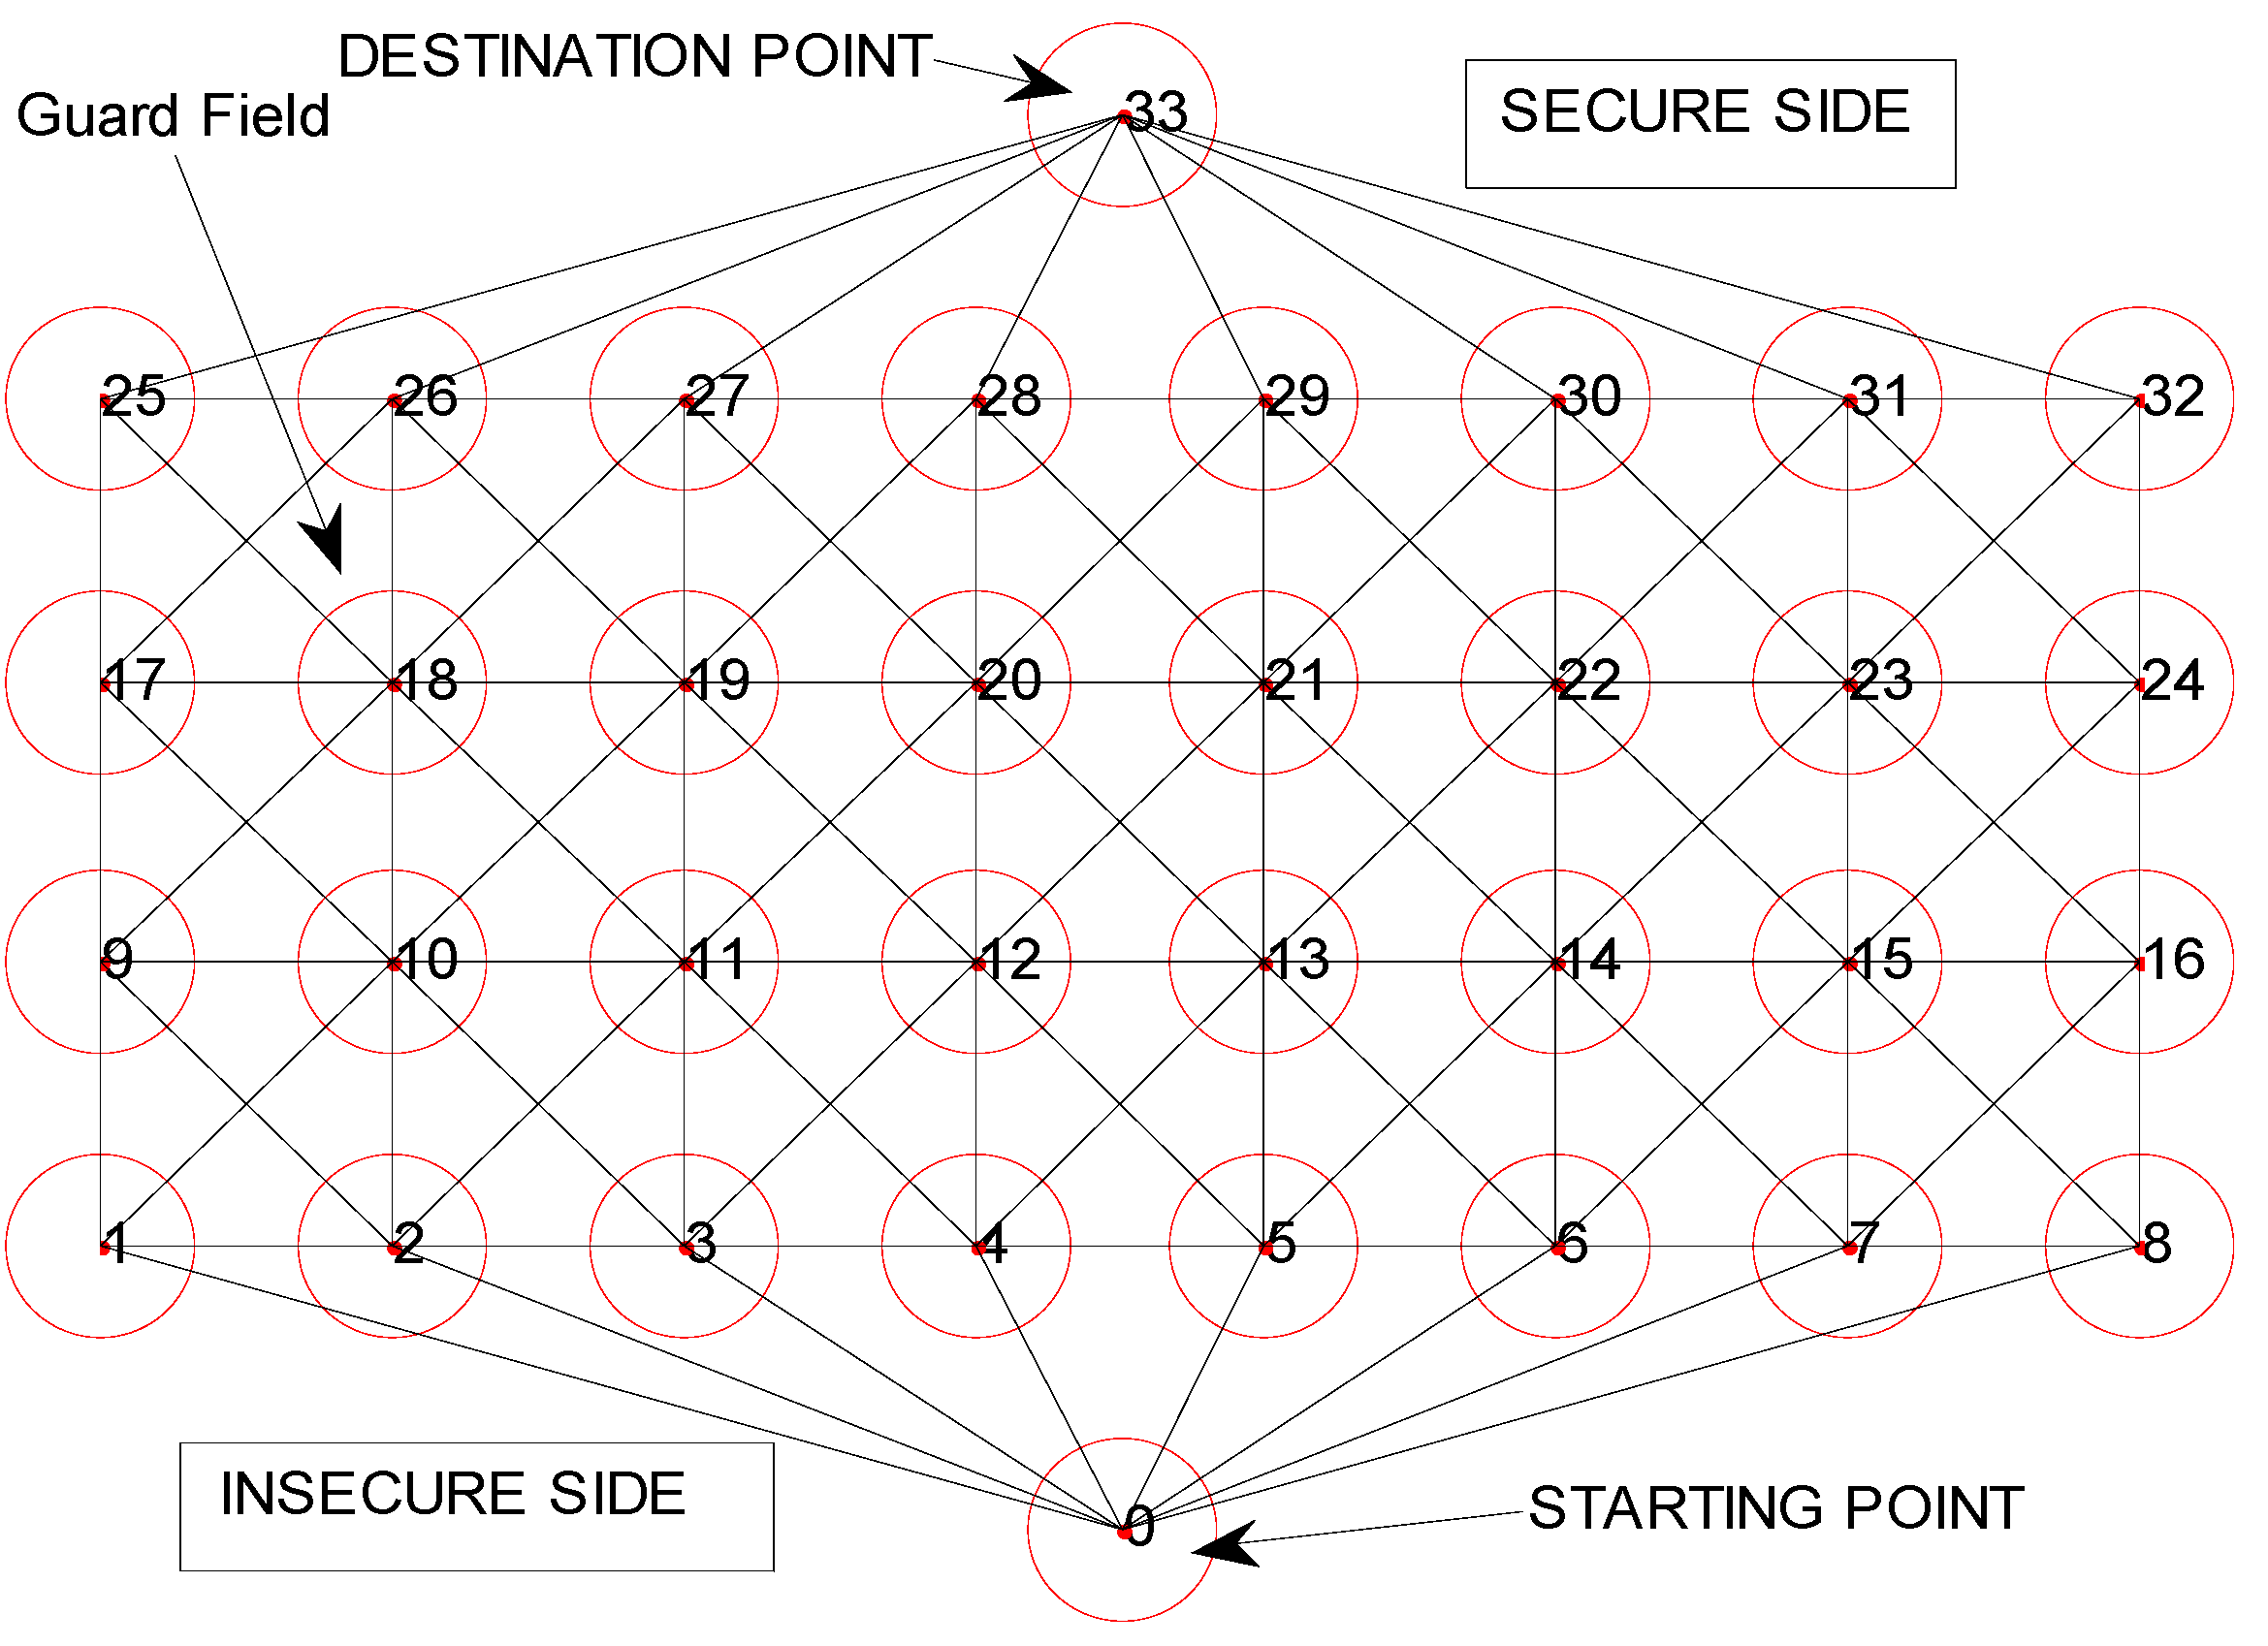
5. An Algorithm for Calculating Minimal Protection Intensity Path

The domain of protection intensity problem is continuous, so the protection intensity expression often does not have an analytic or closed form or solution. To address these characteristics, the algorithm proposed in this section has three main hypotheses:
(1)
Transform the continuous problem domain to a discrete one;
(2)
Apply graph theoretic abstraction;
(3)
Compute the minimal protection intensity path using Dijkstra’s Single Source Shortest Path algorithm.
We transform the problem domain to a tractable discrete domain through a generalized grid approach. For the sake of clarity, we restrict our subsequent discussion to the two-dimensional space. In the grid-based approach, the guard field is divided by an n × n square grid and limit the existence of the minimal protection intensity path within each grid element. In the simplest case, the path is forced to exist only along the edges and the diagonals of each grid square as shown in Figure 6a, which is called the first-order grid. However, since the minimal protection intensity path can travel in arbitrary directions through the guard field, it is easy to see that higher order grid structures such as the second-order shown in Figure 6b can improve the accuracy of the final solution.
Figure 6. (a) First-order. n = 3, m = 1; (b) Second-order. n = 3, m = 2.
Entropy 15 02766 g006
As can be deduced from Figure 6, the m-order grid can be constructed through placing m + 1 equally spaced vertices along each edge of a grid square. The minimal protection intensity path is restricted to straight line segments connecting any two of the vertices in each square. It is easy to verify that as n → ∞ and m → ∞, the solutions produced by the algorithm approaches the optimum, at the cost of run-time and storage requirements. The algorithm put forward in this paper can be described as follows:
Function Minmal_Protection_Intensity_Path (F, ps, pd)
{
FD(V,L)= Generate_Grid(F,n,m)
Init Graph G(V,E)
 For all viFD
Add vertex v i to G
 For all li(vj,vk) ∈ L
Add edgeei ( v j , v k ) to G
ei·weight = protection_Intensity(li)
vs = find closest vertex to ps
ve = find closest vertex to pd
Min_protection_path = Single_Source_Shortest_Path(G,vs,ve)
}
The details of the algorithm are listed above. After generating the grid FD, the next step is to transform FD to the edge-weighted graph G. This is accomplished by adding a vertex in G corresponding to each vertex in FD and an edge corresponding to each line segment in FD. Each edge is assigned a weight equal to the exposure along its corresponding edge in FD, calculated or approximated by the protection_Intensity function. This function calculates the exposure along the line segment using numerical integration techniques and can be implemented in a variety of ways. In our implementation, the simple trapezoidal rule is used in this function. We use the pseudo-code above, Dijkstra’s Single-Source-Shortest-Path algorithm to find the minimal exposure path in G from the given position psto the given destination pd.
Now, we will discuss the complexity of the algorithm. When the start points and end points of the path are initially known, the run-time of the algorithm is generally dominated by the grid generation process which has a linear run time over the total number of vertices in the grid FD. For a n × n grid with m divisions, the number of vertices in FD is n2(2m − 1) + 2 nm + 1, which means that the complexity of the algorithm is O(n2m).

6. Experimental Section

6.1. Grid Based Guard Field

In this section, experimental results based on Matlab will be presented and analysed. Without loss of generality, we consider the guard zone as a cross-connected and first-ordered grid. A sample field model is presented in Figure 7.
The guard field consists of the grid points and two auxiliary nodes which are the staring and the destination points. The aim of adversaries is to go through the guard field from the starting point that represents the insecure side to the destination point that represents the secure side. The horizontal axis is divided into N-1 and the vertical axis is divided into M-1 equal parts. Thus, there are N × M grid points plus the starting and destination points. For the sake of simplifying the notation, instead of using two dimensional grid point indices (xv,yv) where xv = 0,1,···,N − 1 and yv = 0,1,···,M − 1, we utilize a kind of one dimensional grid point index v which is calculated as v = yvN + xv + 1.
Figure 7. A sample field where the length is 8 m, the width is 4 m, and the grid size is 1 m.
Entropy 15 02766 g007
The index of the starting point is defined as v = 0, and the index of the destination point is v = NM + 1. We use the connection matrix cv,wC(NM + 2)×(NM + 2) to represent the connections of the grid points. The matrix cv,w is defined as:
Entropy 15 02766 i021
where D = {{−1,0,1}×{−1,0,1}} − {(0,0)} which is the set of possible difference-tuples of the two-dimensional grid point indices excluding v = w.

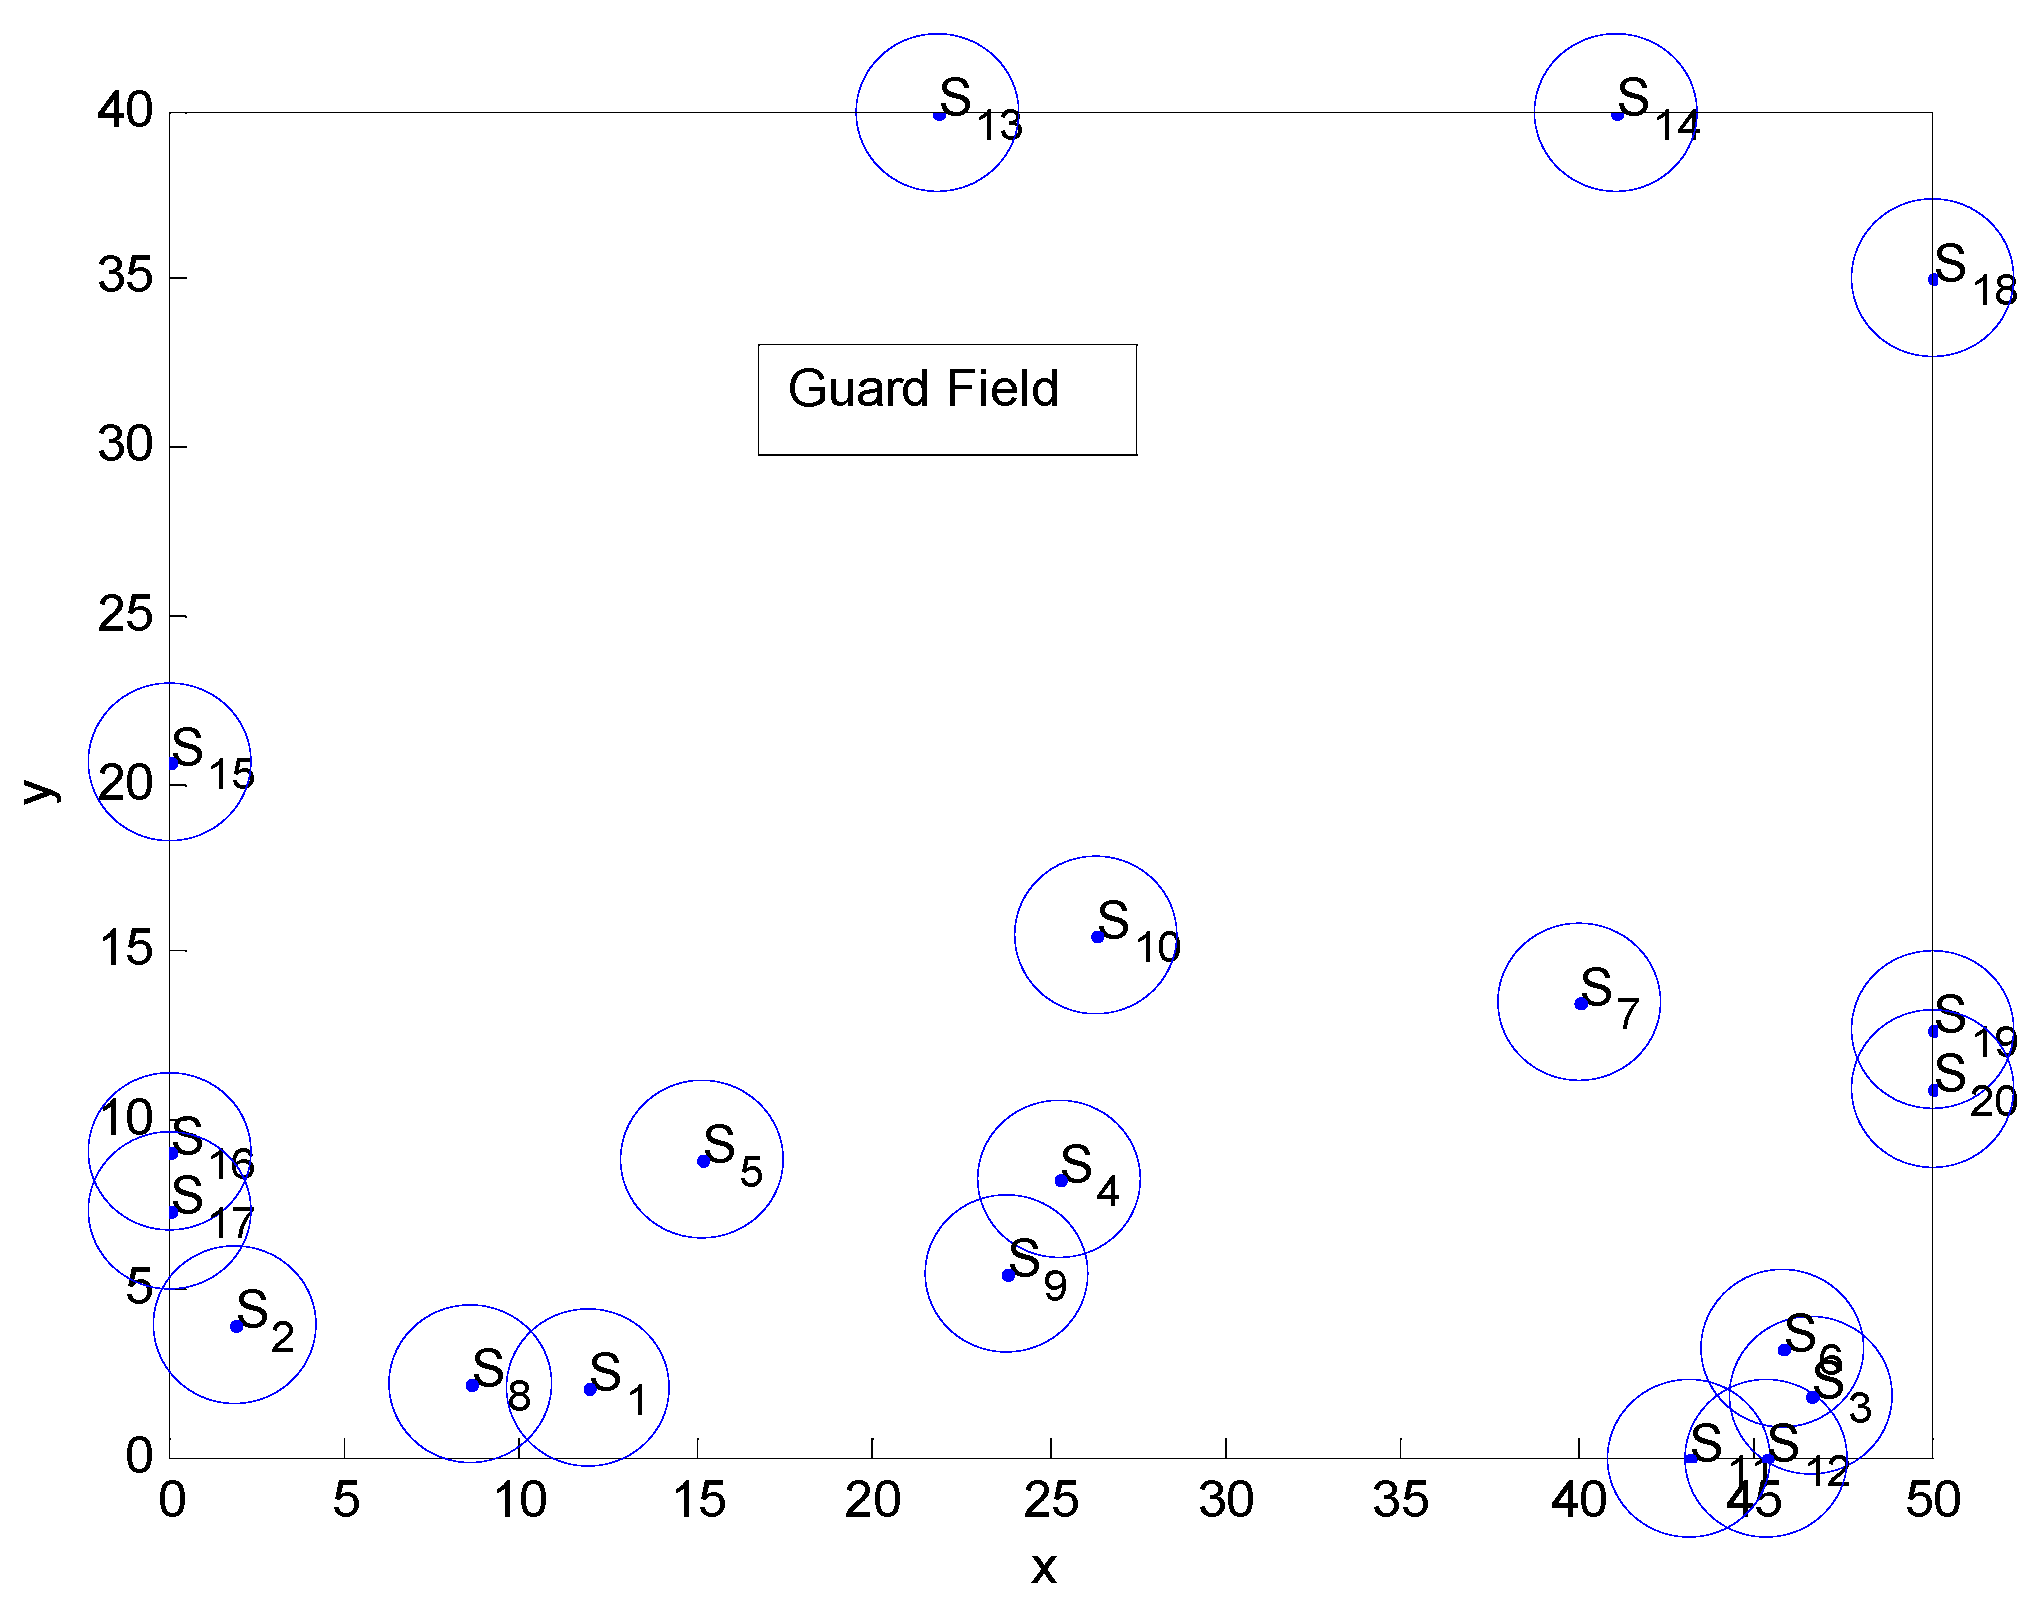
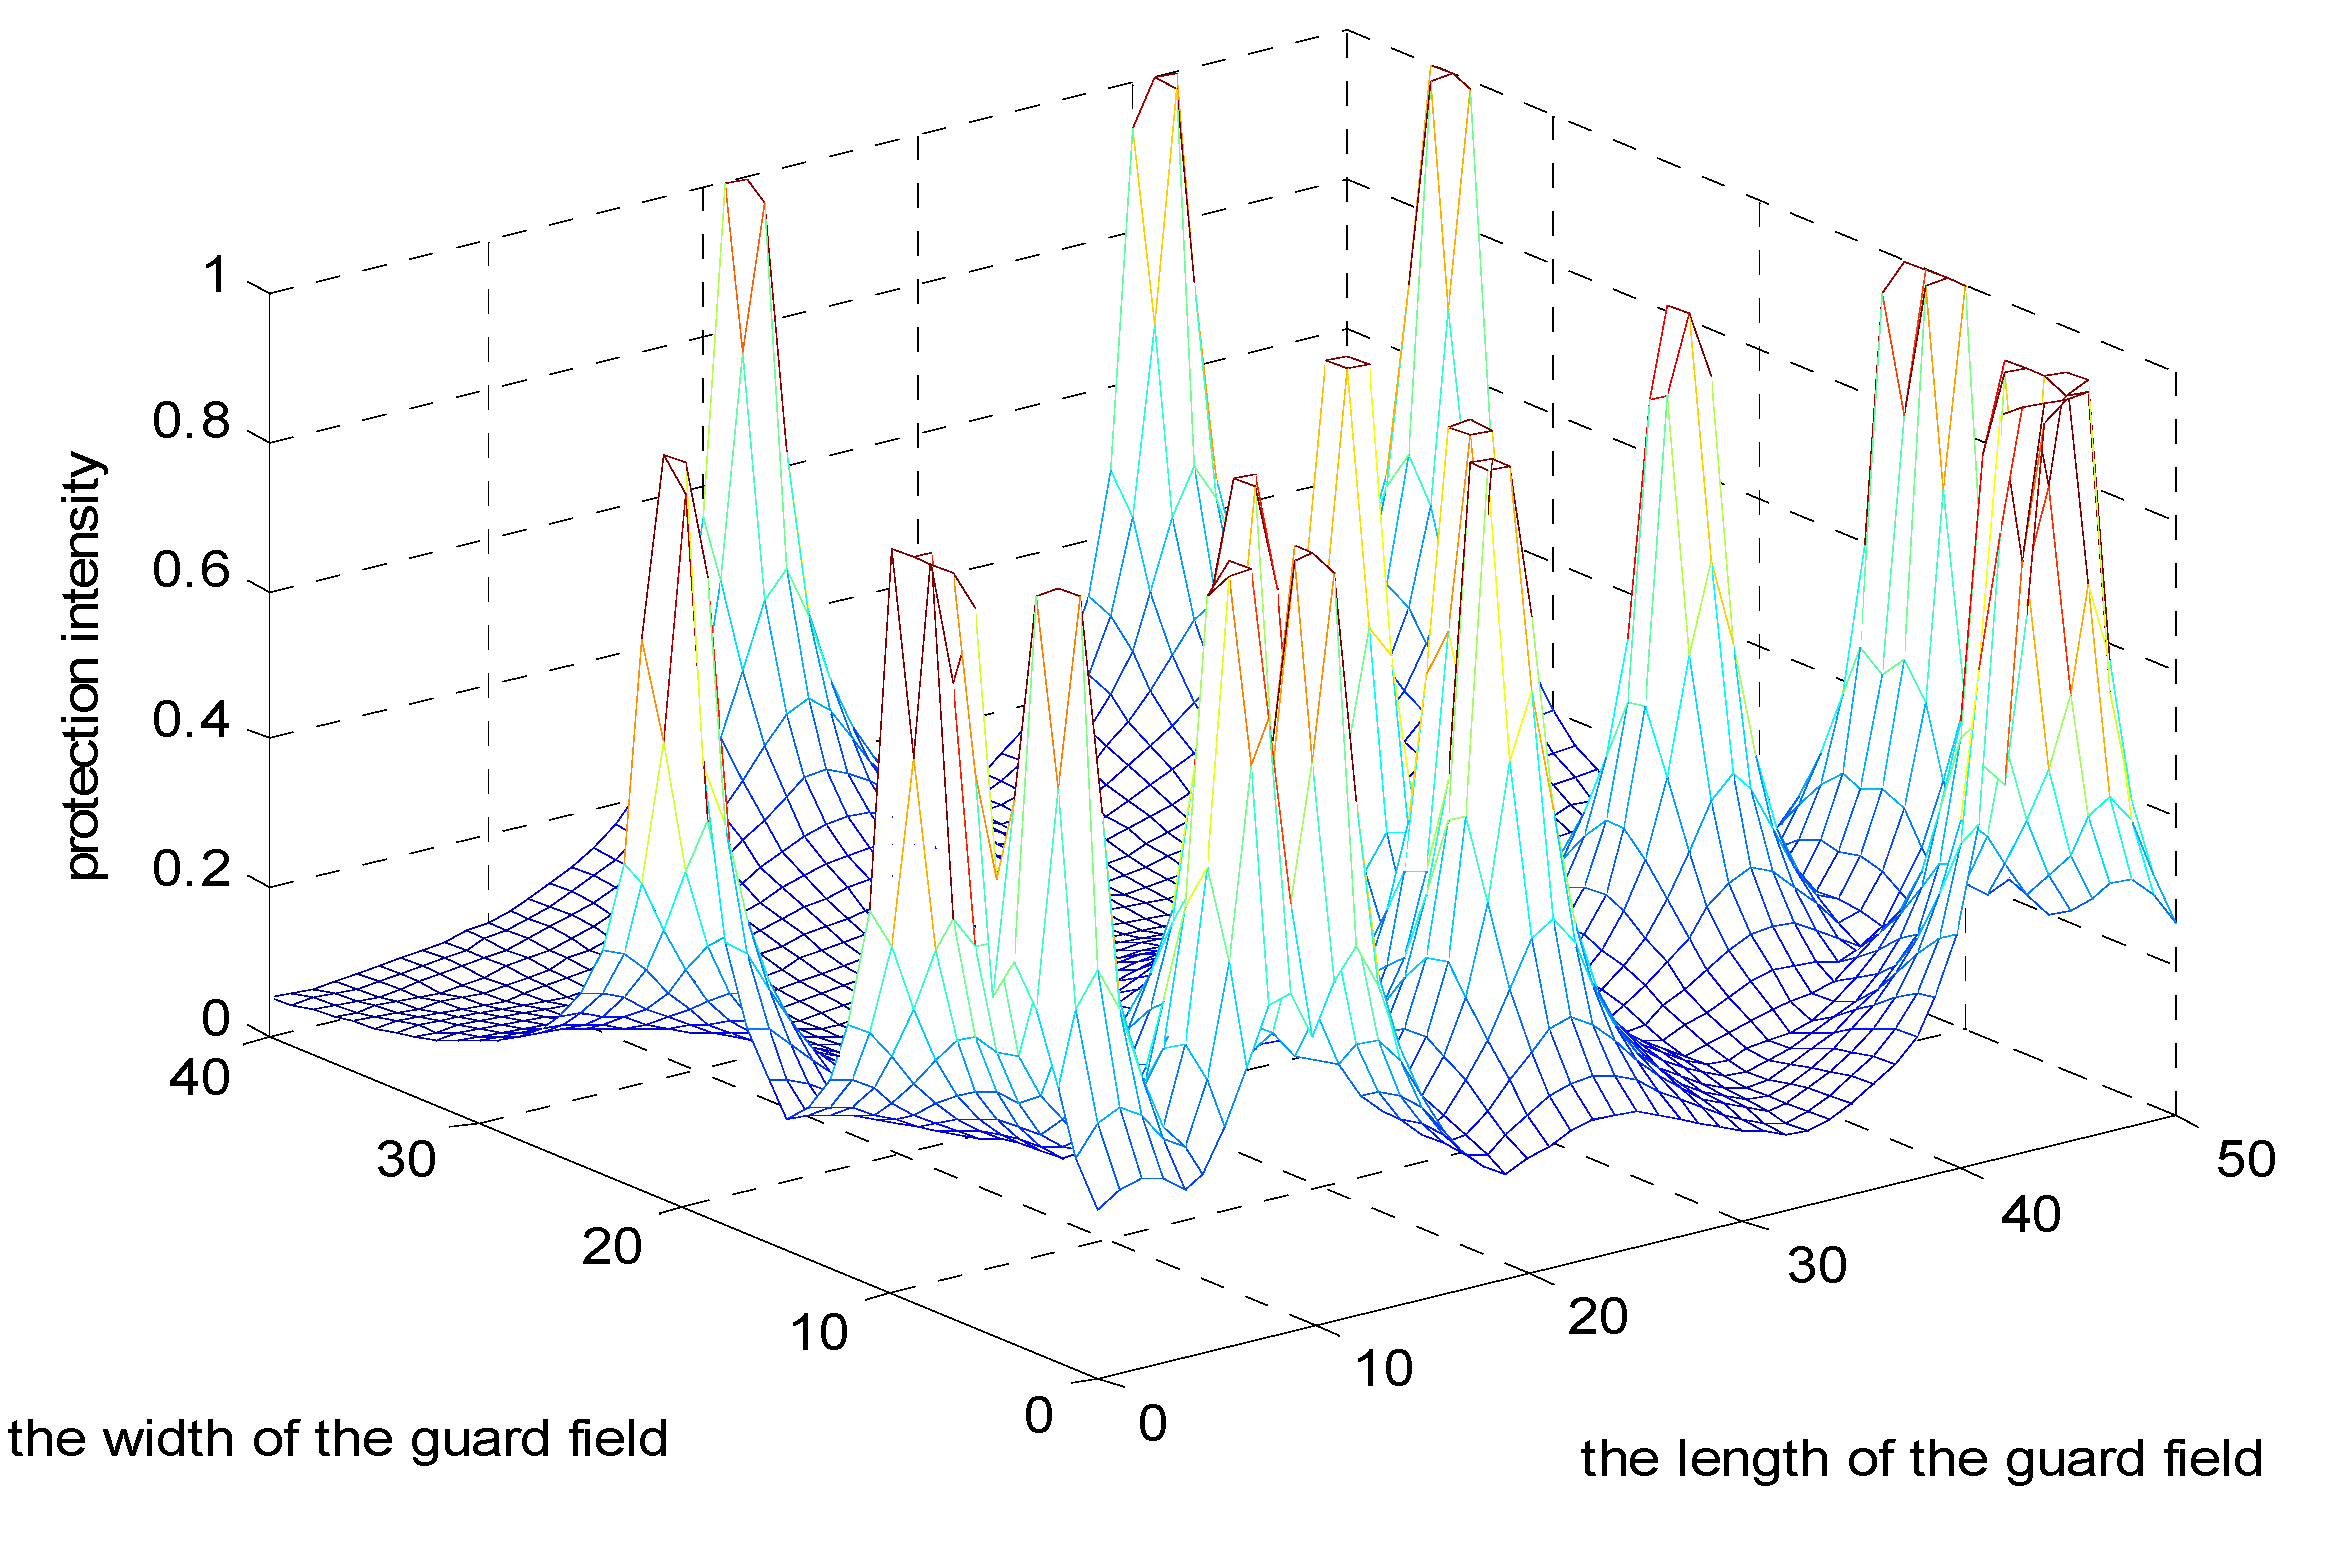
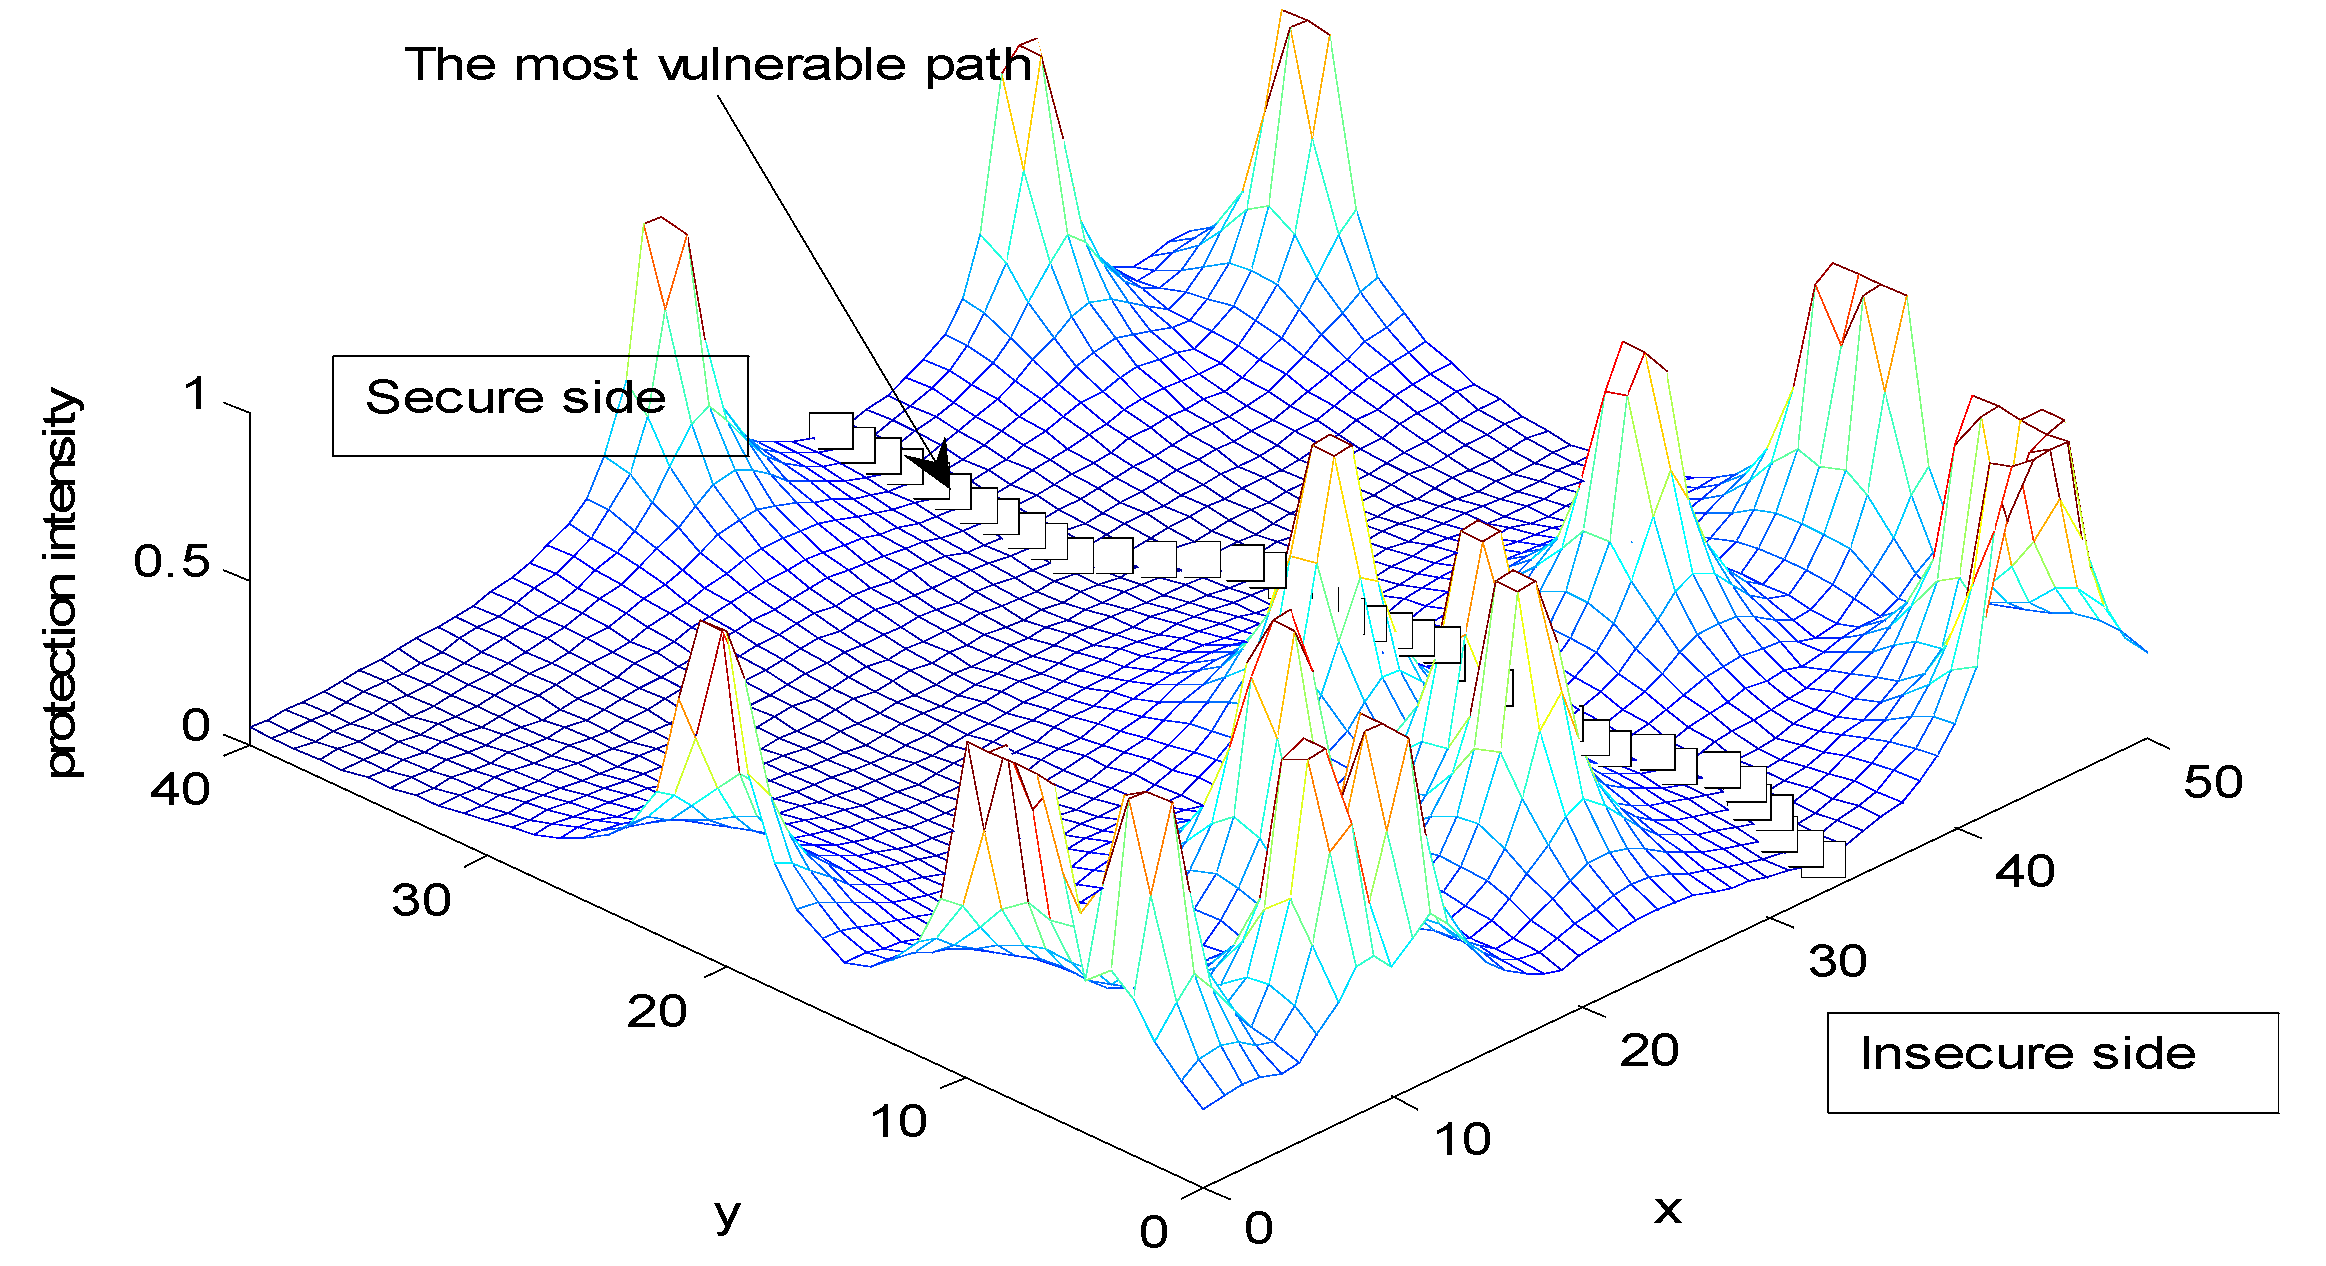
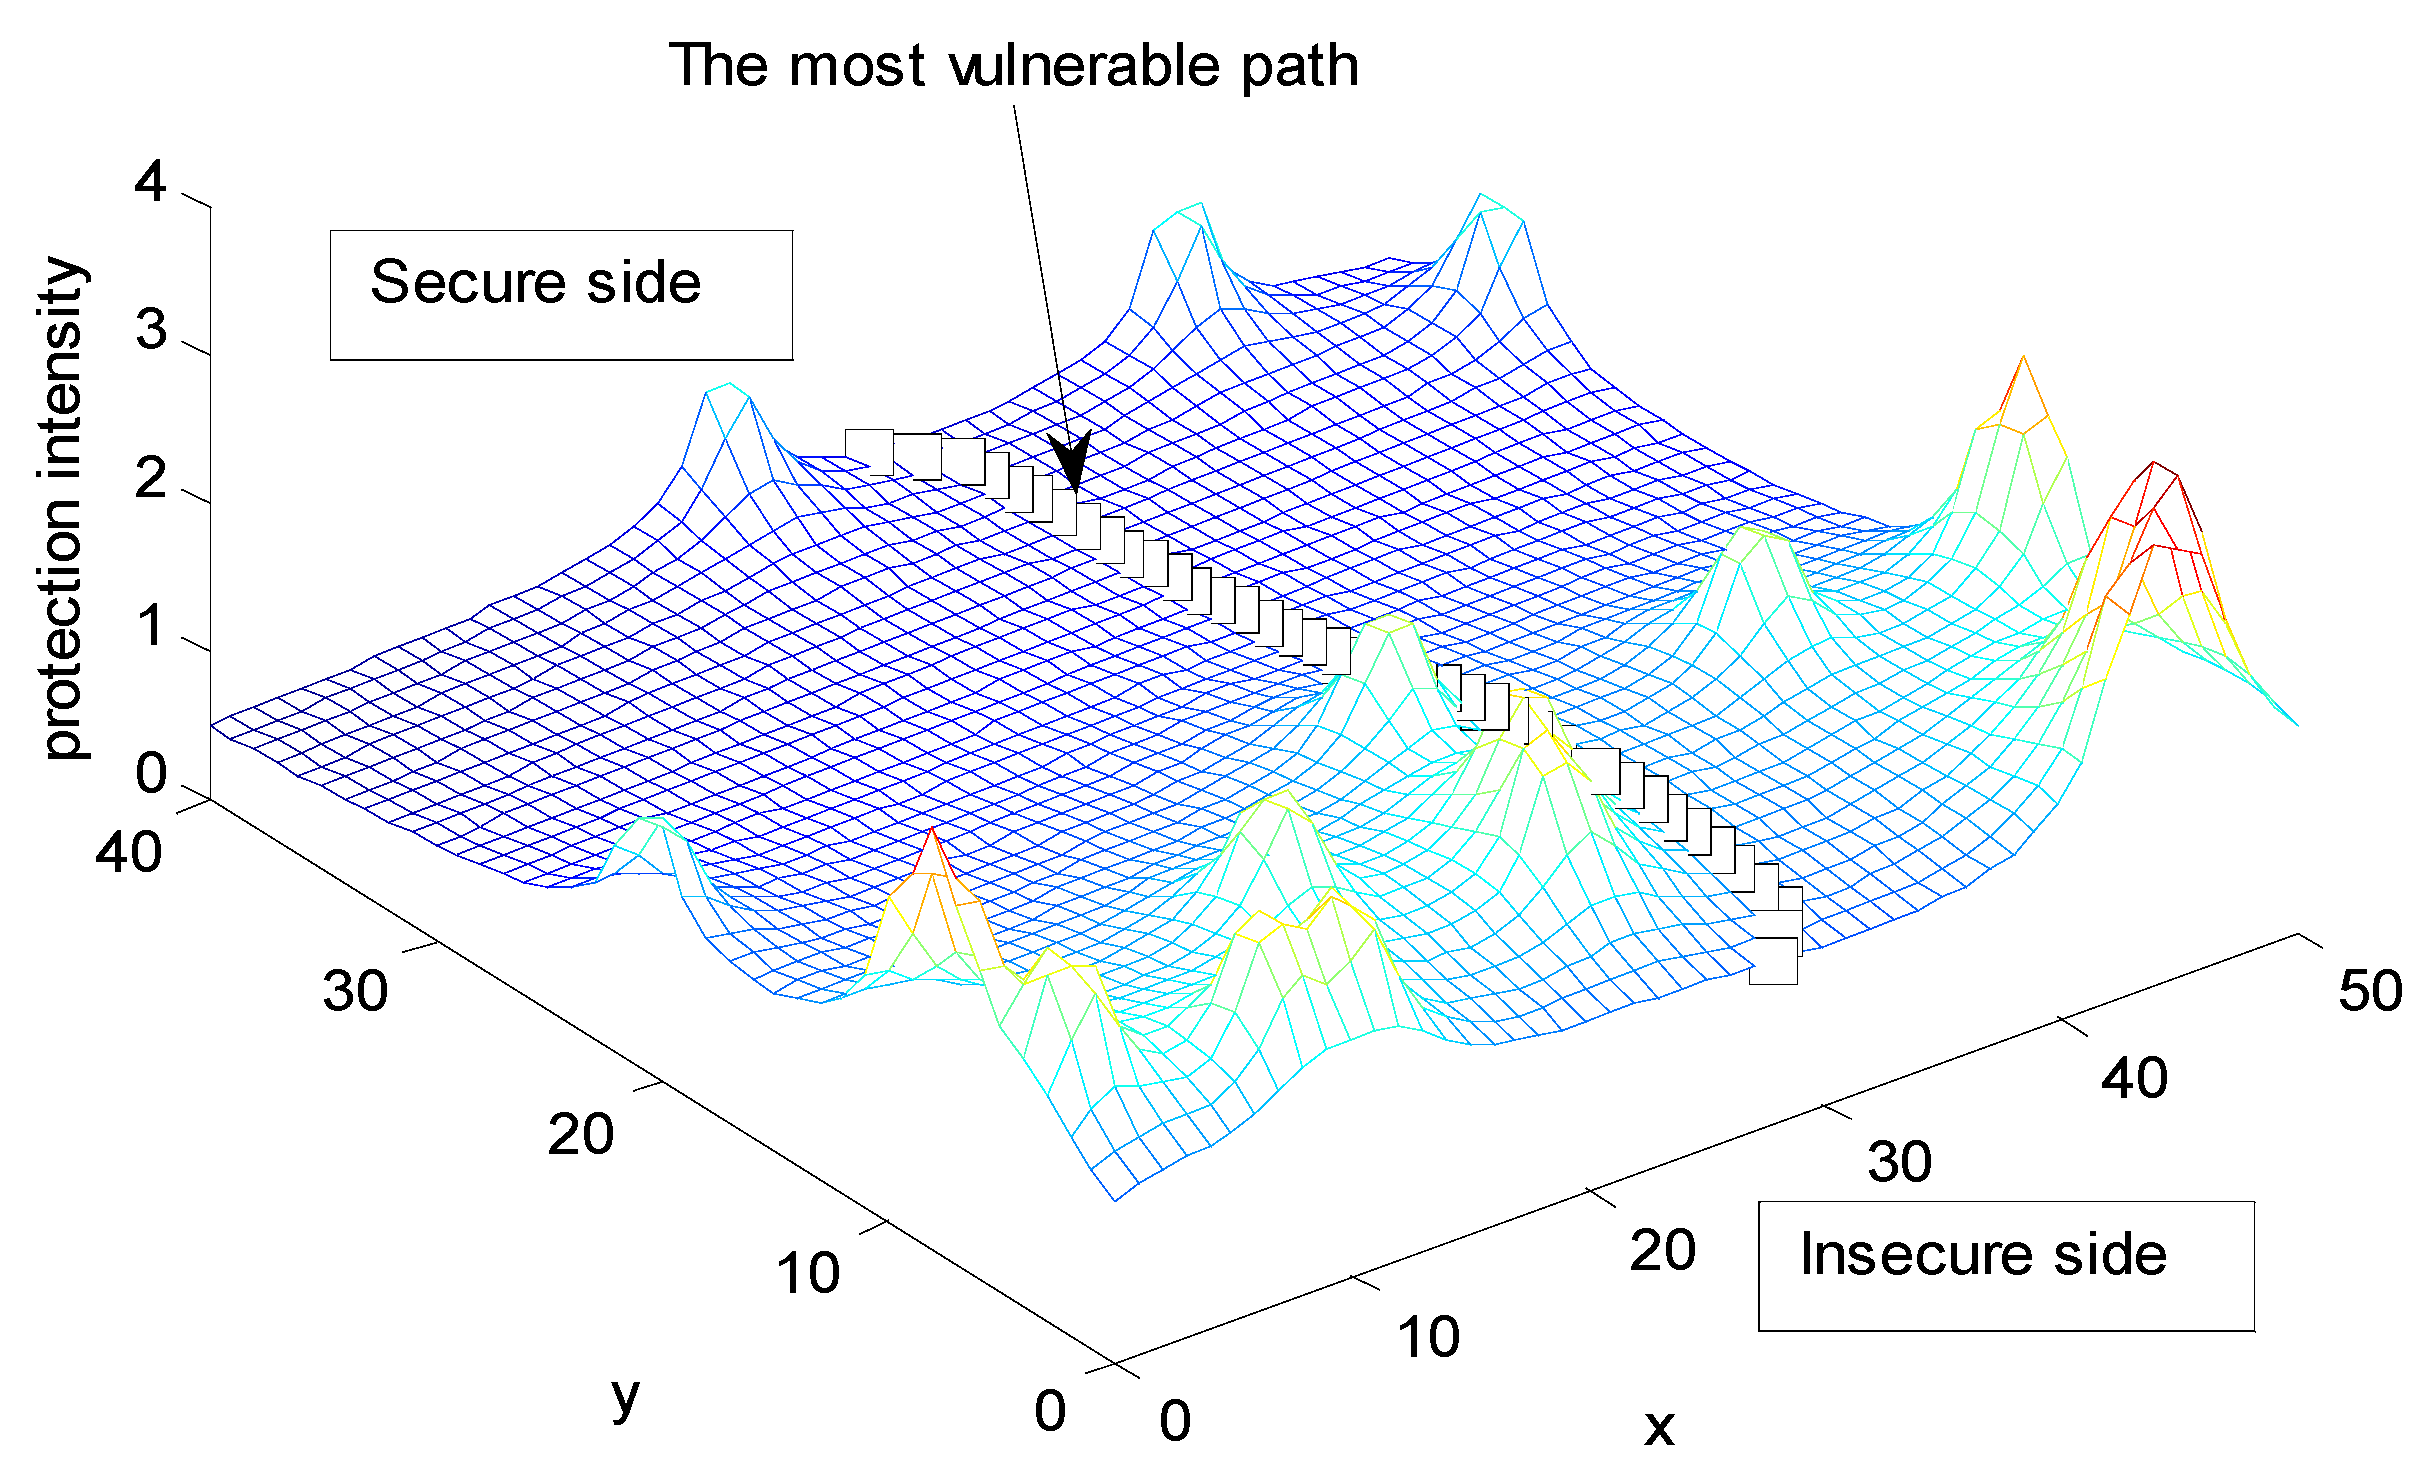
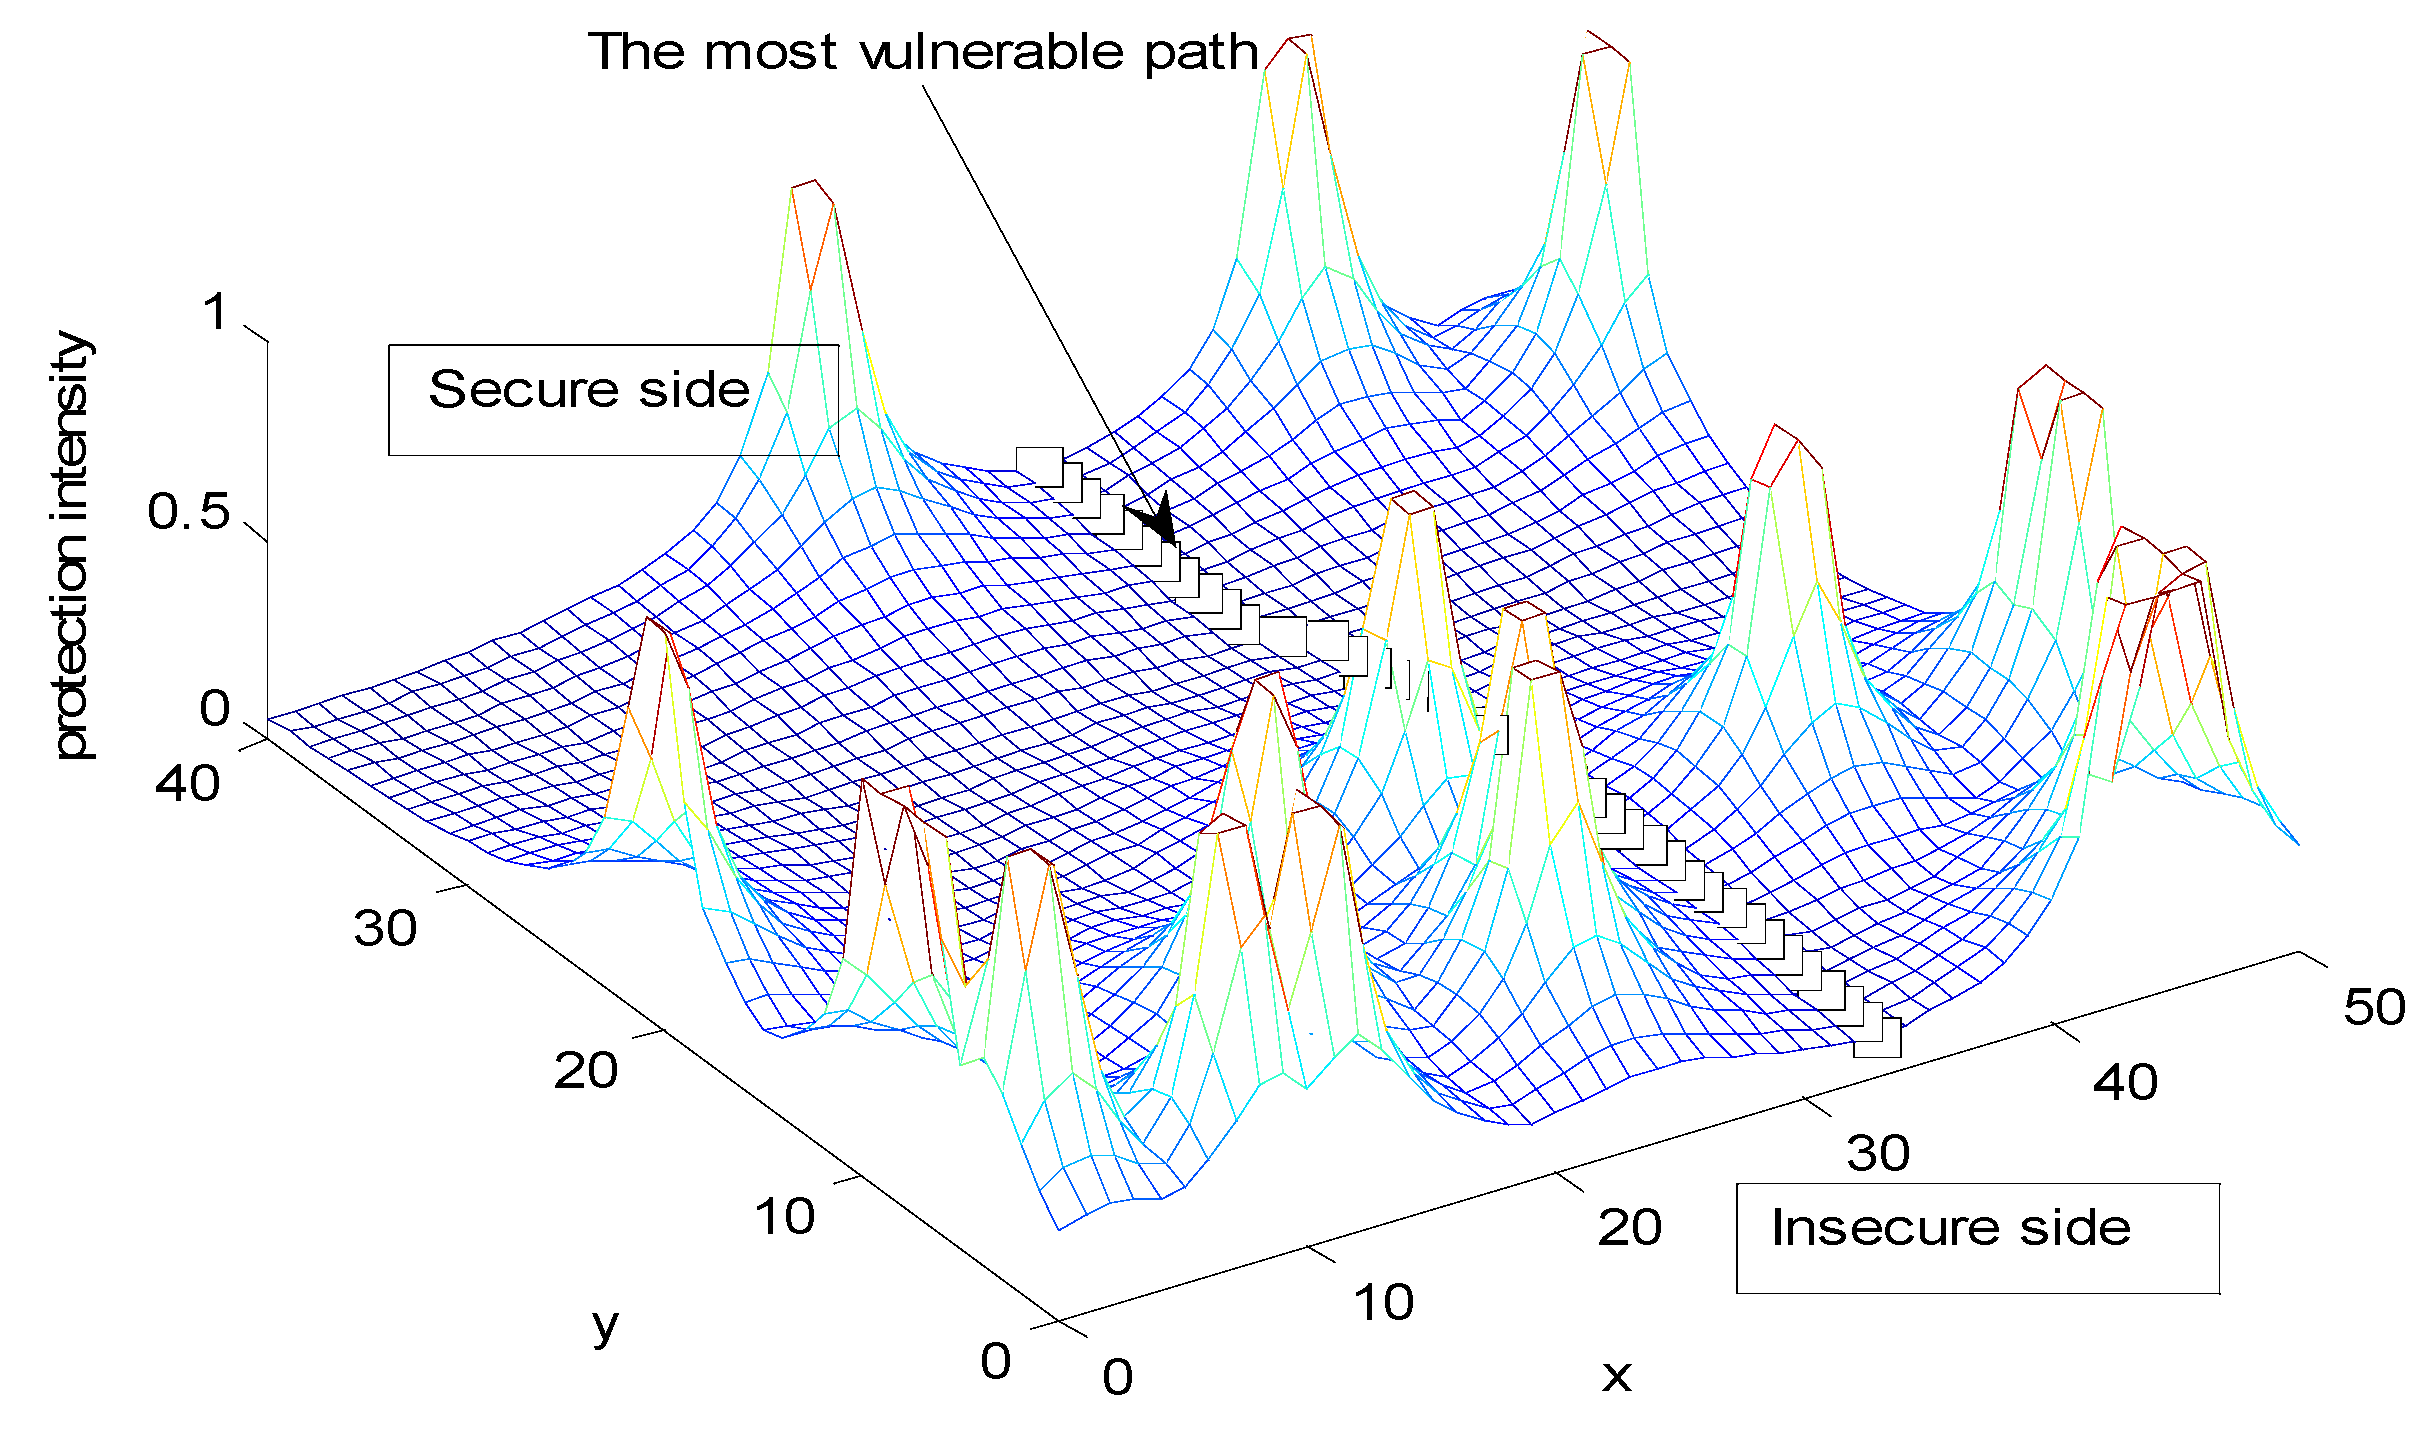
6.2. Uniformly Distributed Random Security System Deployment

The guard field in all experiments is defined as a rectangle. The width of the guard field is 41 m and the length is 51 m. Twenty security systems are randomly deployed in the field, which obey uniform distribution and ten of them are deployed along the perimeter of the field. We assume that the security systems deployed in the field have same protection effectiveness, which is equal to 1 i.e., Isi = 1(i = 1,2,···,20). A constant speed (|dp(t)/dt| = 1 is hypothesized in all calculations of the most vulnerable path. The parameter k of each security system in the guard field is supposed to be 1. The coordinates of the starting point and the destination are (25,−1) and (25,41). The coordinates of the security systems are shown in Table 3.
Table 3. The coordinates of the security systems.
S1S2S3S4S5S6S7S8S9S10
X11.961.9446.6025.3115.1645.8240.018.6223.8026.34
Y2.013.951.828.38.823.2113.472.175.4015.47
S1S2S3S4S5S6S7S8S9S10
X43.1945.3021.8041.06000505050
Y00404020.649.017.3435.0112.7110.93
The distribution of the security systems in the field is shown in Figure 8. From the Equation (12) we can get the protection intensity distribution of the field under the JA intensity model as shown in Figure 9. From Equation (13) we can get the protection intensity distribution of the field under the JC intensity model as shown in Figure 10. We can find the most vulnerable path of the security network using the algorithm proposed in Section 5. Regardless of the effect of the paths, the minimal protection intensity path based on the all security systems protection intensity model is shown in Figure 11 and the minimal protection intensity path based on the closest security system protection intensity model is shown in Figure 12. Regarding of the effect of the paths, the path protection intensity can be calculated according to Equation (14). Here we use the simple trapezoidal rule to approximatively computer the protection intensity of each path in the field. Regarding of the effect of paths, the most vulnerable paths under the JA intensity model and the JC intensity model are shown in Figure 13 and Figure 14.
Figure 8. The distribution of the security systems.
Entropy 15 02766 g008
Figure 9. The protection intensity distribution under the JA intensity model.
Entropy 15 02766 g009
Figure 10. The protection intensity distribution under the JC intensity model.
Entropy 15 02766 g010
Figure 11. Regardless of the effect of the paths, the minimal protection intensity under the JA intensity model is 38.7575.
Entropy 15 02766 g011
Figure 12. Regardless of the effect of the paths, the minimal protection intensity under the JC intensity model is 4.3714.
Entropy 15 02766 g012
Figure 13. Regarding of the effect of the paths, the minimal protection intensity under the JA intensity model is 45.3402.
Entropy 15 02766 g013
Figure 14. Regarding of the effect of the paths, the minimal protection intensity path under the JC intensity model is 5.1955.
Entropy 15 02766 g014

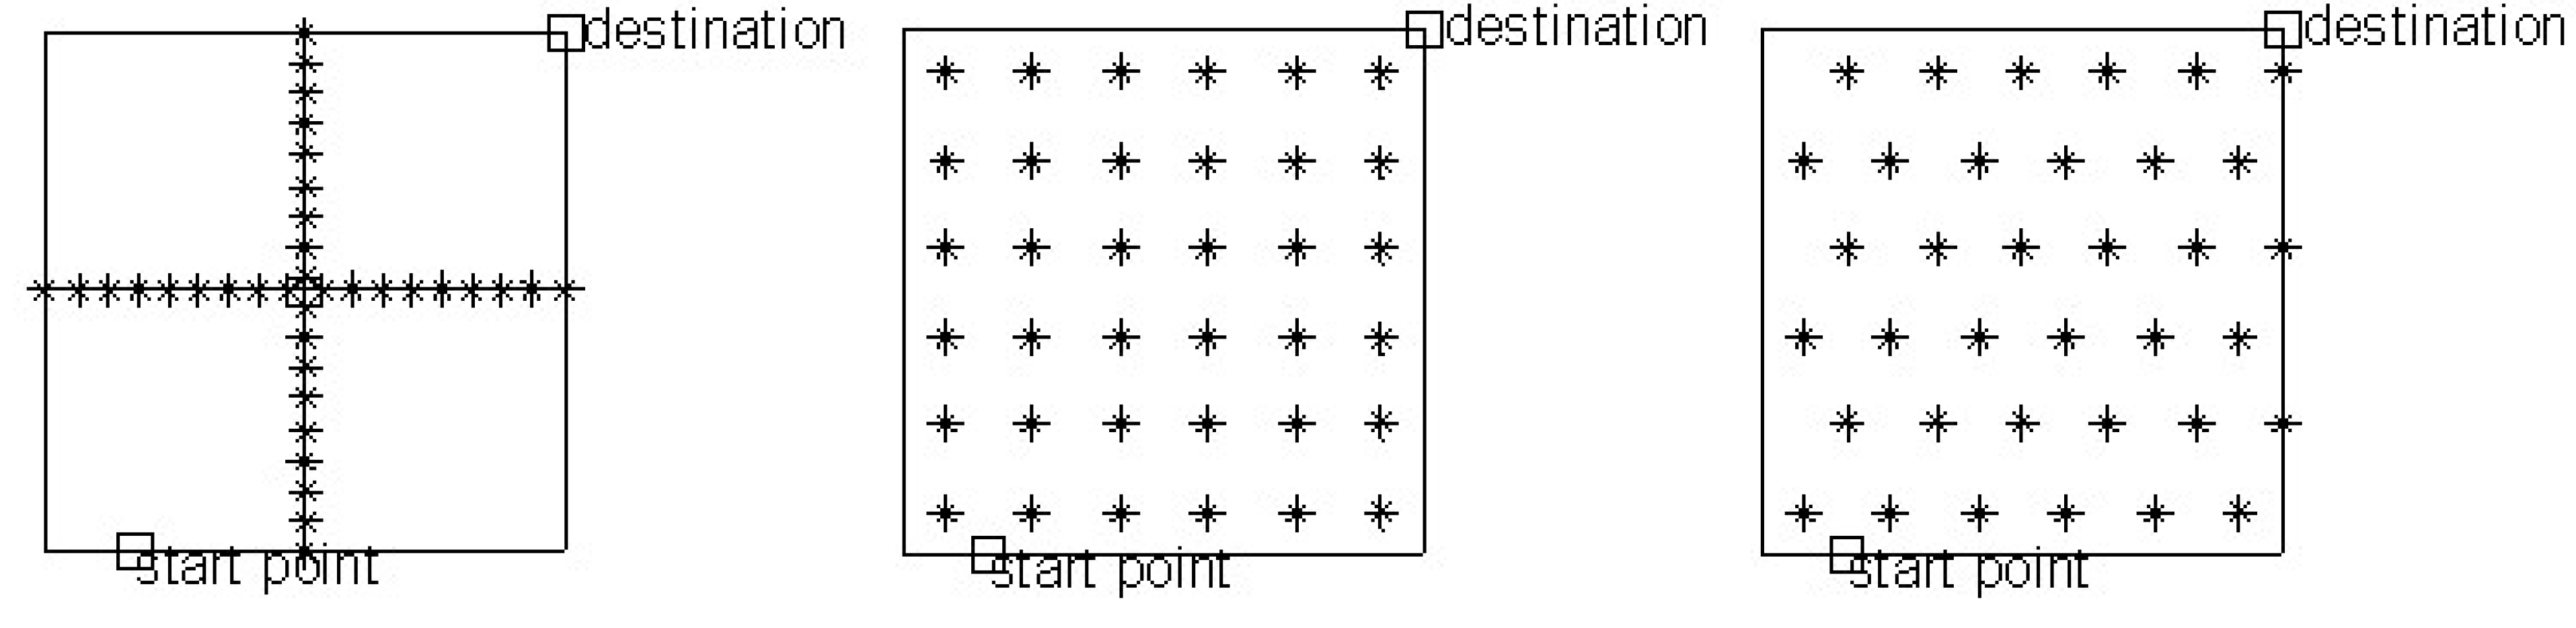
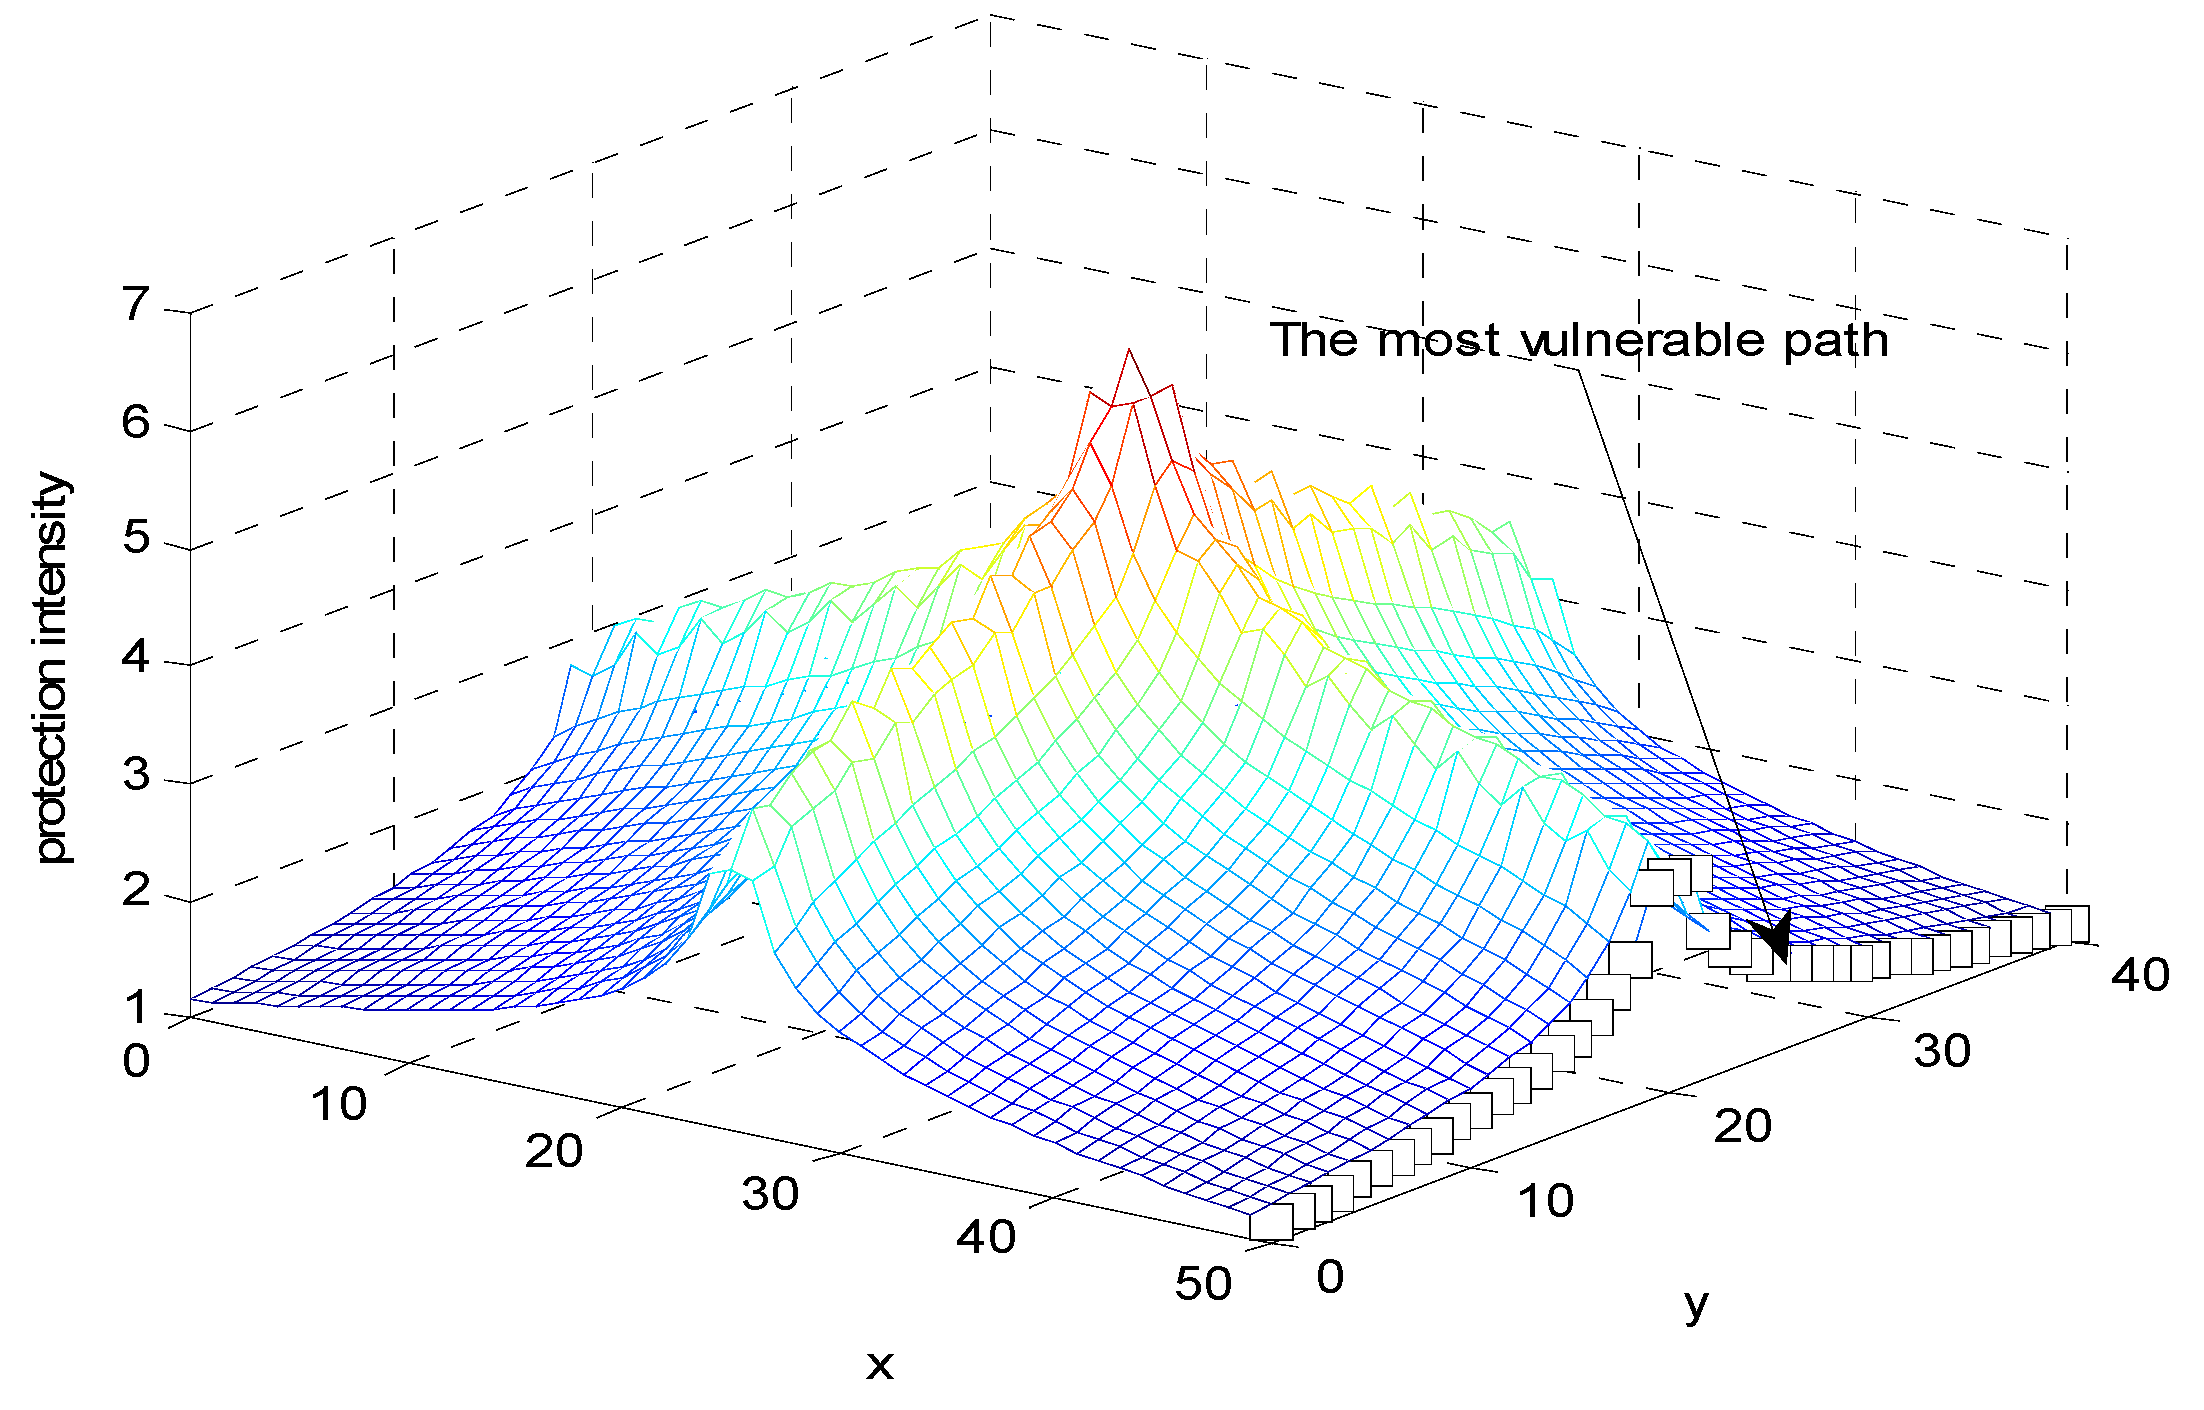
6.3. Deterministic Security System Placement

In addition to random placement, the effects of several regular, deterministic security system placement strategies are also be studied in this section. Thirty six security systems are placed in the field according to the rules as shown in Figure 15, respectively. The rules are named the cross deployment scheme, the square deployment scheme, and the triangle deployment scheme. These security systems are equally spaced along the horizontal and vertical line that split the field. The experiment results are shown in Table 4.
Figure 15. The rules of deterministic security system placement.
Entropy 15 02766 g015
Table 4. Minimal protection intensity paths results for several deterministic security system placement schemes.
NumbersUnder the JA intensity modelUnder the JC intensity model
CrossSquareTriangleCrossSquareTriangle
368.14937.51407.741293.519684.667592.8218
Using the cross deployment rule, the protection intensity distribution of the field under the JA intensity model is shown in Figure 16. Using the square deployment rule, the protection intensity distribution of the field under the JA intensity model is shown in Figure 17. Using the triangle deployment rule, the protection intensity distribution of the field under the JA intensity model is shown in Figure 18.
Figure 16. The protection intensity distribution under the cross deployment rule.
Entropy 15 02766 g016
Figure 17. The protection intensity distribution under the square deployment rule.
Entropy 15 02766 g017
Figure 18. The protection intensity distribution under the triangle deployment rule.
Entropy 15 02766 g018
According to the experiment results, the cross deployment scheme can provide the best protection. Furthermore, the protection intensity along the minimum protection intensity path for the cross deployment scheme is higher than the average randomly generated network topology, so the results suggest that when the number of security systems is limited in a field, reasonable deployment scheme will improve protection ability of the security network in the field, and a simple way is to use the cross deployment scheme to place the security systems.

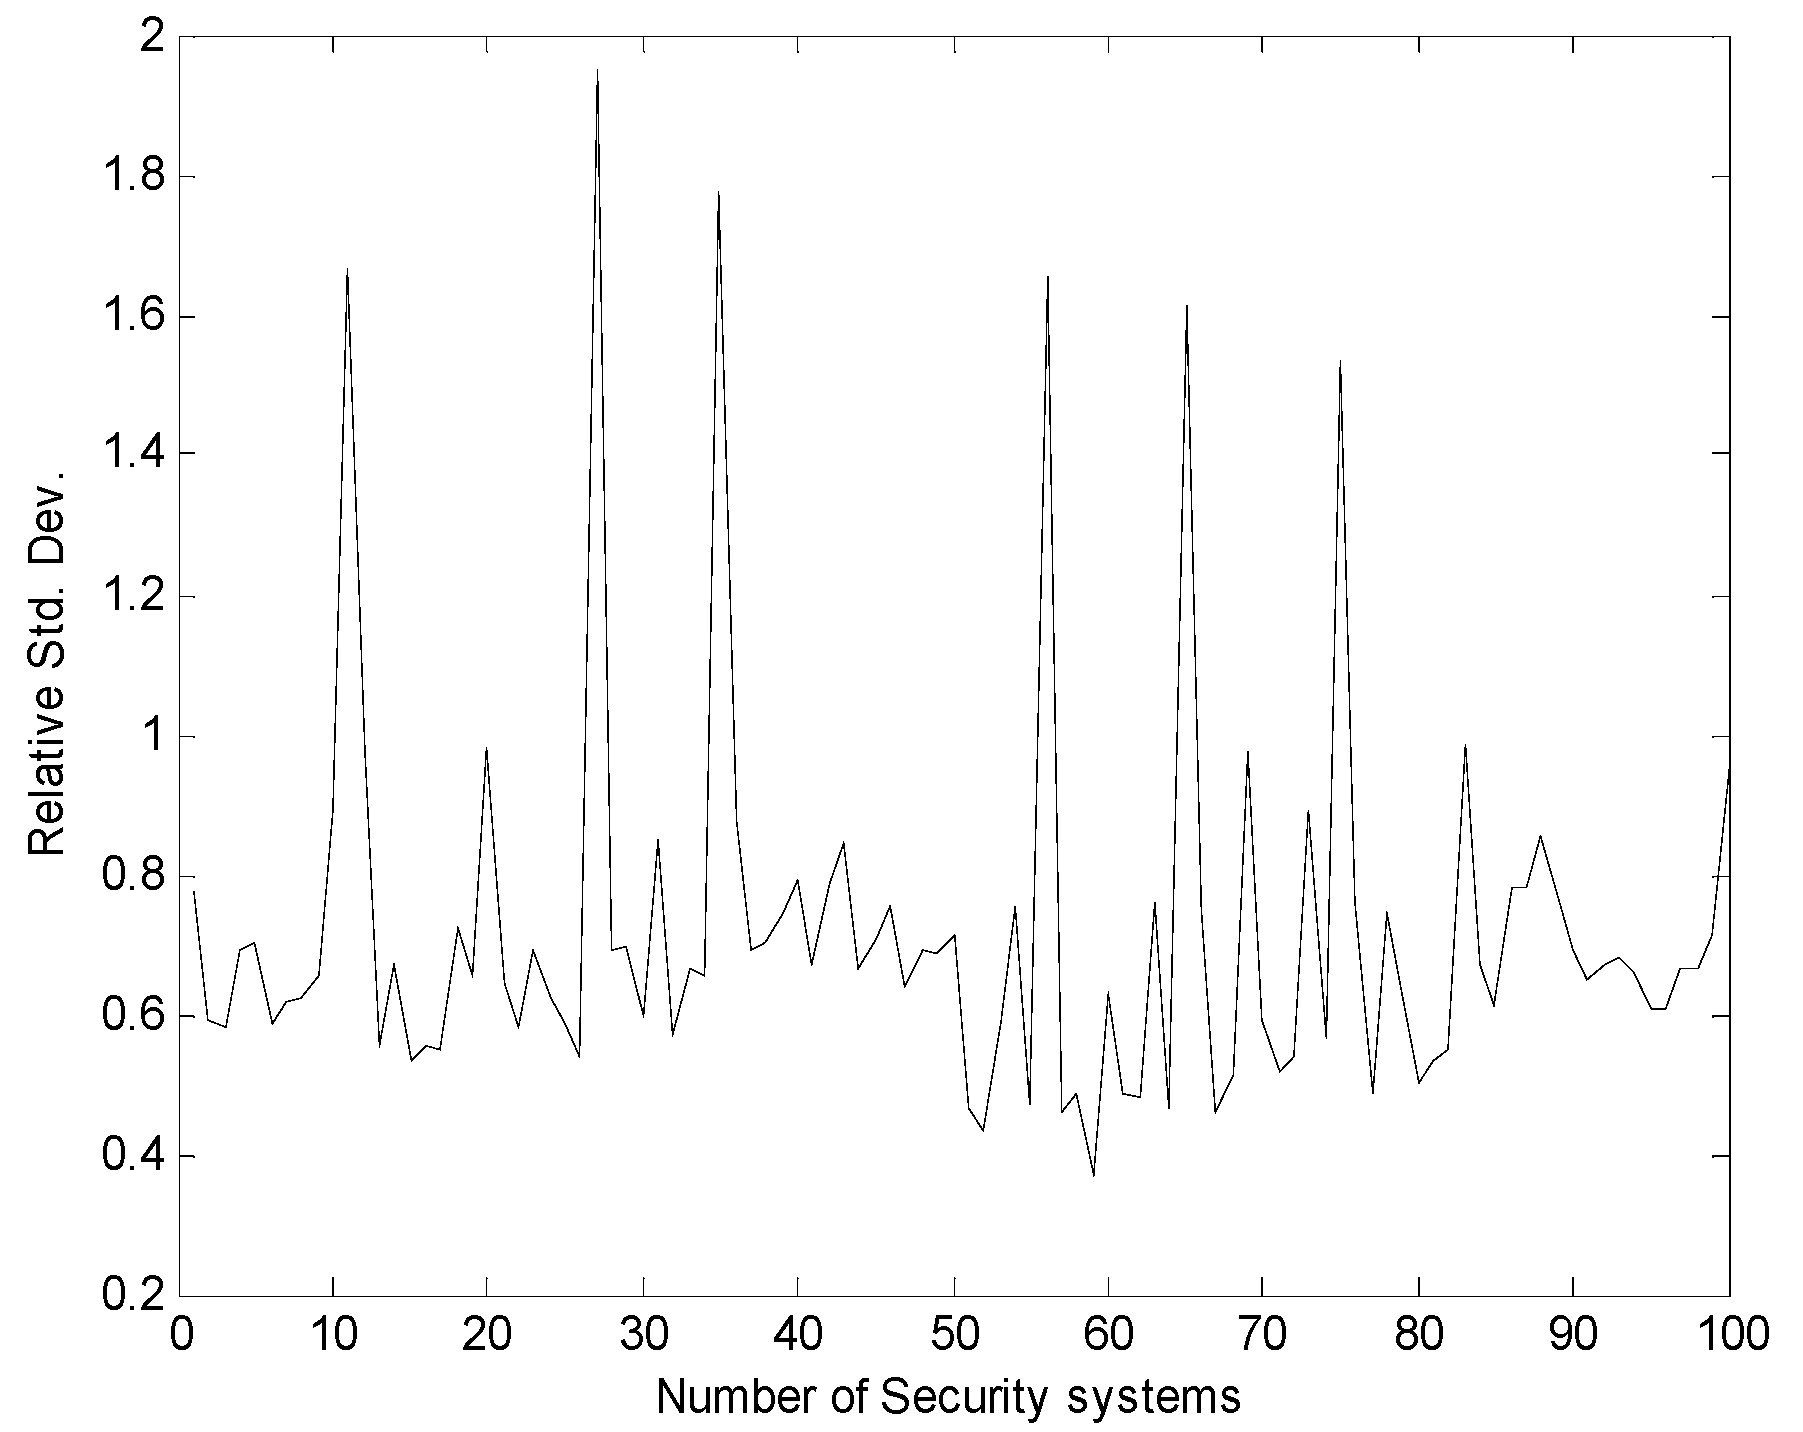
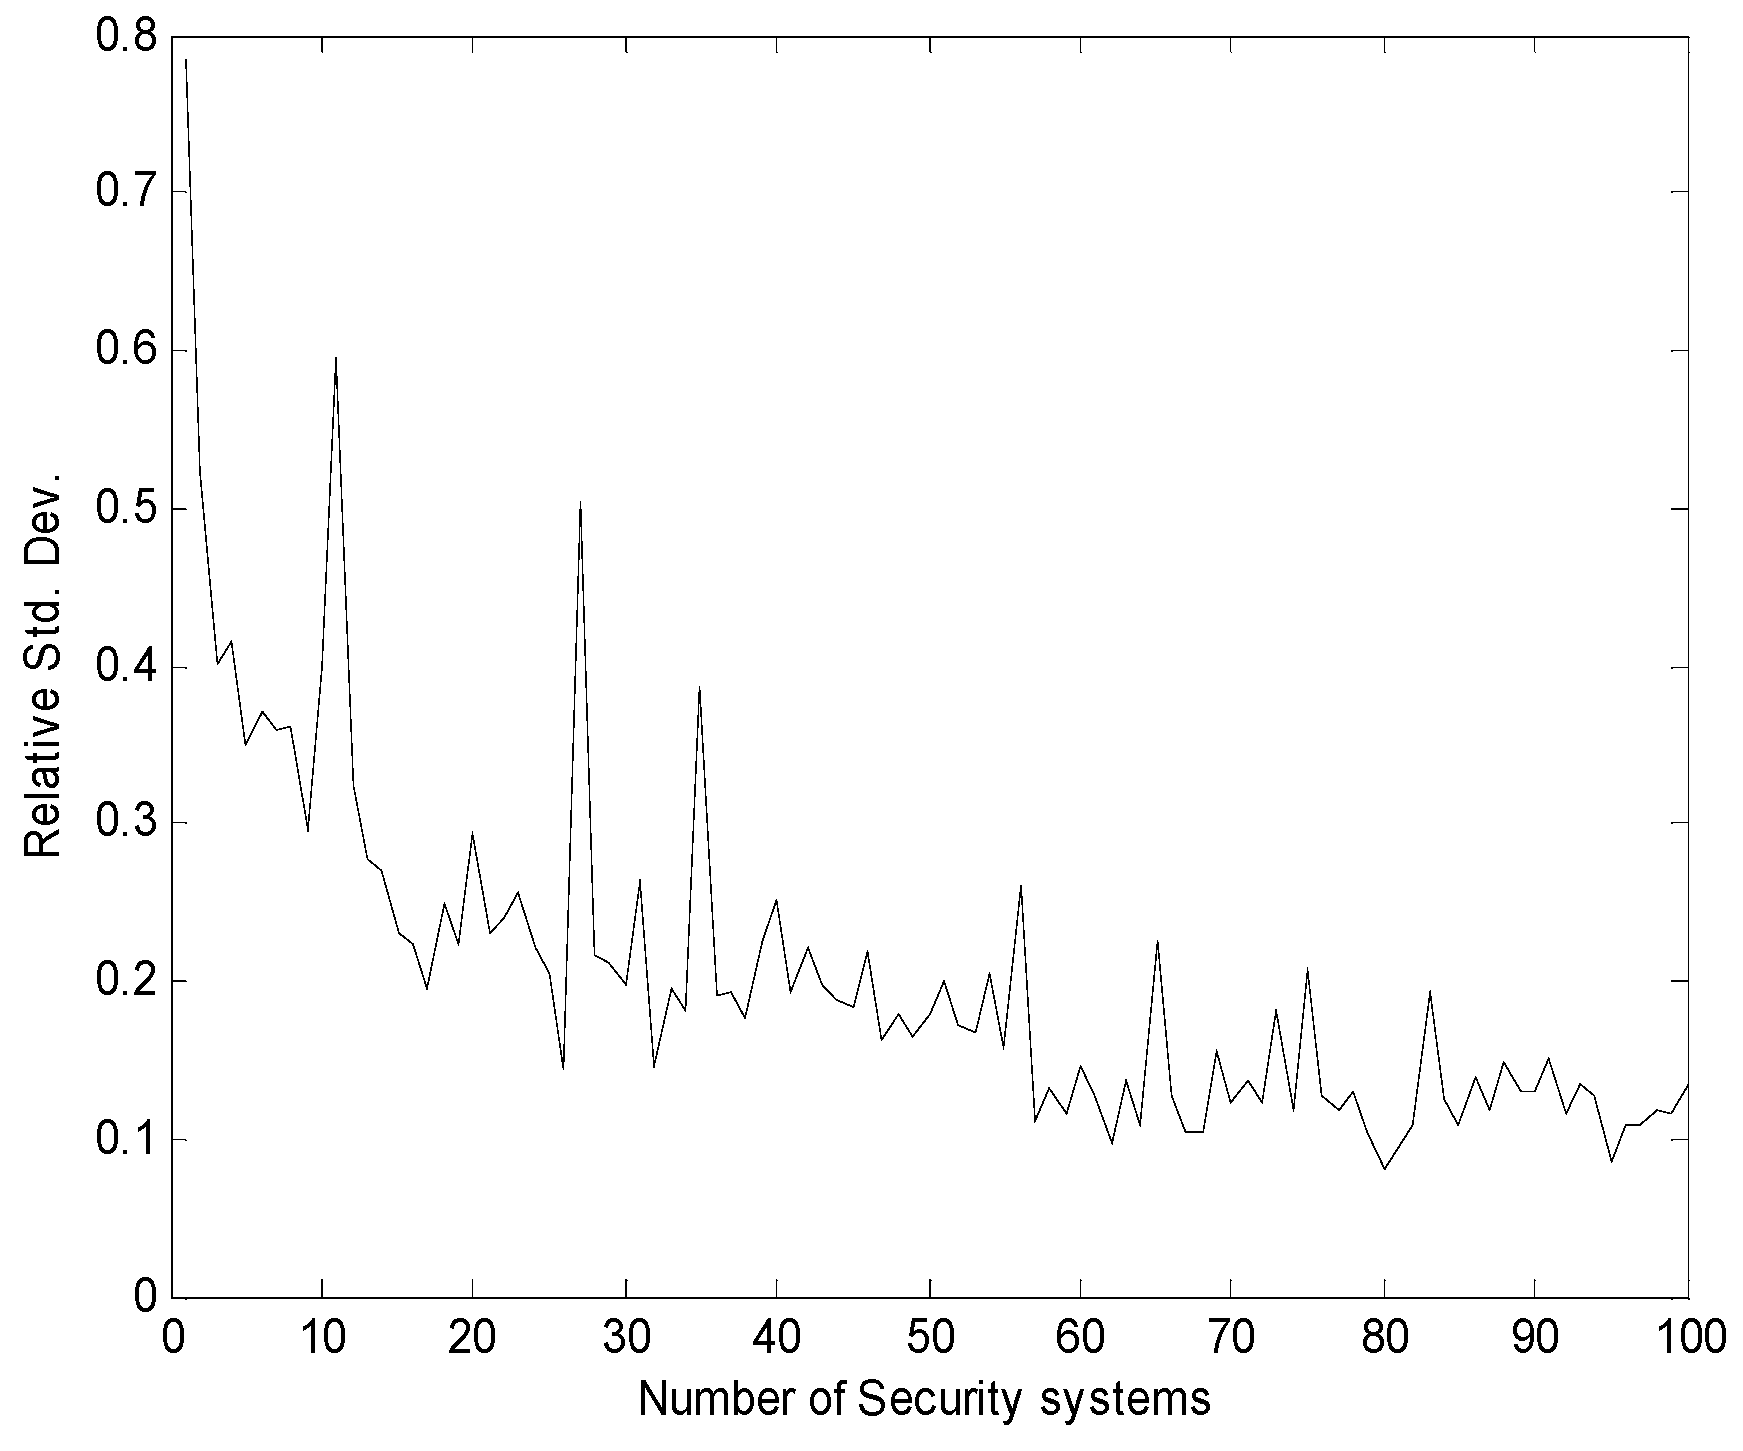
6.4. Effect of Numbers of Security Systems on the Minimal Protection Intensity

While analyzing the effect of numbers of security systems on the minimal protection intensity, we use two uniform random variables X and Y to compute the coordinates of each security system in the guard field, which is 51 m × 41 m. The numbers of the security systems are from 1 to 100. Using different uniform distribution of the security systems, each case is calculated for fifty times. Respectively using the JC intensity model and the JA intensity model, the relationships between the numbers of the security systems and the relative standard deviation of the minimal protection intensity are shown in Figure 19 and Figure 20.
Figure 19. Relative standard deviation in minimum protection intensity for protection intensity model: Closest security system.
Entropy 15 02766 g019
Figure 20. Relative standard deviation in minimum protection intensity for protection intensity model: All security systems.
Entropy 15 02766 g020
Generally for sparse fields, there are a wide range of minimal protection intensity paths that can be expected from uniform random deployments. As the density of security systems increases in the field, the minimal protection intensity tends to stabilize. This effect can be observed in Figure 19 and Figure 20. The results suggest that there is a saturation point after which randomly placing more security systems does not significantly impact the minimal protection intensity in the field.

7. Conclusions

In this paper, we consider the security systems deployed in a guard field as a diagram of a security network. According to the Information Theory of Shannon, we use entropy to measure the protection uncertainty of a security system so as to quantitatively evaluate the protection effectiveness of a security system or a security network. On this basis the protection intensity model is put forward and can be used to calculate the proteciton intensity of a stationary or moving object provided by a security system or a security network. Using the model we can find the most vulnerable path of a security network, which is considered as the protection effectiveness measure of a security network. Finally, the methods and models in this paper are simulated with MATLAB. The experiments show that the methods and models brought forward in this paper are feasible and have some references for the assessment of protection effectiveness and protection intensity for security systems or security networks.

Acknowledgments

Thanks for the assistance from National Nature Science Foundation of China (No. 61170023), the major national science and technology special projects (2010ZX03004-003-03, 2010ZX03004-001-03), National Nature Science Foundation of China (No. 60832002). The authors would like to thank Ren Pin teaching assistant Department of Electrical Engineering and Computer Science, Northwestern University USA, for their thoughtful comments. We would also like to thank knowledgeable reviewers for their constructive and thoughtful comments.

Conflict of Interest

The authors declare no conflict of interest.

References

  1. Kenyon, K.M. Digging up Jericho; Benn: London, UK, 1957. [Google Scholar]
  2. Garcia, M.L. The Design and Evaluation of Physical Protection Systems; Butterworth-Heinemann: Boston, MA, USA, 2001. [Google Scholar]
  3. Bennett, H.A.; Olascoaga, M.T. Evaluation Methodology For Fixed-Site Physical Protection Systems. Nucl. Mater. Manag. 1980, 9, 403–410. [Google Scholar]
  4. Darby, J.L.; Simpkins, B.E.; Key, B.R. Seapath, a microcomputer code for evaluating physical security effectiveness using adversary sequence diagrams. Nucl. Mater. Manag. 1986, 15, 242–245. [Google Scholar]
  5. Hicks, M.J.; Snell, M.S.; Sandoval, J.S.; Potter, C.S. Physical protection systems cost and performance analysis: A case study. IEEE Aero. El. Syst. Mag. 1999, 14, 9–13. [Google Scholar] [CrossRef]
  6. Doyon, L.R. Stochastic modeling of facility security-systems for analytical solutions. Comput. Ind. Eng. 1981, 5, 127–138. [Google Scholar] [CrossRef]
  7. Fischer, R.; Halibozek, E.; Walters, D. Introduction to Security, 9th ed.; Elsevier: Boston, MA, USA, 2012. [Google Scholar]
  8. Schneider, W.J.; Grassie, R.P. Countermeasures Development in the Physical Security Design Process: An Anti-Terrorist Perspective. In Proceedings of 1989 International Carnahan Conference on Security Technology, Zurich, Switzerland, 3–5 October 1989; IEEE: Zurich, Switzerland, 1989; pp. 297–302. [Google Scholar]
  9. Kobza, J.E.; Jacobson, S.H. Probability models for access security system architectures. J. Oper. Res. Soc. 1997, 48, 255–263. [Google Scholar] [CrossRef]
  10. Jacobson, S.H.; Kobza, J.E.; Easterling, A.S. A detection theoretic approach to modeling aviation security problems using the knapsack problem. IIE Trans. 2001, 33, 747–759. [Google Scholar] [CrossRef]
  11. Pollet, J.; Cummins, J. All Hazards Approach for Assessing Readiness of Critical Infrastructure. In Proceedings of IEEE Conference on Technologies for Homeland Security, Boston, MA, USA, 11–12 May 2009; pp. 366–372.
  12. Shan, X.; Zhuang, J. Cost of equity in homeland security resource allocation in the face of a strategic attacker. Risk Anal. 2012, 33, 1083–1099. [Google Scholar] [CrossRef] [PubMed]
  13. Xu, P.; Su, X.; Wu, J.; Sun, X.; Zhang, Y.; Deng, Y. Risk analysis of physical protection system based on evidence theory. J. Inf. Comput. Sci. 2010, 7, 2871–2878. [Google Scholar]
  14. Nikoofal, M.E.; Zhuang, J. Robust allocation of a defensive budget considering an attacker’s private information. Risk Anal. 2012, 32, 930–943. [Google Scholar] [CrossRef] [PubMed]
  15. Hausken, K.; Zhuang, J. The timing and deterrence of terrorist attacks due to exogenous dynamics. J. Oper. Res. Soc. 2012, 63, 726–735. [Google Scholar] [CrossRef]
  16. Golalikhani, M.; Zhuang, J. Modeling Arbitrary Layers of Continuous-Level Defenses in Facing with Strategic Attackers. Risk Anal. 2011, 31, 533–547. [Google Scholar] [CrossRef] [PubMed]
  17. Zhuang, J.; Bier, V.M.; Alagoz, O. Modeling secrecy and deception in a multiple-period attacker-defender signaling game. Eur. J. Oper. Res. 2010, 203, 409–418. [Google Scholar] [CrossRef]
  18. Zhuang, J.; Bier, V.M. Balancing terrorism and natural disasters-defensive strategy with endogenous attacker effort. Oper. Res. 2007, 55, 976–991. [Google Scholar] [CrossRef]
  19. Shan, X.; Zhuang, J. Hybrid defensive resource allocations in the face of partially strategic attackers in a sequential defenderʼCattacker game. Eur. J. Oper. Res. 2013, 228, 262–272. [Google Scholar] [CrossRef]
  20. Clausius, R. The Mechanical Theory of Heat: With Its Application to the Steam-engine and to the Physical Properties of Bodies; Van Voorst: London, UK, 1867. [Google Scholar]
  21. Sandler, S.I. Chemical, Biochemical, and Engineering Thermodynamics; Wiley: New York, NY, USA, 2006. [Google Scholar]
  22. Shannon, C.E. A mathematical theory of communication. SIGMOBILE Mob. Comput. Commun. Rev. 2001, 5, 3–55. [Google Scholar] [CrossRef]

