Remote Sens. 2020, 12(23), 3948; https://doi.org/10.3390/rs12233948 - 2 Dec 2020
Cited by 148 | Viewed by 11510
Abstract
Lidar remote sensing has proven to be a powerful tool for estimating ground elevation, canopy height, and additional vegetation parameters, which in turn are valuable information for the investigation of ecosystems. Spaceborne lidar systems, like the Global Ecosystem Dynamics Investigation (GEDI), can deliver
[...] Read more.
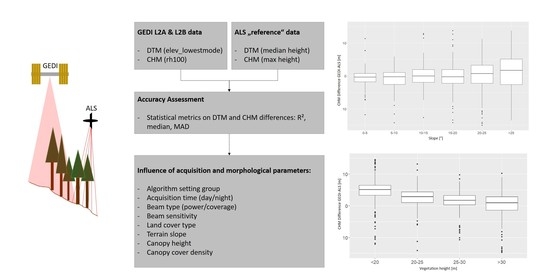
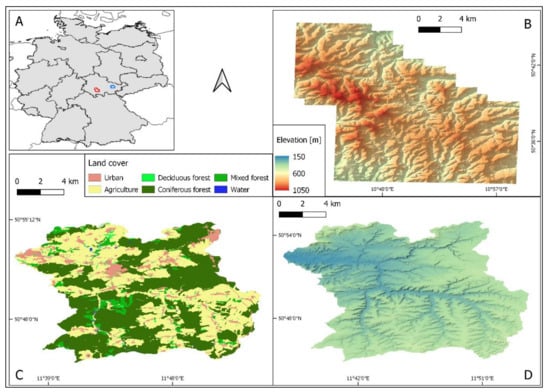
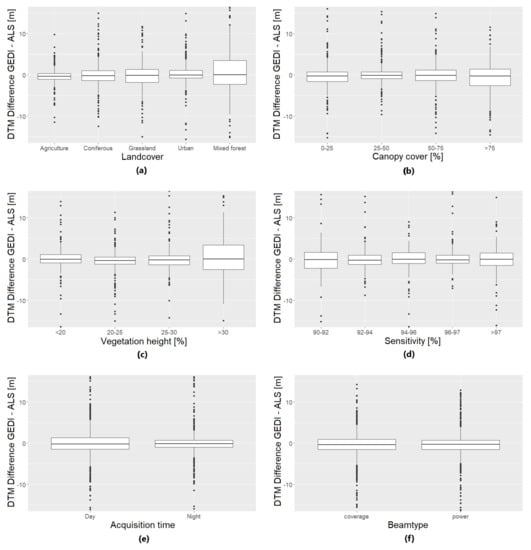
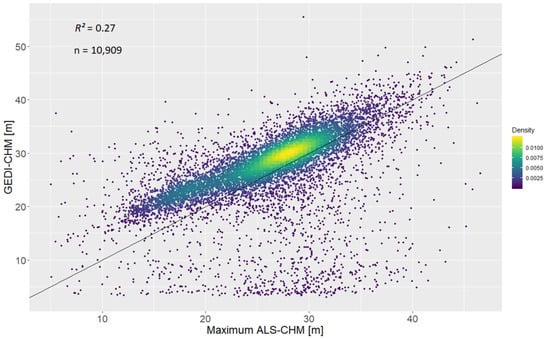
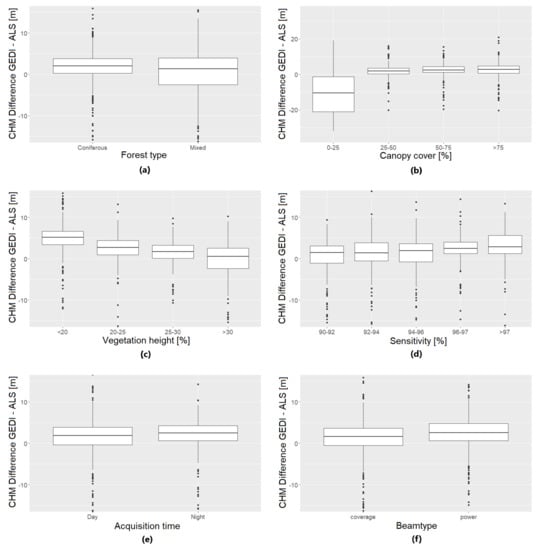
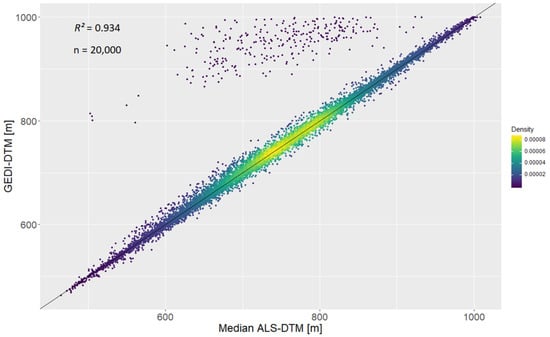
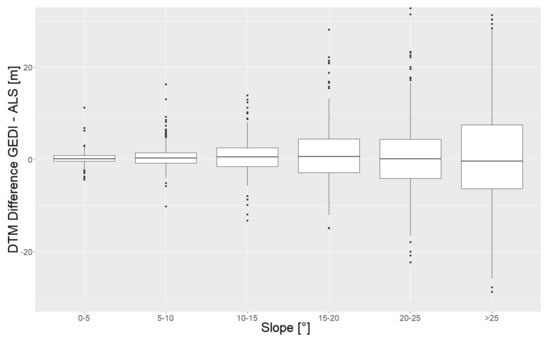
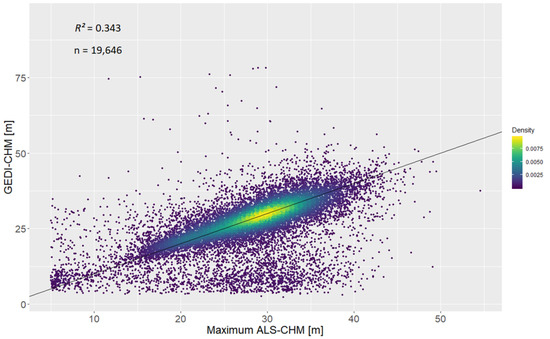
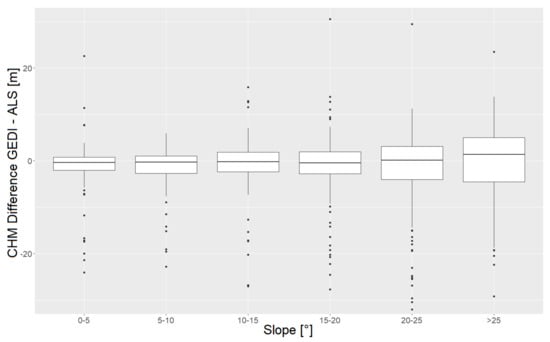
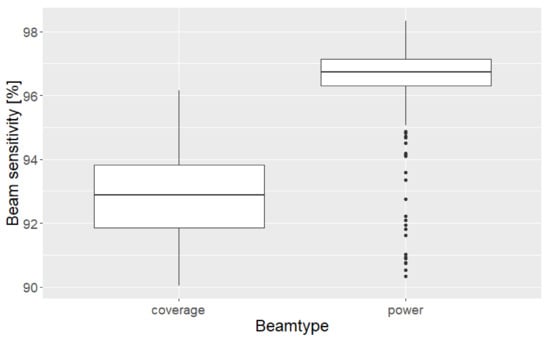
Lidar remote sensing has proven to be a powerful tool for estimating ground elevation, canopy height, and additional vegetation parameters, which in turn are valuable information for the investigation of ecosystems. Spaceborne lidar systems, like the Global Ecosystem Dynamics Investigation (GEDI), can deliver these height estimates on a near global scale. This paper analyzes the accuracy of the first version of GEDI ground elevation and canopy height estimates in two study areas with temperate forests in the Free State of Thuringia, central Germany. Digital terrain and canopy height models derived from airborne laser scanning data are used as reference heights. The influence of various environmental and acquisition parameters (e.g., canopy cover, terrain slope, beam type) on GEDI height metrics is assessed. The results show a consistently high accuracy of GEDI ground elevation estimates under most conditions, except for areas with steep slopes. GEDI canopy height estimates are less accurate and show a bigger influence of some of the included parameters, specifically slope, vegetation height, and beam sensitivity. A number of relatively high outliers (around 9–13% of the measurements) is present in both ground elevation and canopy height estimates, reducing the estimation precision. Still, it can be concluded that GEDI height metrics show promising results and have potential to be used as a basis for further investigations.
Full article
(This article belongs to the Special Issue Advances in LiDAR Remote Sensing for Forestry and Ecology)
►
Show Figures
Graphical abstract


