Remote Sens. 2020, 12(10), 1650; https://doi.org/10.3390/rs12101650 - 21 May 2020
Cited by 24 | Viewed by 5165
Abstract
Applied to grazing management, unmanned aerial systems (UASs) allow for the monitoring of vegetation at the level of each individual on the pasture while covering a significant area (>10 ha per flight). Few studies have investigated the use of UASs to describe the
[...] Read more.
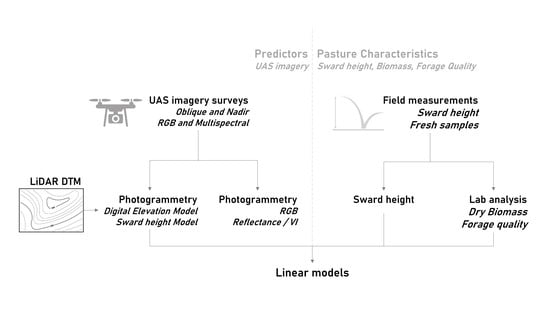
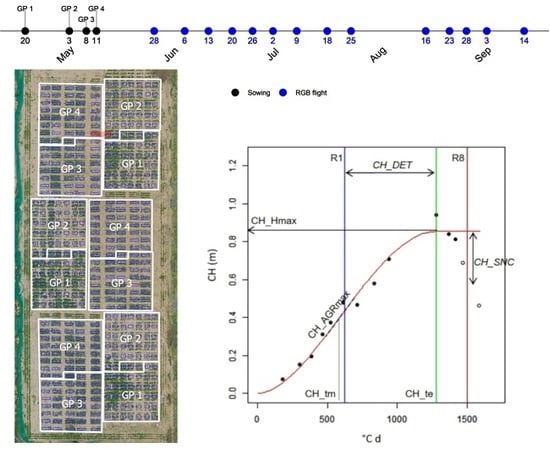
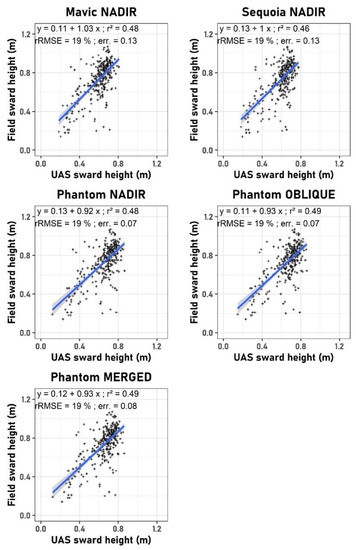
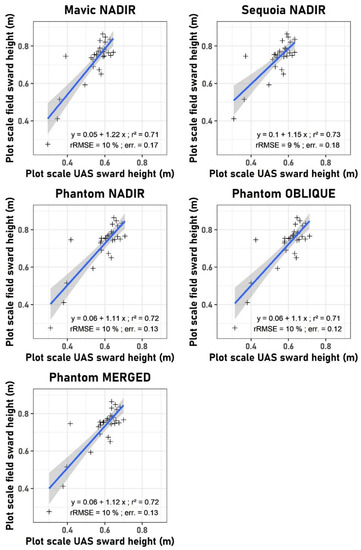
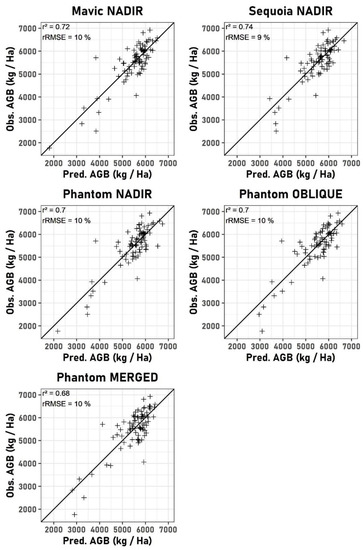
Applied to grazing management, unmanned aerial systems (UASs) allow for the monitoring of vegetation at the level of each individual on the pasture while covering a significant area (>10 ha per flight). Few studies have investigated the use of UASs to describe the forage quality in terms of nutritive value or chemical composition, while these parameters are essential in supporting the productive functions of animals and are known to change in space (i.e., sward species and structure) and time (i.e., sward phenology). Despite interest, these parameters are scarcely assessed by practitioners as they usually require important laboratory analyses. In this context, our study investigates the potential of off-the-shelf UAS systems in modeling essential parameters of pasture productivity in a precision livestock context: sward height, biomass, and forage quality. In order to develop a solution which is easily reproducible for the research community, we chose to avoid expensive solutions such as UAS LiDAR (light detection and ranging) or hyperspectral sensors, as well as comparing several UAS acquisition strategies (sensors and view angles). Despite their low cost, all tested strategies provide accurate height, biomass, and forage quality estimates of timothy pastures. Considering globally the three groups of parameters, the UAS strategy using the DJI Phantom 4 pro (Nadir view angle) provides the most satisfactory results. The UAS survey using the DJI Phantom 4 pro (Nadir view angle) provided R2 values of 0.48, 0.72, and 0.7, respectively, for individual sward height measurements, mean sward height, and sward biomass. In terms of forage quality modeling, this UAS survey strategy provides R2 values ranging from 0.33 (Acid Detergent Lignin) to 0.85 (fodder units for dairy and beef cattle and fermentable organic matter). Even if their performances are of lower order than state-of-art techniques such as LiDAR for sward height or hyperspectral sensors (for biomass and forage quality modeling), the important trade-off in terms of costs between UAS LiDAR (>100,000 €) or hyperspectral sensors (>50,000 €) promotes the use of such low-cost UAS solutions. This is particularly true for sward height modeling and biomass monitoring, where our low-cost solutions provide more accurate results than state-of-the-art field approaches, such as rising plate meters, with a broader extent and a finer spatial grain.
Full article
(This article belongs to the Special Issue Advances of Remote Sensing in Pasture Management)
►
Show Figures
Graphical abstract


