1. Introduction
With the continuous improvement of satellite and sensor technology, high–resolution remote sensing (HRRS) images have been widely used in many fields, such as updating geographic databases, creating urban thematic maps, etc. As buildings are among the most representative types of artificial targets in urban scenes, extraction of buildings from HRRS images is important in these applications [
1,
2,
3]. Compared with traditional medium- and low-resolution remote sensing images, a great amount of semantic, textural, and spatial information of land covers is contained in HRRS images. Hence, HRRS images are appropriate data sources for building feature extraction. However, the increasing resolution of remote sensing images leads to the prominent phenomena of high intraclass variance and low interclass variance, which reduce the ability to distinguish buildings and other geographic objects [
4].
In order to address this challenge, much effort has been made on importing spatial information as a supplement to spectral and textural features [
5]. It has been proven that such information is highly effective in improving the ability to identify buildings in HRRS images [
6,
7]. In current works, machine learning-based methods are the main strategy for building a feature extraction [
8,
9,
10,
11]. However, such methods deeply rely on a huge number of samples and the effective selection of training samples. This means that in building feature extraction applications, such methods may not be implemented or obtain reliable results due to the lack of samples in HRRS images [
4]. Meanwhile, more automatic building extraction methods with different strategies have been proposed, such as automatic building extraction with rooftop detectors [
12], automatic building outline detection combined with geometric and spectral features [
13], and the use of auxiliary data including light detection and ranging (LIDAR) [
14] and terrestrial laser scanning (TLS) [
15], etc. In addition, some building and non–building indices, such as the morphological building index (MBI) [
16], shadow index [
17], and vegetation index [
18], have been widely used.
In recent years, building extraction with morphological attribute profiles (MAPs) has been proposed for HRRS images. As one of the most effective methods to model spatial and contextual information for the analysis of HRRS images, the operators in MAPs can be efficiently implemented based on the multiscale representation of land covers via tree structures [
19]. Researchers have indicated that a combination of suitable scale parameters and morphological attributes can significantly improve the divisibility between buildings and other geographic objects [
20,
21]. However, there are still some restrictions in automatically extracting buildings from HRRS images by MAPs, as follows: (1) A reasonable set of scale parameters needs to be adaptively constructed. To extract buildings with different morphological attributes, it is crucial to produce a corresponding sequence of profiles by different scale parameters for each attribute. However, the theory of MAPs does not give explicit criteria about this and the scale parameters are mainly determined according to the experience of manual setting. (2) The connected area does not correspond to a geographic object. As the elementary unit of attribute extraction, the connected area for each pixel may invade into multiple geographic objects because it is determined only by the similarity of specific attributes between adjacent pixels. Therefore, it is hard to guarantee that the extracted result will accurately reflect the real attributes of the corresponding geographic object the current pixel belongs to. (3) For pixel-level results of MAPs and geographic objects, how to automatically acquire the final object-level building extraction results is also a challenging issue.
Concerning the above restrictions, a high-resolution remote sensing image building extraction method by AMAP–OBC is proposed, and the contributions of this study can be summarized as follows:
(1) A novel AMAP–OBC for automatic building extraction is proposed. By establishing the corresponding relationships between AMAP–OBC and characteristics of buildings in HRRS images, the set of scale parameters can be adaptively obtained, and the connected area for attribute extraction is restricted by the inherent boundaries of real geographic objects, which is beneficial for extracting more accurate attributes.
(2) In addition, a further identification strategy with adaptive threshold combination is proposed. It can break the semantic gap between the extracted building pixels and segmented geographic objects, and realize further screening of non–building objects with building pixels in the final results.
This study mainly includes six sections:
Section 2 contains the analysis of building characteristics in high-resolution remote sensing images; in
Section 3, we briefly describe the MAP theory and constitution of the building attribute set; in
Section 4, we elaborate on the implementation steps of the proposed method;
Section 5 contains an analysis and discussion of the experiments; and in
Section 6, we give the conclusion.
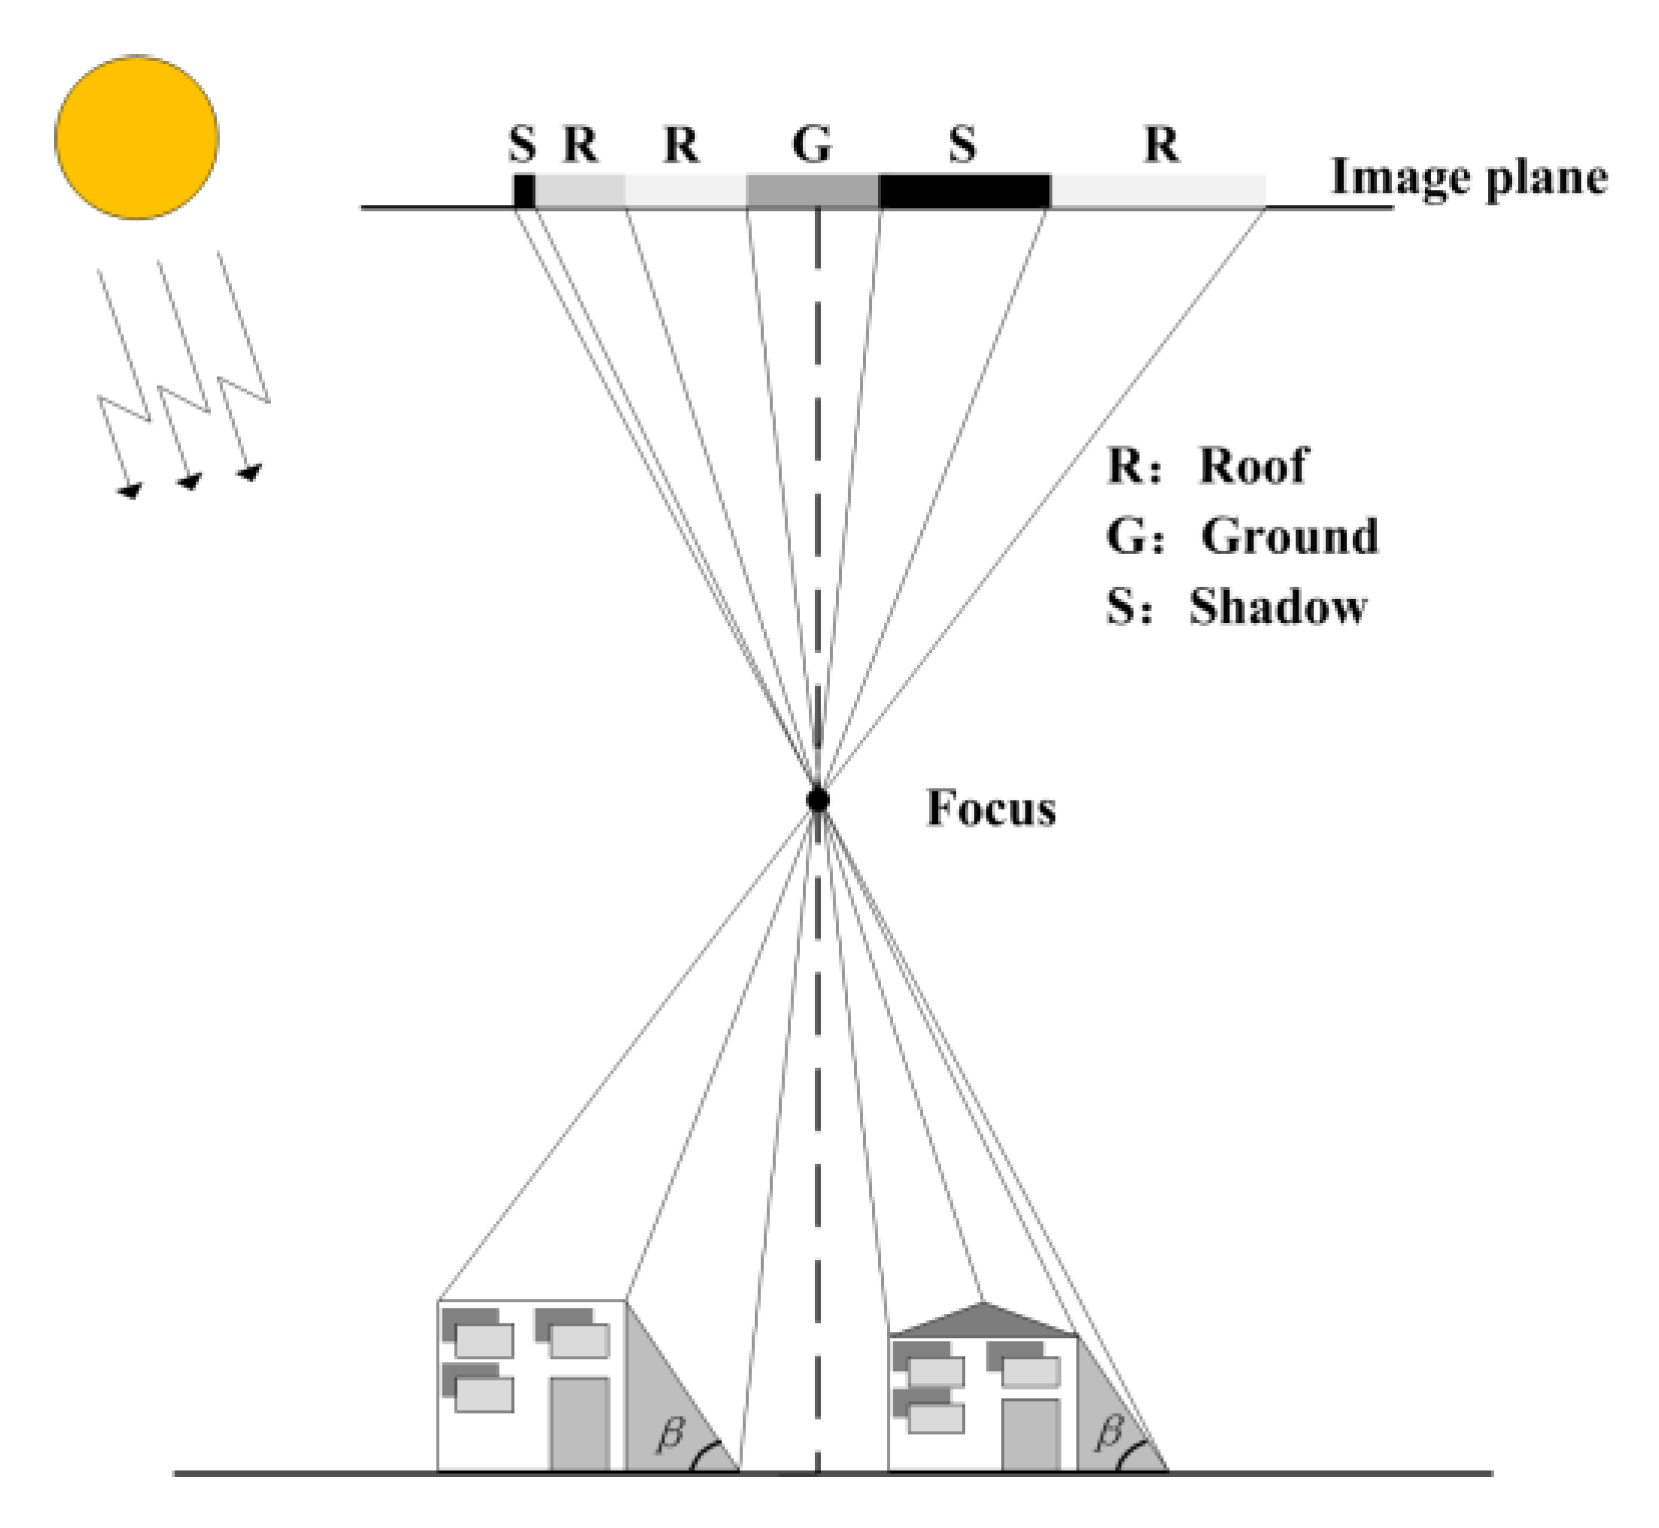
2. Analysis of Building Characteristics in HRRS Images
The geometric relationship between the sensor, the ground, and buildings in remote sensing images is shown in
Figure 1.
Roof, ground, and shadow, respectively, represent the roof of a building, the adjacent ground, and shadow caused by the building occluding sunlight. In general, different building roofs have different spectra and reflectivity due to material differences, so there may be significant differences in spectral and textural characteristics. However, since the pixels belonging to the roof of the same building have strong spectral and textural consistency, they are manifested as a homogeneous connected area constrained by the boundary of the building. In terms of geometric features, buildings usually behave as various rectangles or other regular shapes, and morphological attributes such as area, etc., are significantly different from other geographic objects such as roads and vehicles. The shadow of a building shows a significant dark color and a shape-regular connected area, and is distributed adjacent to the building, so it frequently produces confusion in the building extraction.
4. Method
The implementation of the proposed method mainly included image segmentation and non-building object screening, initial building set extraction by AMAP–OBC, and further identification of indefinite objects. A specific description of the implementation process is shown in
Figure 2.
4.1. Image Segmentation and Non-Building Object Screening
4.1.1. Image Segmentation by WJSEG
As shown in
Figure 2, the discrete pixels in an HRRS image are first classified into geographic objects with semantic information through image segmentation, thus providing basic analysis units for building extraction [
23]. The quality of segmentation has a strong influence on the practical value of the building extraction results [
24]. Therefore, wavelet-JSEG (WJSEG), an effective high-resolution remote sensing image segmentation method, was adopted in this study [
25].
Compared with the famous eCognition commercial software, WJSEG locates object boundaries more accurately in the complex background of a city, and helps to increase the transparency of the proposed method [
26]. As an advanced multiscale segmentation method, WJSEG mainly includes four steps: Multiband image fusion, seed region conduction and secondary extraction, inter scale constraint segmentation, and region merging. The specific implementation steps can be found in [
25].
4.1.2. Non-Building Object Screening
On the basis of segmentation results, objects that differed significantly from the morphological characteristics of the building were removed, along with shadow and vegetation detection results. For each extracted object, the specific screening rules were as follows:
Rule 1: In order to reduce false positives caused by shadow, a pixel-level shadow detection method based on the Gaussian distribution background model theory was adopted. The specific implementation steps can be found in [
27]. If the proportion of shadow pixels in an object was greater than 80%, the object was considered to be seriously affected by shadow and should be removed.
Rule 2: In order to reduce false positives caused by vegetation such as lawn and tree canopy, a vegetation index based on the red-green-blue (RGB) model was adopted to extract vegetation pixels. The specific implementation steps can be found in [
18]. If the proportion of vegetation pixels in an object is greater than 80%, remove this object.
Rule 3: If there were fewer than 10 pixels in an object, the object was considered to be a dim or small target, such as a vehicle or noise, and it should be removed.
Rule 4: If the rectangular degree of an object was less than 0.8 and the length–width ratio of its minimum bounding rectangle was greater than 5, the object was considered to be a narrow target, such as a road or waterway, and it should be removed [
28].
After the discrimination of all objects in segmentation results with the above group of rules, the remaining objects constituted a candidate object set as the input for subsequent building extraction.
4.2. Initial Building Set Extraction by AMAP–OBC
4.2.1. Producing Attribute Profile Under the Object Boundary Constraint
During the process of calculating the attributes, the connected area for each pixel is produced by the similarity between adjacent pixels in traditional MAPs, as shown in
Figure 3.
As shown in
Figure 3,
i represents a general pixel that belongs to an object in the candidate object set. The extracted corresponding connected area in a traditional MAP is expressed as the area with a black mesh pattern. It is shown that this area has invaded into adjacent objects. In this case, the inherent attributes of the current object cannot be accurately extracted. Therefore, this study retained only the pixels that were inside the object to produce the connected area for pixel
i, as shown by the area with red lines. That is, the connected area would be constrained by the inherent boundary of the object pixel
i belonging to, thus providing more accurate attributes for subsequent building extraction.
4.2.2. Adaptive Scale Parameter Extraction
Based on the connected areas, the MAPs of different attributes were constructed according to Equations (1)–(4) in
Section 3.1. In this process, whether the selection of the scale parameter set was reasonable was the key factor that affected the building extraction, which depended on the following: In urban scenes, building clusters in the same local area (such as a residential or industrial area) usually have a class of typical morphological attributes different from other features. Therefore, in the multiscale MAP of each attribute, it should be ensured that building clusters with typical attributes in the scene could be extracted through subsequent differential processing, while other objects were just removed. Based on this principle, this study proposed an adaptive extraction strategy for scale parameters, and the specific steps were as follows:
Step 1: Set the range and subintervals of the attribute interval to adaptively search the optimal scale parameters. According to suggestions regarding the fluctuation range of building attributes in [
29,
30,
31], set area interval as [500, 28000], diagonal interval as [10, 100], standard deviation interval as [10, 70], and NMI interval as [0.2, 0.5], and divided each interval equally into 50 subintervals.
Step 2: For each attribute, let denote the xth subinterval. Under the object boundary constraint, the number of connected areas that met the requirements of the attribute range corresponding to was calculated, denoted by .
Step 3: Denote
as an index of change degree. If it satisfies:
The initial value of
and the final value of
are included as the optimal scale parameters. If it satisfies:
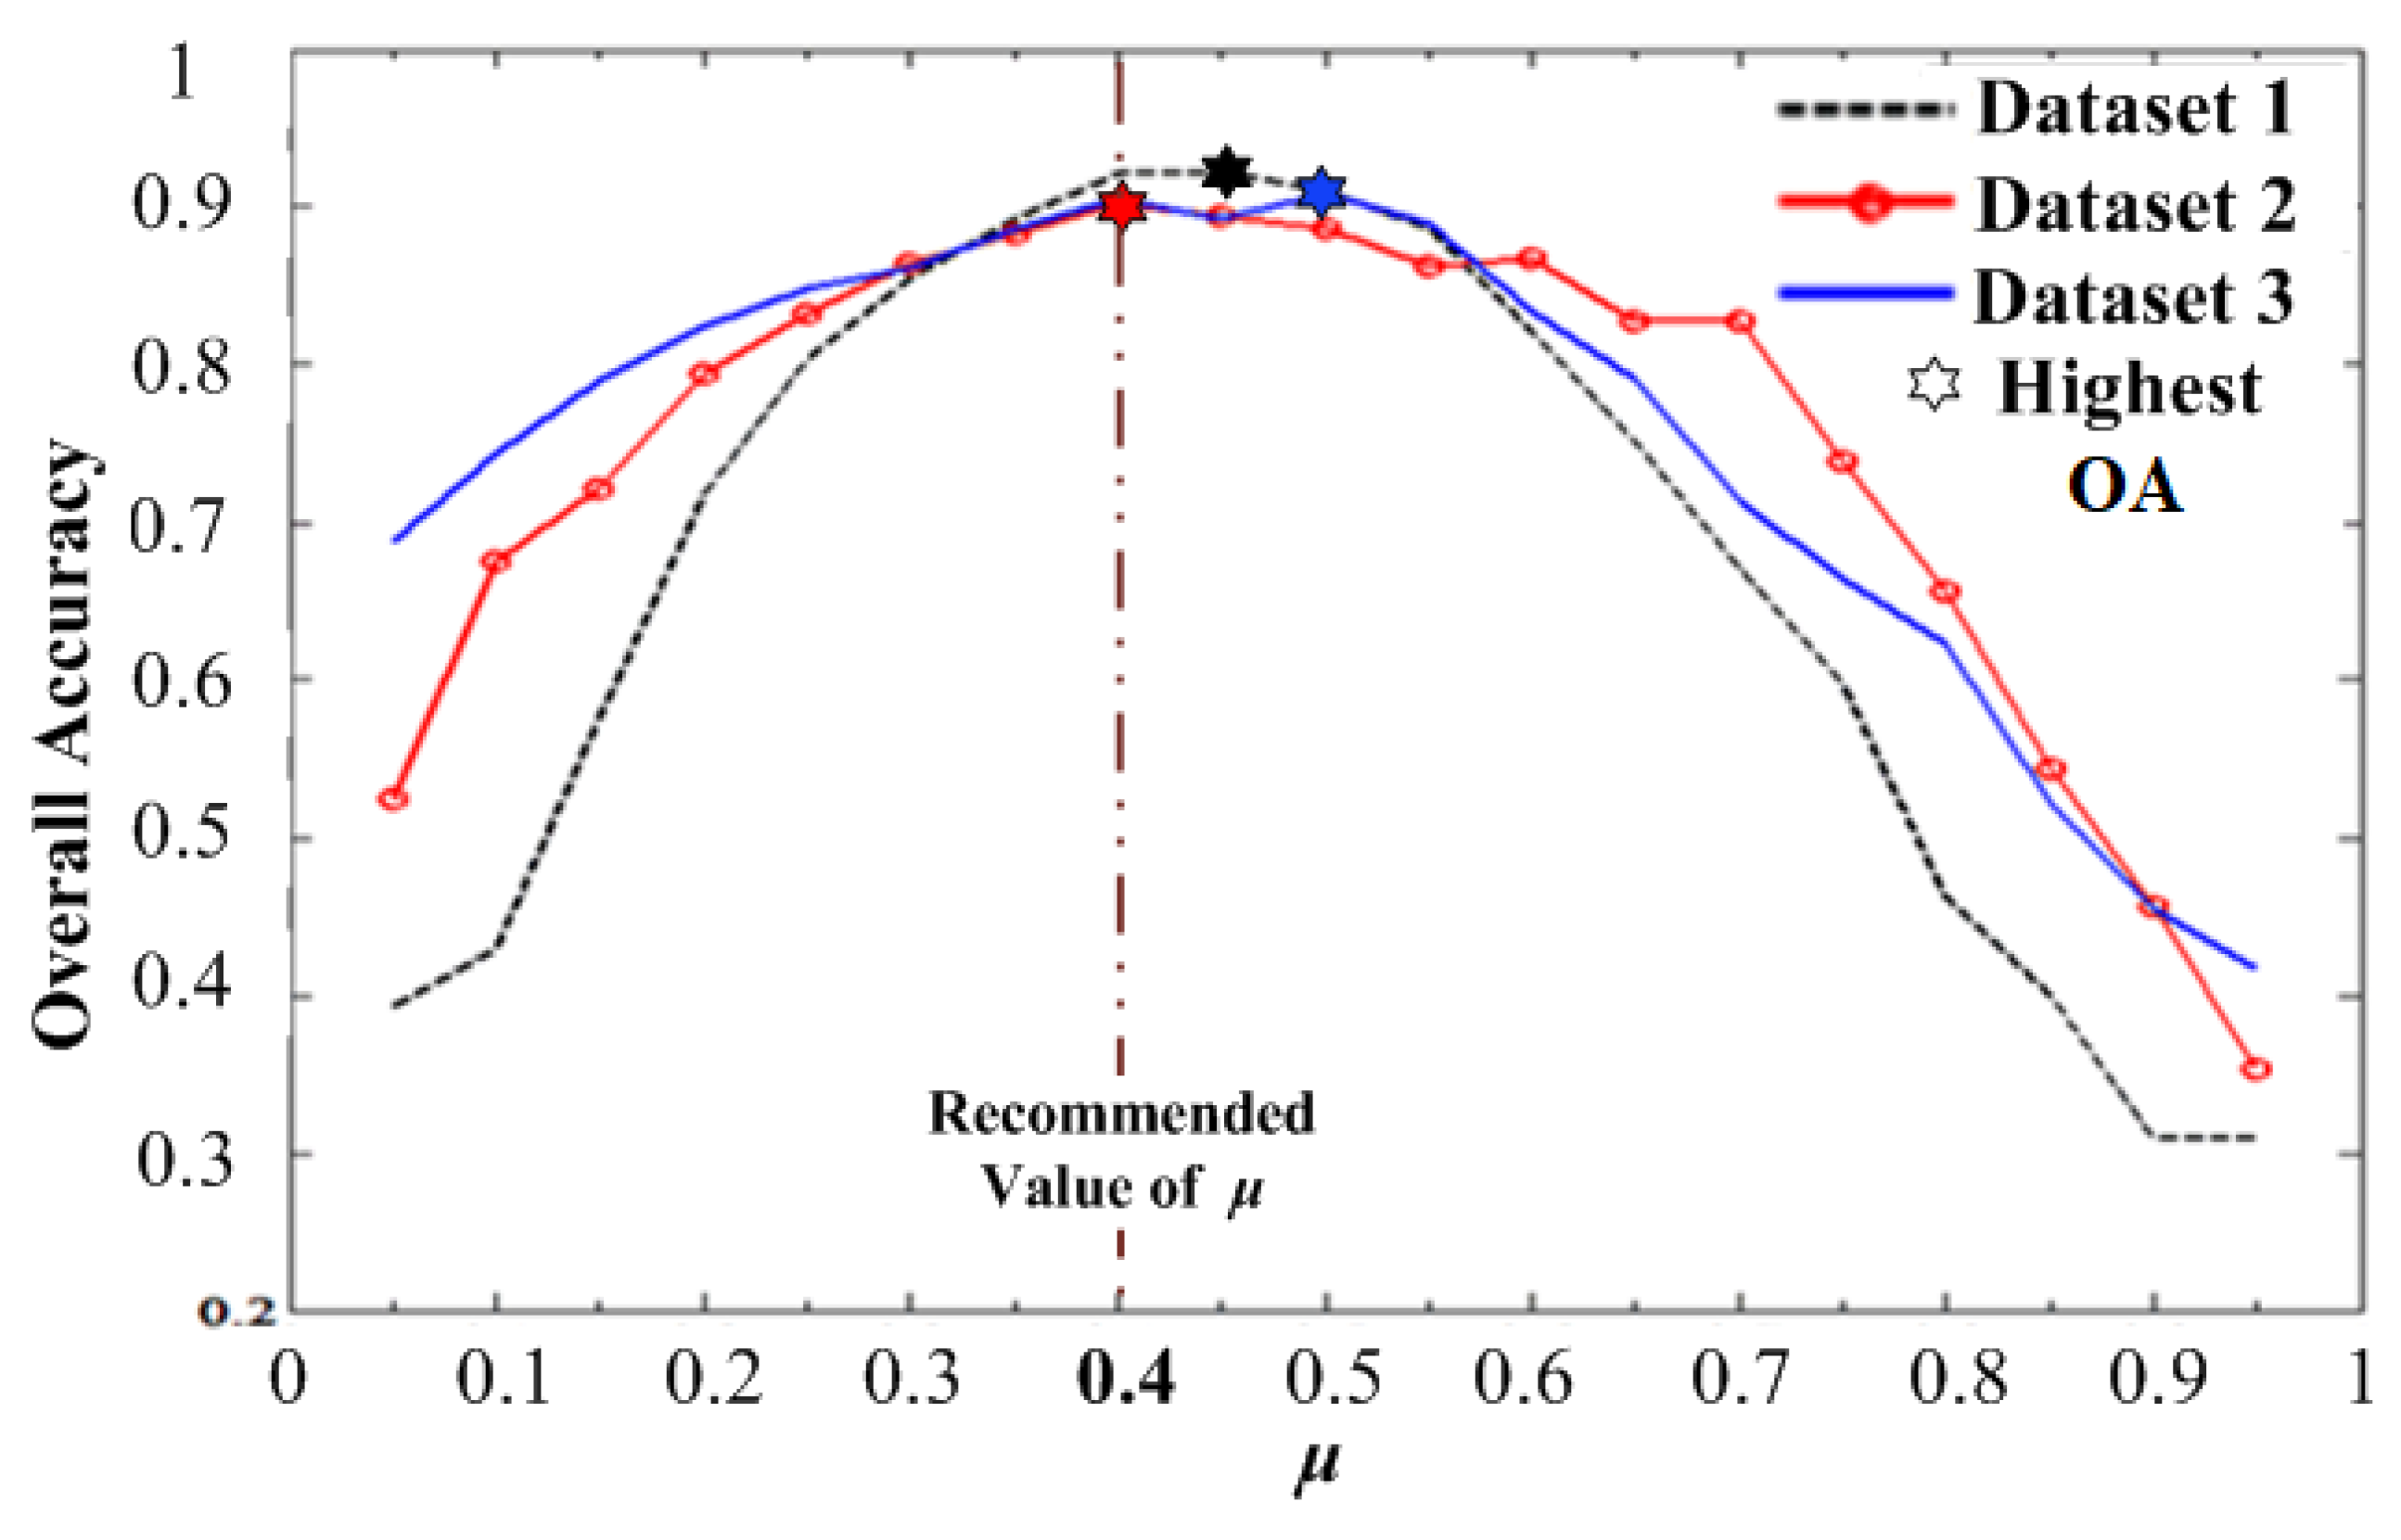
The initial value of and the final value of are included as the optimal scale parameters; otherwise, continue the discrimination in the next interval. According to the ideal results of multiple experiments, it is suggested to set as 0.4 in this study.
The proposed adaptive scale parameter extraction strategy was based on the following corresponding relationships between morphological attributes and characteristics of buildings in HRRS images: If the number of connected areas satisfying the attribute range corresponding to was significantly higher than that of , or when the number of connected areas satisfying the attribute range corresponding to was significantly lower than that of , matched the typical morphological attributes of the building clusters that might exist in the scene. Therefore, it was necessary to consider as a typical interval, and the corresponding scale parameters need to be retained to ensure that the connected areas corresponding to could be effectively extracted during the differential processing.
Step 4: Traverse all intervals and use all optimized scale parameters extracted to form the final scale parameter set . Then, the proposed AMAP–OBC could be produced based on and under object boundary constraint.
Step 5: Conduct DAP by the steps introduced in
Section 3.1. On this basis, the pixels in each DAP that conformed to the attribute range of the building constituted a union set, and the pixels belonging to shadow and vegetation were removed. Finally, combined with the obtained set of candidate objects, all objects containing building pixels were retained to form the initial building set.
4.3. Further Identification of Indefinite Objects
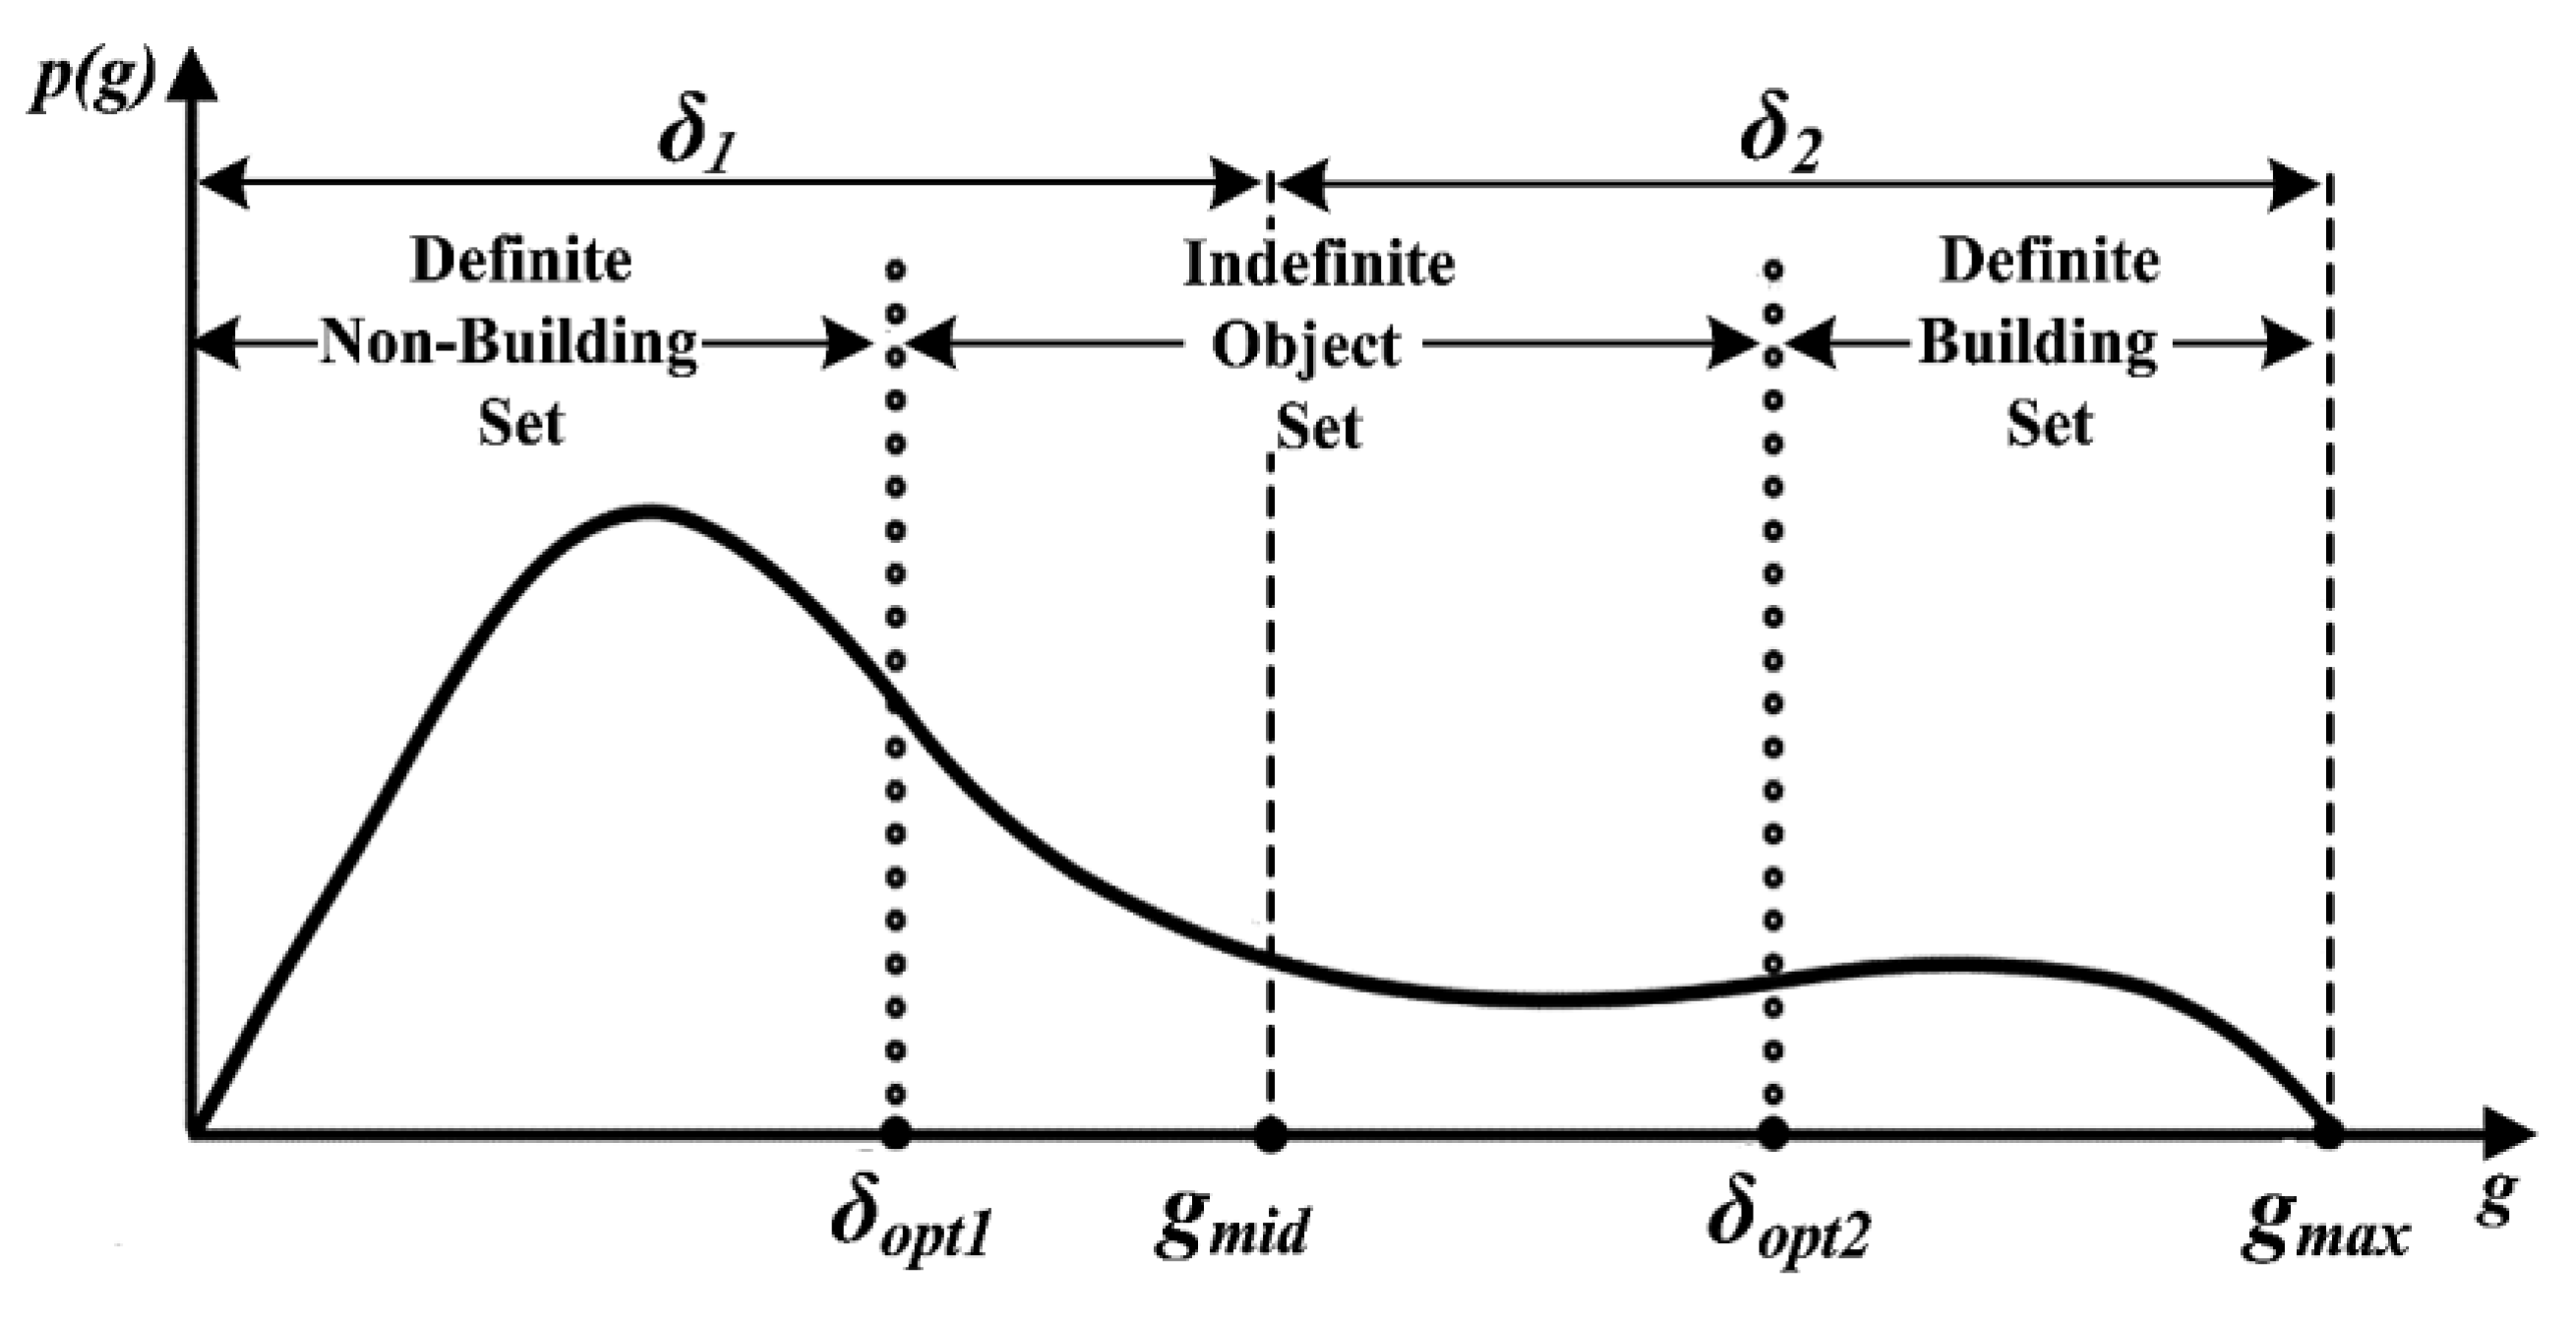
The extraction results of the initial building set are not reliable, because the objects only need to meet the conditions for the existence of building pixels from AMAP–OBC. For this reason, this study partitioned the initial building set into a definite building set, an indefinite object set, and a definite non-building set, and further identified the indefinite objects. The specific steps were as follows:
Step 1: In the initial building set, let denote the building pixel proportion in an object and denote the maximum of , .
As shown in
Figure 4,
represents the number of objects with
in the initial building set, and the fluctuation intervals of dynamic thresholds
and
are
and
, respectively.
Step 2: Calculate the Jeffries Matusita (J–M) distance between any two objects that satisfy
and
to obtain the sum of these distances,
. Similarly,
can be calculated based on the objects that satisfy
and
. Let
; by traversing all possible combinations of
and
, the optimal combination can be adaptively extracted when the minimum value of
is obtained, as shown by
and
in
Figure 4. On this basis, the definite building set, indefinite object set, and definite non-building set are extracted.
Step 3: For each object in the indefinite object set, further identification was made. Let the sum of J–M distances between and all objects in the definite building set be , and the sum of J–M distances between and all objects in the definite non-building set be . If , put in the definite building set; otherwise, put in the definite non-building set.
Step 4: Traverse all objects in the indefinite object set to obtain the final building extraction results.


