Deep Learning and Machine Vision Approaches for Posture Detection of Individual Pigs

 ,
,
Abstract
:1. Introduction
2. Material and Methods
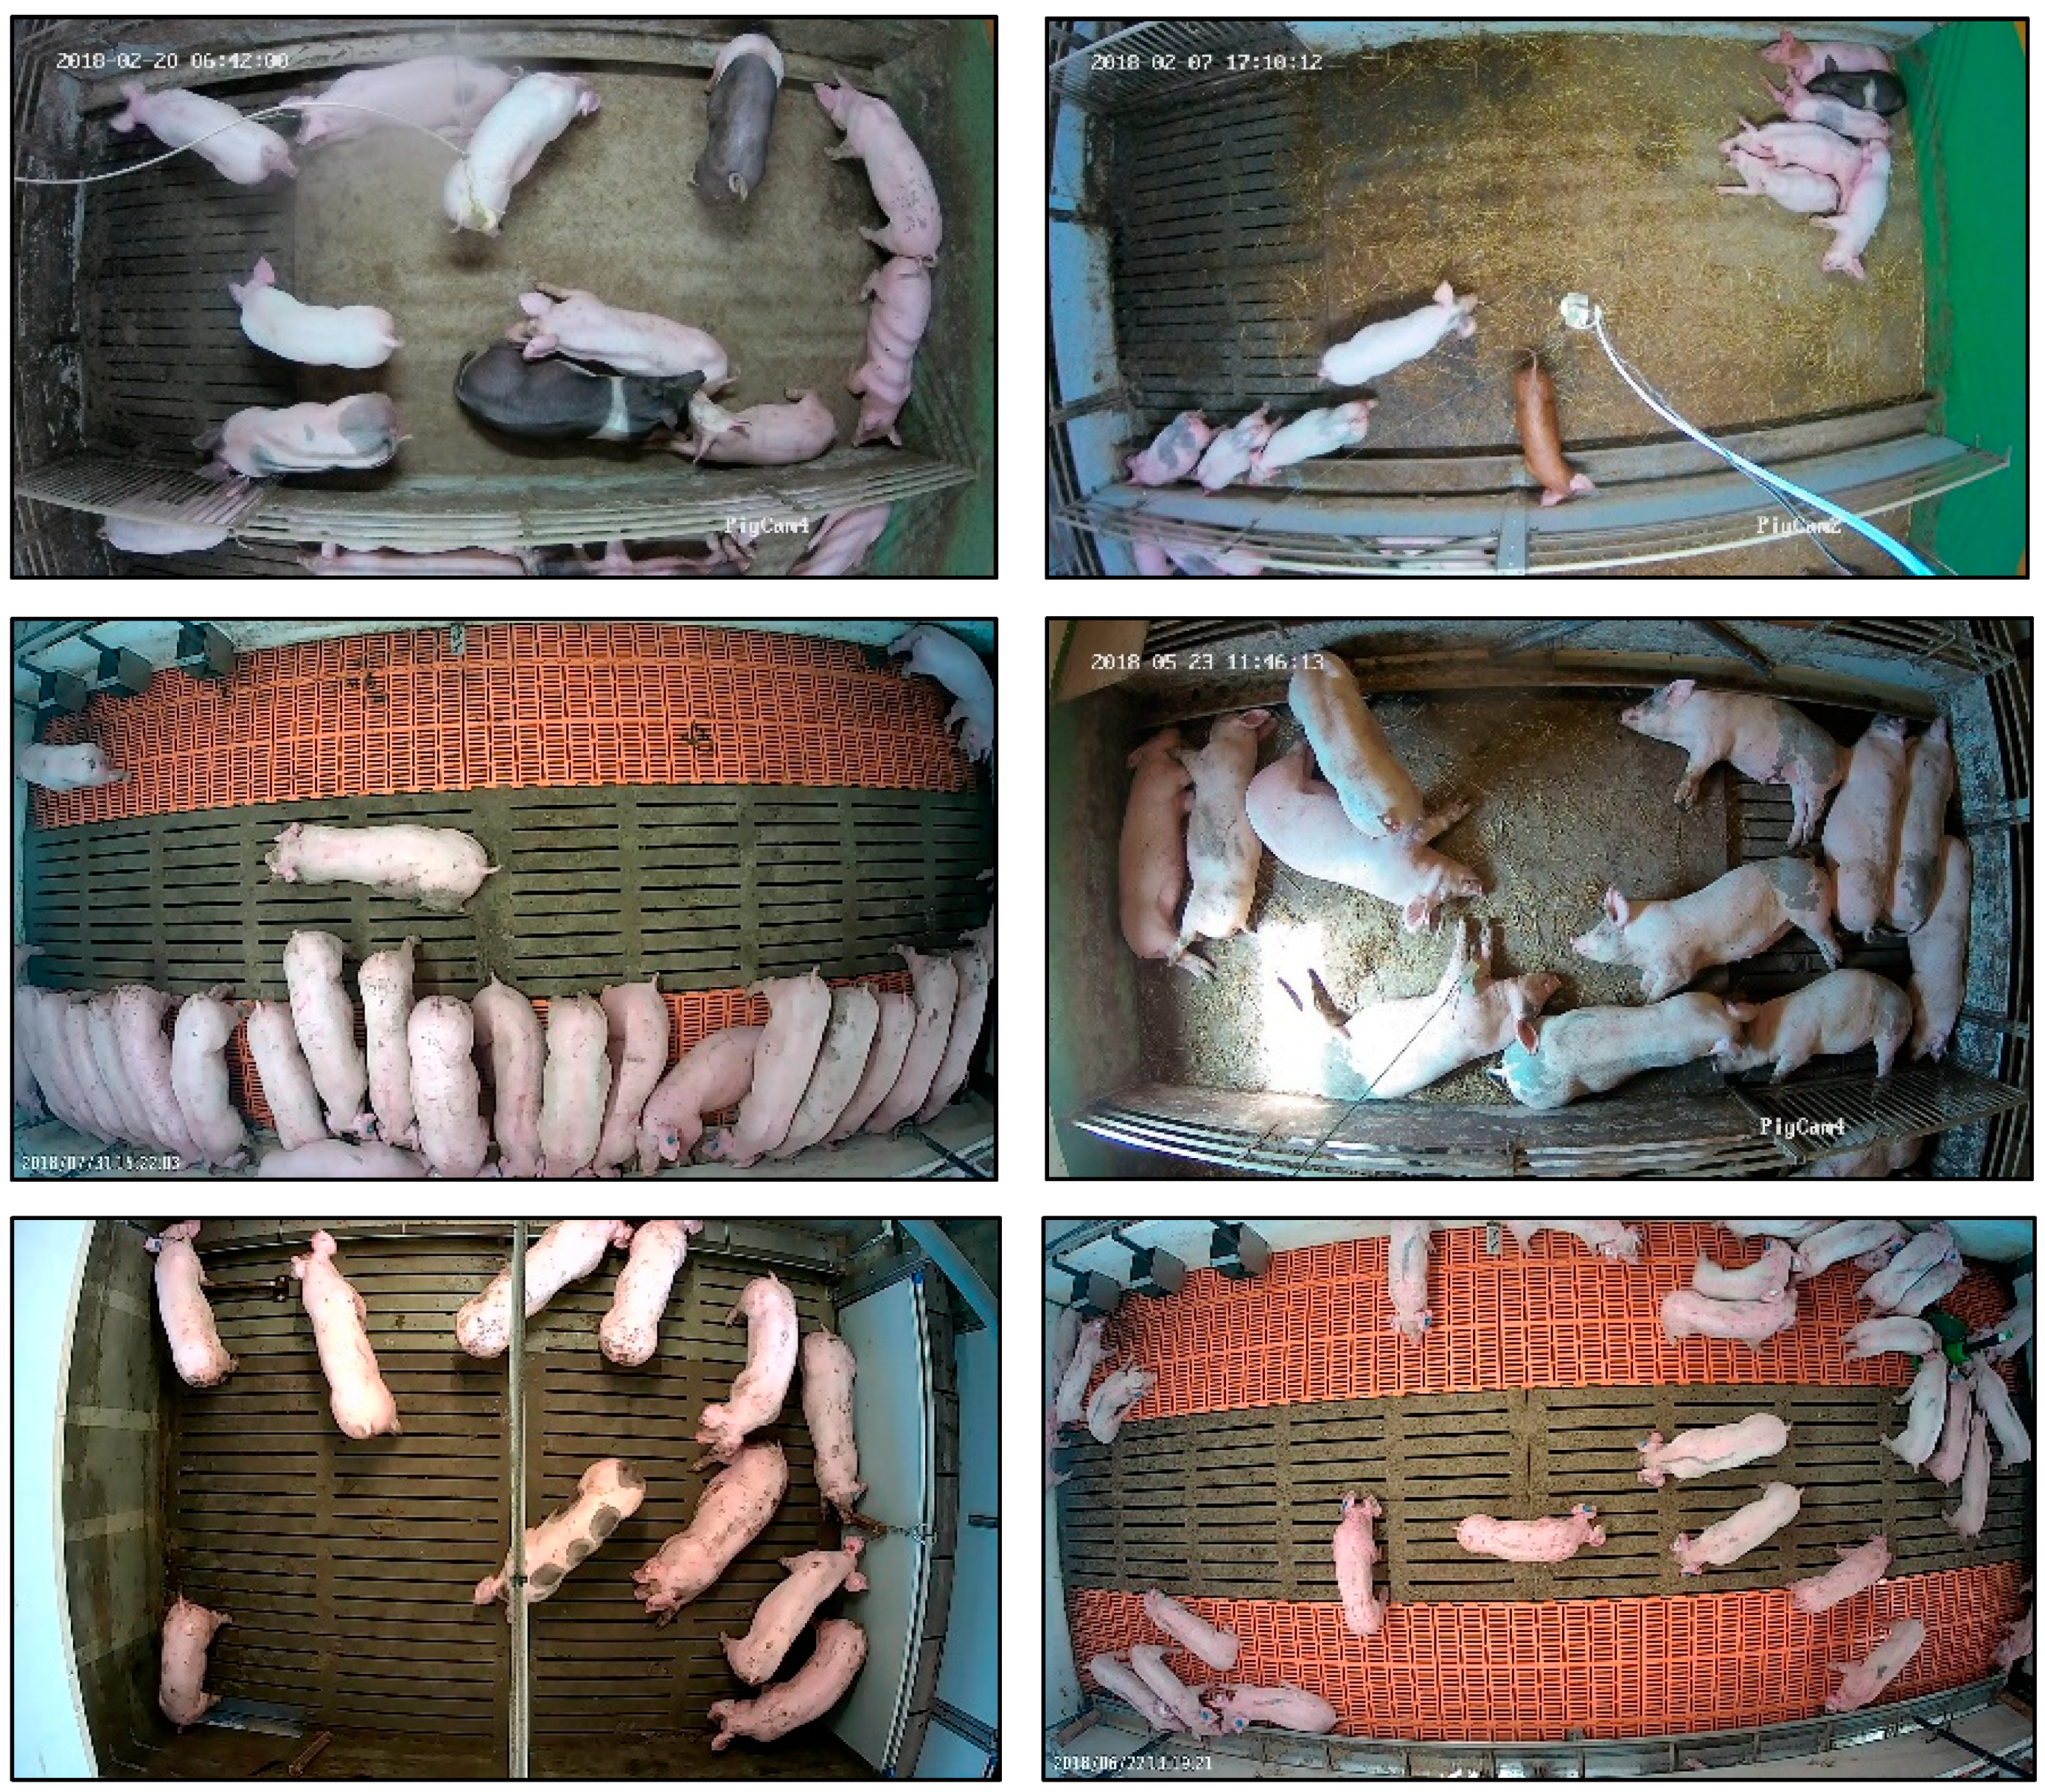
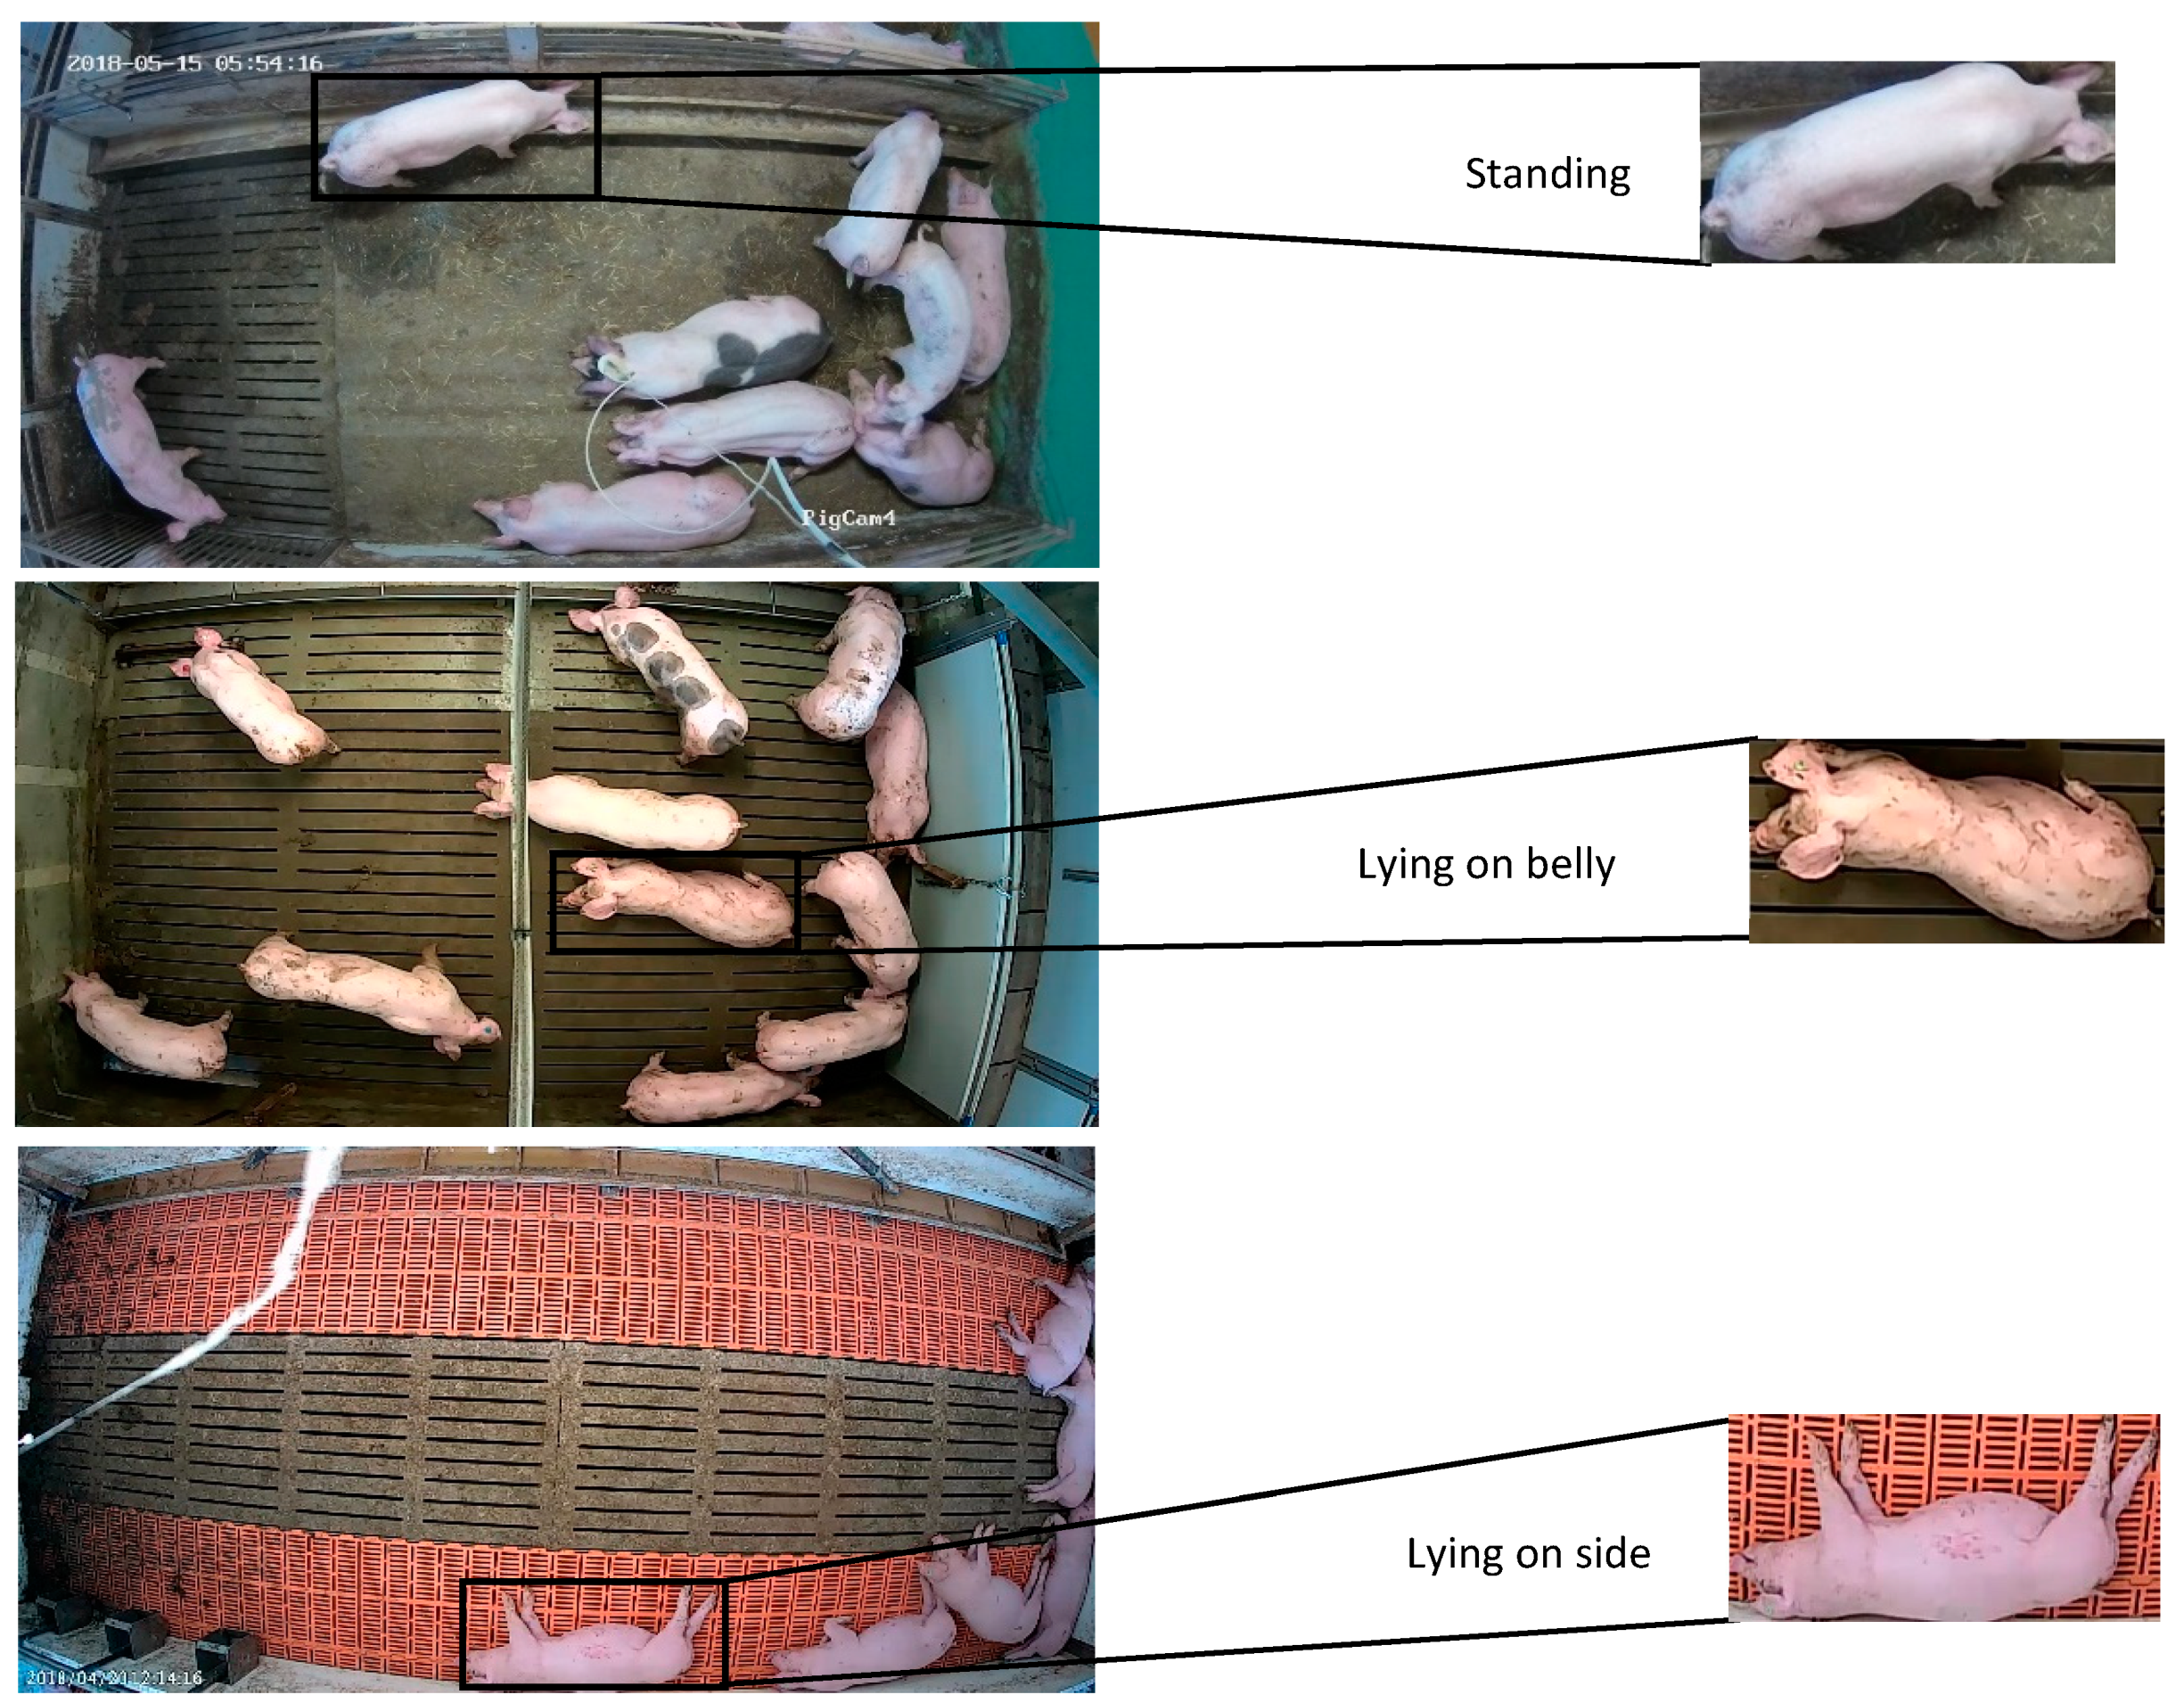
2.1. Housing and Data Collection
2.2. Proposed Methodology
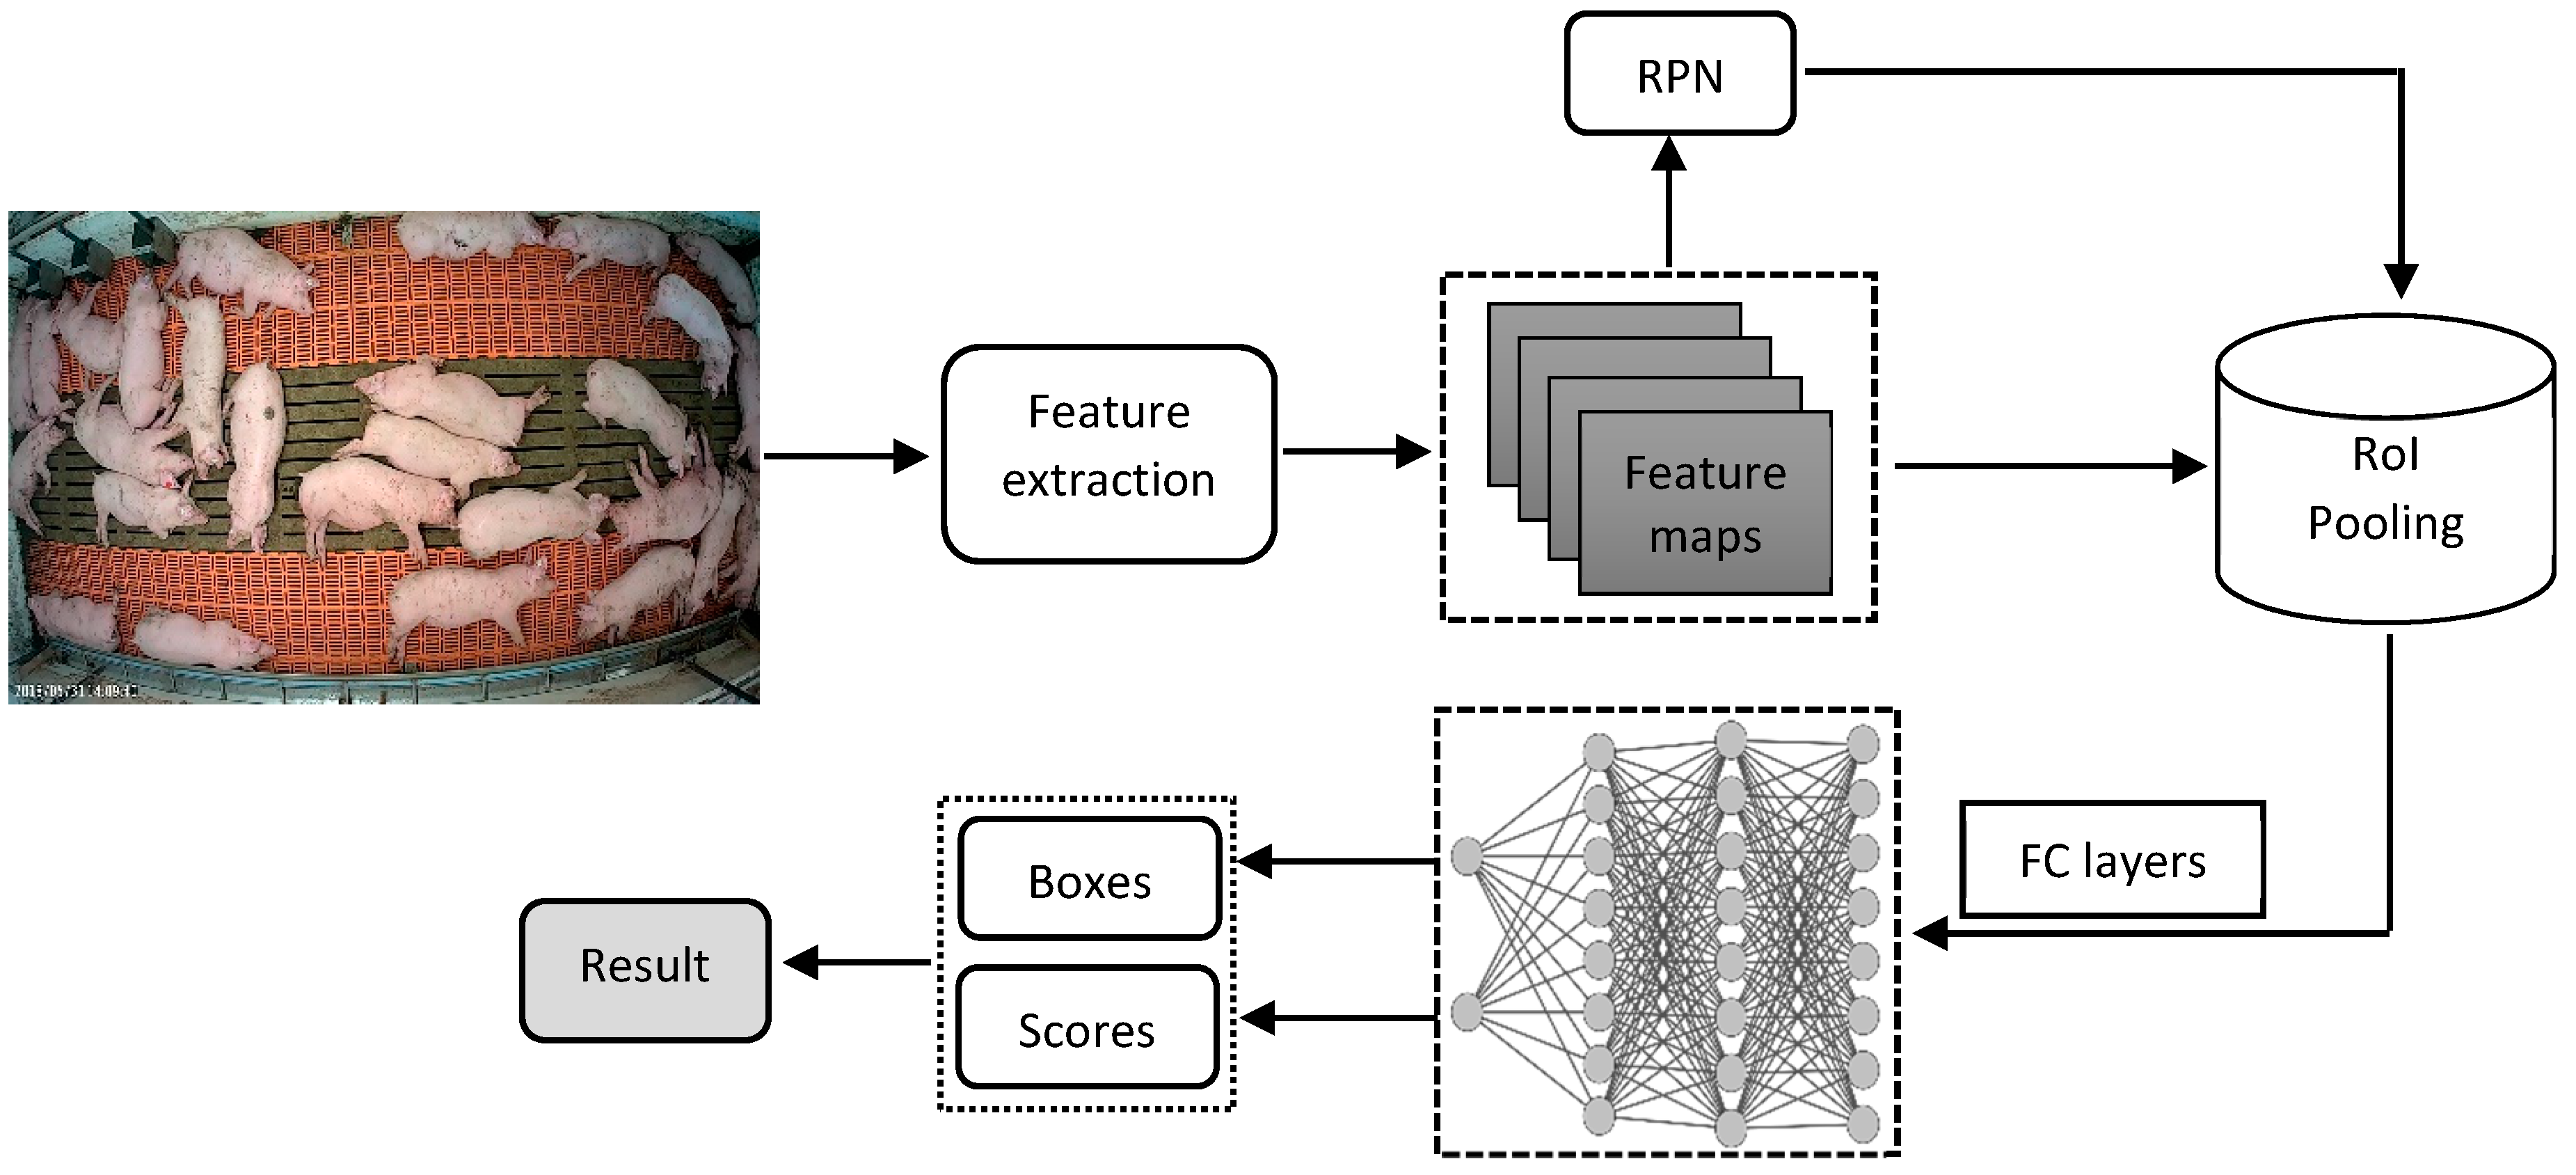
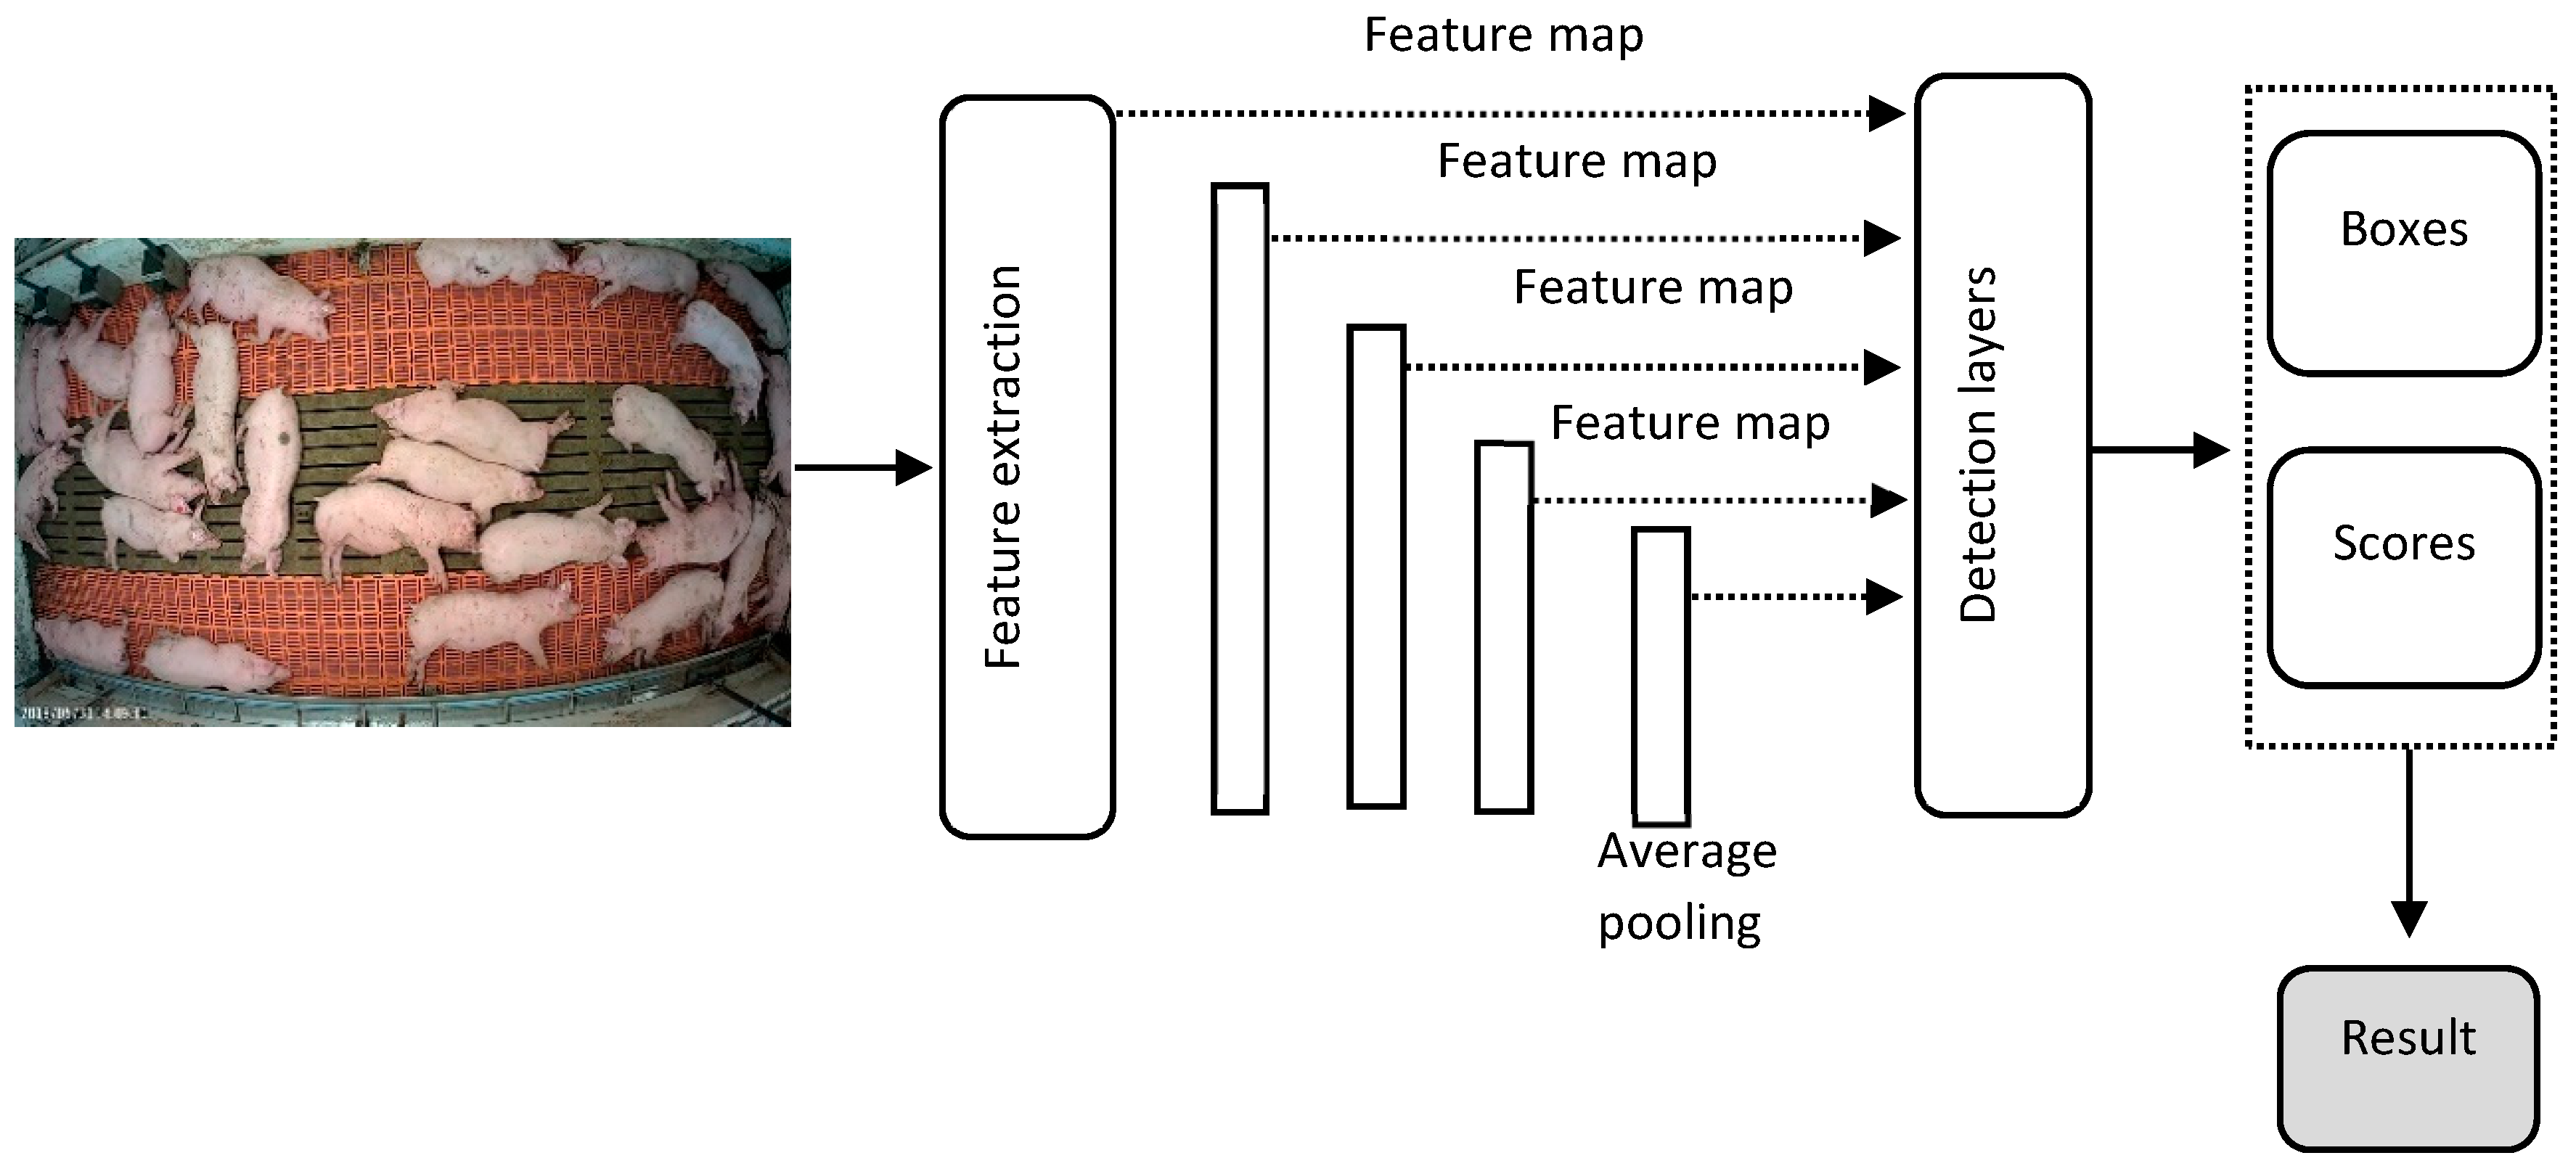
2.2.1. Faster R-CNN
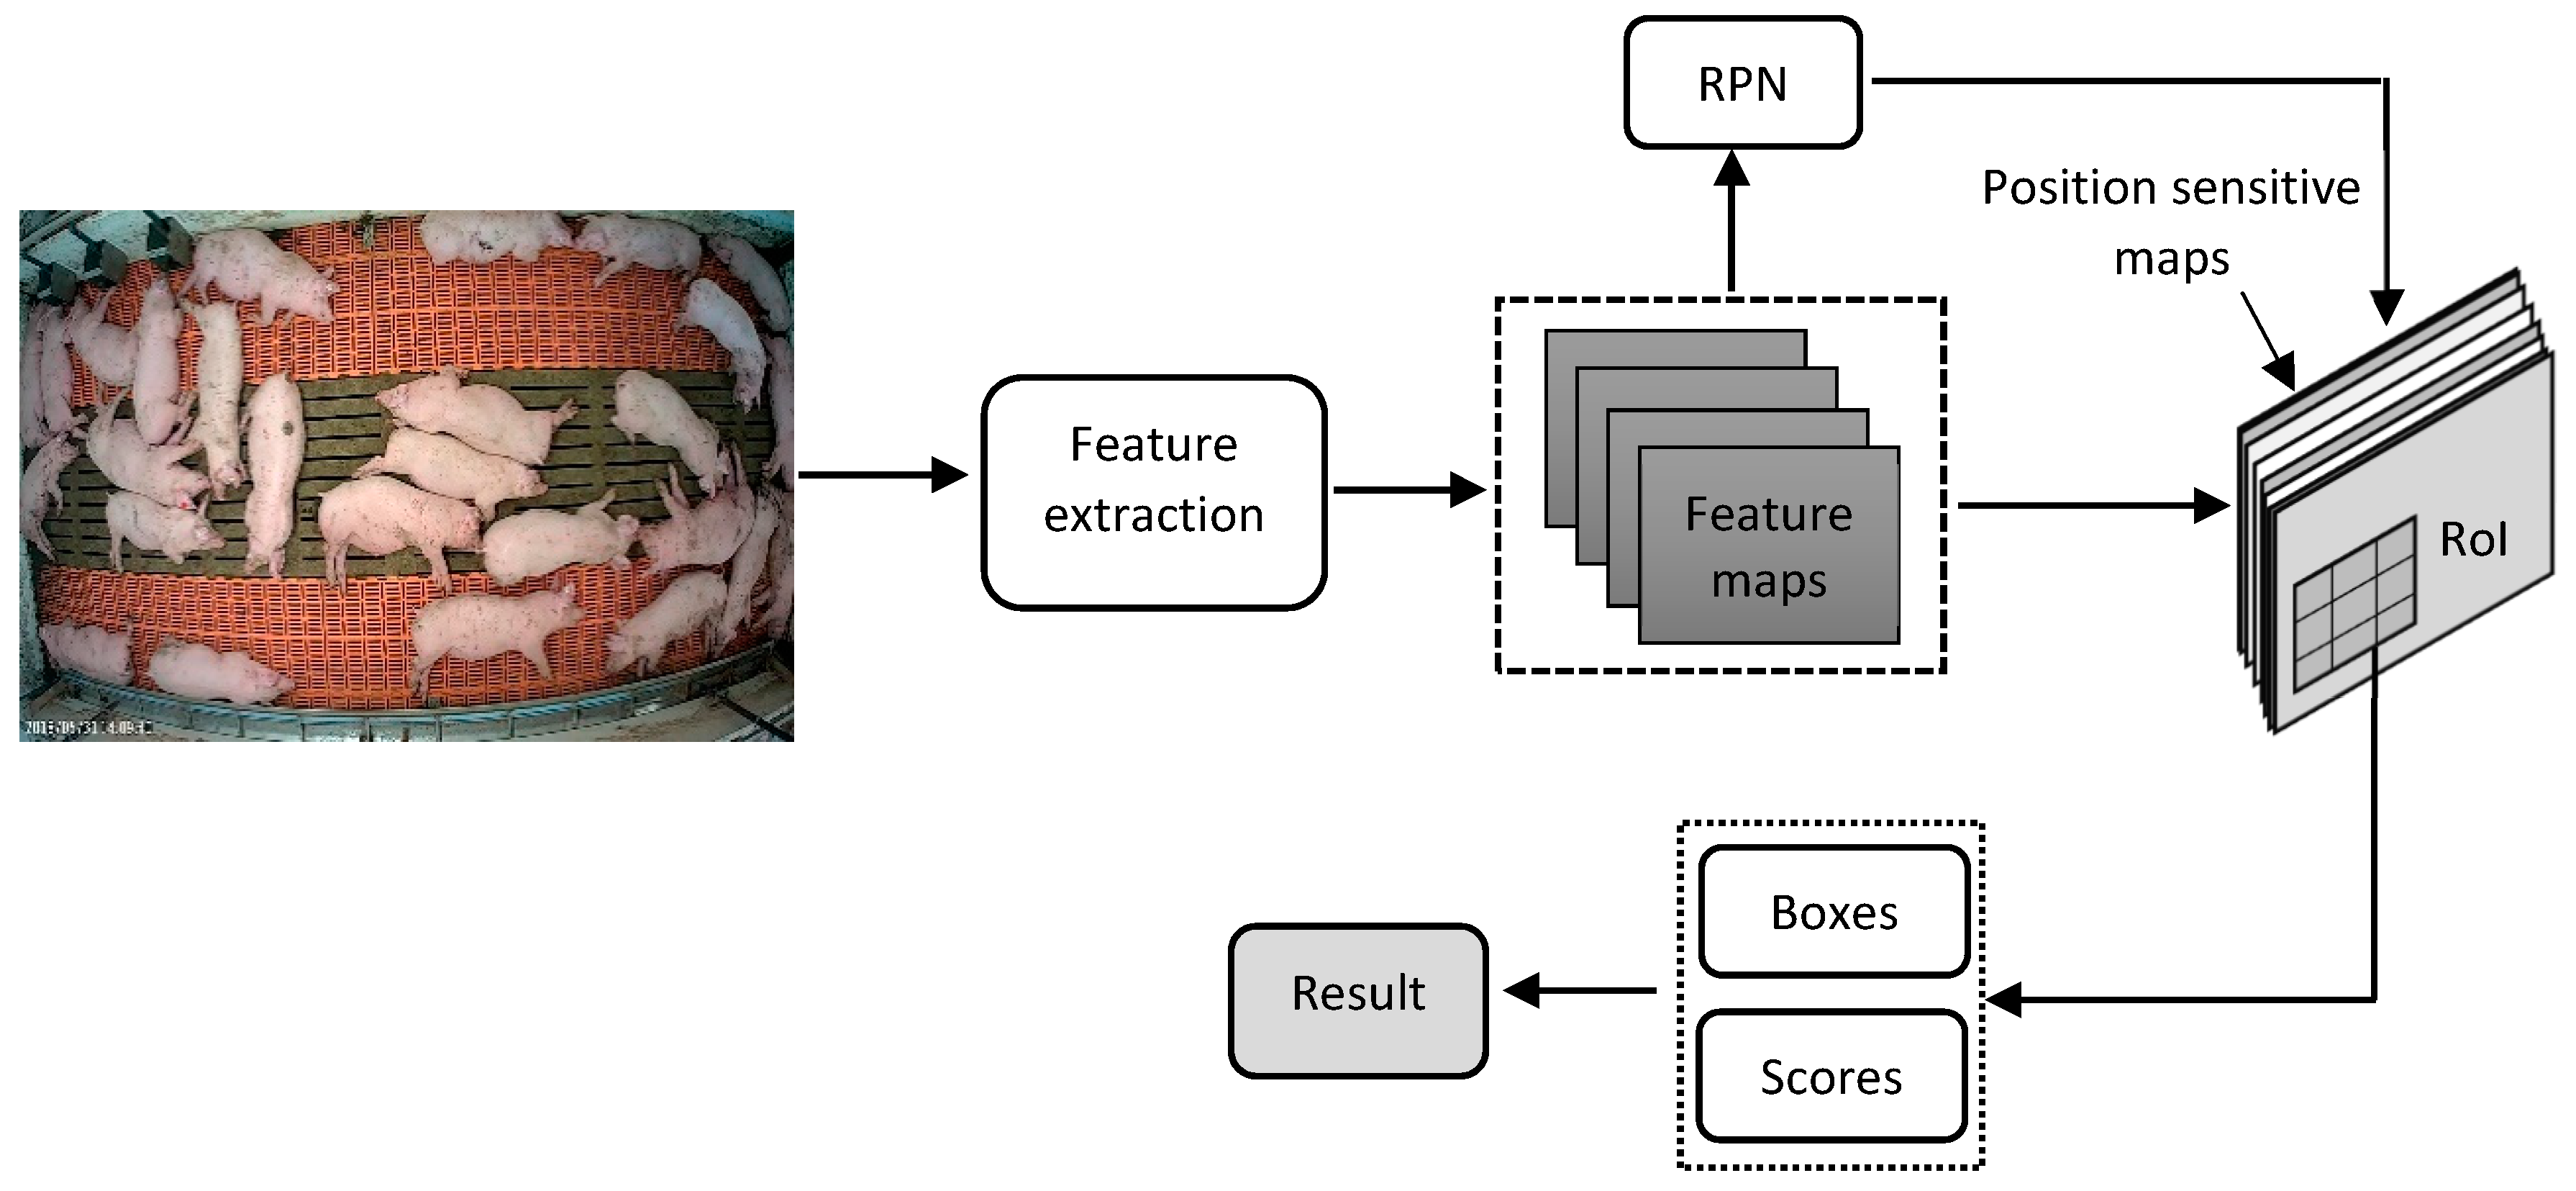
2.2.2. R-FCN
2.2.3. SSD
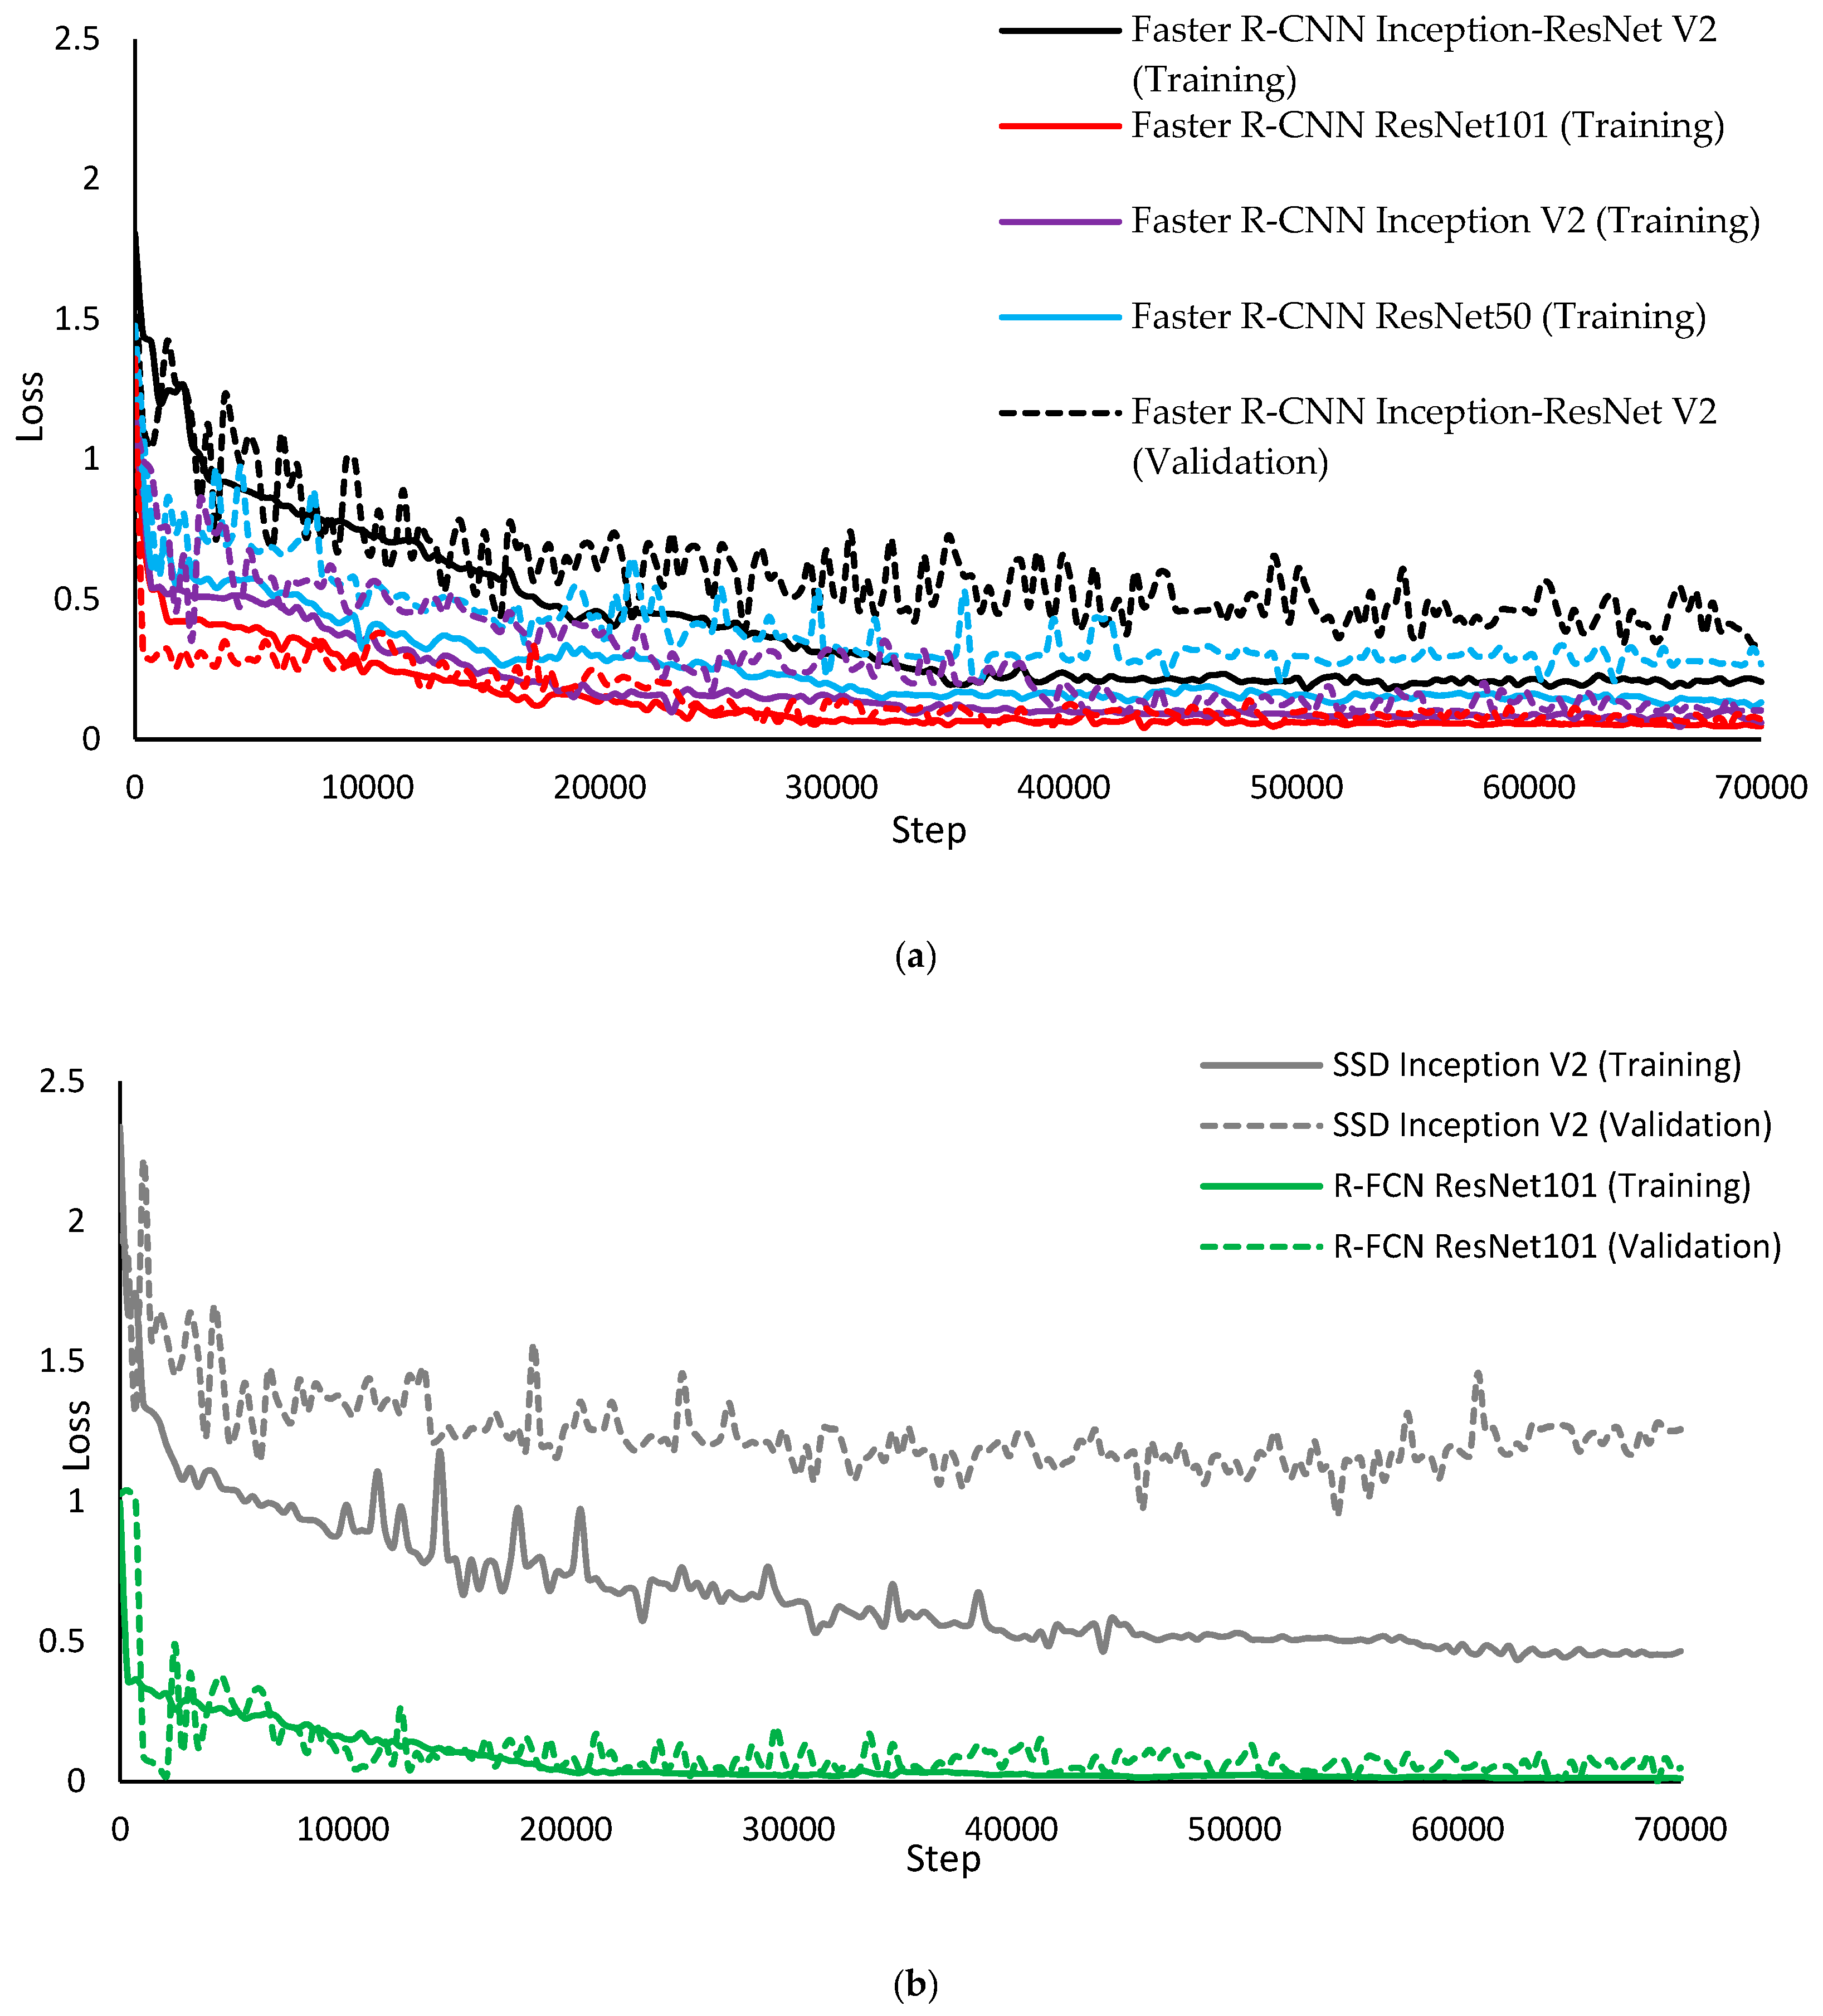
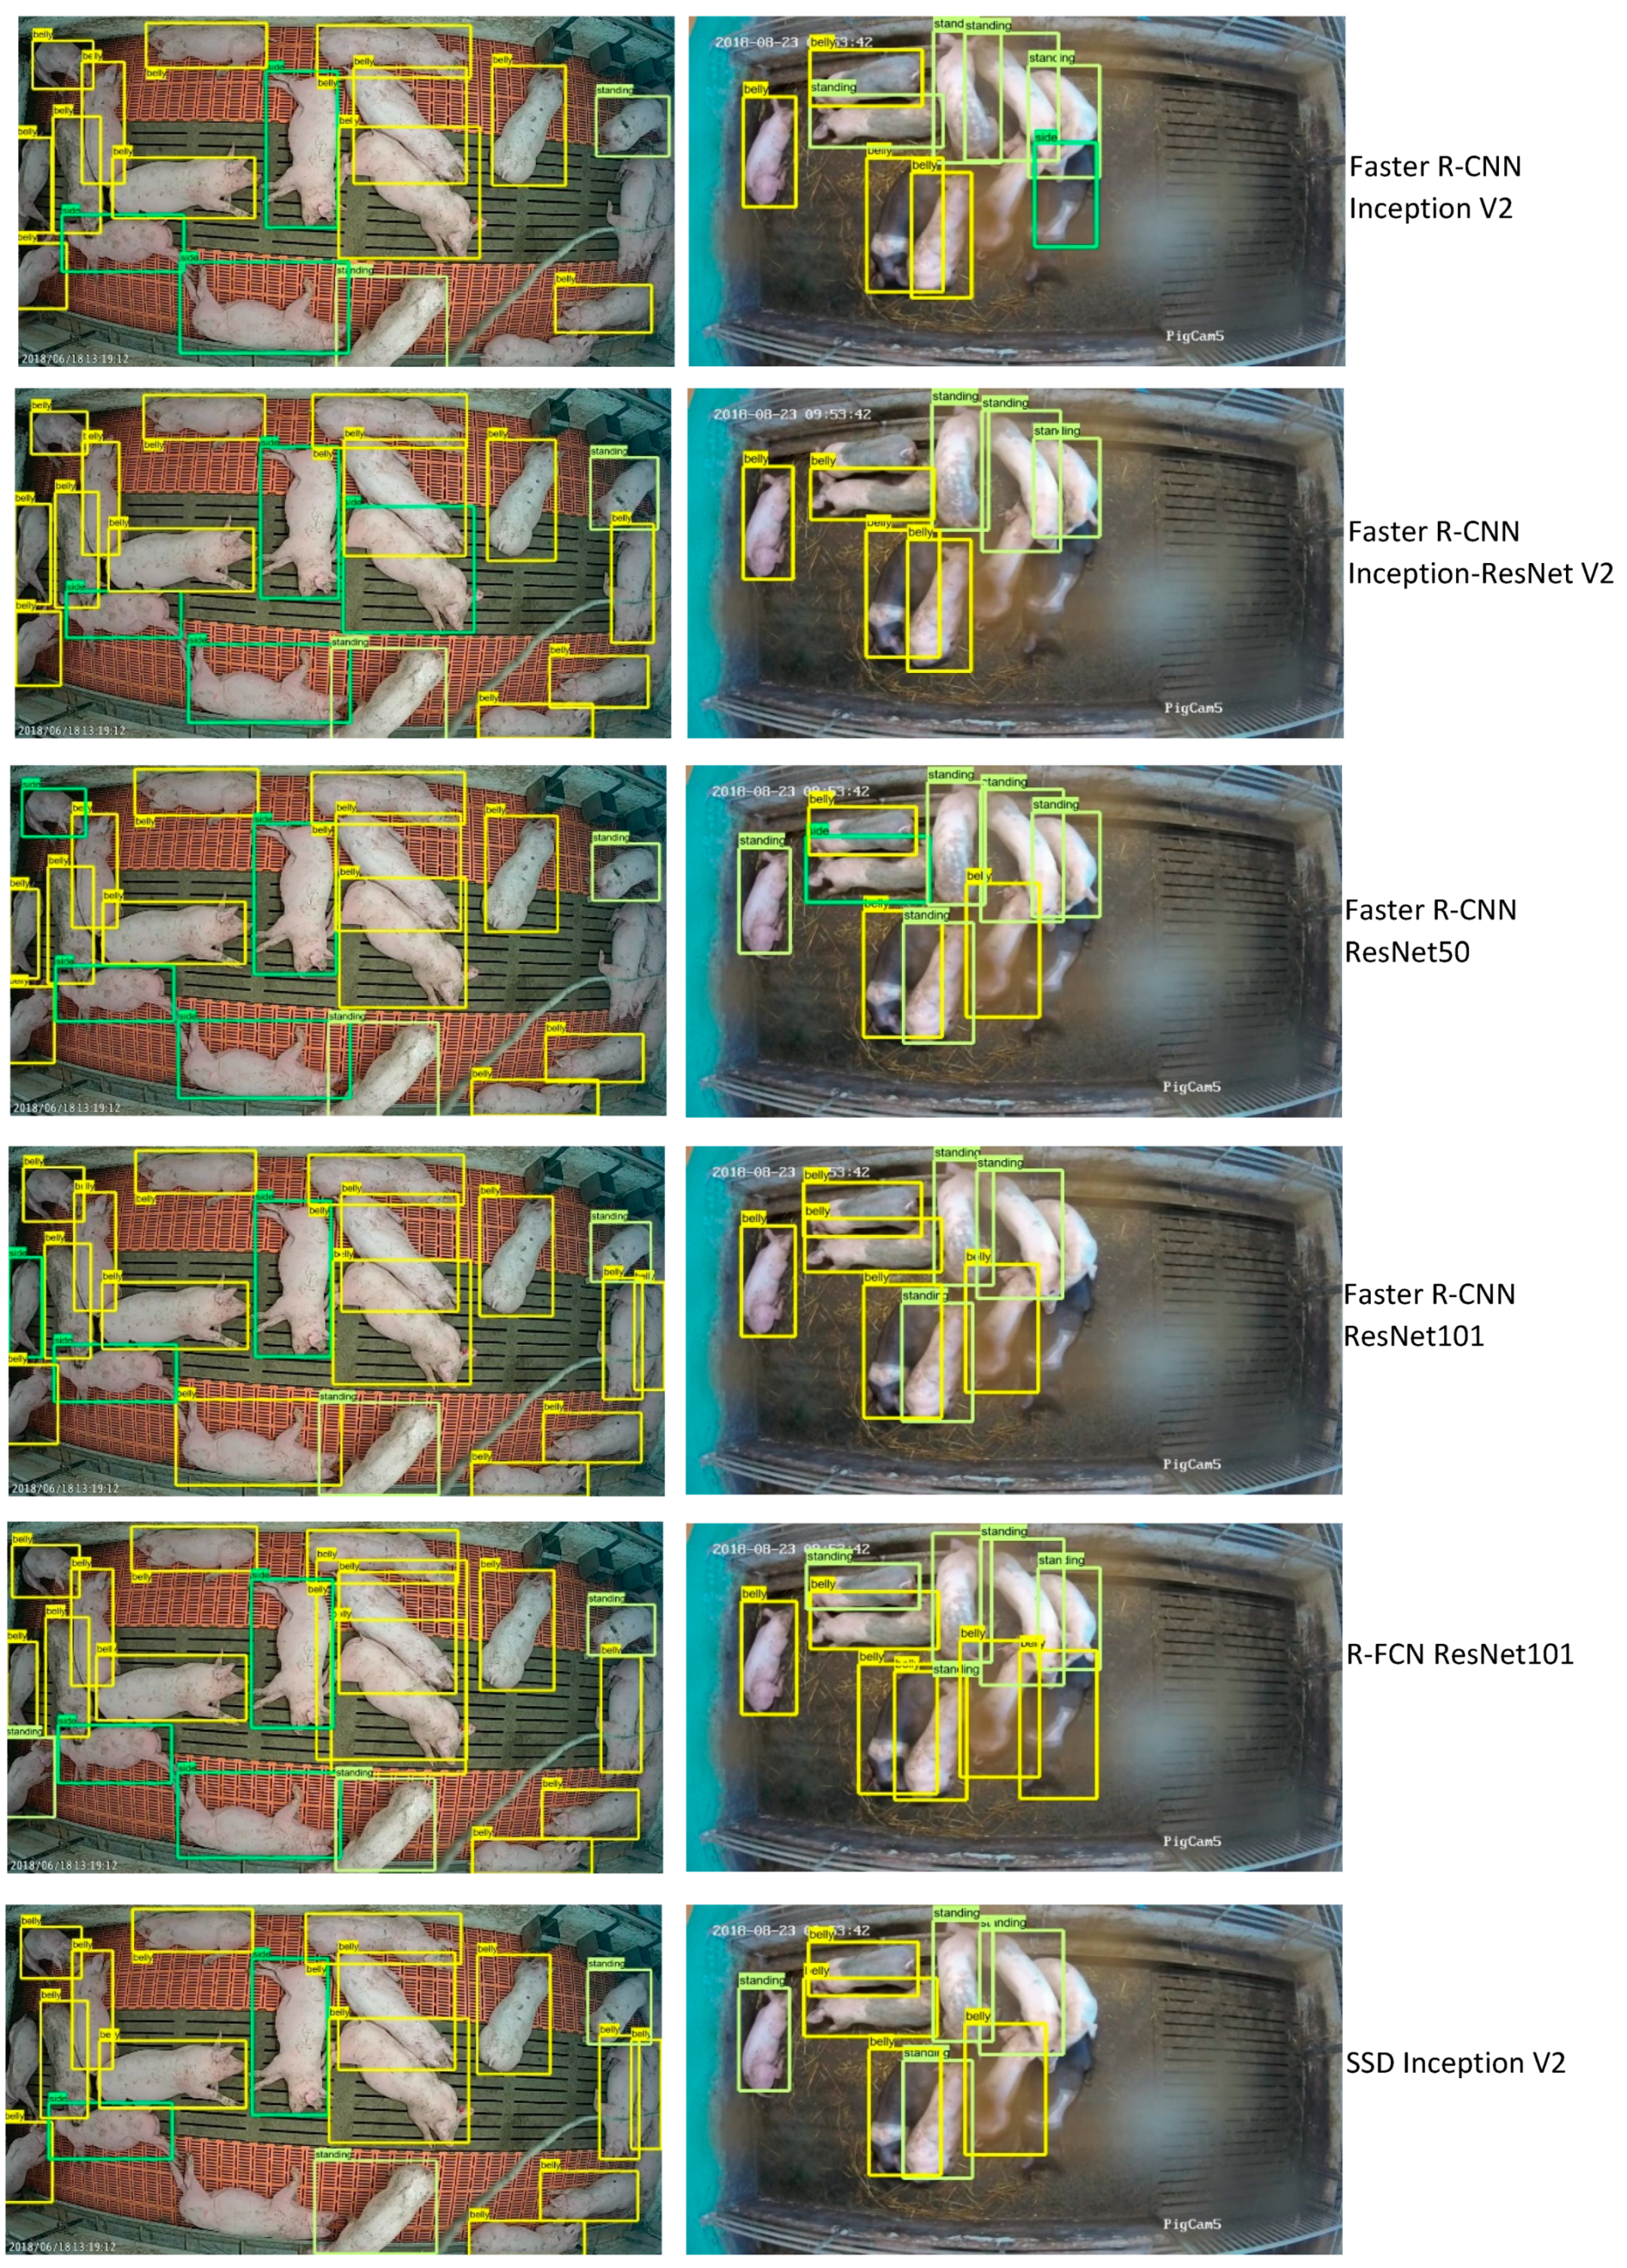
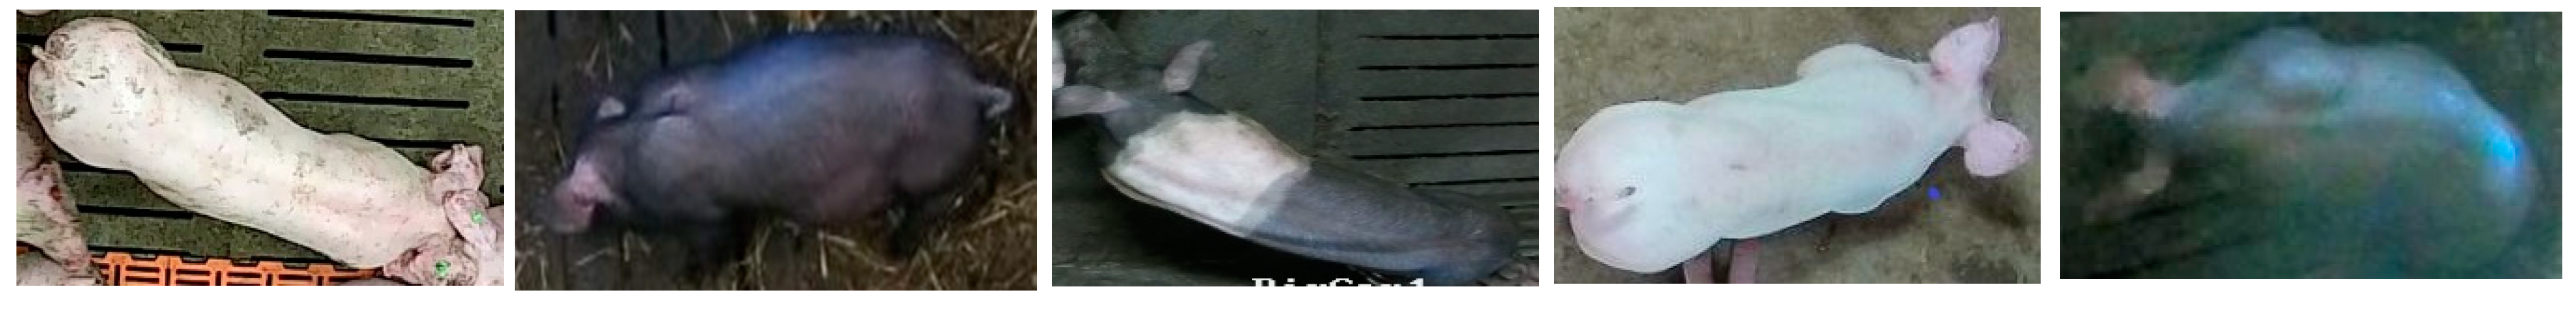
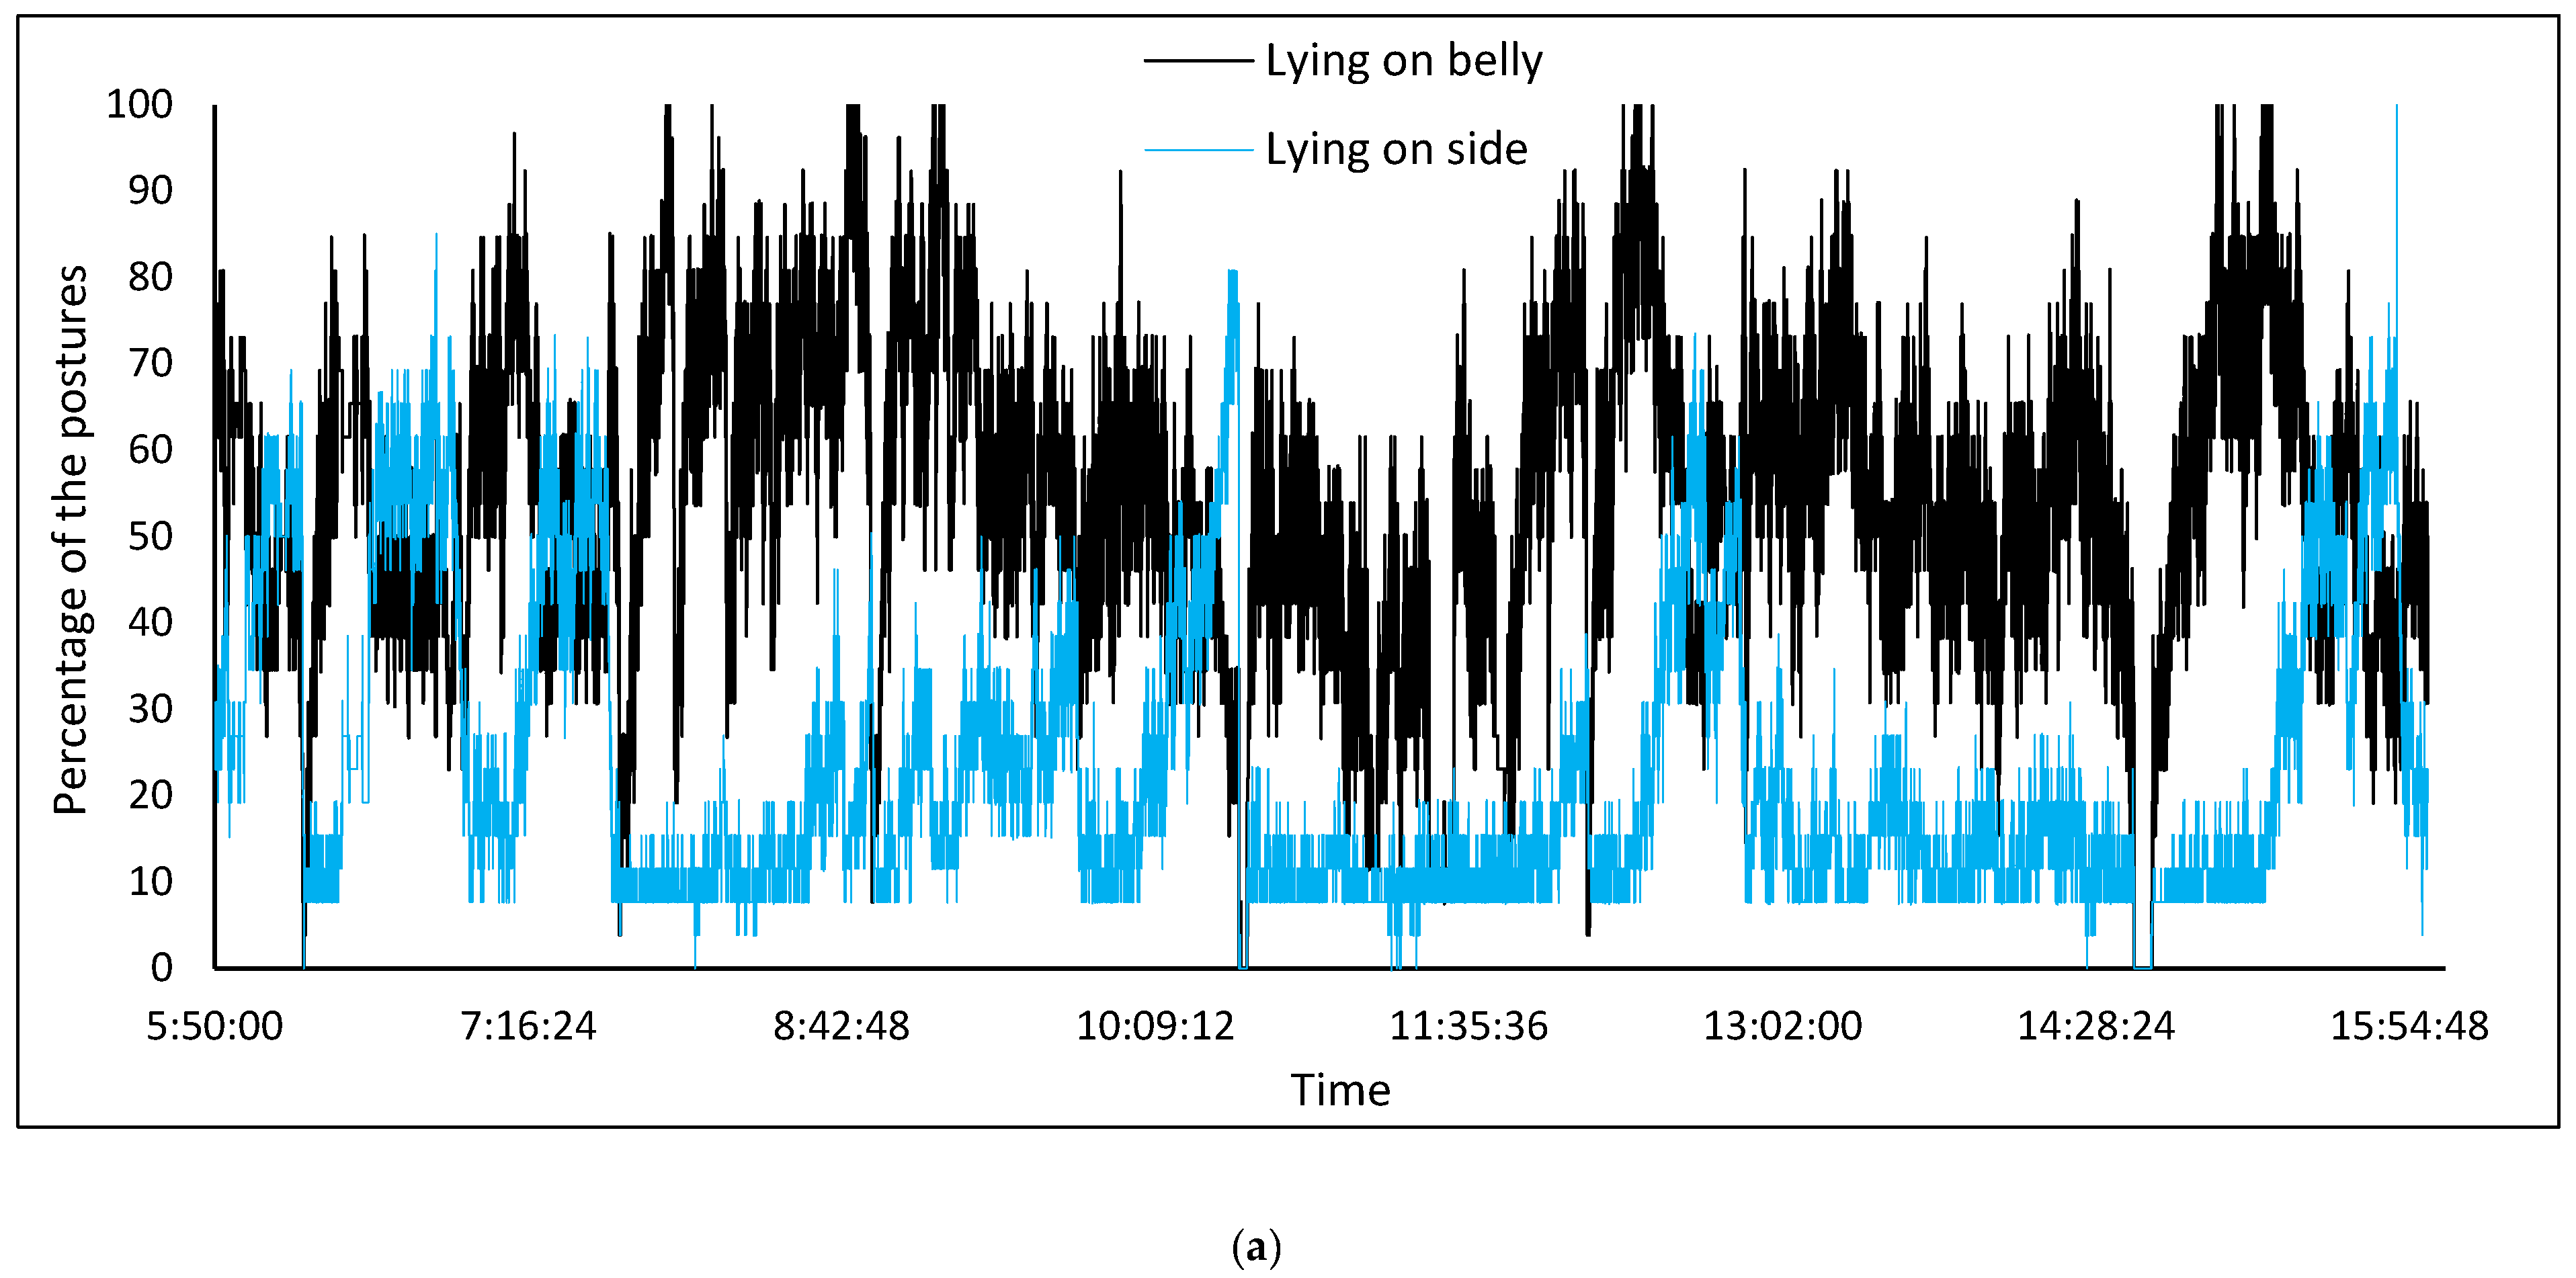
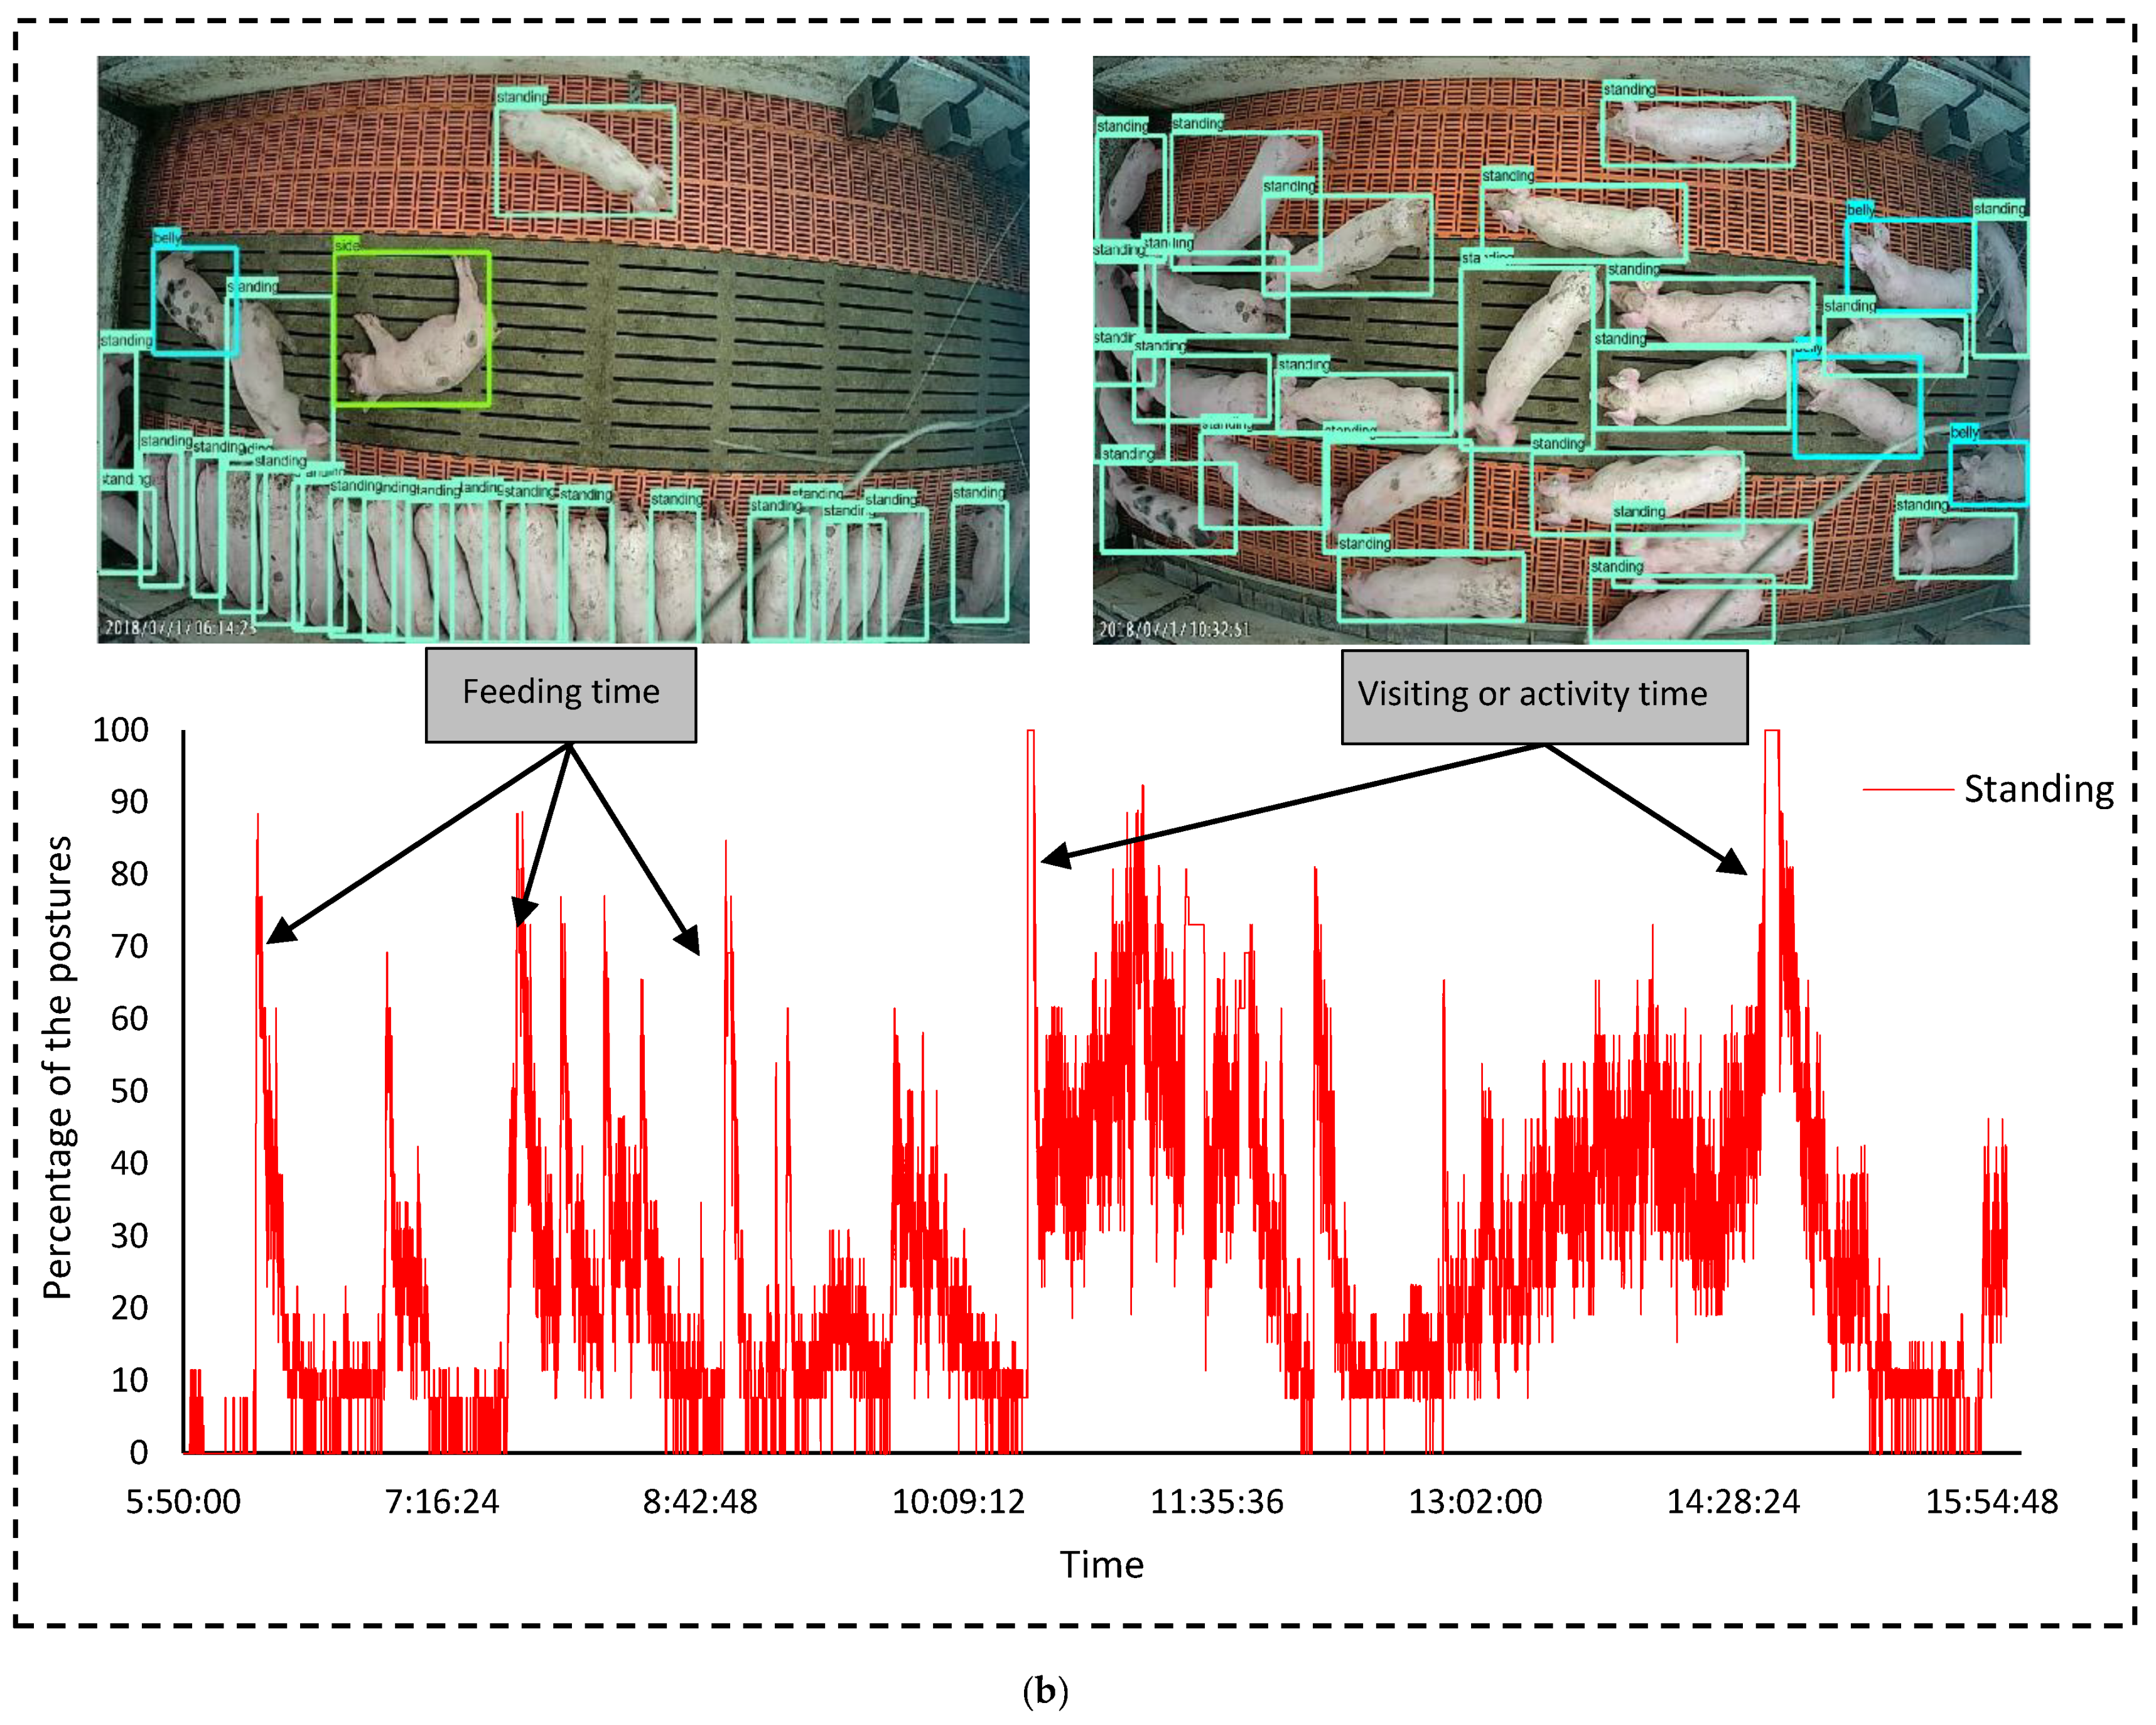
3. Experimental Results and Discussion
4. Conclusions
Author Contributions
Funding
Acknowledgments
Conflicts of Interest
References
- Nasirahmadi, A.; Edwards, S.A.; Sturm, B. Implementation of machine vision for detecting behaviour of cattle and pigs. Livestock Sci. 2017, 202, 25–38. [Google Scholar] [CrossRef] [Green Version]
- Frost, A.R.; Tillett, R.D.; Welch, S.K. The development and evaluation of image analysis procedures for guiding a livestock monitoring sensor placement robot. Comput. Electron. Agric. 2000, 28, 229–242. [Google Scholar] [CrossRef]
- Matthews, S.G.; Miller, A.L.; Clapp, J.; Plötz, T.; Kyriazakis, I. Early detection of health and welfare compromises through automated detection of behavioural changes in pigs. Vet. J. 2016, 217, 43–51. [Google Scholar] [CrossRef] [PubMed] [Green Version]
- Olsen, A.W.; Dybkjær, L.; Simonsen, H.B. Behaviour of growing pigs kept in pens with outdoor runs: II. Temperature regulatory behaviour, comfort behaviour and dunging preferences. Livestock Prod. Sci. 2001, 69, 265–278. [Google Scholar]
- Kim, J.; Chung, Y.; Choi, Y.; Sa, J.; Kim, H.; Chung, Y.; Park, D.; Kim, H. Depth-Based Detection of Standing-Pigs in Moving Noise Environments. Sensors 2017, 17, 2757. [Google Scholar] [CrossRef] [PubMed]
- Lao, F.; Brown-Brandl, T.; Stinn, J.P.; Liu, K.; Teng, G.; Xin, H. Automatic recognition of lactating sow behaviors through depth image processing. Comput. Electron. Agric. 2016, 125, 56–62. [Google Scholar] [CrossRef] [Green Version]
- Lee, J.; Jin, L.; Park, D.; Chung, Y. Automatic recognition of aggressive behavior in pigs using a kinect depth sensor. Sensors 2016, 16, 631. [Google Scholar] [CrossRef]
- Ott, S.; Moons, C.P.H.; Kashiha, M.A.; Bahr, C.; Tuyttens, F.A.M.; Berckmans, D.; Niewold, T.A. Automated video analysis of pig activity at pen level highly correlates to human observations of behavioural activities. Livestock Sci. 2014, 160, 132–137. [Google Scholar] [CrossRef]
- Kashiha, M.A.; Bahr, C.; Ott, S.; Moons, C.P.; Niewold, T.A.; Tuyttens, F.; Berckmans, D. Automatic monitoring of pig locomotion using image analysis. Livestock Sci. 2014, 159, 141–148. [Google Scholar] [CrossRef]
- Nasirahmadi, A.; Richter, U.; Hensel, O.; Edwards, S.; Sturm, B. Using machine vision for investigation of changes in pig group lying patterns. Comput. Electron. Agric. 2015, 119, 184–190. [Google Scholar] [CrossRef] [Green Version]
- Rieke, N.; Tombari, F.; Navab, N. Computer Vision and Machine Learning for Surgical Instrument Tracking: Focus: Random Forest-Based Microsurgical Tool Tracking. Comput. Vis. Assist. Healthc. 2018, 105–126. [Google Scholar] [CrossRef]
- Nasirahmadi, A.; Sturm, B.; Olsson, A.C.; Jeppsson, K.H.; Müller, S.; Edwards, S.; Hensel, O. Automatic scoring of lateral and sternal lying posture in grouped pigs using image processing and Support Vector Machine. Comput. Electron. Agric. 2019, 156, 475–481. [Google Scholar] [CrossRef]
- Cao, C.; Liu, F.; Tan, H.; Song, D.; Shu, W.; Li, W.; Zhou, Y.; Bo, X.; Xie, Z. Deep learning and its applications in biomedicine. Genet. Proteomics Bioinf. 2018, 16, 17–32. [Google Scholar] [CrossRef] [PubMed]
- Kamilaris, A.; Prenafeta-Boldú, F.X. Deep learning in agriculture: A survey. Comput. Electron. Agric. 2018, 147, 70–90. [Google Scholar] [CrossRef] [Green Version]
- Ju, M.; Choi, Y.; Seo, J.; Sa, J.; Lee, S.; Chung, Y.; Park, D. A Kinect-Based Segmentation of Touching-Pigs for Real-Time Monitoring. Sensors 2018, 18, 1746. [Google Scholar] [CrossRef]
- Zheng, C.; Zhu, X.; Yang, X.; Wang, L.; Tu, S.; Xue, Y. Automatic recognition of lactating sow postures from depth images by deep learning detector. Comput. Electron. Agric. 2018, 147, 51–63. [Google Scholar] [CrossRef]
- Yang, A.; Huang, H.; Zhu, X.; Yang, X.; Chen, P.; Li, S.; Xue, Y. Automatic recognition of sow nursing behaviour using deep learning-based segmentation and spatial and temporal features. Biosyst. Eng. 2018, 175, 133–145. [Google Scholar] [CrossRef]
- Yang, Q.; Xiao, D.; Lin, S. Feeding behavior recognition for group-housed pigs with the Faster R-CNN. Comput. Electron. Agric. 2018, 155, 453–460. [Google Scholar] [CrossRef]
- Yang, A.; Huang, H.; Zheng, C.; Zhu, X.; Yang, X.; Chen, P.; Xue, Y. High-accuracy image segmentation for lactating sows using a fully convolutional network. Biosyst. Eng. 2018, 176, 36–47. [Google Scholar] [CrossRef]
- Abadi, M.; Agarwal, A.; Barham, P.; Brevdo, E.; Chen, Z.; Citro, C.; Corrado, G.S.; Davis, A.; Dean, J.; Devin, M.; et al. TensorFlow: Large-scale machine learning on heterogeneous systems. arXiv 2016, arXiv:1603.04467. [Google Scholar]
- Tzutalin, LabelImg. Git Code. Available online: https://github.com/tzutalin/labelImg, 2015 (accessed on 1 February 2018).
- He, K.; Zhang, X.; Ren, S.; Sun, J. Deep residual learning for image recognition. In Proceedings of the IEEE Conference, Las Vegas, NV, USA, 26 June–1 July 2016. [Google Scholar]
- da Silva, L.A.; Bressan, P.O.; Gonçalves, D.N.; Freitas, D.M.; Machado, B.B.; Gonçalves, W.N. Estimating soybean leaf defoliation using convolutional neural networks and synthetic images. Comput. Electron. Agric. 2019, 156, 360–368. [Google Scholar] [CrossRef]
- Szegedy, C.; Liu, W.; Jia, Y.; Sermanet, P.; Reed, S.; Anguelov, D.; Erhan, D.; Vanhoucke, V.; Rabinovich, A. Going deeper with convolutions. In Proceedings of the IEEE Conference on Computer Vision and Pattern Recognition, Boston, MA, USA, 7–12 June 2015. [Google Scholar]
- Arcos-García, Á.; Álvarez-García, J.A.; Soria-Morillo, L.M. Evaluation of Deep Neural Networks for traffic sign detection systems. Neurocomputing 2018, 316, 332–344. [Google Scholar] [CrossRef]
- Szegedy, C.; Ioffe, S.; Vanhoucke, V.; Alemi, A.A. Inception-v4, inception-resnet and the impact of residual connections on learning. In Proceedings of the Thirty-First AAAI Conference on Artificial Intelligence, San Francisco, CA, USA, 4–10 February 2017. [Google Scholar]
- Ren, S.; He, K.; Girshick, R.; Sun, J. Faster R-CNN: towards real-time object detection with region proposal networks. Adv. in Neural inf. Process. Syst. 2015, 39, 1137–1149. [Google Scholar] [CrossRef] [PubMed]
- Dai, J.; Li, Y.; He, K.; Sun, J. R-FCN: Object Detection via Region-based Fully Convolutional Networks. In Proceedings of the Neural Information Processing Systems (NIPS 2016), Barcelona, Spain, 5 December–10 December 2016. [Google Scholar]
- Fuentes, A.; Yoon, S.; Kim, S.; Park, D. A robust deep-learning-based detector for real-time tomato plant diseases and pests recognition. Sensors 2017, 17, 2022. [Google Scholar] [CrossRef] [PubMed]
- Liu, W.; Anguelov, D.; Erhan, D.; Szegedy, C.; Reed, S.; Fu, C.Y.; Berg, A.C. Ssd: Single shot multibox detector. In Proceedings of the European Conference on Computer Vision, Amsterdam, The Netherlands, 8–16 October 2016. [Google Scholar]
- Wei, X.; Yang, Z.; Liu, Y.; Wei, D.; Jia, L.; Li, Y. Railway track fastener defect detection based on image processing and deep learning techniques: A comparative study. Eng. Appl. Artif. Intel. 2019, 80, 66–81. [Google Scholar] [CrossRef]
- Zou, Z.; Zhao, X.; Zhao, P.; Qi, F.; Wang, N. CNN-based statistics and location estimation of missing components in routine inspection of historic buildings. J. Cult. Herit. 2019, 38, 221–230. [Google Scholar] [CrossRef]
- Tang, T.A.; Mhamdi, L.; McLernon, D.; Zaidi, S.A.R.; Ghogho, M. Deep learning approach for network intrusion detection in software defined networking. In Proceedings of the International Conference on Wireless Networks and Mobile Communications (WINCOM), Fez, Morocco, 26–29 October 2016. [Google Scholar]
- Andersen, R.S.; Peimankar, A.; Puthusserypady, S. A deep learning approach for real-time detection of atrial fibrillation. Expert Syst. Appl. 2019, 115, 465–473. [Google Scholar] [CrossRef]
- Shen, Z.Y.; Han, S.Y.; Fu, L.C.; Hsiao, P.Y.; Lau, Y.C.; Chang, S.J. Deep convolution neural network with scene-centric and object-centric information for object detection. Image Vis. Comput. 2019, 85, 14–25. [Google Scholar] [CrossRef]
- Nalon, E.; Conte, S.; Maes, D.; Tuyttens, F.A.M.; Devillers, N. Assessment of lameness and claw lesions in sows. Livestock Sci. 2013, 156, 10–23. [Google Scholar] [CrossRef]

| Posture Classes | Training Process | Testing Process | ||
|---|---|---|---|---|
| Number of Individual Postures | ||||
| Training | Validation | Total | Test | |
| Standing | 11,632 | 4372 | 16,004 | 1839 |
| Lying on side | 11,435 | 4085 | 15,520 | 1489 |
| Lying on belly | 15,781 | 5480 | 21,261 | 1659 |
| Total samples | 38,848 | 13,937 | 52,785 | 4987 |
| AP | ||||||
|---|---|---|---|---|---|---|
| Classes | Learning Rate | Feature Extractor | Standing | Lying on Side | Lying on Belly | mAP |
| Faster R-CNN | 0.03 | Inception V2 | 0.82 | 0.87 | 0.88 | 0.86 |
| Faster R-CNN | 0.03 | ResNet50 | 0.80 | 0.85 | 0.83 | 0.83 |
| Faster R-CNN | 0.03 | ResNet101 | 0.87 | 0.86 | 0.81 | 0.85 |
| Faster R-CNN | 0.03 | Inception-ResNet V2 | 0.79 | 0.83 | 0.77 | 0.80 |
| R-FCN | 0.03 | ResNet101 | 0.88 | 0.88 | 0.87 | 0.88 |
| SSD | 0.03 | Inception V2 | 0.69 | 0.70 | 0.68 | 0.69 |
| Faster R-CNN | 0.003 | Inception V2 | 0.90 | 0.93 | 0.91 | 0.91 |
| Faster R-CNN | 0.003 | ResNet50 | 0.85 | 0.92 | 0.89 | 0.88 |
| Faster R-CNN | 0.003 | ResNet101 | 0.93 | 0.92 | 0.89 | 0.91 |
| Faster R-CNN | 0.003 | Inception-ResNet V2 | 0.86 | 0.89 | 0.84 | 0.86 |
| R-FCN | 0.003 | ResNet101 | 0.93 | 0.95 | 0.92 | 0.93 |
| SSD | 0.003 | Inception V2 | 0.76 | 0.79 | 0.74 | 0.76 |
| Faster R-CNN | 0.0003 | Inception V2 | 0.85 | 0.90 | 0.89 | 0.87 |
| Faster R-CNN | 0.0003 | ResNet50 | 0.85 | 0.86 | 0.87 | 0.86 |
| Faster R-CNN | 0.0003 | ResNet101 | 0.87 | 0.89 | 0.87 | 0.88 |
| Faster R-CNN | 0.0003 | Inception-ResNet V2 | 0.80 | 0.85 | 0.79 | 0.81 |
| R-FCN | 0.0003 | ResNet101 | 0.90 | 0.90 | 0.88 | 0.89 |
| SSD | 0.0003 | Inception V2 | 0.75 | 0.80 | 0.72 | 0.76 |
| Predicted Class | ||||
|---|---|---|---|---|
| Actual class | Standing | Lying on side | Lying on belly | |
| Standing | 1672 | 25 | 89 | |
| Lying on side | 18 | 1382 | 31 | |
| Lying on belly | 71 | 16 | 1523 | |
© 2019 by the authors. Licensee MDPI, Basel, Switzerland. This article is an open access article distributed under the terms and conditions of the Creative Commons Attribution (CC BY) license (http://creativecommons.org/licenses/by/4.0/).
Share and Cite
Nasirahmadi, A.; Sturm, B.; Edwards, S.; Jeppsson, K.-H.; Olsson, A.-C.; Müller, S.; Hensel, O. Deep Learning and Machine Vision Approaches for Posture Detection of Individual Pigs. Sensors 2019, 19, 3738. https://doi.org/10.3390/s19173738
Nasirahmadi A, Sturm B, Edwards S, Jeppsson K-H, Olsson A-C, Müller S, Hensel O. Deep Learning and Machine Vision Approaches for Posture Detection of Individual Pigs. Sensors. 2019; 19(17):3738. https://doi.org/10.3390/s19173738
Chicago/Turabian StyleNasirahmadi, Abozar, Barbara Sturm, Sandra Edwards, Knut-Håkan Jeppsson, Anne-Charlotte Olsson, Simone Müller, and Oliver Hensel. 2019. "Deep Learning and Machine Vision Approaches for Posture Detection of Individual Pigs" Sensors 19, no. 17: 3738. https://doi.org/10.3390/s19173738