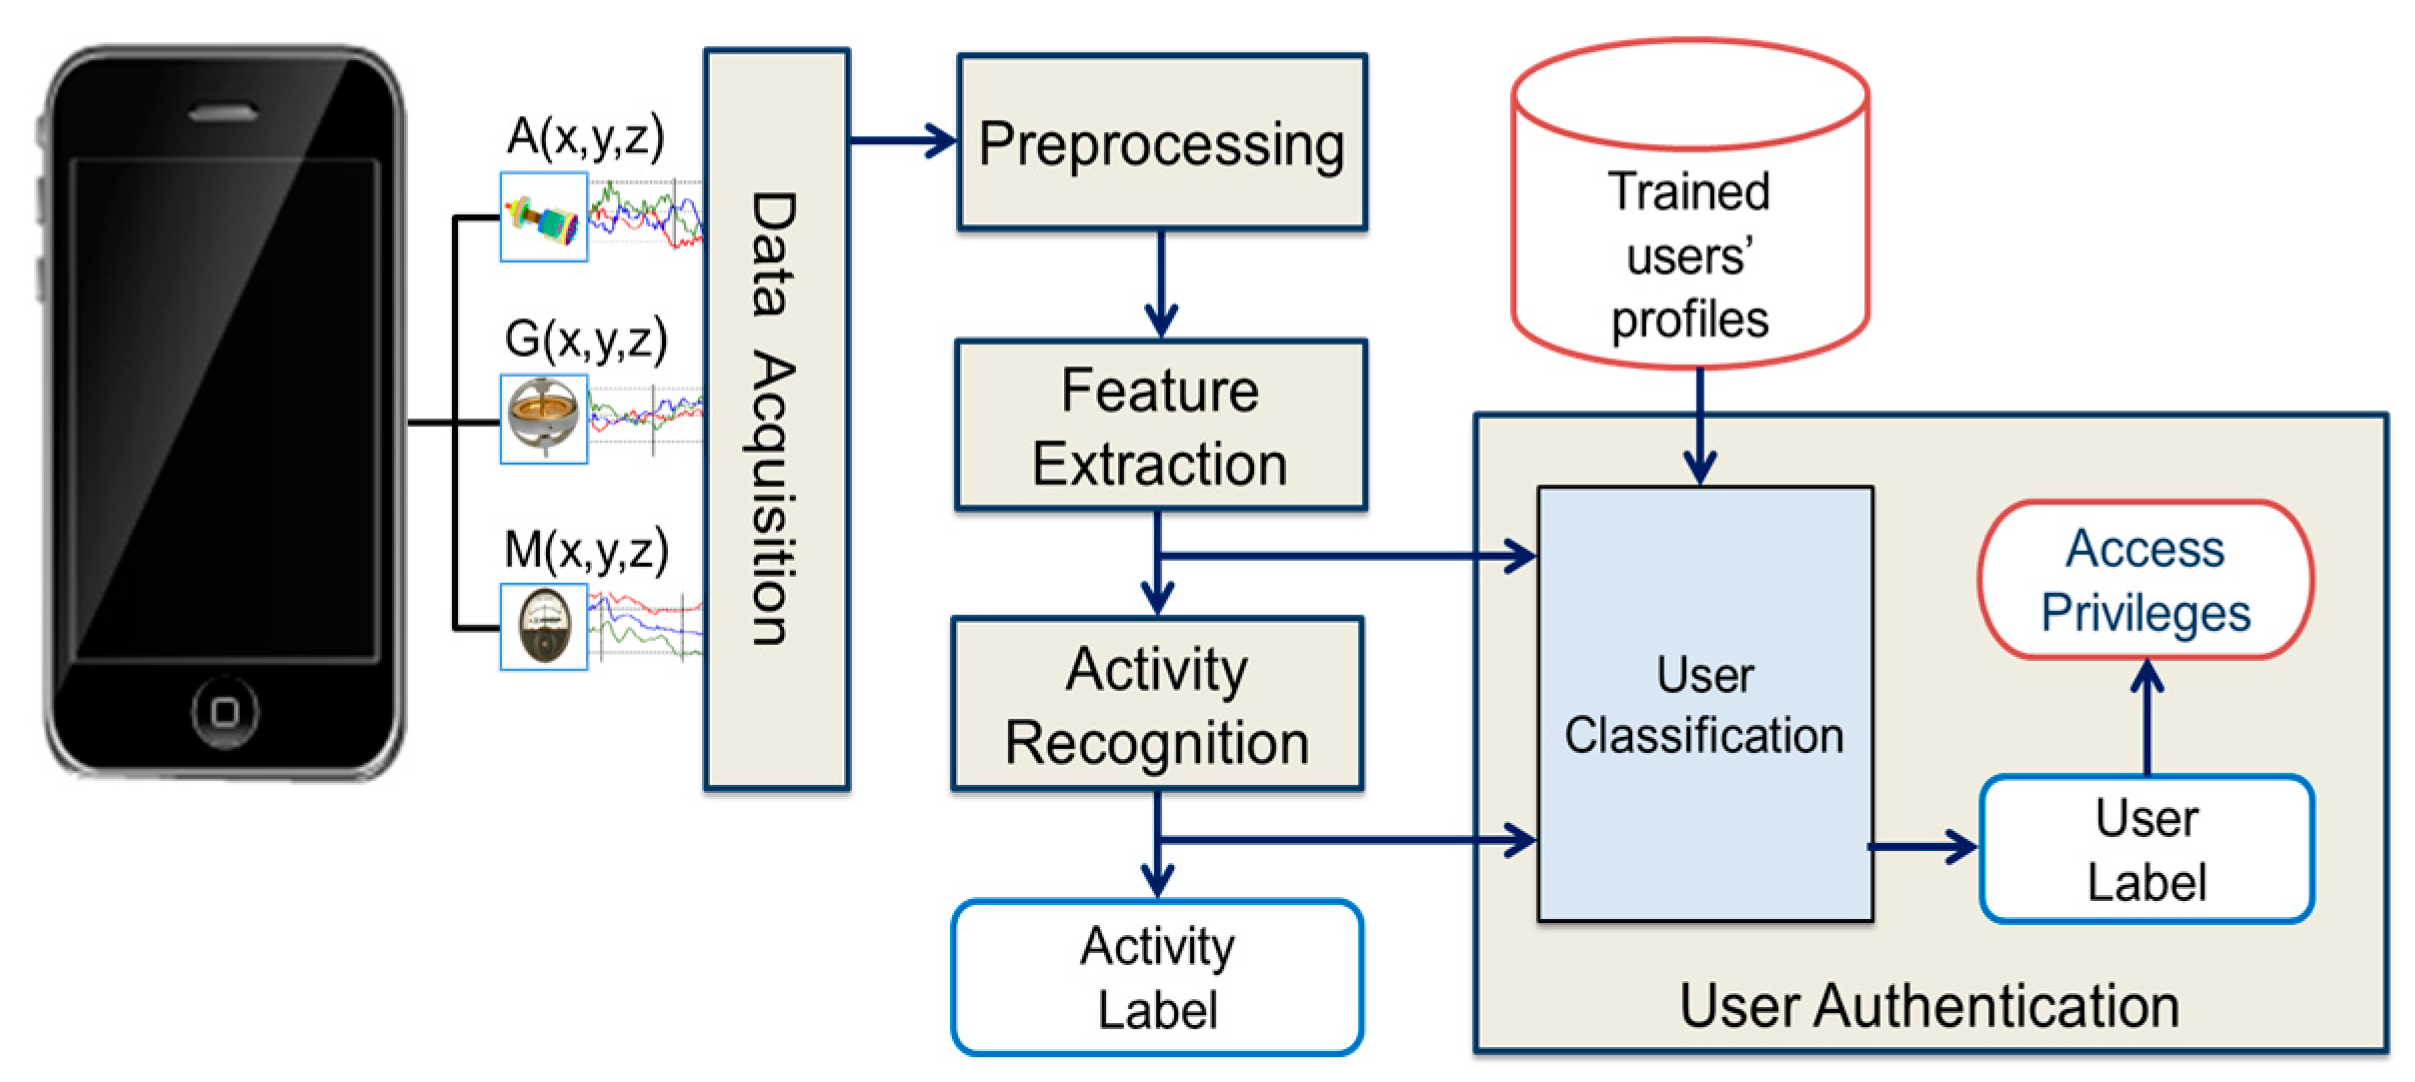
For the purpose of smartphone user authentication, the proposed framework utilized activity recognition and user classification. The user classification was performed by means of activity recognition. To evaluate the performance of the proposed scheme, the experimental results are presented in two different sections separately for activity recognition and user classification. Following sections discuss these results.
5.1. Performance Analysis of Activity Recognition
In order to evaluate the performance of activity recognition for this study, four different classification algorithms including Decision Tree (DT), Bayes Net (BN), K-Nearest Neighbor (K-NN), and Support Vector Machine (SVM) were trained and evaluated on the selected dataset. These classifiers were selected because they have been used in the state of the art for activity recognition [
20,
21,
25,
59]. To ensure fairness in activity recognition results, a 10-fold stratified cross validation scheme was used for evaluating the performance of these classifiers. Hence, all activity traces in the dataset were split randomly into 10 sets, and iterated 10 times in such a way that every set of data was selected to use for testing and remaining sets were employed for training of the classifiers. Only the average results of all 10 repetitions are included in this section. The performance metrics used in this study for evaluating the classifiers performance for activity recognition are computational time taken, average accuracy rate, f-measure, kappa statistic, Root Mean Squared Error (RMSE) and Mean Absolute Error (MAE). The kappa statistic is a measure that is independent of the total number of classes and the number of samples per class. A kappa statistic value of
k = 0 represents a chance level classification performance, whereas in case of perfect classification,
k reaches its best value of 1. If
k < 0, it means that the performance of classification is poorer than the chance level classification performance. These performance metrics are evaluated for all four classifiers selected for activity recognition, and the results of activity classification are computed separately for all five body positions selected in this study.
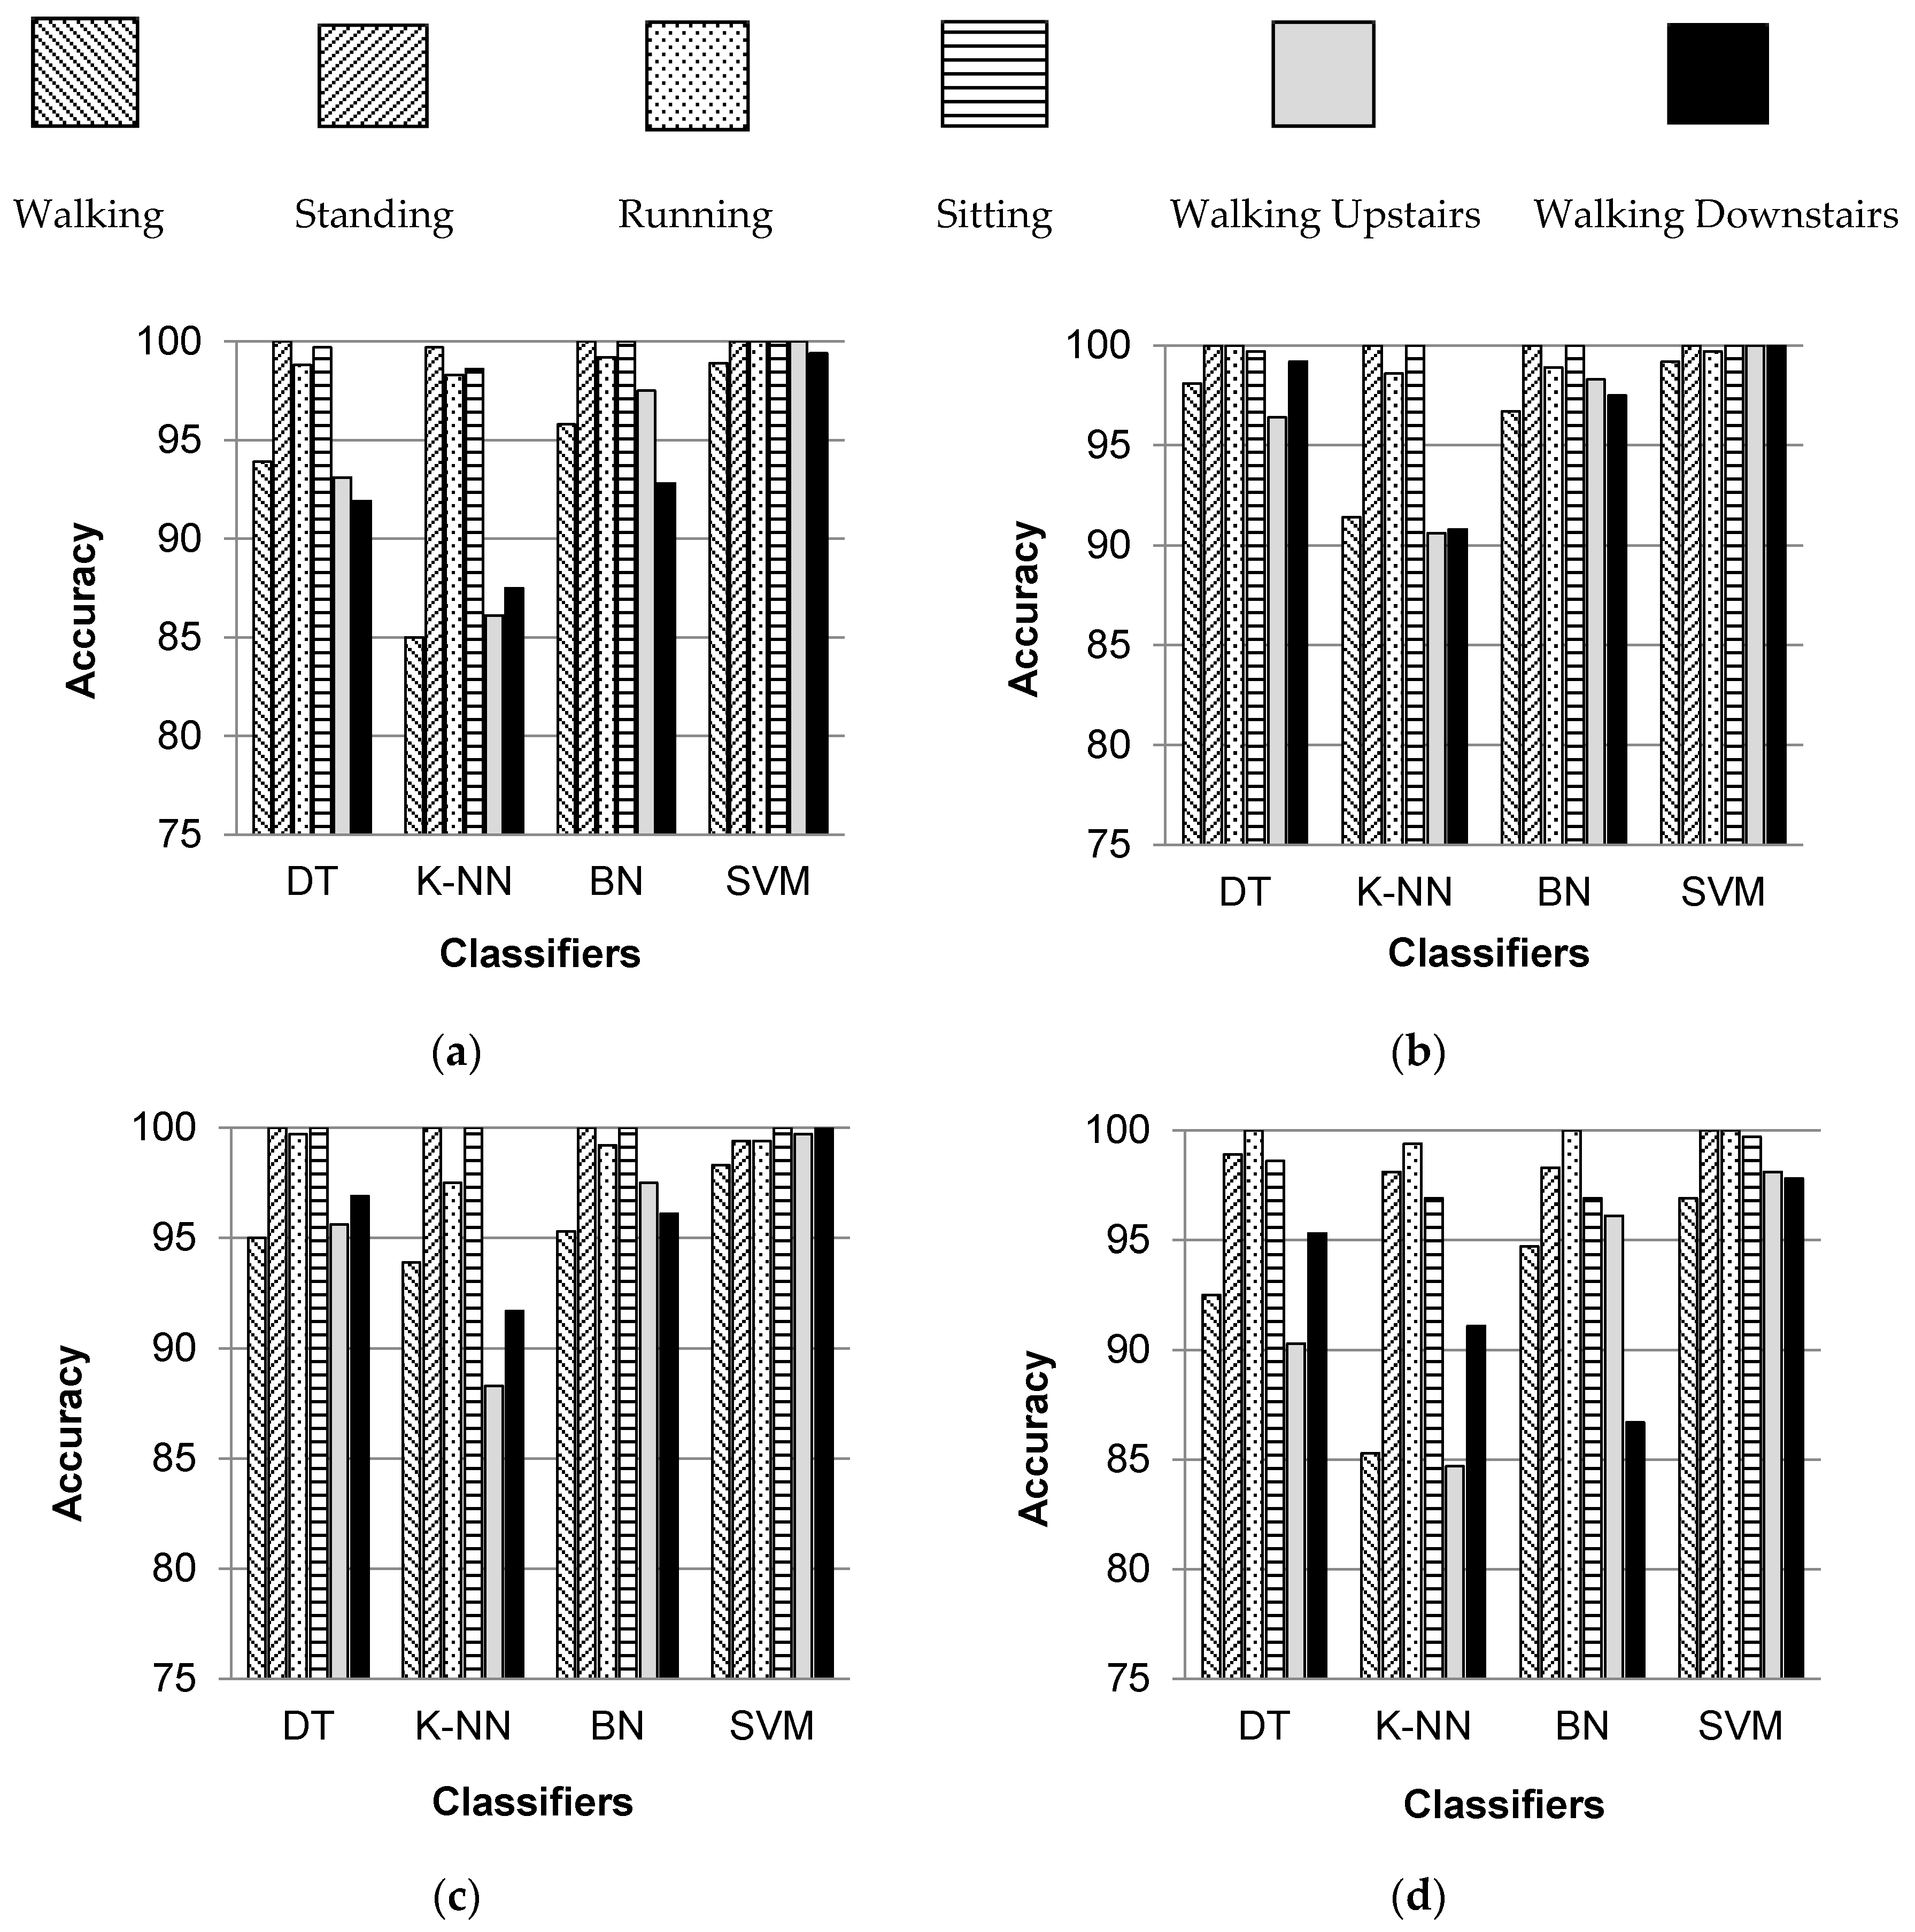
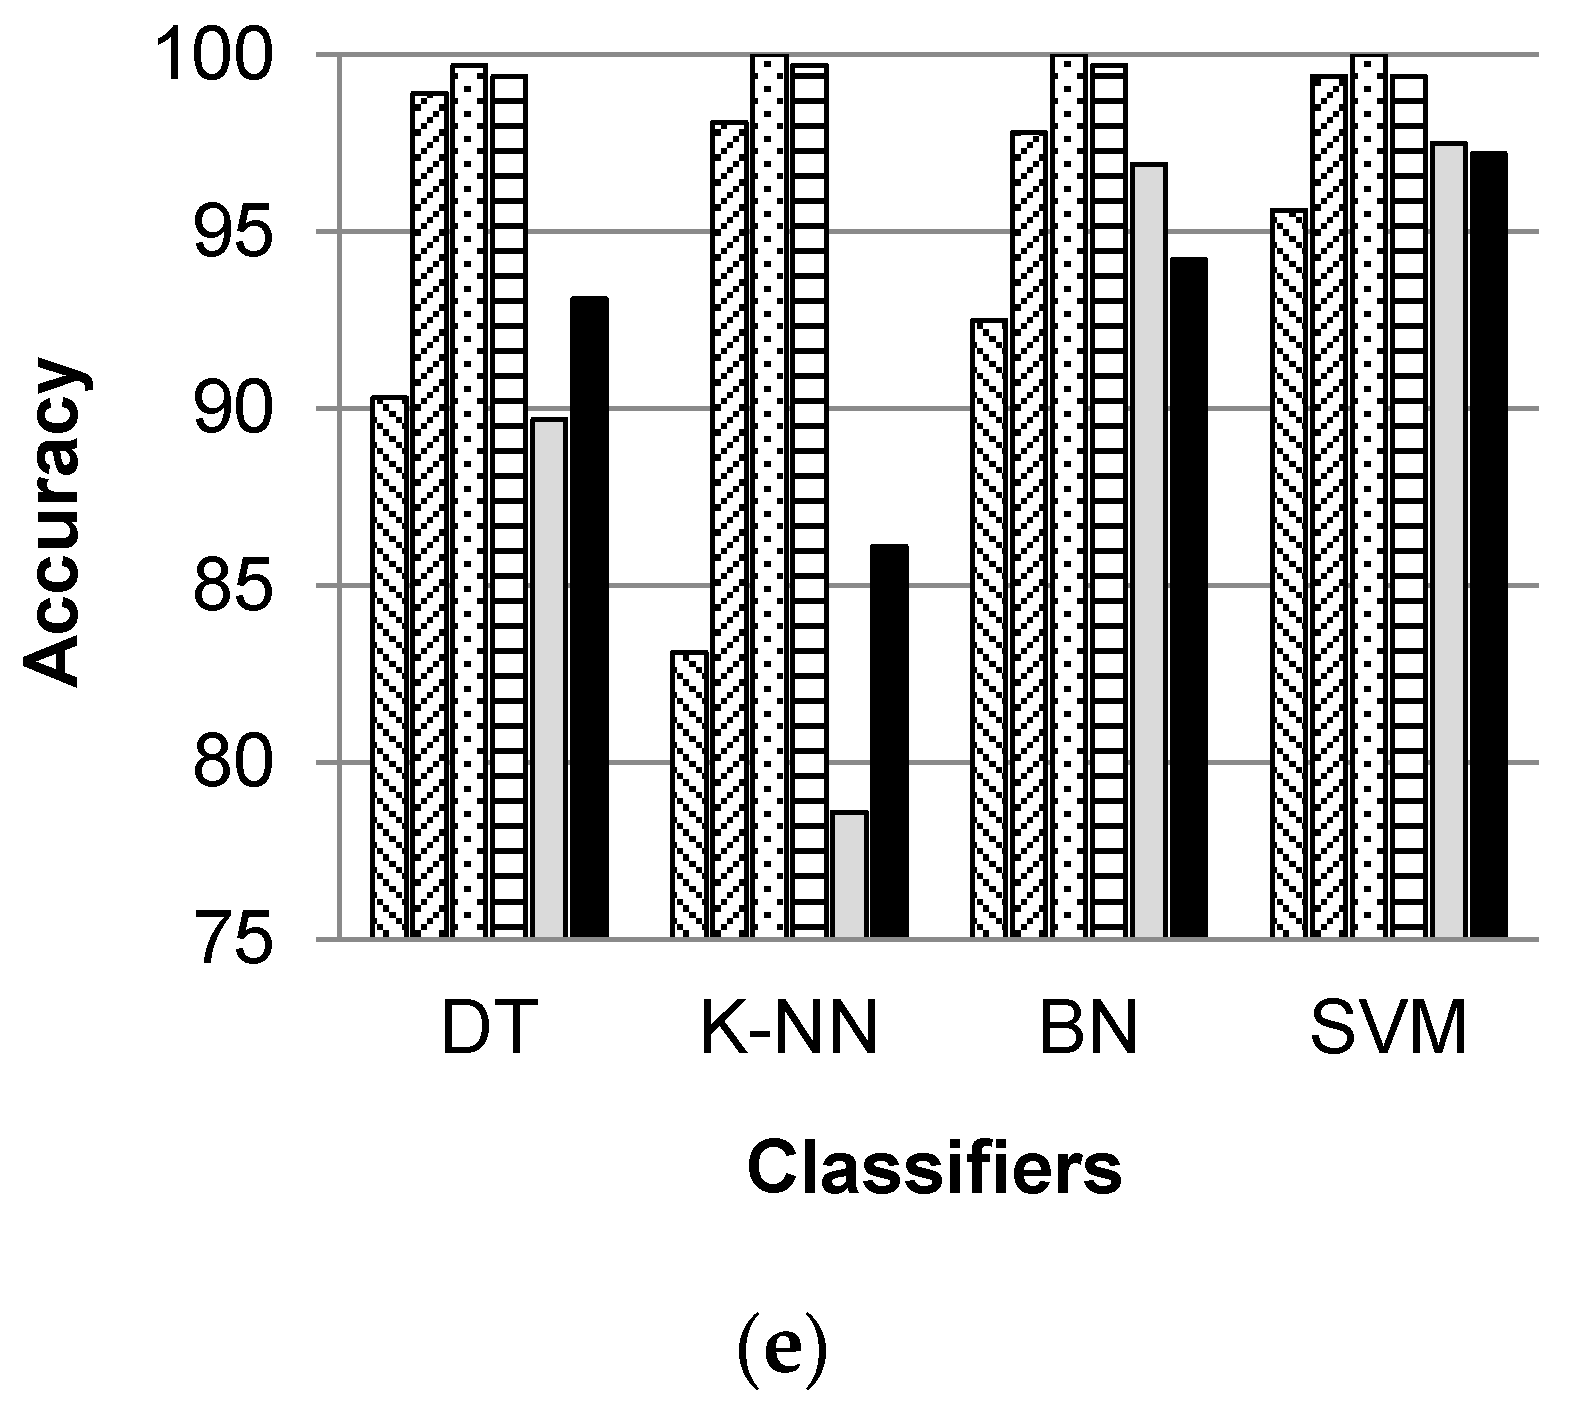
Figure 5 shows the individual percentage accuracies of classification for all selected activities over five body positions when classified with DT, K-NN, BN and SVM classifiers. It can be observed that the individual classification accuracies of standing, running, and sitting activities are higher irrespective of the classifier and the body position. Thus, it can be said that these activities are more easily recognizable than other selected activities. The activities of sitting and standing are distinguished from each other on the basis of the fact that the orientation of the smartphone placed on a human body changes when a user changes his/her posture or stance for sitting and standing. Thus, the readings of smartphone inertial sensors are different. The classification of walking, walking upstairs, and walking downstairs activities is position dependent, and gives better results if the smartphone is placed in the left or right jeans pocket. All six activities are recognized with higher individual accuracies when classified with SVM and BN classifiers.
Table 5 shows the performance parameters of the selected classifiers for activity recognition at five different body positions. It can easily be observed that SVM classifier provides the best average accuracy rate as compare to the accuracy rate values provided by DT, K-NN, and BN classifiers. On the other hand, the error rate for SVM classifier, evaluated by MAE and RMSE, is also very high for all body positions.
Table 6 shows the average values of individual performance metrics for all selected classifiers. It can be seen that the overall average values of accuracy rate, kappa statistic, and f-measure are higher and comparable for SVM, BN, and DT classifiers. However, K-NN provides lower accuracy rate along with lower kappa statistic and f-measure values. The average accuracy rate for SVM classifier is 99.18%, which is 2.36%, 1.8%, and 5.88% higher than the average accuracy rate of DT, BN, and K-NN classifier, respectively. The values of MAE and RMSE for SVM classifier are 0.22 and 0.312 respectively, which are higher as compare to the error rate values for DT and BN classifiers. The average accuracy rate of BN classifier is 0.56% and 4.08% higher than the average accuracy rate of DT and K-NN classifier, respectively. Also, the error rate of BN classifier is better than the error rates provided by DT, SVM, and K-NN classifiers.
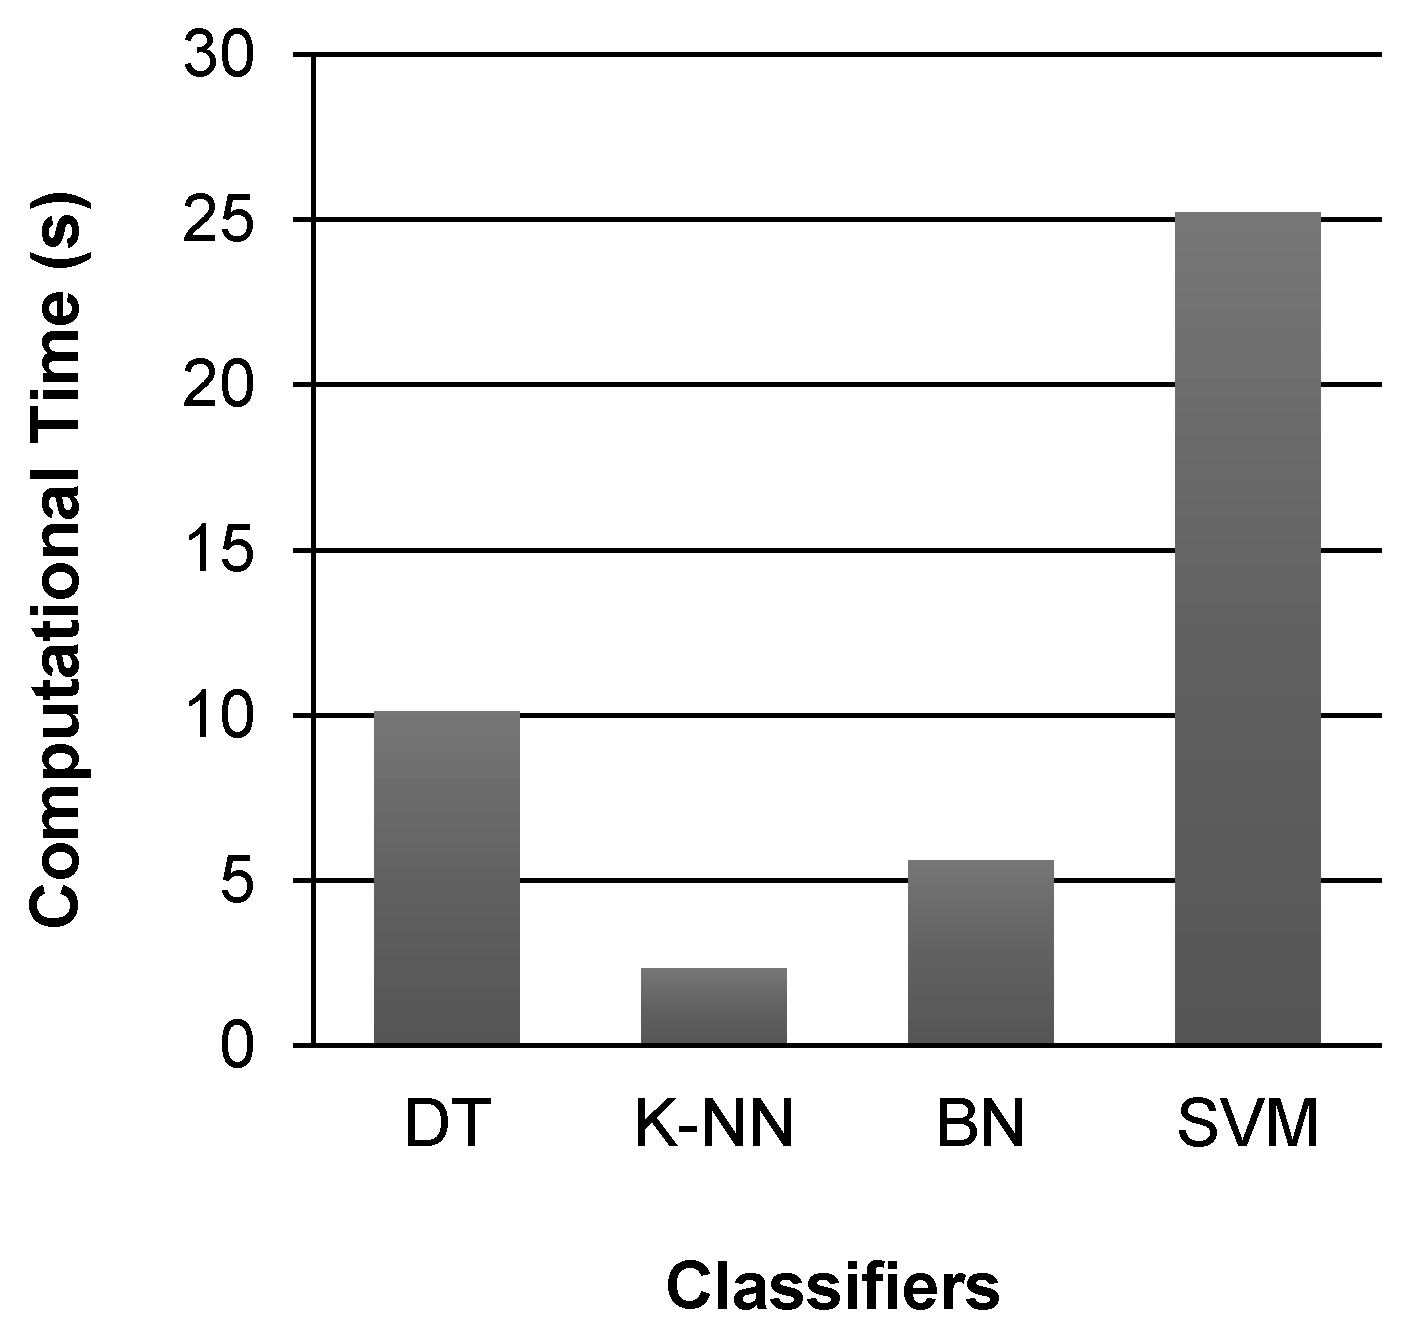
Another important performance metric for evaluating the performance of these classifiers is their computational complexity, which effects the time taken by each classifier for building training model and performing classification.
Figure 6 shows a comparison of the computational time taken by the selected classifiers for activity classification. It can be observed that K-NN classifier takes less time as compare to all other classifiers. The time taken by SVM classifier for activity classification is 25.21 s, which is 10.8 times more than the time (2.32 s) taken by K-NN classifier, and 4.5 times more than the time (5.61 s) taken by BN classifier to perform classification. The time taken by DT classifier for activity classification is 10.11 s.
On the basis of the results discussed above, it can be said that the overall performance of Bayes Net classifier in classifying the selected activities is better than other classifiers performance. Although, SVM provides the best accuracy rate for activity classification, but its error magnitude is also quite higher. On the other hand, the BN classifier provides an accuracy rate that is comparable to the accuracy rate of SVM classifier, but its error rate is very small. Also, the SVM classifier is computationally expensive, and it takes significantly more time for building a training model and performing classification. As a smartphone is equipped with limited processing power, memory, and storage, therefore, it is not feasible to use SVM classifier for on-device activity classification in real-time. Otherwise, the battery power will be drained quickly, and the output will be delayed because of the extensive computational time taken by SVM classifier for classification. Bayes Net classifier is based on a probabilistic model that is computationally very simple [
39]. Hence, it takes less time in building and updating the training model, and performing on-device activity classification in real time. This suggests the Bayes Net classifier as an optimal choice for online activity recognition using smartphone sensors.
5.2. Performance Analysis of User Classification
The user authentication was done by means of user classification based on activity recognition. For user classification, three user classes were considered, including authenticated, supplementary, and impostor class. The dataset used for the activity recognition was pre-labeled for all activities performed by 10 participants/users. However, there were no user class labels for the participants in the dataset. Our idea was to utilize the dataset for learning the activity patterns of different users or a set of users. For this reason, the users in the dataset were randomly divided into three folds, i.e., Fold-1, Fold-2, and Fold-3. Fold-1 and Fold-2 represented the sets of users belonging to the authenticated and supplementary classes, respectively, whereas Fold-3 contained the set of users belonging to the impostor class. Five different scenarios were taken for the distribution of 10 users among these folds, as shown in
Table 7. For each scenario, all possible permutations of the users were applied on three folds iteratively in such a way that every user became a part of each fold at least once.
For validating the user classification results, a 70%-30% split was used for training and testing data, respectively. For this purpose, each fold of data representing a specific user class was randomly partitioned into two independent sets, i.e., training and testing sets, where 70% of the data were selected for training the user classification model, and the remaining 30% were used for testing. The authors in [
66] performed a broad simulation study for the purpose of evaluating commonly used splitting strategies for testing and training data, which concluded that allocating two-thirds (nearly 67%) of the data for training provides better classification accuracy. Moreover, the existing studies [
60,
67] also utilized a 70%/30% split for training and testing data, respectively, which provided efficient results for physical activity recognition. For every user class, the authentication model was trained to recognize six selected activities performed by the user while carrying the smartphone at five different body positions. The research work in [
20,
21,
58,
59] showed that a time interval of 4–5
s is sufficient for the recognition of a physical activity, considering a sampling rate of 50 Hz. For this purpose, the user authentication model was trained to identify a user with the activity duration of 5
s. During testing of user classification, the selected features were extracted from testing data over a data segment of 5
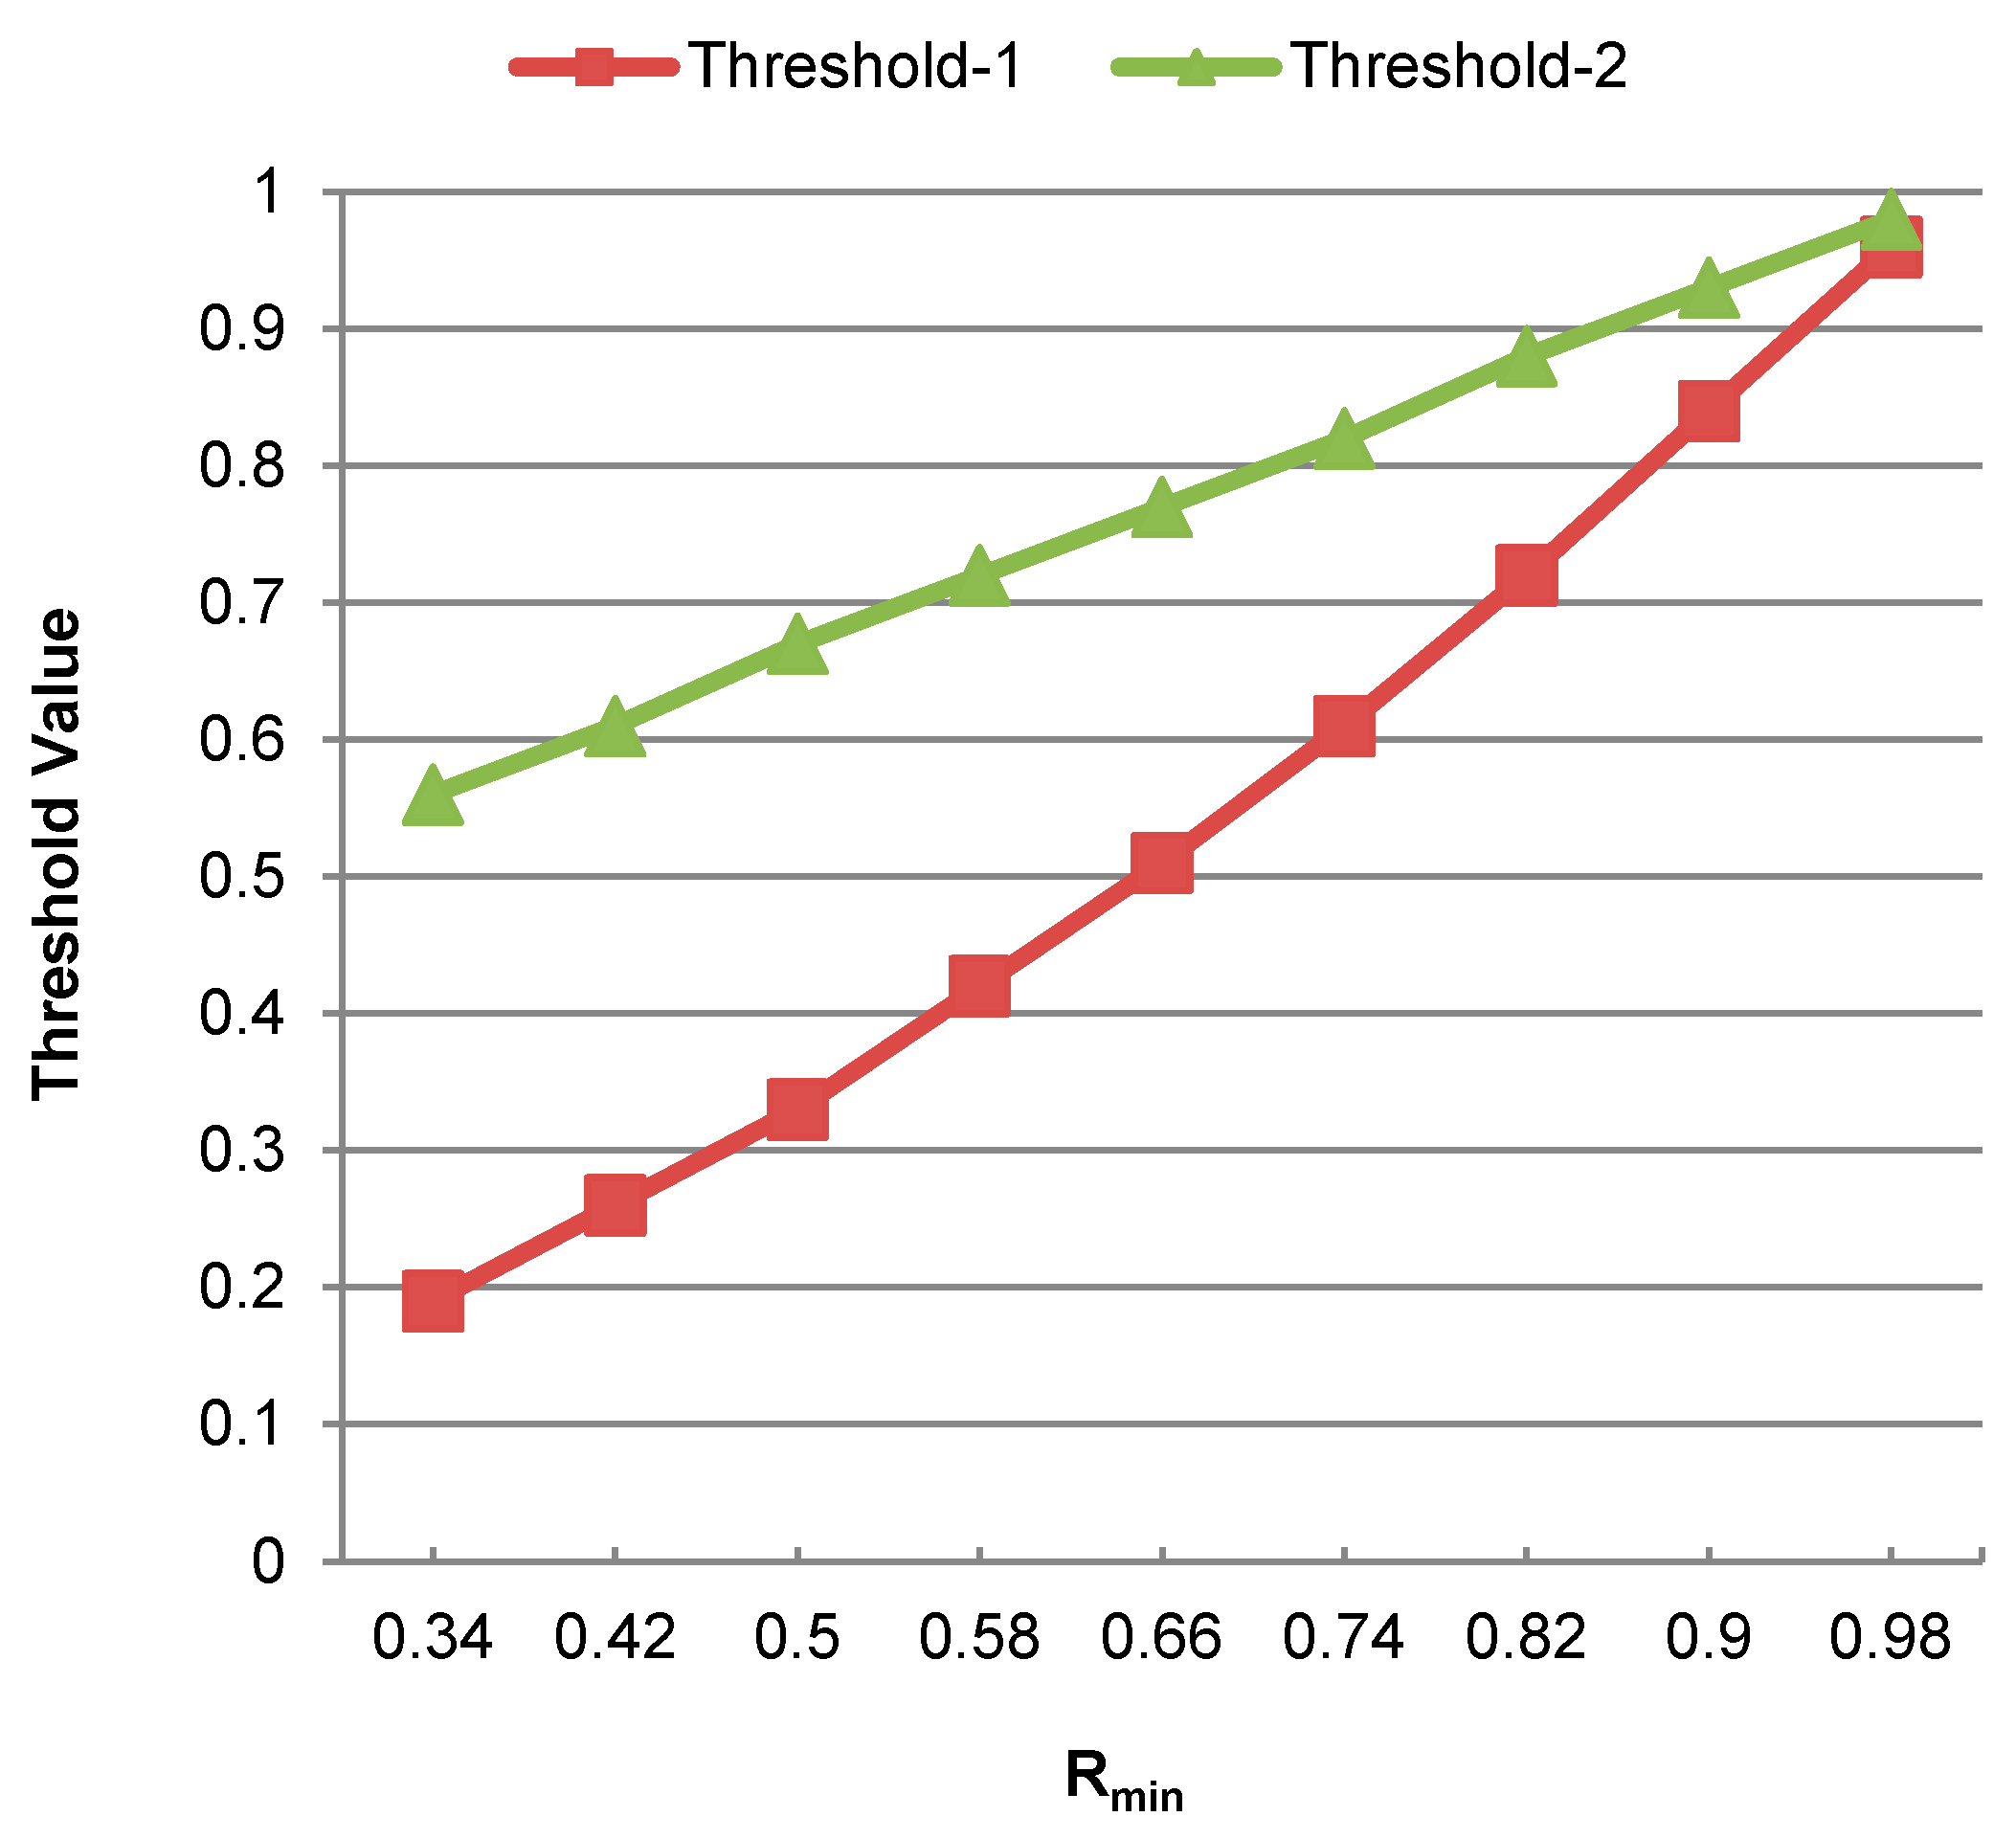
s in time, having 250 samples at a rate 50 Hz. The activity performed by the user was recognized based on these extracted features. After that, the recognized activity and the extracted features were passed to the user authentication model. The probabilistic scoring model was applied on the extracted features to calculate classification score on the basis of Euclidean distance between different feature vectors, using Equation (14). A median value of 0.67 was taken for
initially and the threshold values
and
were calculated using Equations (18) and (19). The user was classified as authenticated, supplementary, or impostor based on these threshold values.
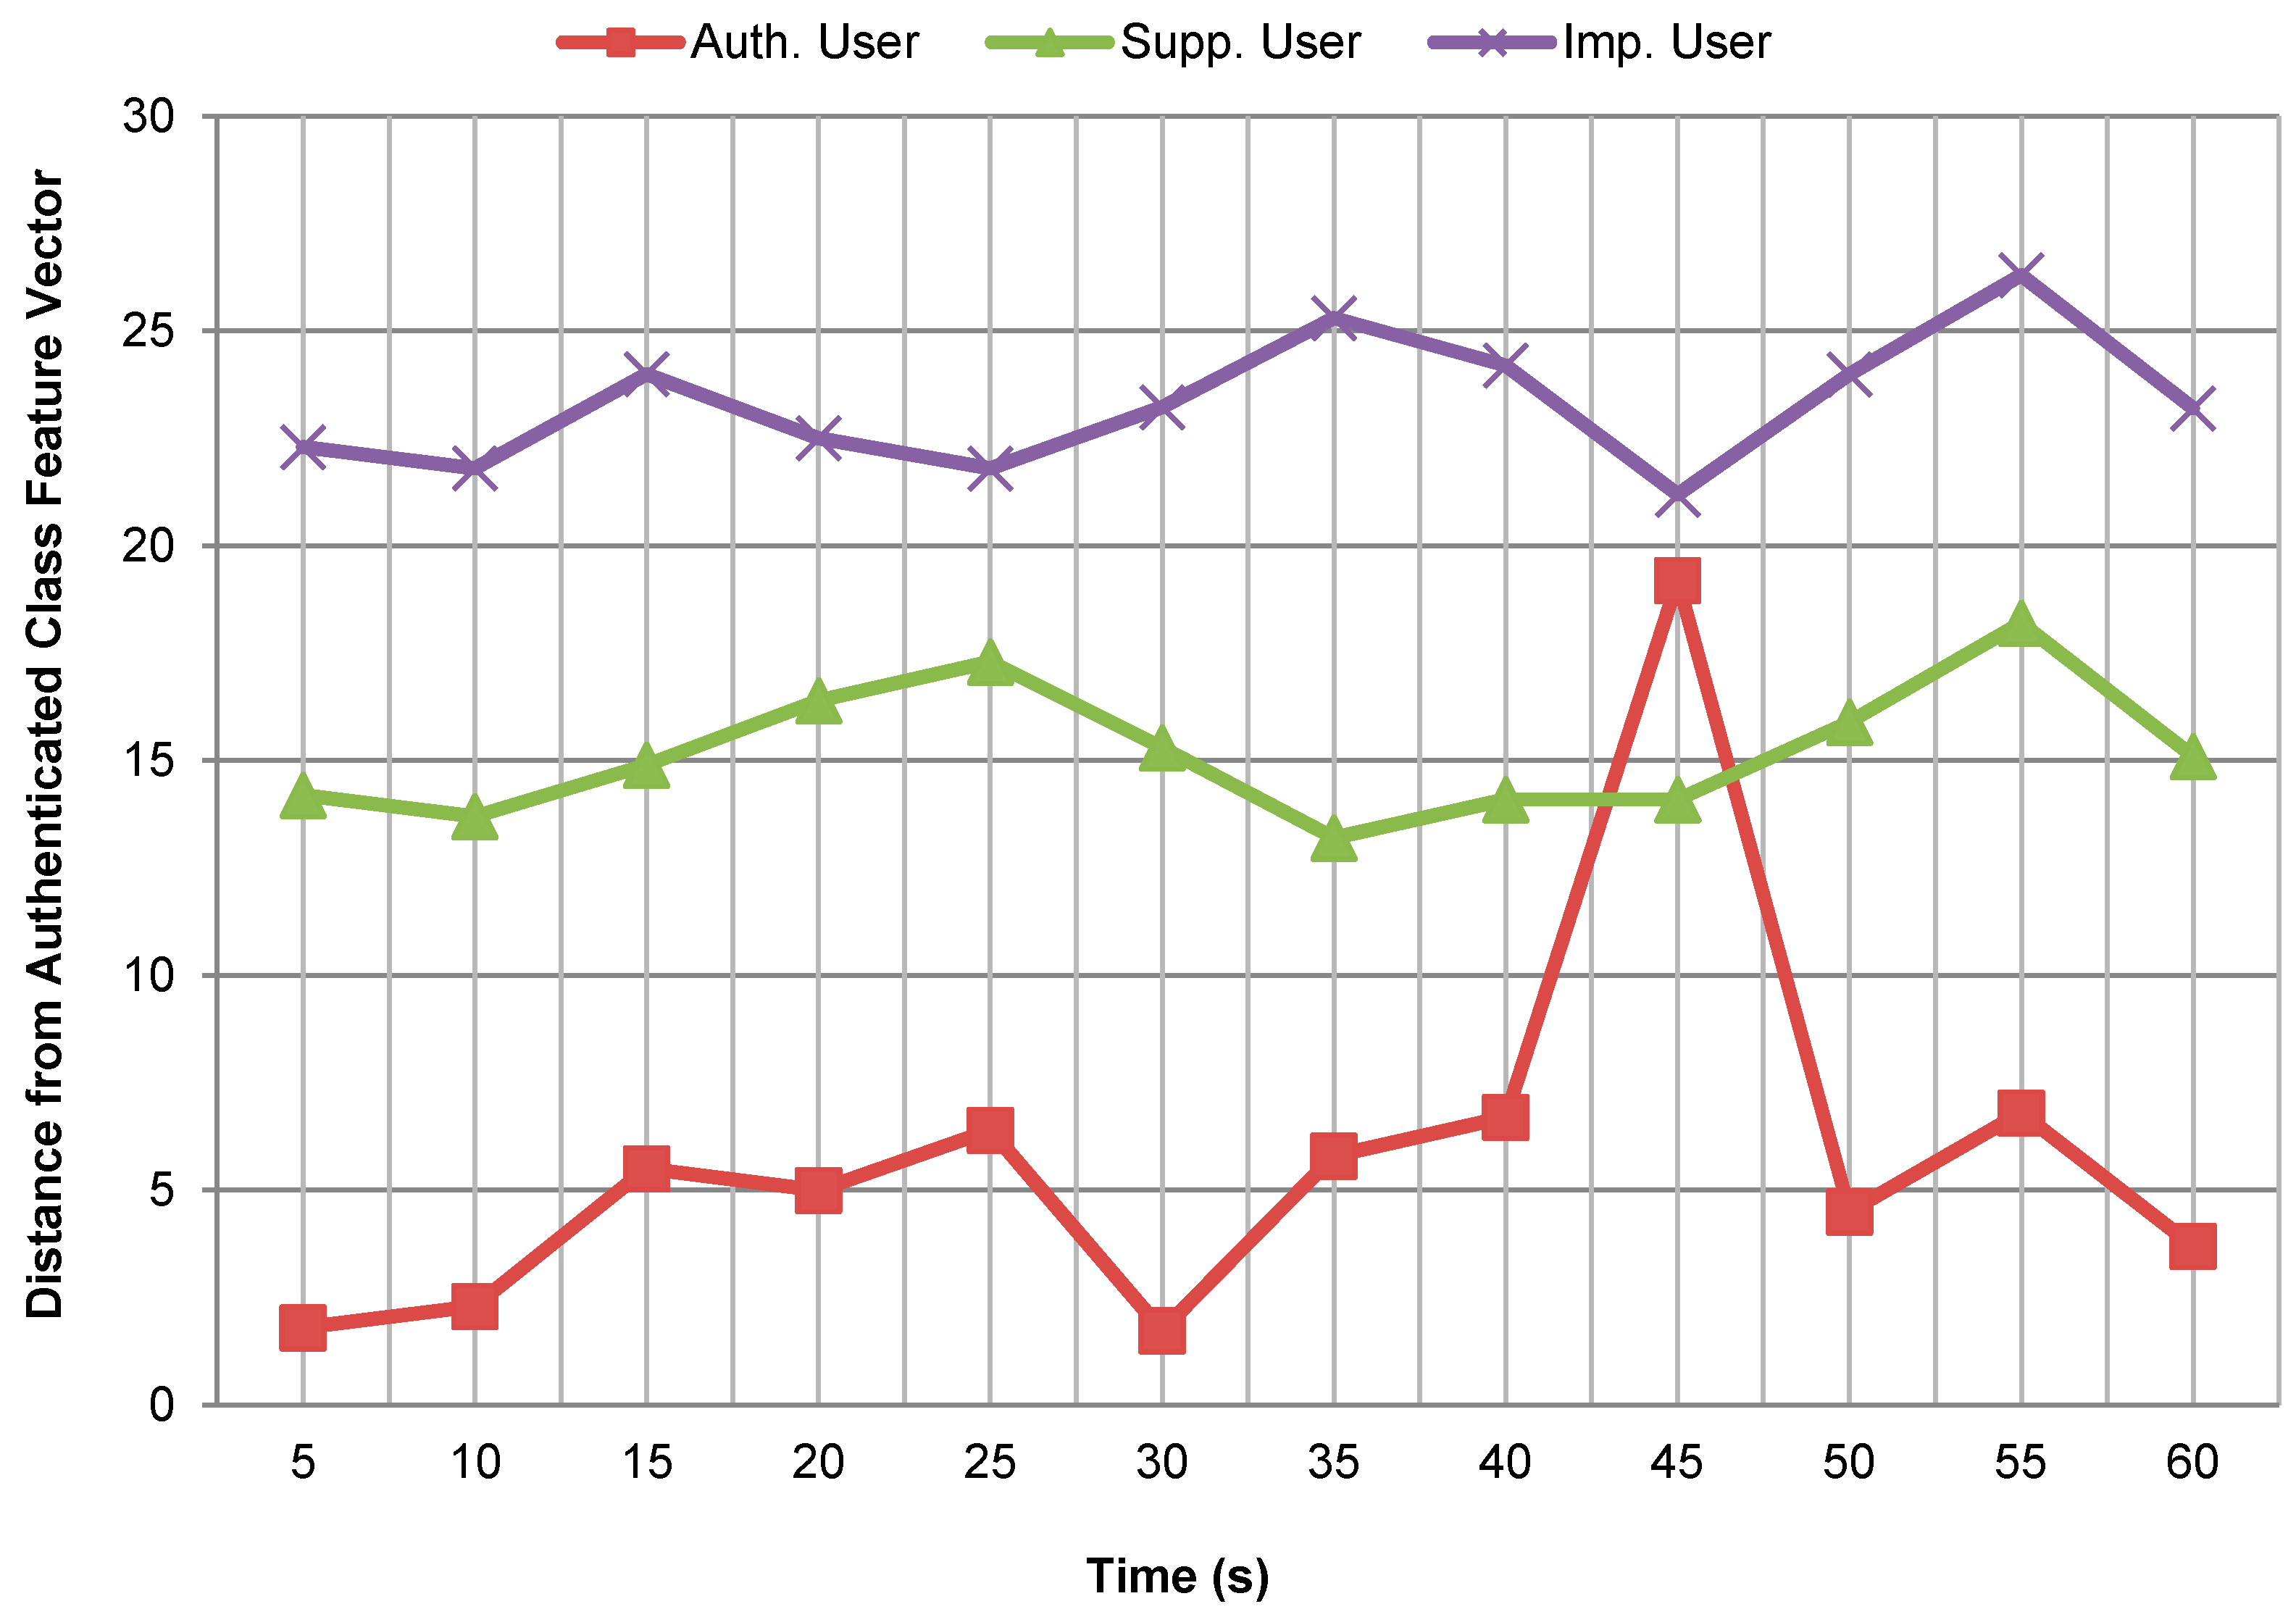
Figure 7 shows Euclidean distance between the trained feature vector for the authenticated class and the feature vectors computed from testing data for different class users to illustrate how sure the system is about the authentication. The trained feature vector for the authenticated class was selected corresponding to the walking activity for the left thigh position in this case. Similarly, the feature vectors for the different candidate users were also computed corresponding to the walking activity for the left thigh position over the data segments of 5
s. The distance was calculated after every 5 s’ interval of time for the activity duration of one minute only. From
Figure 7, it can be observed that the distance of the authenticated class feature vector from the authenticated user is very small for all time intervals (except at interval from 41 s to 45 s) as compare to its distance from the supplementary and imposter users. Also, the distance values computed at the same time for the different candidate users have a wide gap for most of the time intervals. It can be observed that both supplementary and impostor users are well separated from the authenticated user on the basis of the computed distances. Also, the supplementary and impostor users are at a fair distance from each other in this case. This shows that the system is quite sure about the authenticity of different class users for most of the time intervals.
Looking at the relative distances of the different candidate users from the authenticated class only (as shown in
Figure 7), the output of the system cannot be realized. It is necessary to compute the distance of each candidate user from all user classes in order to know the output of the system. For example, to find the output of the system while classifying the authenticated user (whose distance is plotted from the authenticated class in
Figure 7), the distance of this specific user was calculated from other user classes as well. From
Figure 7, it can be observed that the distance of this particular user from the authenticated class is very large for the time interval from . Therefore, after this time interval the user was misclassified as an imposter because the user had minimum distance from the imposter class.
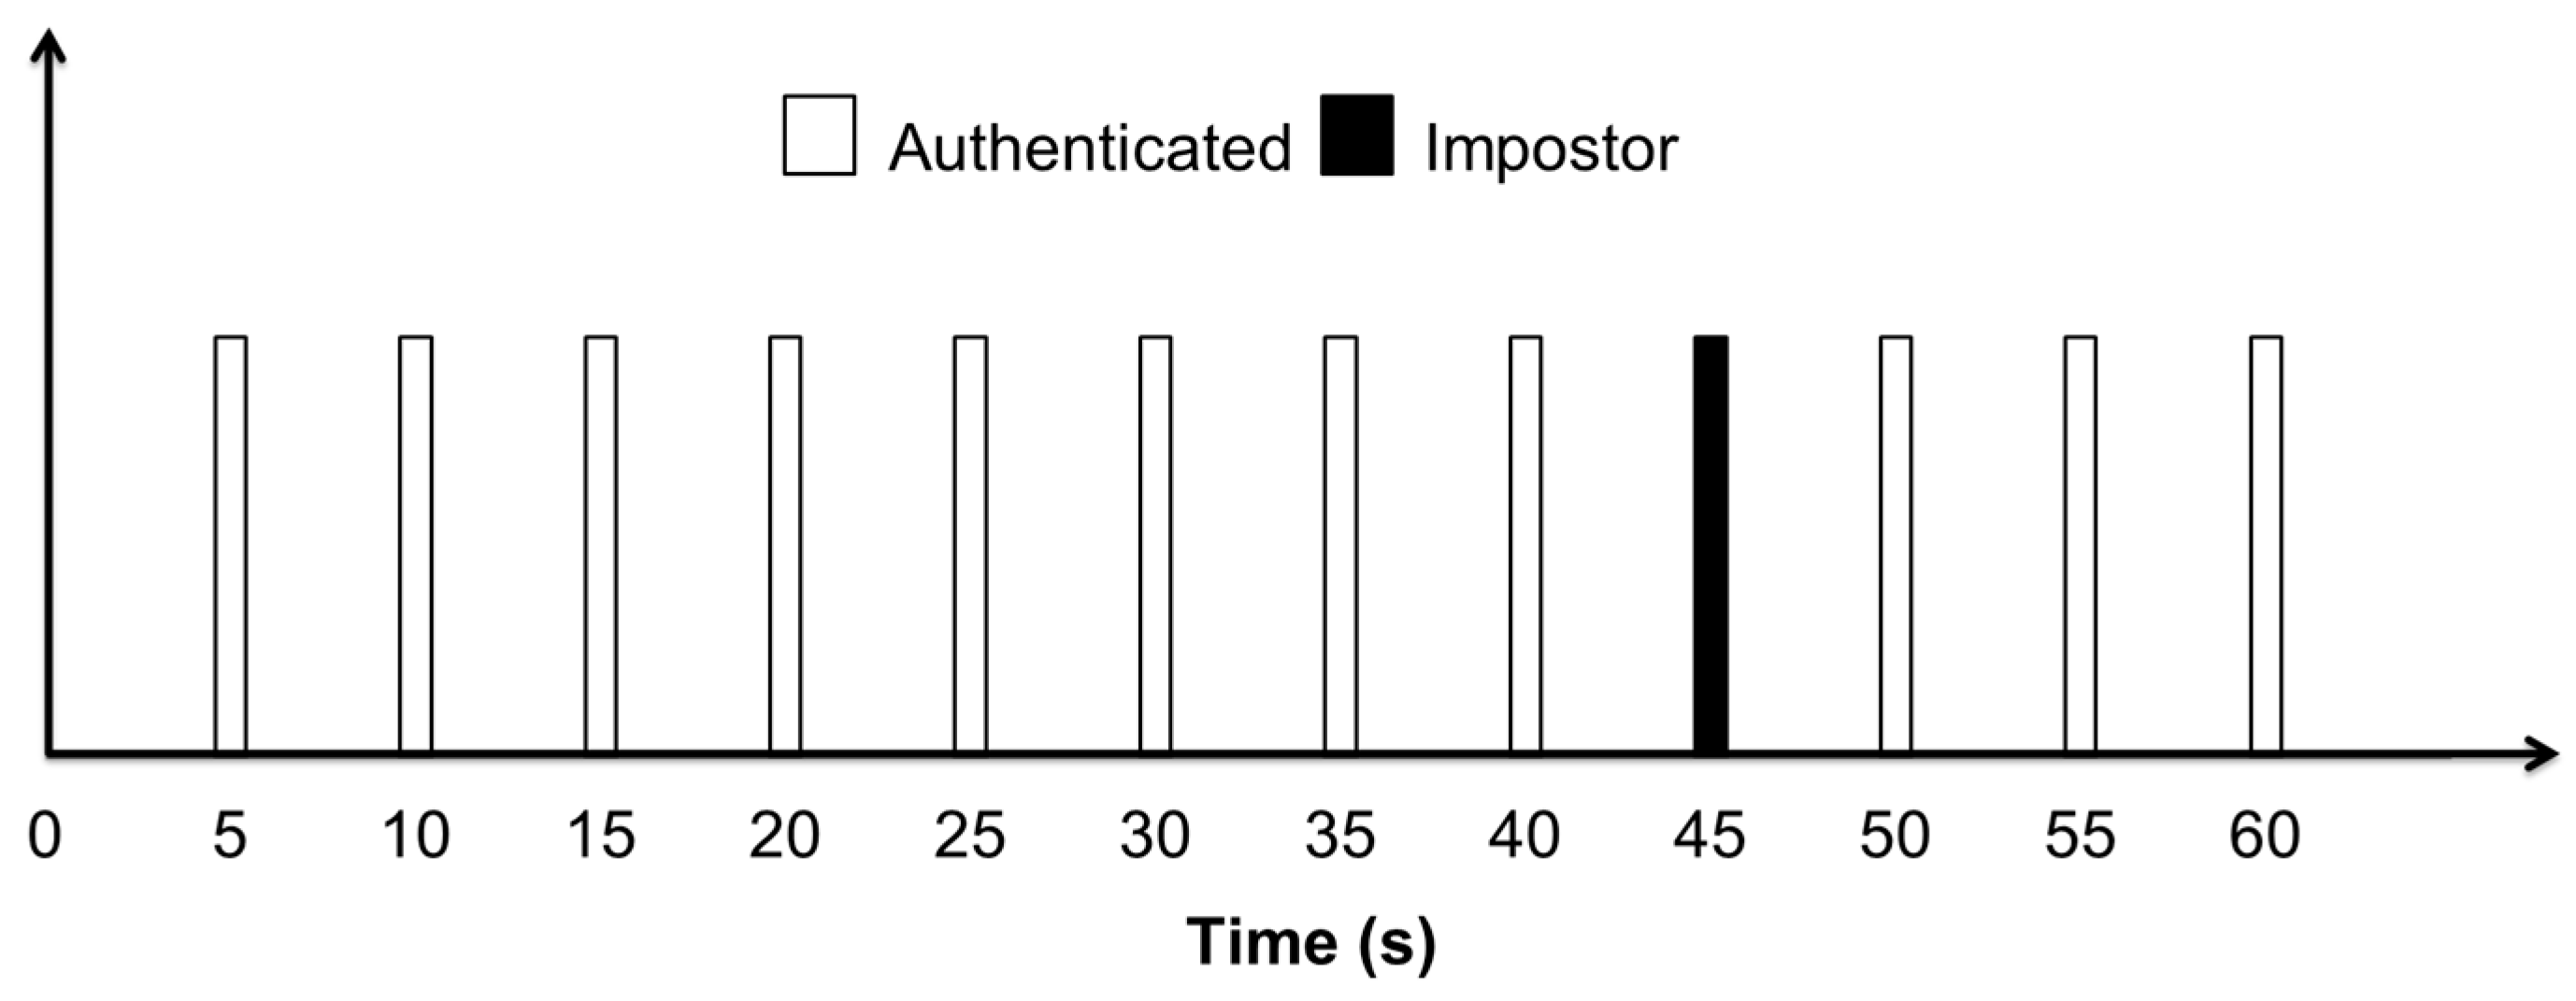
Figure 8 shows the output of the system after every five seconds’ interval of time while classifying this candidate user. It can be seen that the system has correctly recognized the user as an authenticated user for all time intervals, except the time interval from 41 s to 45 s, after which the user was classified as an impostor. So, after a period of one minute, it can be said that the system has correctly identified that the smartphone was possessed by an authenticated person with a very high accuracy of 91.67%. These results also suggest that an activity pattern of 5
s duration is sufficient to recognize and classify a user, considering a sampling rate of 50 Hz.
The results of the user classification were computed iteratively for all possible permutations of the users across three folds, considering all the scenarios given in
Table 7. Only the average results of all iterations are included in this section. To thoroughly analyze the results, different values were chosen for
but no significant changes were observed in the results that were obtained corresponding to the initial value of
. Therefore, this section reports the average results of the user classification for only the initial value of
. The metrics used to evaluate the user classification performance are True Positive Rate (TPR), False Positive Rate (FPR), accuracy, precision, recall, and f-measure.
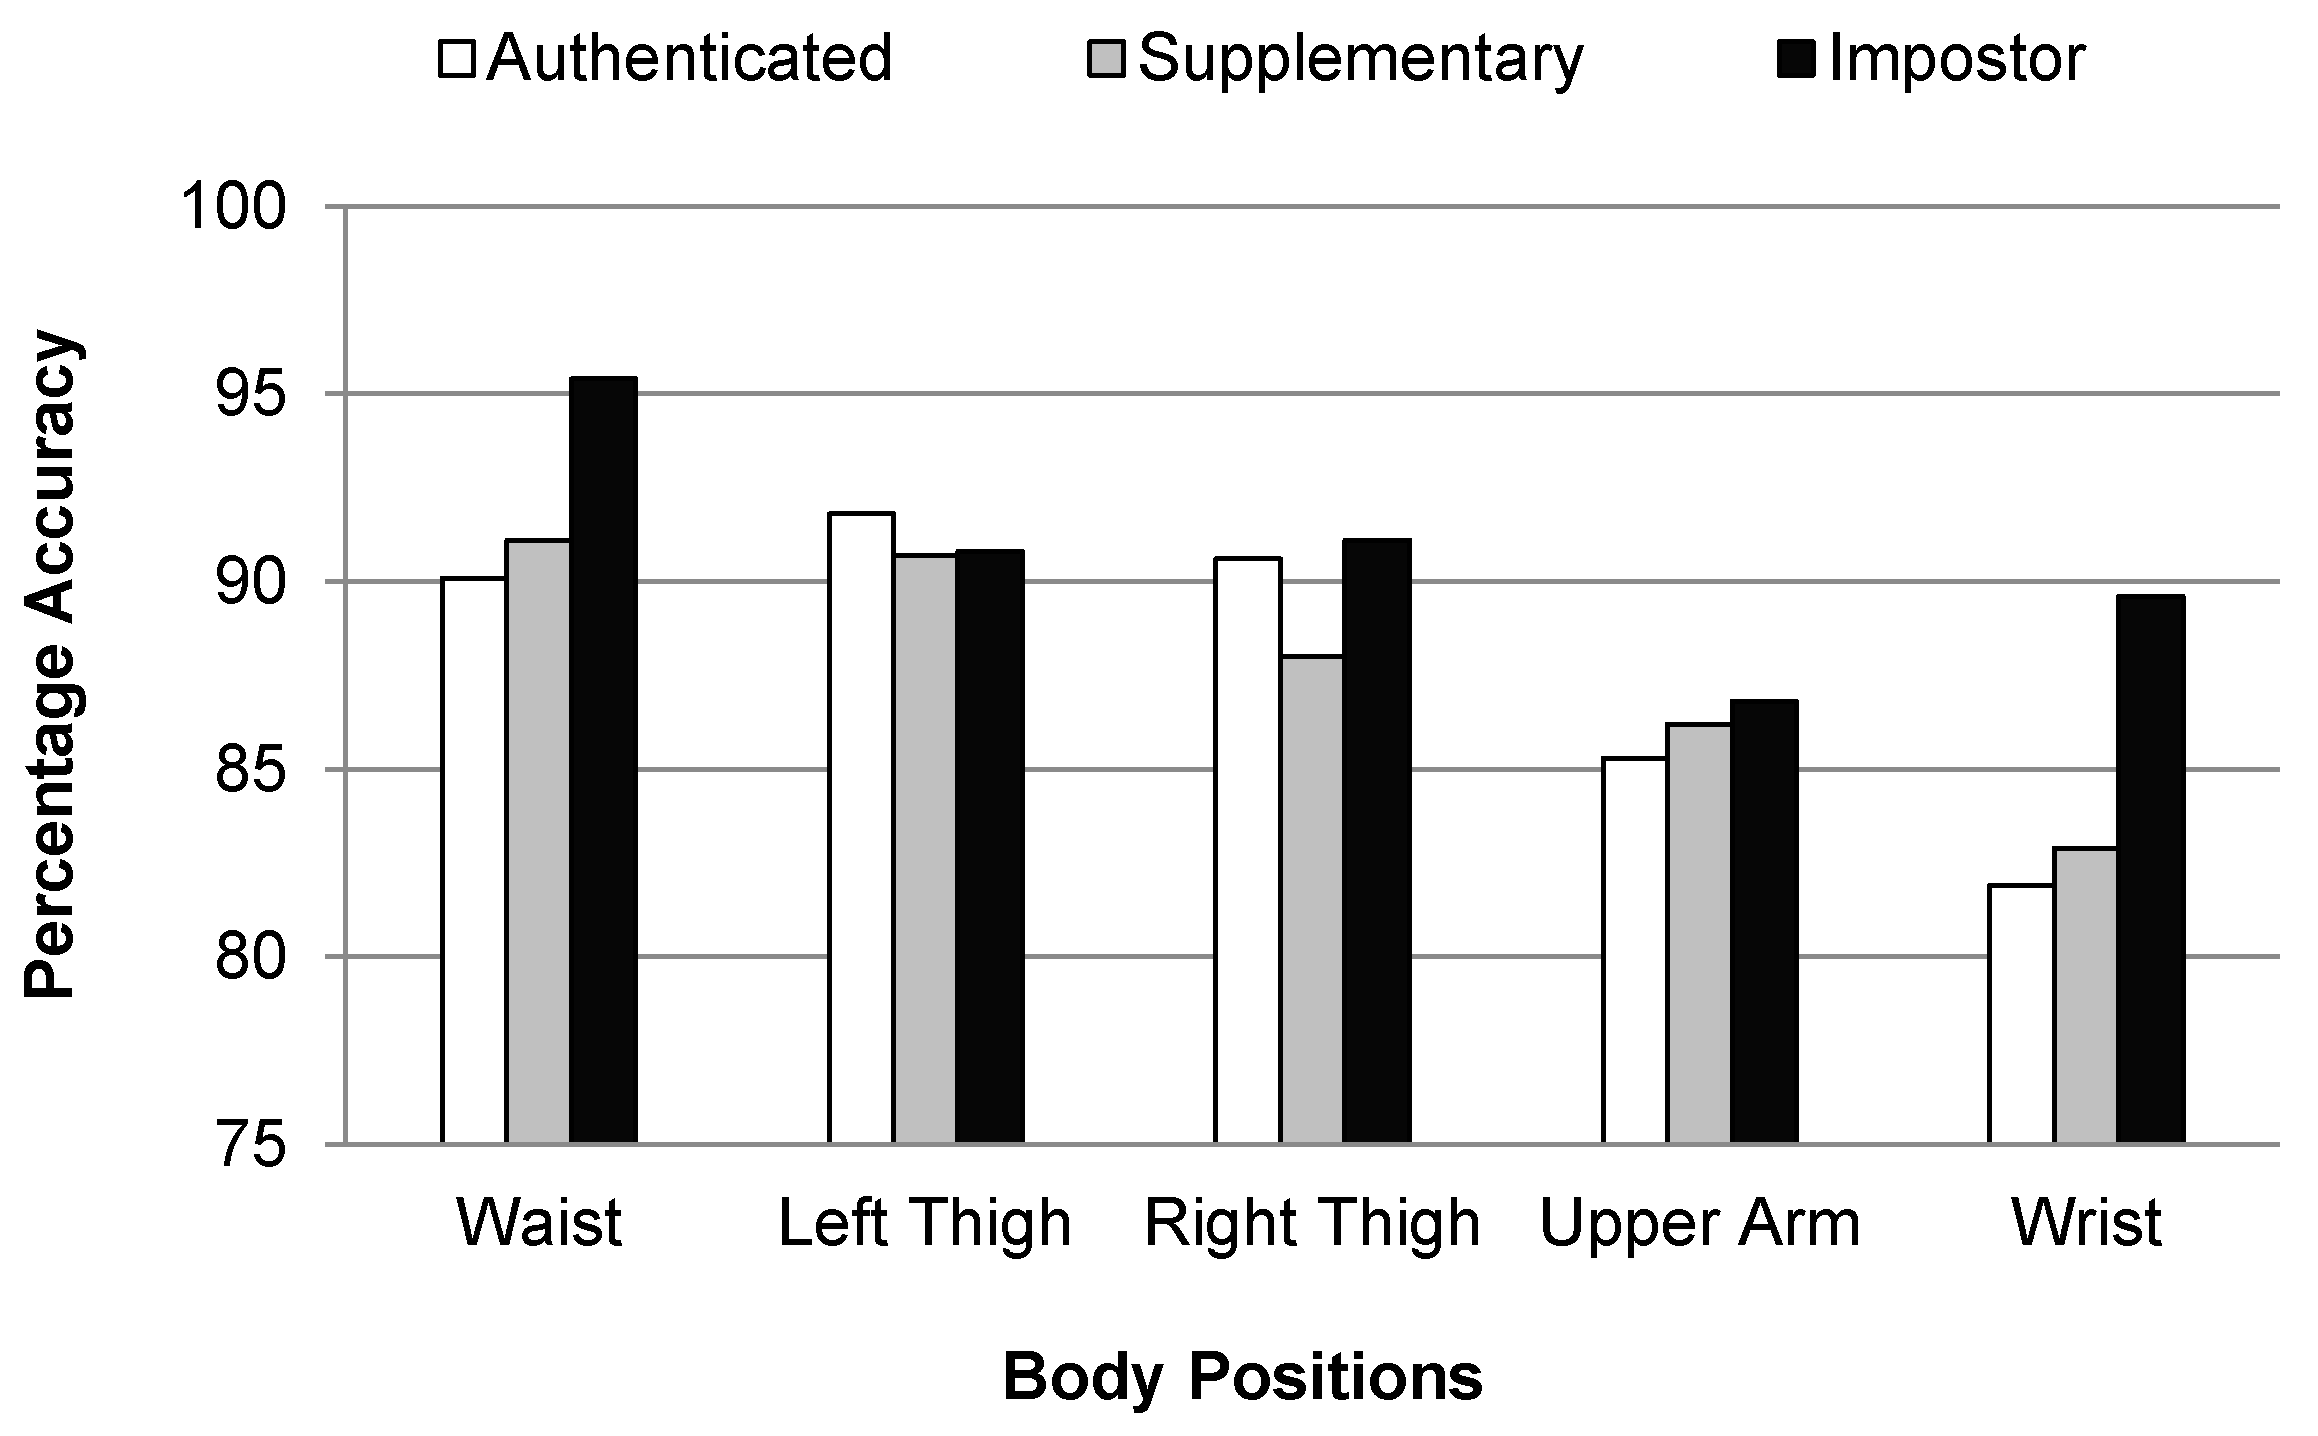
Table 8 shows the results of user classification based on activity recognition at five different body positions. It can be seen that for all body positions, the value of TPR is higher for the impostor class, which means that the authentication model has identified the impostor users more accurately as compare to the authenticated and supplementary users.
Figure 9 shows that the individual classification accuracies of all the user classes are higher for the waist, left thigh, and right thigh positions. It means that it is easy to identify a user by recognizing an activity if the smartphone is placed in the left or right jeans pocket, or hung from a belt clip at the waist. This is due to the fact that the performance of activity recognition is better for these body positions as compared with other body positions used, as can be seen in
Figure 5. The overall classification accuracies for the authenticated, supplementary, and impostor classes are 87.94%, 87.78%, and 90.74%, respectively.
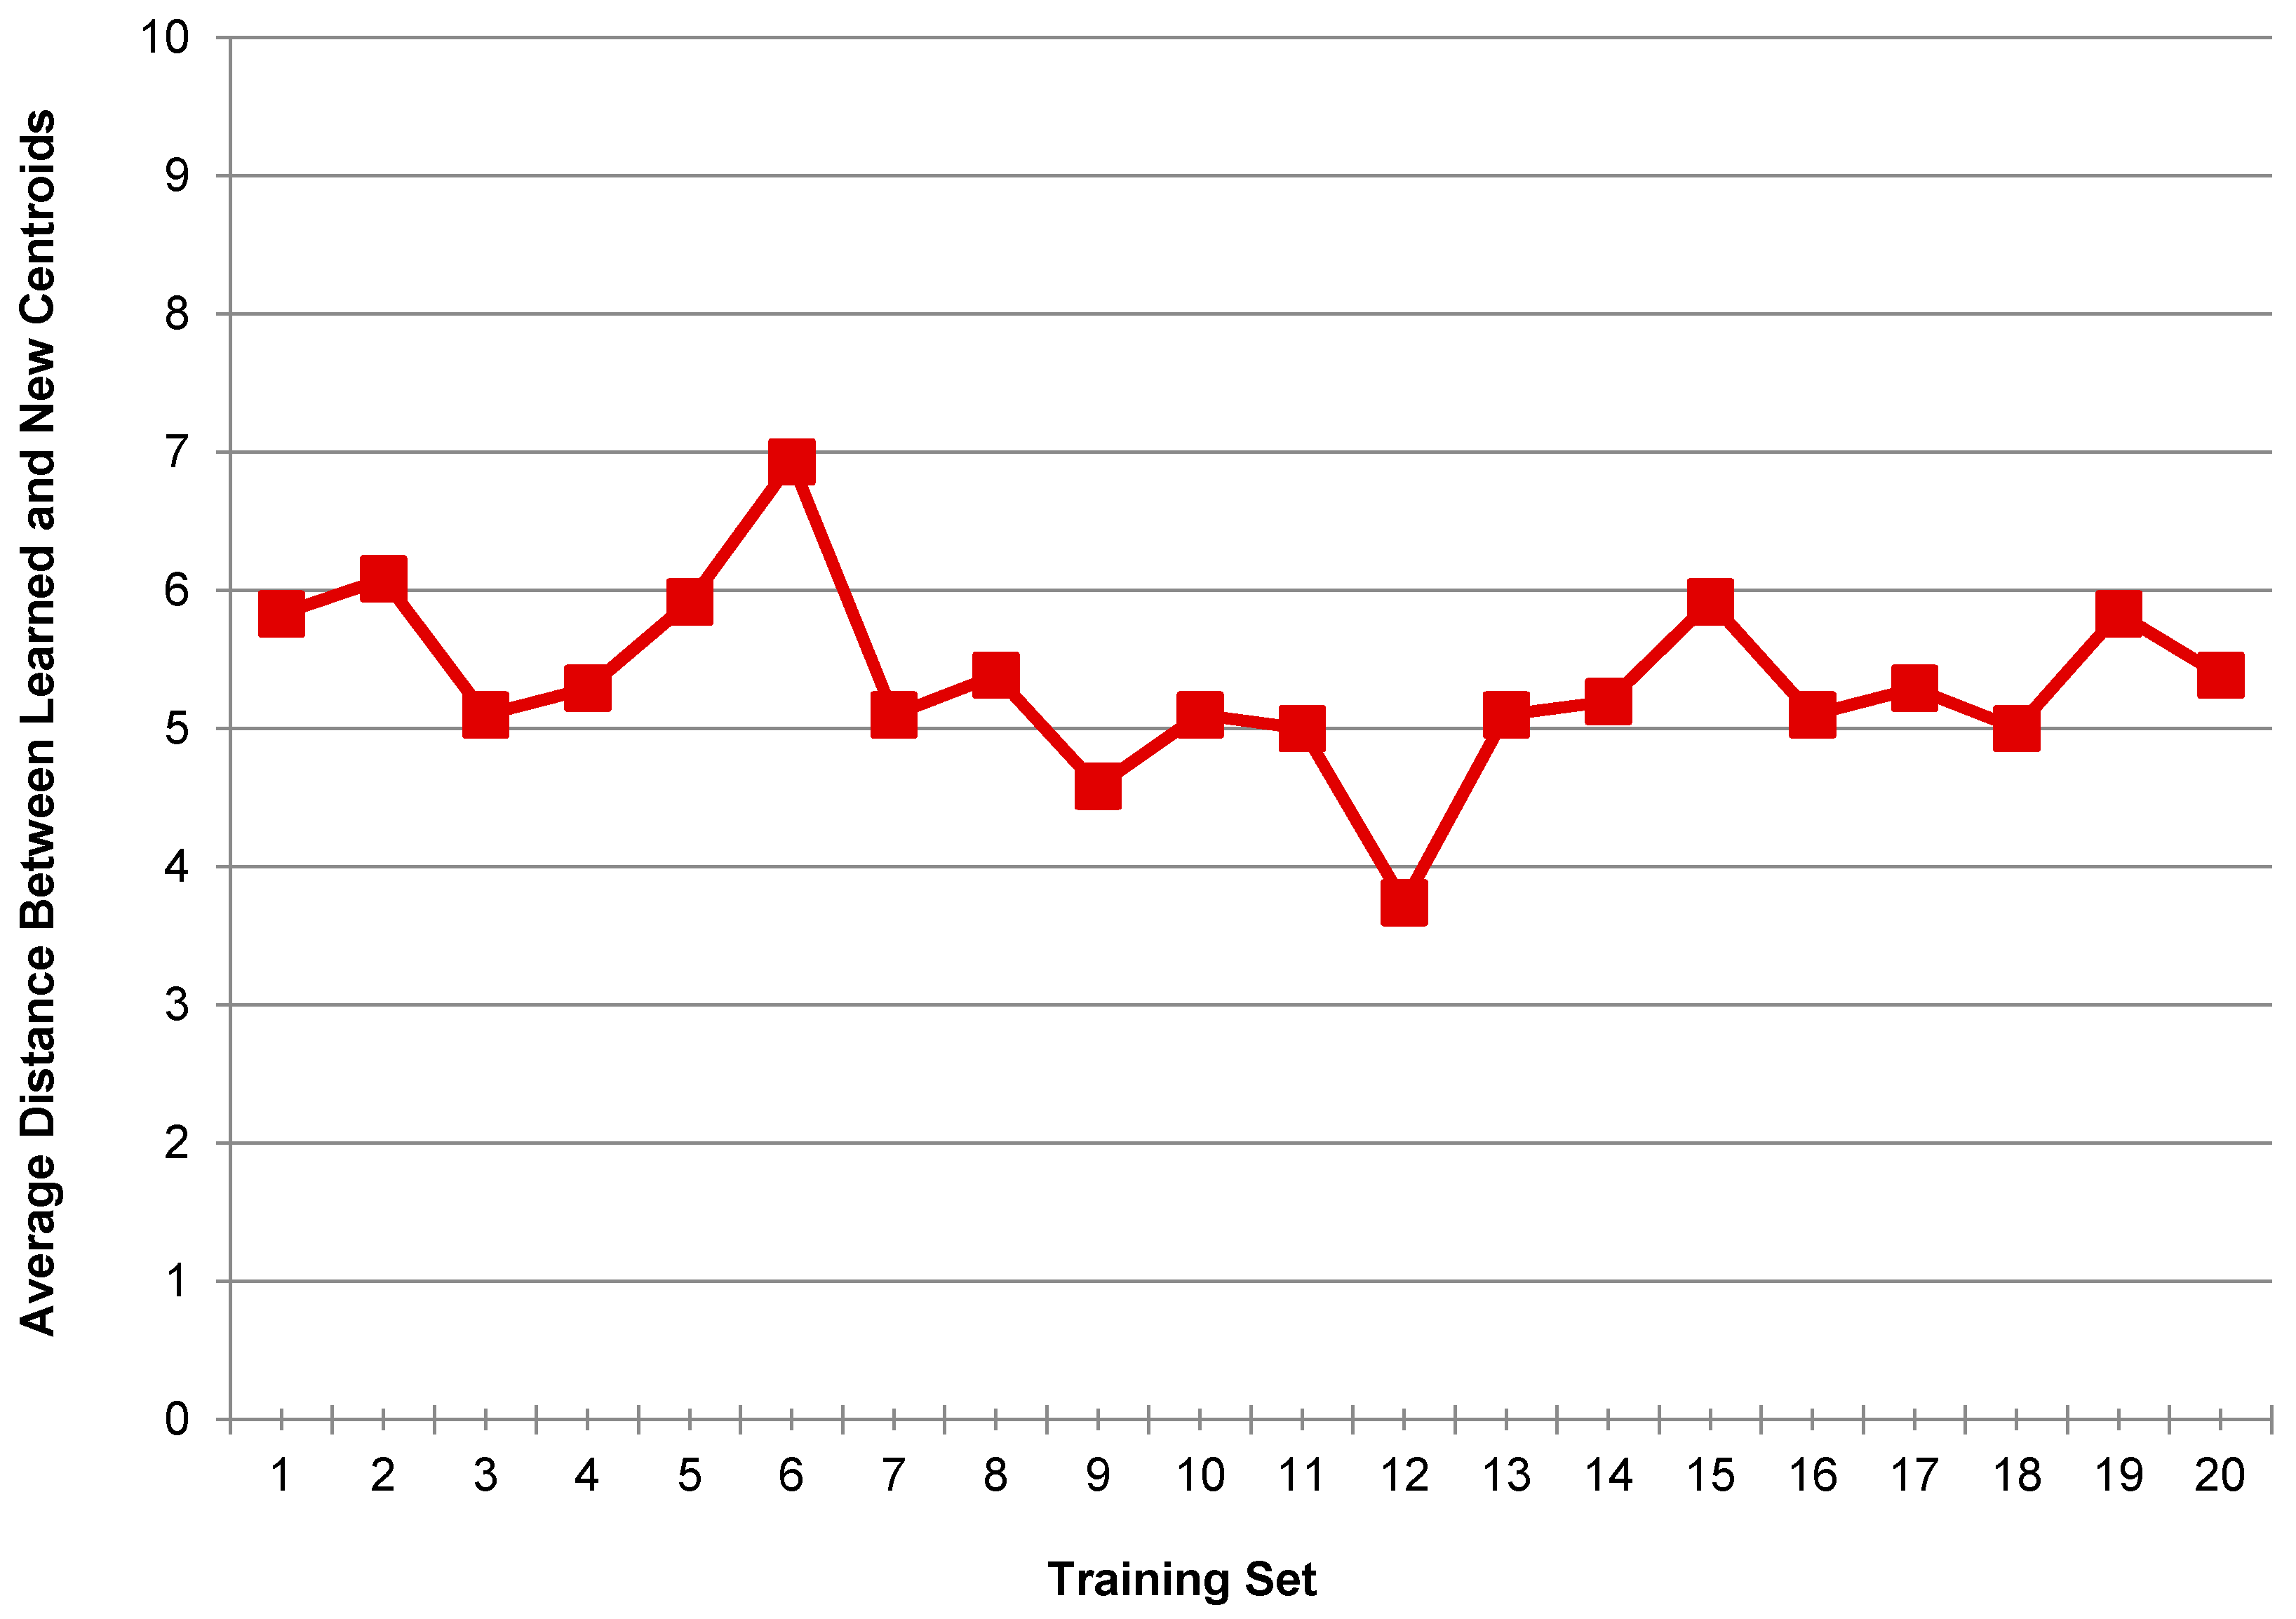
Generally, a smartphone has a single authenticated user and a few supplementary users only. All other users of the smartphone may be treated as impostors. Therefore, the impostor user class has a large number of instances as compare to the authenticated and supplementary user classes. For real-time authentication, the proposed framework requires the recording of training data for the authenticated and supplementary class users only. During training, the system extracts different features from the data recorded for the authenticated and supplementary class users, and divides the feature vectors computed corresponding to different activities into K clusters using K-means clustering. The system then takes the learned centroids as the trained feature vectors for authenticated and supplementary classes. If new training data are added to the training set, then the training data are clustered again using K-means clustering and the centroids are updated in accordance with the new data. After computing trained feature vectors, the system calculates the distance of each computed feature vector from the trained feature vectors and finds the maximum possible distance . During real-time authentication, the system considers a smartphone user as an impostor by default until and unless a definite matching pattern is detected for an activity in the trained users’ profiles. It extracts the feature vector from the real-time data obtained from the smartphone sensors and recognizes the activity performed by the user. The extracted feature vector is then compared with the trained feature vectors of the authenticated and supplementary classes, and user classification is performed. In the case of an authenticated or a supplementary user, the extracted feature vector will be matched with one of the trained feature vectors and the Euclidean distance between the matched similar feature vectors will be less than or equal to . Hence, the user will be classified as an authenticated or a supplementary user. On the other hand, if the user is an impostor, his/her activity pattern will be different from those of trained activity patterns. So, the Euclidean distance between the feature vector extracted for an impostor’s activity and that of trained feature vectors will be higher than and the user will be recognized as an impostor. In this way, the system ably handles a new smartphone user as an impostor whose activity pattern is not yet determined.

 ,
, 


