Article

Effects of Adherence to a Higher Protein Diet on Weight Loss, Markers of Health, and Functional Capacity in Older Women Participating in a Resistance-Based Exercise Program

1
Matrix Medical Net, New York, NY 10011, USA
2
Exercise Science Program, University of South Florida, Tampa, FL 33620, USA
3
Exercise and Sports Science Department, University of Mary Hardin-Baylor, Belton, TX 76513, USA
4
Department of Physical Therapy, Campbell University, Buies Creek, NC 27506, USA
5
Department of Health, Human Performance and Recreation, Baylor University, Waco, TX 76798, USA
6
United States Special Operations Command, Preservation of the Force and Family, Human Performance, MacDill AFB, Tampa, FL 33621, USA
7
Department of Health, Kinesiology, & Sport, The University of South Alabama, Mobile, AL 36688, USA
8
Department of Nutrition & Metabolism, University of Texas Medical Branch, Galveston, TX 77555, USA
9
Department of Exercise and Nutrition Sciences, George Washington University, Washington, DC 20037, USA
10
Division of Rehabilitation Sciences, University of Texas Medical Branch, Galveston, TX 77555, USA
11
School of Health Sciences, Lindenwood University, Saint Charles, MO 63301, USA
12
Exercise & Sport Nutrition Lab, Human Clinical Research Facility, Department of Health and Kinesiology, Texas A & M University, College Station, TX 77843, USA
13
Faculty of Health, Arts and Design, Swinburne University of Technology, Melbourne, VIC 3000, Australia
*
Author to whom correspondence should be addressed.
Nutrients 2018, 10(8), 1070; https://doi.org/10.3390/nu10081070
Submission received: 5 July 2018 / Revised: 8 August 2018 / Accepted: 9 August 2018 / Published: 11 August 2018
(This article belongs to the Special Issue Diet and Weight Loss)

Abstract

:
Resistance training and maintenance of a higher protein diet have been recommended to help older individuals maintain muscle mass. This study examined whether adherence to a higher protein diet while participating in a resistance-based exercise program promoted more favorable changes in body composition, markers of health, and/or functional capacity in older females in comparison to following a traditional higher carbohydrate diet or exercise training alone with no diet intervention. In total, 54 overweight and obese females (65.9 ± 4.7 years; 78.7 ± 11 kg, 30.5 ± 4.1 kg/m2, 43.5 ± 3.6% fat) were randomly assigned to an exercise-only group (E), an exercise plus hypo-energetic higher carbohydrate (HC) diet, or a higher protein diet (HP) diet. Participants followed their respective diet plans and performed a supervised 30-min circuit-style resistance exercise program 3 d/wk. Participants were tested at 0, 10, and 14 weeks. Data were analyzed using univariate, multivariate, and repeated measures general linear model (GLM) statistics as well as one-way analysis of variance (ANOVA) of changes from baseline with [95% confidence intervals]. Results revealed that after 14 weeks, participants in the HP group experienced significantly greater reductions in weight (E −1.3 ± 2.3, [−2.4, −0.2]; HC −3.0 ± 3.1 [−4.5, −1.5]; HP −4.8 ± 3.2, [−6.4, −3.1]%, p = 0.003), fat mass (E −2.7 ± 3.8, [−4.6, −0.9]; HC −5.9 ± 4.2 [−8.0, −3.9]; HP −10.2 ± 5.8 [−13.2, –7.2%], p < 0.001), and body fat percentage (E −2.0 ± 3.5 [−3.7, −0.3]; HC −4.3 ± 3.2 [−5.9, −2.8]; HP −6.3 ± 3.5 [−8.1, −4.5] %, p = 0.002) with no significant reductions in fat-free mass or resting energy expenditure over time or among groups. Significant differences were observed in leptin (E −1.8 ± 34 [−18, 14]; HC 43.8 ± 55 [CI 16, 71]; HP −26.5 ± 70 [−63, −9.6] ng/mL, p = 0.001) and adiponectin (E 43.1 ± 76.2 [6.3, 79.8]; HC −27.9 ± 33.4 [−44.5, −11.3]; HP 52.3 ± 79 [11.9, 92.8] µg/mL, p = 0.001). All groups experienced significant improvements in muscular strength, muscular endurance, aerobic capacity, markers of balance and functional capacity, and several markers of health. These findings indicate that a higher protein diet while participating in a resistance-based exercise program promoted more favorable changes in body composition compared to a higher carbohydrate diet in older females.

1. Introduction

Obesity is considered the leading cause of preventable death world-wide and is associated with a myriad of medical co-morbidities, including diabetes, arthritis, pulmonary abnormalities, urinary incontinence, cataracts, and certain types of cancer [1,2,3,4]. Obesity complicates the aging process [1,5,6,7] particularly when associated with sarcopenic obesity [2,3,4,5,6,7,8,9,10,11,12]. The fastest growing age group in the United States are individuals over the age of 65 [13,14,15]. According to the Center for Disease Control (CDC)’s 2007–2010 National Health and Nutrition Examination Survey, 41% of individuals in the United States aged 65–74 years old and 28% of those above age 75 were obese [16]. Aging women have been shown to be less active, and more likely to suffer from falls and hip fractures, which may subsequently lead to increased health care expenditures [17,18]. Consequently, identifying strategies to promote effective weight and fat loss while maintaining muscle mass, strength, and functional capacity as women age can have significant public health implications.
Numerous studies indicate that resistance exercise training can maintain and/or increase fat-free mass as one ages [19,20,21,22]. Accordingly, the American College of Sports Medicine (ACSM) recommends that elderly individuals engage in regular physical activity that includes resistance-exercise of all major muscle groups [23,24]. Additionally, it has been recommended that older individuals should increase dietary protein intake in an attempt to maintain muscle mass and prevent sarcopenia [25,26,27,28]. Together, these two lifestyle modifications are likely to offer synergistic benefits pertaining to body composition and muscular strength in elderly populations. We have previously reported that adherence to a circuit-style resistance exercise program and adherence to a higher protein hypo-energetic diet promoted greater weight and fat loss while maintaining muscle mass and preserving resting energy expenditure in pre-menopausal and post-menopausal women under the age of 55 [29,30,31,32,33,34,35]. Moreover, this program promoted gains in aerobic capacity, muscular strength, and endurance, and improved markers of metabolic syndrome [29,30,31,32,33,34,35]. Theoretically, incorporating resistance exercise while maintaining a higher protein hypo-energetic diet may promote more favorable changes in body composition in older individuals attempting to lose weight compared to adherence to a higher carbohydrate diet. The purpose of this study was to determine if this exercise and diet intervention strategy could be an effective way to promote weight and fat loss, maintain fat-free mass and resting energy expenditure, and/or improve health and fitness in older sedentary and overweight and obese women in comparison to following a traditional higher carbohydrate hypo-energetic diet or resistance exercise training alone.

2. Methods

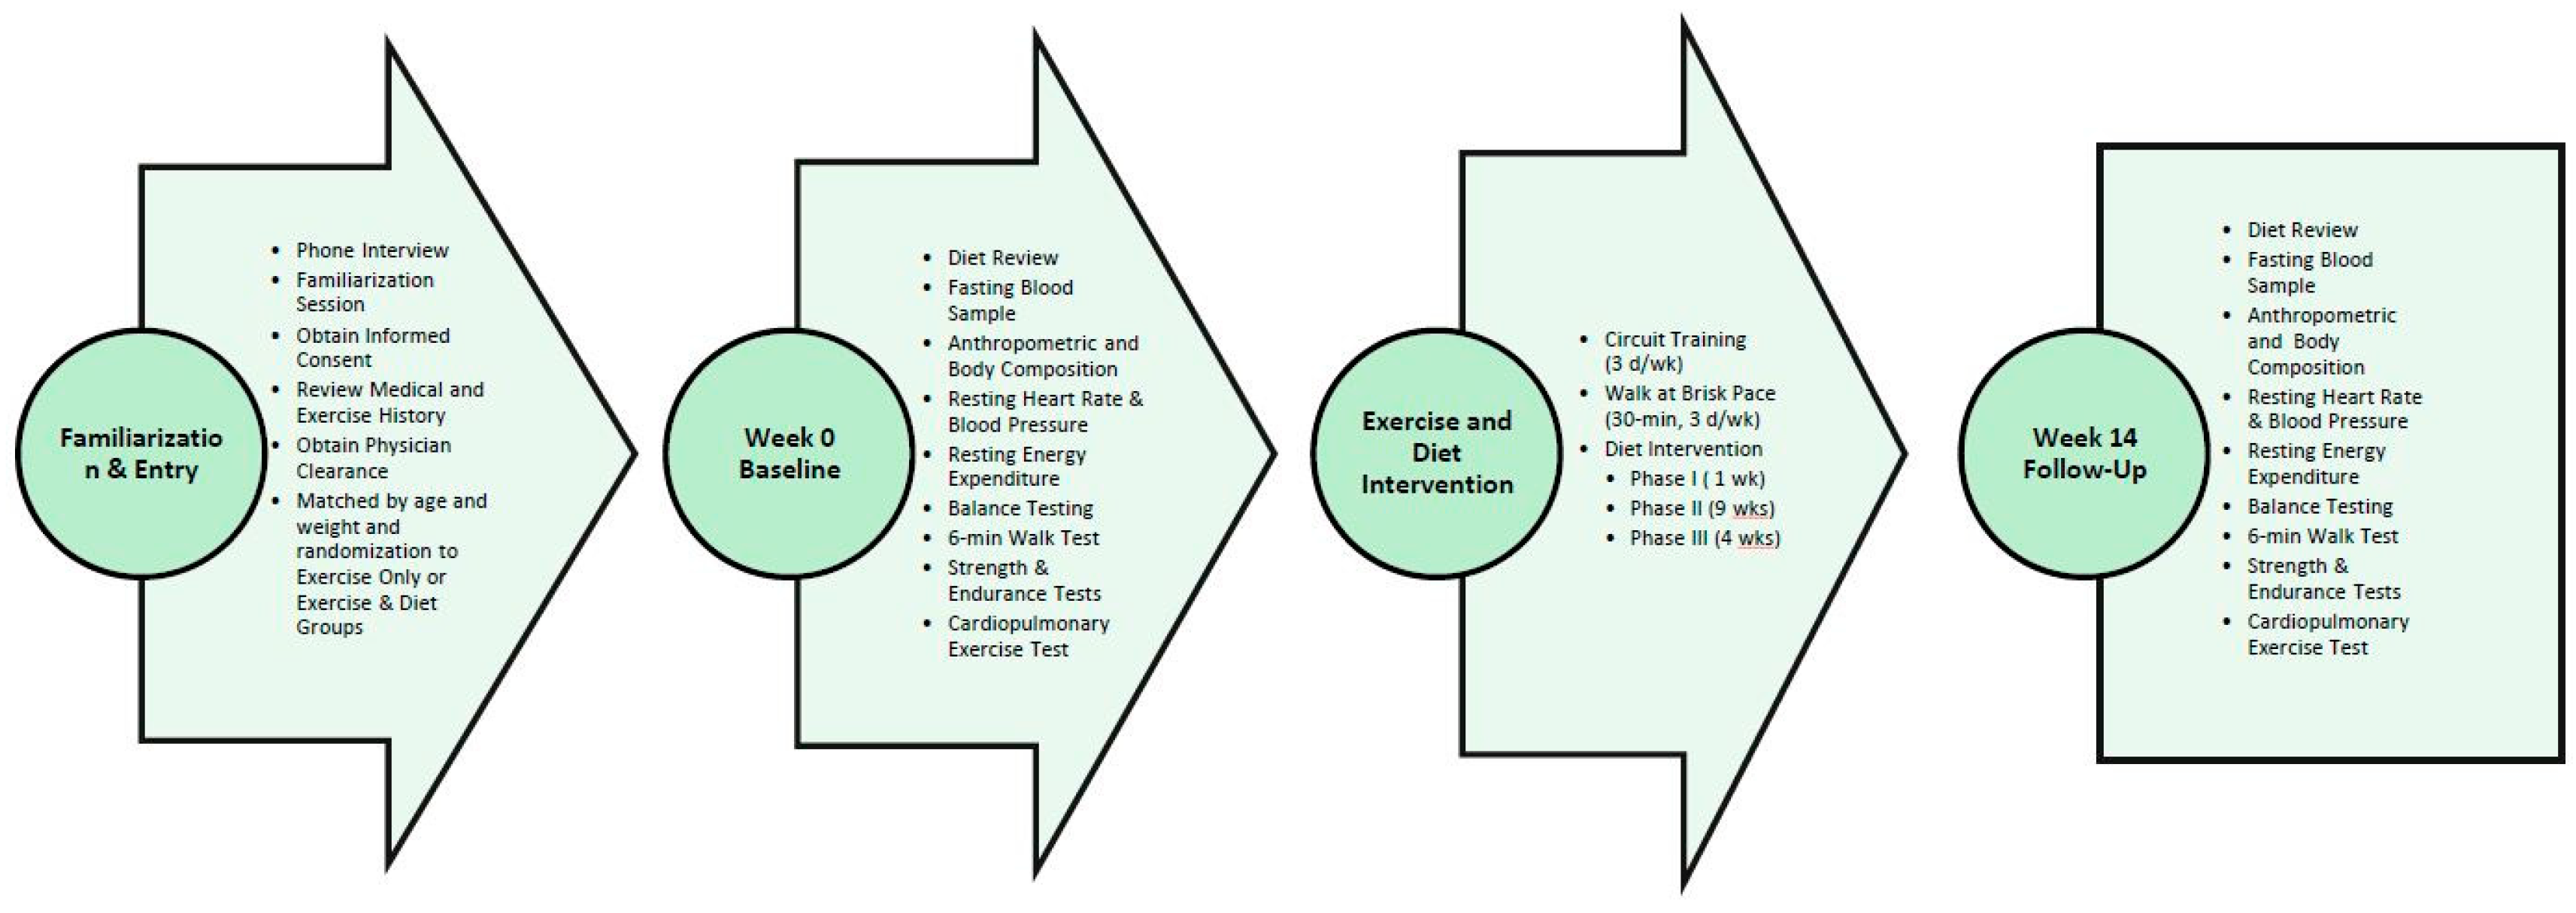
2.1. Experimental Design
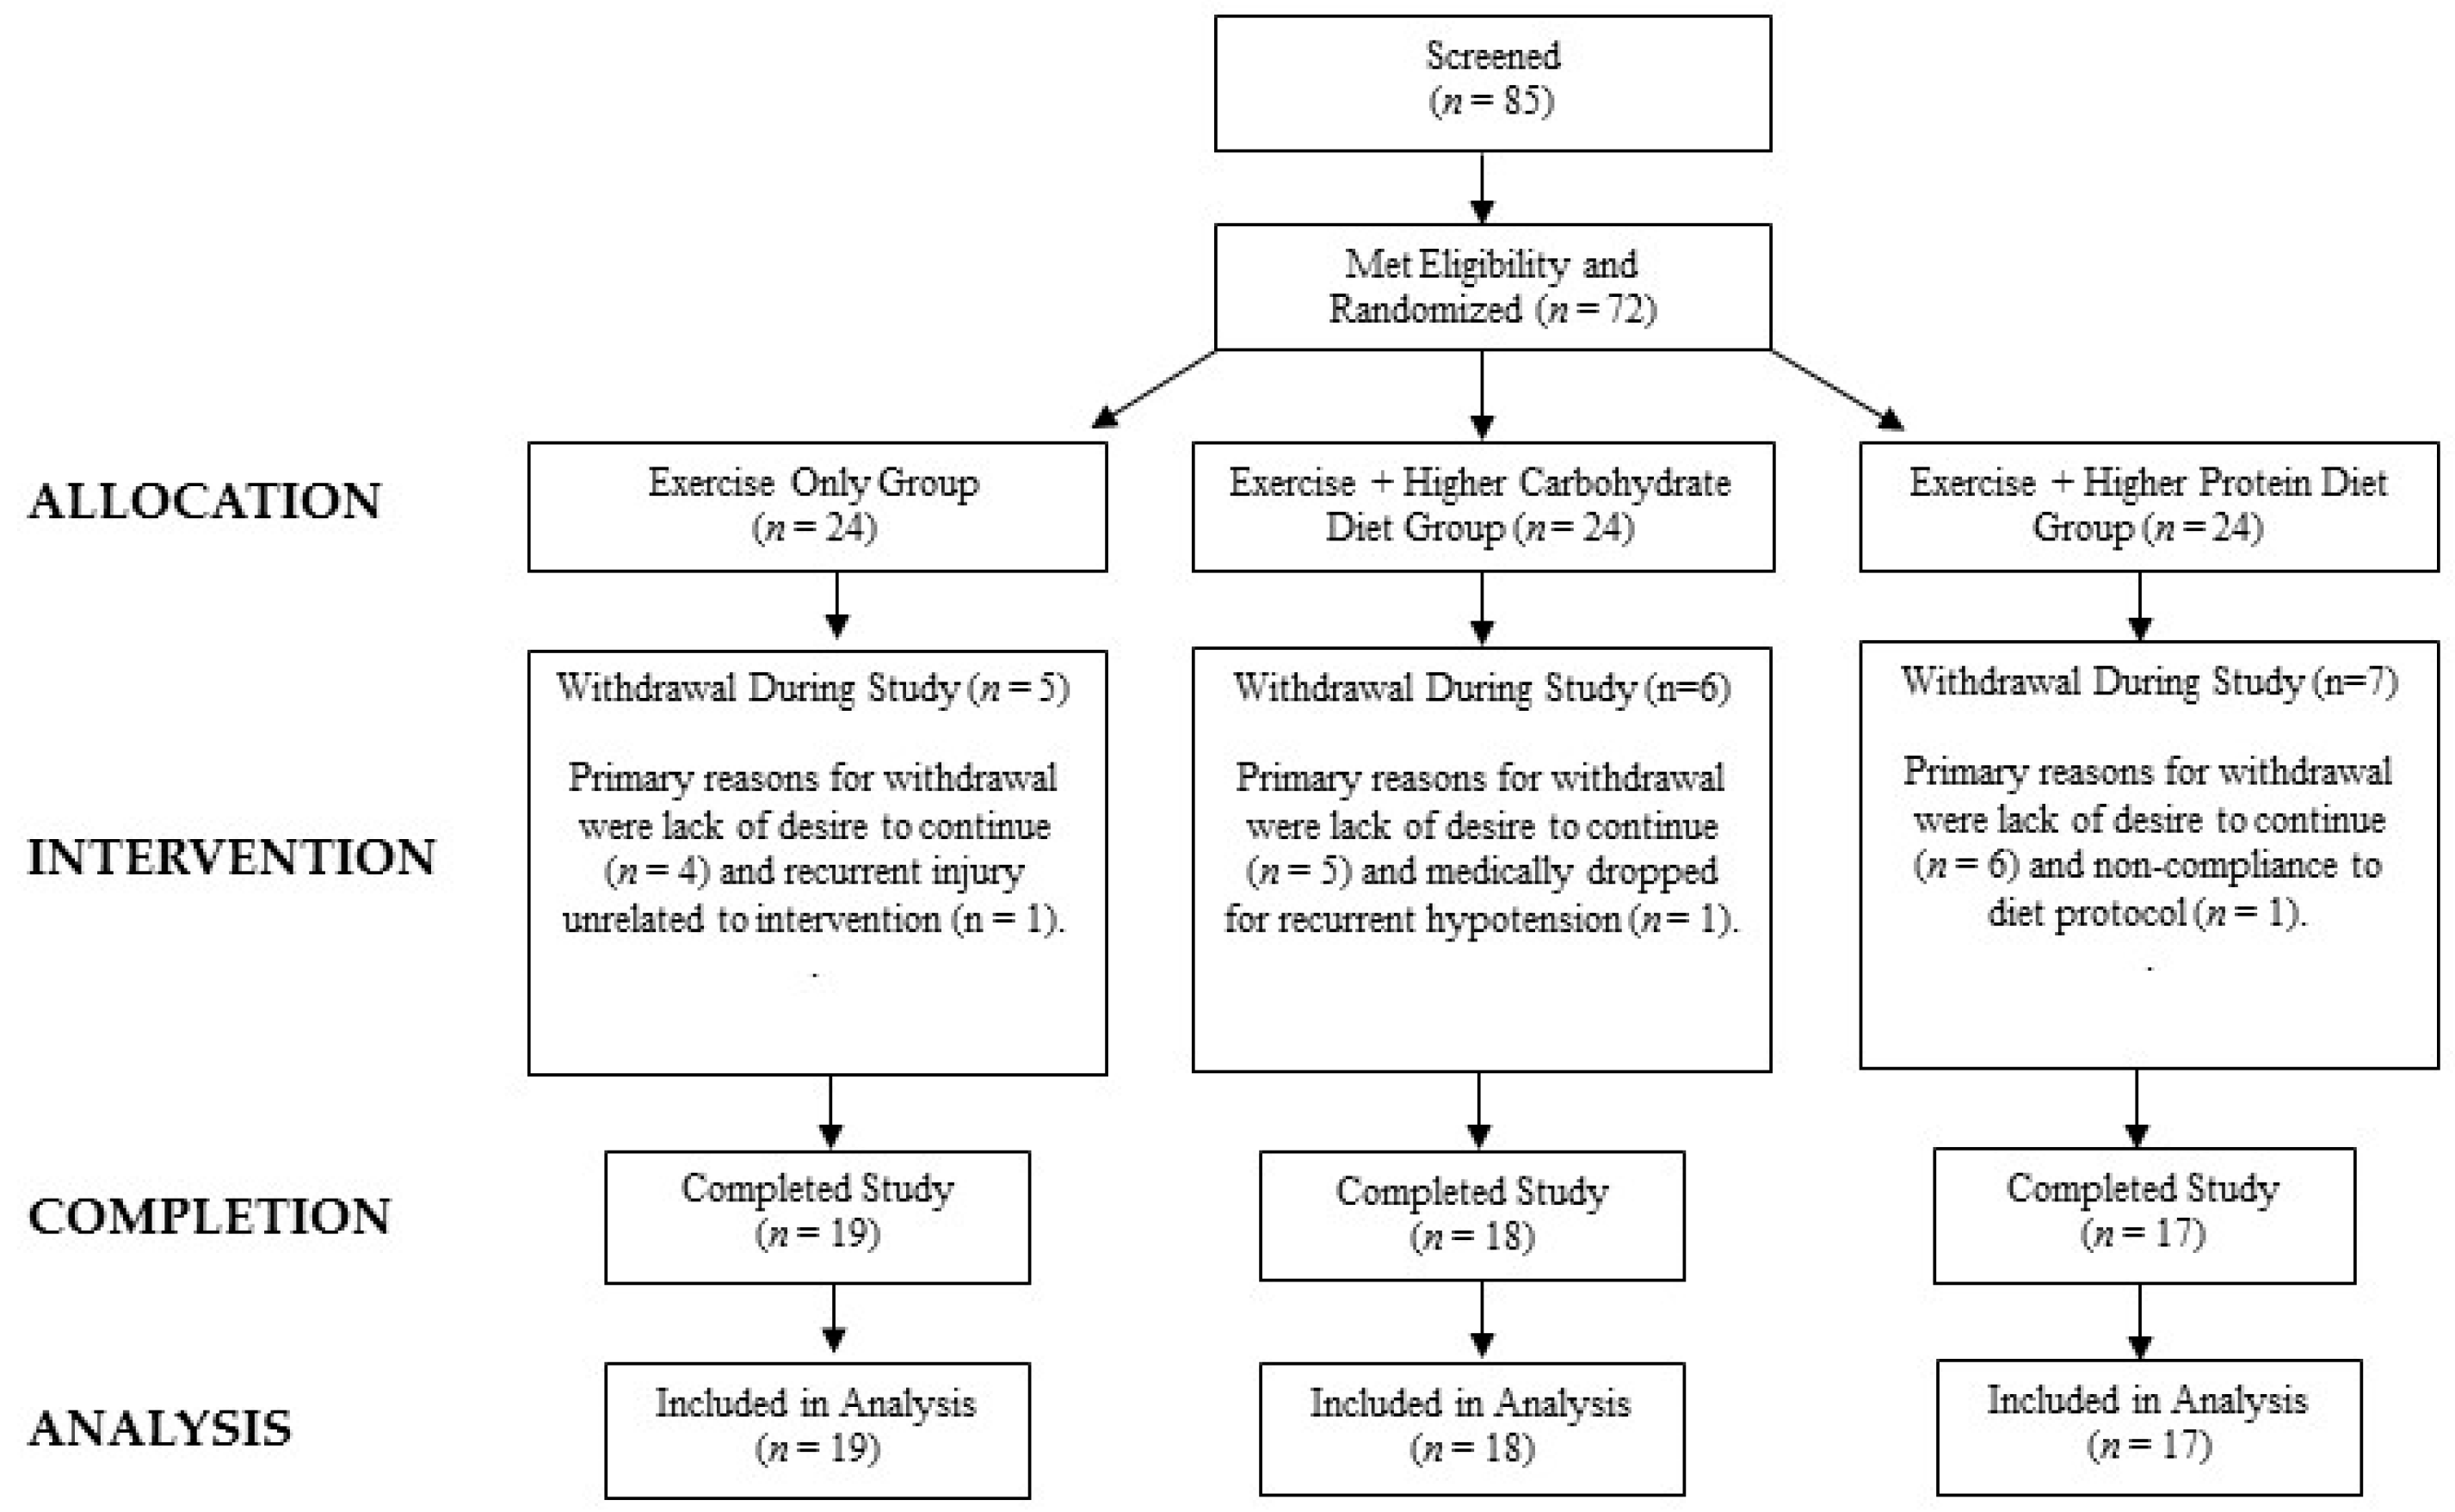
This study was conducted at a university-based research setting as a randomized, parallel, prospective diet and exercise intervention trial. Females between the ages of 60 and 75 years were randomly assigned to one of three experimental groups: no diet intervention + exercise (E); higher carbohydrate diet + exercise (HC); or higher protein diet + exercise (HP). Participants partook in the Curves® (Curves International, Waco, TX, USA) fitness and/or weight management program for 14 weeks. Those assigned to the diet interventions were assigned similar hypo-energetic diets comprised of higher carbohydrate or higher protein macronutrient distributions. Primary outcome variables included body weight, body composition (i.e., fat mass, fat free mass, percent body fat), and resting energy expenditure. Secondary outcome variables included resting hemodynamics, aerobic capacity, muscular strength, muscular endurance, functional capacity and balance, metabolic and appetite-related hormones, and clinical blood panels.

2.2. Participants

This research protocol was approved by a university internal review board for the protection of human participants prior to initiation. Participants were recruited from local newspapers, radio advertisements, flyers, and the Internet. Participants meeting eligibility criteria attended a familiarization session. Entrance criteria stipulated recruitment of sedentary females between the ages of 60–75 years with a body mass index (BMI) greater than 27 kg/m2 and/or body fat percentage above 35% and no recent participation in a diet or exercise program or weight loss within the previous six months. Participants obtained medical clearance from their family physician prior to participating in baseline assessments. Exclusion criteria included: (1) presence of uncontrolled metabolic disorders including known electrolyte abnormalities, heart disease, arrhythmias, diabetes, or thyroid disease; (2) history of hypertension or hepatorenal, musculoskeletal, autoimmune, or neurological diseases; (3) current prescription of thyroid, hyperlipidemic, hypoglycemic, anti-hypertensive, or androgenic medications; or (4) consumption of ergogenic levels of nutritional supplements that may affect muscle mass (e.g., creatine, β-Hydroxy β-methylbutyric acid, anabolic/catabolic hormone levels (e.g., dehydroepiandrosterone), or weight loss (e.g., thermogenics) within the three months prior to the start of the study.
Figure 1 presents a consolidated standards of reporting trials (CONSORT) diagram. A total of 72 women met the entrance criteria, completed baseline testing, and began the exercise and/or diet program intervention. Fifteen participants withdrew during the first month citing a lack of desire to continue. One participant had recurrent musculoskeletal complaints unrelated to the intervention and was dropped during the second month. One participant was dropped for medical reasons during the last week of the study due to recurrent symptoms of hypotension n, and one participant was dropped due to failure to comply with dietary instructions and/or training compliance. Therefore, a total of 54 volunteers completed the 14-week intervention and were included in the analysis. This included 17 participants in the higher protein (HP) group, 18 participants the higher carbohydrate group (HC), and 19 participants in the exercise-only (E) group.

2.3. Testing Sequence

Figure 2 provides an overview of the experimental design. Participants attended a detailed familiarization session prior to baseline testing. Body composition and clinical assessments were obtained at 0, 10, and 14 weeks. Dietary records (three weekdays and one weekend day) were obtained prior to each testing session. Participants were asked to refrain from vigorous physical activity, alcohol intake, and ingestion of over the counter medications for 24 h prior to testing. In addition, participants fasted for 12 h prior to reporting to the laboratory. All testing was conducted in the early morning hours to control for diurnal variations in hormone levels. The following measures were obtained at each testing session: weight; total body water determined by bioelectrical impedance (BIA); body composition determined by dual energy X-ray absorptiometry (DEXA); hip and waist measurements; resting energy expenditure (REE); resting blood pressure measurement; fasting whole blood and serum samples; balance tests that included the Sensory Organization Test (SOT), Limits of Stability (LOS), Step Up and Over (SUO), and Sit to Stand (STS) assessments; 1 repetition maximum (1RM) lifts on the bench press and leg press; upper and lower body muscular endurance (maximum repetitions performed at 80% of 1RM); a 6-min walk test; and a maximal cardiopulmonary exercise stress test. Participants also completed a medical safety and side effect report that was analyzed by the lab research nurse weekly.

2.4. Diet Intervention

Participants were assigned to one of the following three groups: (1) a no diet + exercise only (E); (2) a higher carbohydrate diet + exercise (HC); or (3) a higher protein diet + exercise (HP). Participants assigned to the no diet + exercise only control group participated in training sessions while maintaining their normal dietary habits. Participants assigned to the weight loss diet interventions followed Curves weight loss program. They were isocaloric and macronutrient content followed methods previously described [29,30,31,32,33,34,35]. In both dietary interventions, participants were assigned diets consisting of 1200 kcal/d for 1 week (Phase I) followed by 1600 kcal/d for 9-weeks (Phase II) over the course of a 10-week active weight loss period. The HC diet followed a traditional higher carbohydrate/low fat diet (i.e., 55% carbohydrate, 15% protein, and 30% fat). The HP diet offered higher protein food options with a goal of increasing dietary protein to approximately 1.2 g/kg/d and reducing carbohydrate intake while maintaining 30% of calories from fat. The final 4 weeks (Phase III) served as a weight maintenance period in which participants in both diet groups were given traditional higher carbohydrate diets with a goal of ingesting about 2100 kcal/d. Participants were instructed to monitor their body weight daily and to follow their assigned 1200 kcal/d diet for 2 d if they gained 3 lbs. of weight. Participants were given dietary plans and meal menus to follow at the start of the study. Participants met with a registered dietitian and/or exercise physiologist every two weeks and during each testing session to discuss diet and exercise compliance. Previous research in our lab has demonstrated that this diet intervention generally increases protein intake to 30% to 40% while maintaining fat intake between 25% and 30% [30,31,32,33,35]

2.5. Training Protocol

Participants performed the 30-min Curves circuit exercise program (Curves International, Waco, TX, USA) three days per week over the course of the 14-week study. The circuit included 13 bi-directional hydraulic concentric-only resistance exercise machines which worked all major muscle groups (i.e., elbow flexion/extension, knee flexion/extension, shoulder press/latissimus dorsi pull, hip abductor/adductor, chest press/seated row, horizontal leg press, squat, abdominal crunch/back extension, chest flies, oblique, shoulder shrug/dip, hip extension, and side bends). During each training session, participants were coached to perform as many repetitions as possible within a 30-s time period on each resistance machine. Between machines, participants performed floor-based aerobic exercises or stepping exercise for 30 s with a goal of maintaining an elevated heart rate. We previously reported that women participating in this type of training elicit an average exercise heart rate of 126 ± 15 bpm (80% of maximal heart rate), an average exercise intensity of 65 ± 10% of peak oxygen uptake, resistance exercise intensities ranging between 61% and 82% of 1RM on the various exercise machines, and expenditure of 314 ± 102 kcal per workout [36,37,38]. Participants completed the entire circuit twice during each workout and then performed stretching exercises. All workouts were supervised by trained fitness instructors who monitored proper exercise technique and maintenance of adequate exercise intensity. Compliance to the exercise program was set a priori at a minimum of 70% compliance (30/42 exercise sessions).

3. Procedures

3.1. Dietary Assessment

Participants were provided a detailed description of how to measure and record food and beverage intake by a registered dietitian prior to the start of the study. Participants recorded all food and energy containing fluids consumed for 4 day (including one weekend day) prior to each testing session. Dietary records were checked for accuracy prior to submission each testing session and analyzed by a registered dietitian using dietary analysis software (ESHA Food Processor Version 8.6, Salem, OR, USA).

3.2. Resting Energy Expenditure and Metabolism

Resting energy expenditure (REE) was assessed using a Parvo Medics TrueMax 2400 Metabolic Measurement System (ParvoMedics, Inc., Sandy, UT, USA). This test was performed in a fasted state with the participants lying supine on an exam table. A clear, hard plastic hood and a soft, clear plastic drape were placed over the participants’ neck and head in order to determine resting oxygen uptake and energy expenditure. All participants remained motionless without falling asleep for approximately 20 min. Data were recorded after the first ten minutes of testing during a five-minute period of time in which criterion variables (e.g., VO2 L/min) changed less than 5% [39] Test–retest measurements on 14 participants from a study previously reported [30] revealed that test–retest correlations (r) of collected VO2 in L/min ranged from 0.315 to 0.901 (mean 0.638) and the coefficient of variation ranged from 8.2 to 12.0% (mean: 9.9%) with a mean intra-class coefficient of 0.942, p < 0.001.

3.3. Anthropometric Measures and Body Composition

Height and body weight were measured according to standard procedures using a calibrated electronic scale (Cardinal Detecto Scale Model 8430, Webb City, MO, USA), with a precision of +/−0.02 kg. Waist and hip circumference was measured using a Golnick tensiometer using standard criteria [40]. Total body water was estimated using a Xitron 4200 Bioelectrical Impedance Analyzer (Xitron Technologies, Inc., San Diego, CA, USA) in order to monitor hydration status. Body composition and bone density (excluding the cranium) were evaluated using calibrated Hologic Discovery W (Hologic Inc., Waltham, MA, USA) dual energy X-ray absorptiometry (DEXA) equipped with APEX Software (APEX Corporation Software, Pittsburg, PA, USA). Test–retest reliability studies performed with this DEXA machine have previously yielded mean coefficients of variation for total bone mineral content and total fat free/soft tissue mass of 0.31–0.45% with a mean intra-class correlation of 0.985 [41].

3.4. Exercise and Functional Capacity

Resting heart rate was determined by palpation of the radial artery using standard procedures [40]. Blood pressure was assessed by auscultation of the brachial artery using an aneroid sphygmomanometer using standard clinical procedures [40]. Resting heart rate and blood pressure measurements were taken on the participant in the supine position after resting for 5 min. Participants were attached to a Quinton 710 ECG (Quinton Instruments, Bothell, WA, USA) and walked on a Trackmaster TMX425C treadmill (JAS Fitness Systems, Newton, KS, USA). Expired gases were collected using a Parvo Medics 2400 TrueMax Metabolic Measurement System (ParvoMedics, Inc., Sandy, UT, USA). Participants then performed a standard symptom-limited maximal Bruce treadmill exercise test according to standard procedures [40]. Calibration of gas and flow sensors was completed every morning prior to testing and was found to be within 3% of the previous calibration point.
A 6-min minute walk test (6MWT) was conducted using standardized procedures including a flat surface distance of 100-feet with intervals marked by colored tape on the ground. Participants were told to walk as far as possible for six minutes without running or jogging. Participants were allowed to stop and rest during the test, but were instructed to resume walking as soon as possible. The number of laps and distance were recorded after 6 min. The test–retest reliability for the 6MWT has been reported to range from r = 0.95 to r = 0.97 [42,43].
A standard isotonic Olympic bench press (Nebula Fitness, Versailles, OH, USA) was used for the isotonic bench press testing. A 1RM testing procedure was performed using standard procedures with 2-min recovery between attempts [40]. Following 1RM testing, participants performed maximum number of repetitions at 80% of 1RM on bench press to determine upper body muscular endurance. Participants were then given five minutes of rest and then had their lower body 1RM maximal strength determined using a hip sled/leg press (Nebula Fitness, Versailles, OH, USA) and standard testing procedures with 2-min rest recovery between attempts [40]. Participants then performed maximum number of repetitions at 80% of hip sled/leg press 1RM to assess lower body muscular endurance. Test to test reliability of performing these strength tests in our lab has yielded low mean coefficients of variation (CV) and high reliability for the bench press (CV: 1.9%, intra-class r = 0.94) and hip sled/leg press (CV: 0.7%, intra-class r = 0.91).
Measurements of balance and functional capacity were obtained using the Neurocom SmartEquitest® (Neurocom International, Portland, OR, USA). Data were collected on postural balance and mobility utilizing the Sensory Organization Test (SOT), Limits of Stability (LOS), Step Up and Over (SUO), and Sit to Stand (STS) tests following standardized procedures [44]. Test-to-test reliability of performing these tests in women aged 65–75 has been reported to be r = 0.92 [45].

3.5. Blood Collection and Analysis

Fasted whole blood and serum samples were collected using standard phlebotomy techniques. Whole blood samples were analyzed for complete blood counts with percent differentials using an Abbott Cell Dyn 3500 (Abbott Laboratories, Abbott Park, IL, USA) automated hematology analyzer. Serum samples were analyzed for a complete metabolic panel using a calibrated Dade Behring Dimension RXL (Siemens AG, Munich, Germany) automated clinical chemistry analyzer. The coefficient of variation (CV) for the tests using this analyzer was similar to previously published data for these tests (range: 1.0 to 9.6%) [46]. Serum insulin, adiponectin, and leptin were determined using commercially available immuno-absorbent assay (ELISA) kits (Diagnostic Systems Laboratories, Webster, TX, USA) in conjunction with a Wallac Victor-1420 microplate reader (Perkin-Elmer Life Sciences, Boston, MA, USA) according to kit specifications. Intra-assay and inter-assay coefficients of variation were 4–7% for insulin, 3–4% for adiponectin, and 2–8% for leptin. The homeostasis model assessment for estimating insulin resistance (HOMAIR) was calculated as the product of fasting glucose multiplied by fasting insulin expressed in conventional units divided by 405 [47].

3.6. Statistical Analysis

Data were analyzed using IBM® SPSS® version 25 Statistics for Windows (IBM Corp., Armonk, NY, USA). Baseline variables were analyzed using one-way analysis of variance (ANOVA). Related variables were analyzed using univariate, multivariate and repeated measures general linear model (GLM) statistics. The overall multivariate Wilks’ Lamda time and group × time interaction p-levels were reported in tables along with Greenhouse–Geisser univariate tests, time and group × time effects, and between-subject group effects. Delta values (post—pre) as well as percent change from baseline values were calculated on select variables in order to normalize any baseline differences among groups and analyzed by one-way ANOVA with least significant difference (LSD) post-hoc analyses. Delta data are presented as mean changes from baseline with 95% confidence intervals (CIs). Mean changes with 95% CIs completely above or below baseline are considered significantly different [48]. Previous research in our lab demonstrated that an n-size of 20 per group was sufficiently powered to detect significant differences among diet groups in primary outcome variables [29,30,31,32,33,35] Data were considered significant when the probability of type I error was 0.05 or less and statistical trends toward significance if the p-level ranged between 0.05 and 0.10. If a significant interaction alpha level was observed, least significant difference (LSD) post-hoc analyses was performed to determine where significance was obtained. All data are represented as means ± standard deviations (SD) unless otherwise noted.

4. Results

4.1. Participant Demographics

Table 1 presents participant demographics. One-way ANOVA revealed that there were no statistically significant differences among groups at baseline for descriptive characteristics. Participants were aged 65.9 ± 4.6 years (range 60–75), 161 ± 5 cm tall, weighed 78.6 ± 10.6 kg with 43.5 ± 3.6% body fat, and had a body mass index of 30.5 ± 4.1 kg/m2.

4.2. Energy and Macronutrient Intake

Table 2 presents energy and macronutrient intake observed among groups throughout the study. Significant overall multivariate interaction effects (p < 0.001) were observed among energy intake and macronutrient intake expressed in absolute and relative terms. Univariate analysis of energy intake absolute values revealed that energy intake averaged 1482 ± 41 kcal/d (mean ± standard error of mean (SEM)) during the study with no significant interaction effects observed among groups. However, participants in the HP group ingested significantly more protein (p = 0.002) and less carbohydrate (p = 0.017) during the active weight loss portion of the diet (Phase II) compared to those in the HC and E groups. A similar pattern was observed when expressing energy and macronutrient intake relative to body weight. In this regard, adherence to the HP diet resulted in a 54% increase in relative protein intake (0.83 ± 0.16 to 1.28 ± 0.54 g/kg/d) and a 23% decrease in relative carbohydrate intake (2.50 ± 0.50 to 1.92 ± 0.56 g/kg/d) during the active weight loss phase. No significant interaction effects were observed among groups in dietary fat intake. Participants did a fairly good job meeting energy intake goals during Phase II of the diet (i.e., 1600 kcal/d). However, similar to our previous reports [29,30,31,32,33,34,35], participants were less successful increasing energy intake during the weight maintenance (Phase III) portion of the diet (i.e., 2100 kcal/d).

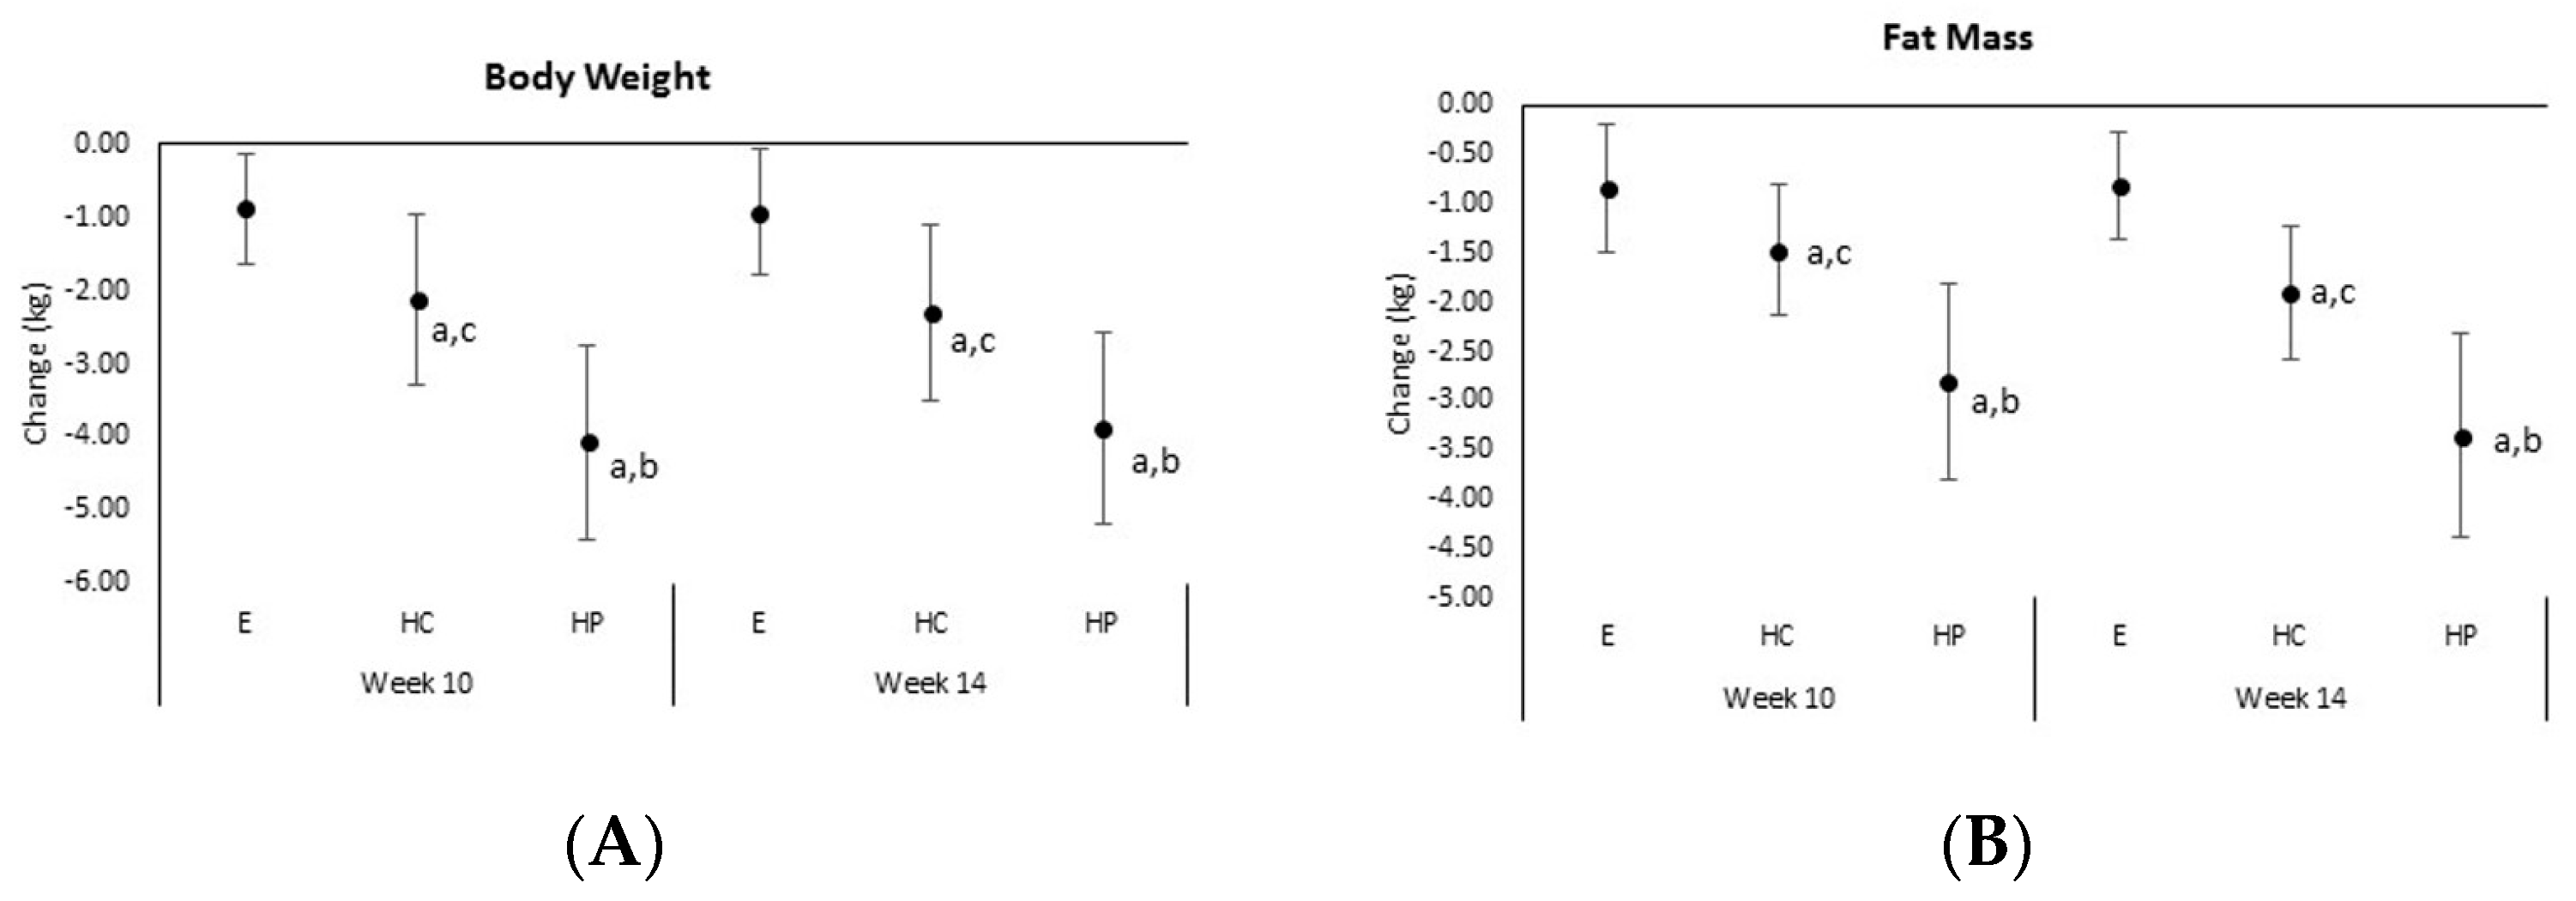
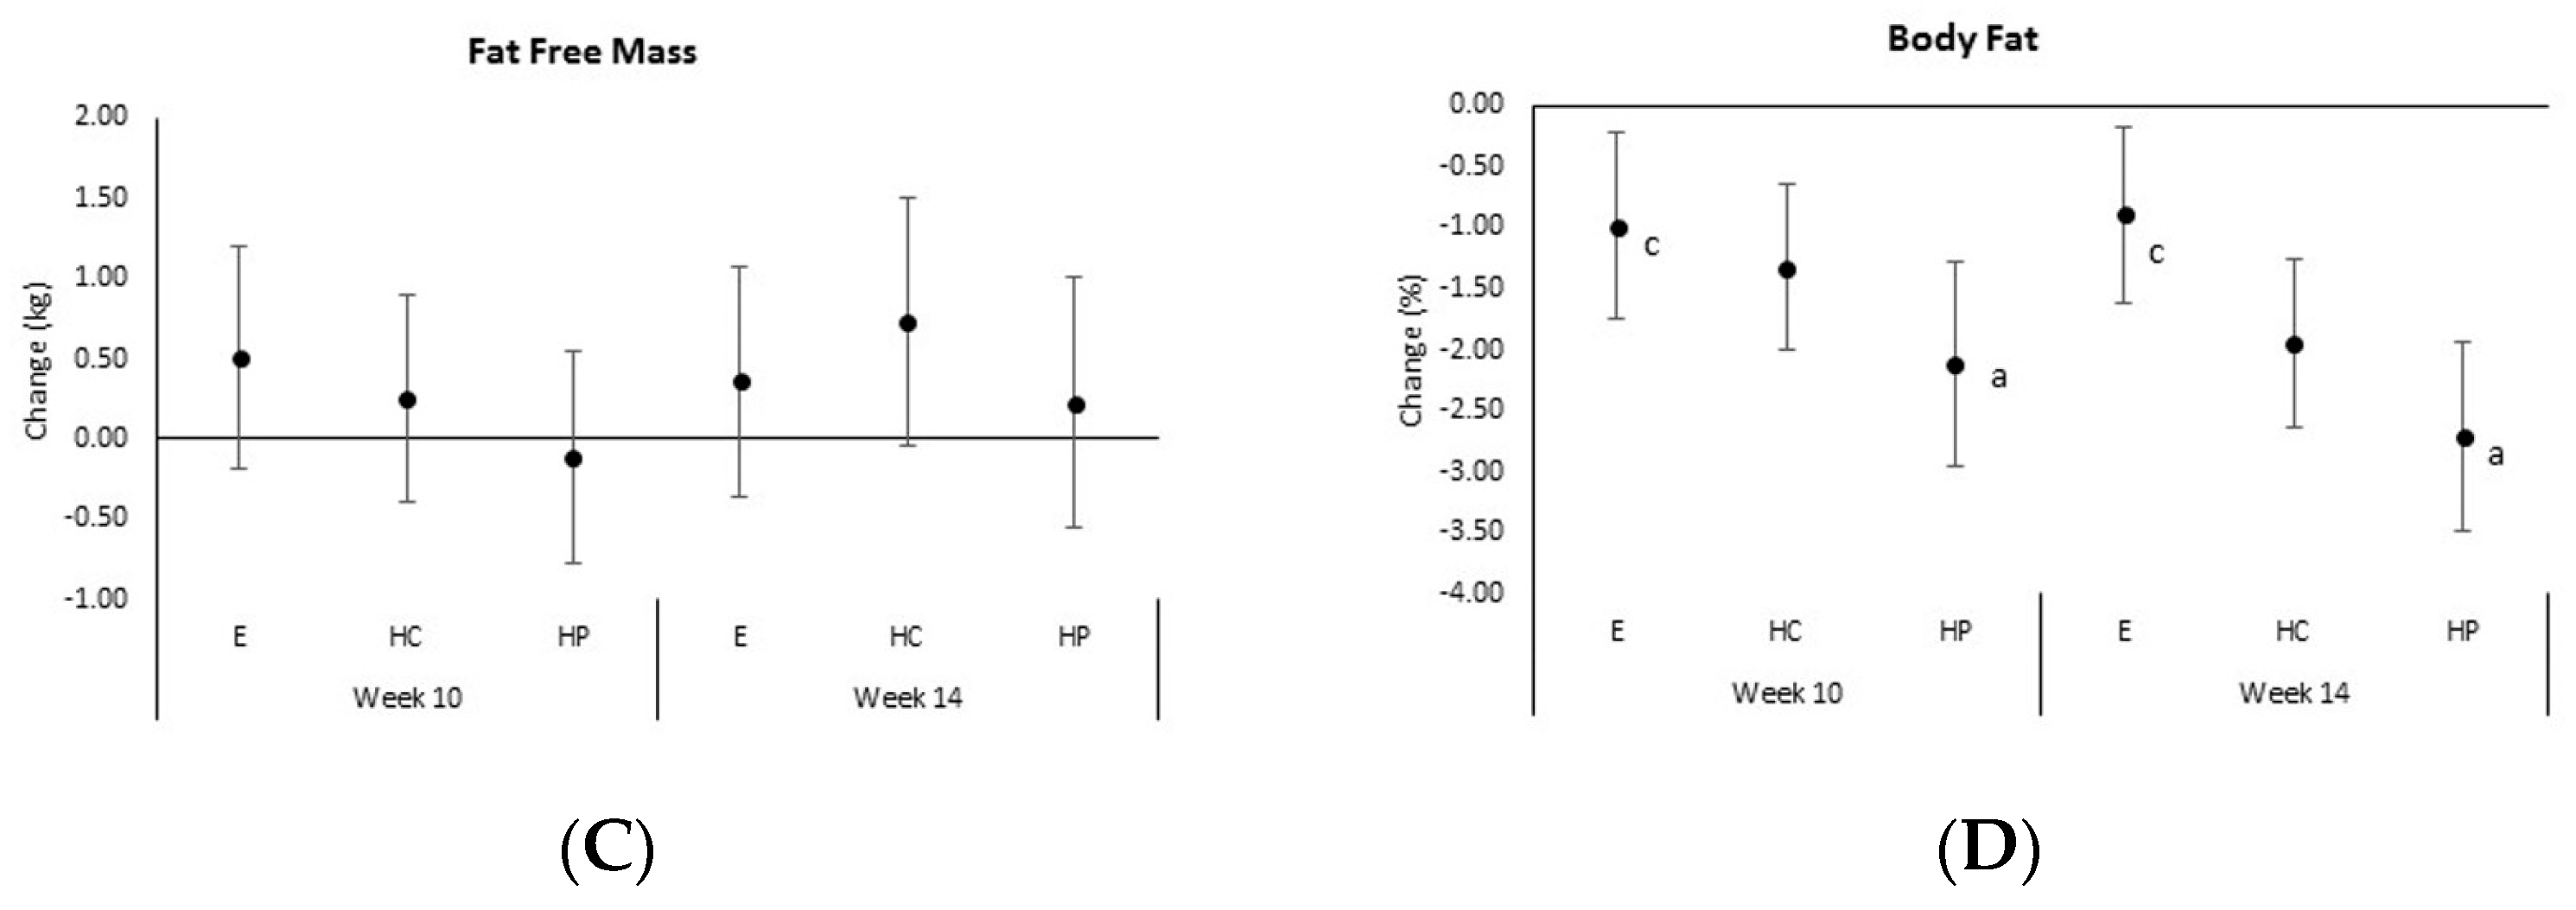
4.3. Anthropometrics, Body Composition, and Resting Energy Expenditure

Table 3 presents body composition, anthropometric, and resting energy expenditure data observed among groups during the study. A significant overall multivariate interaction effect (p < 0.001) was observed for body composition variables. Univariate analysis revealed significant interaction effects (p < 0.005) were observed among groups in body weight, fat mass, and percent body fat. Analysis of mean changes from baseline with 95% CI (Figure 3) indicated that participants in the HP group lost significantly more weight (E −0.87 ± 1.56, CI −1.63, −0.12; HC –2.12 ± 2.36, CI −3.30, −0.95; HP −4.07 ± 2.59, CI −5.4, −2.7 kg, p < 0.001) and fat mass (E −0.82 ± 1.12, CI −1.36, −0.28; HC −1.90 ± 1.38 CI −2.59, −1.21; HP −3.35 ± 2.02, CI −4.39, −2.3; kg, p < 0.001) while changes in body fat percentage were greater in the HP compared to E groups (E −0.89 ± 1.49, CI −1.61, −0.18; HC −1.94 ± 1.39, CI −2.64, −1.25; HP −2.71 ± 1.51, CI −3.49, −1.93%, p = 0.002). In percentage terms, participants in the HP group experienced a more clinically impactful reduction in fat mass loss (E −2.7 ± 3.8, CI −4.6, −0.9; HC −5.9 ± 4.2, CI −8.0, −3.9; HP −10.2 ± 5.8, CI −13.1, −7.2%, p = 0.003) and percent body fat (E −2.0 ± 3.5, CI −3.7, −0.3; HC −4.3 ± 3.2, CI −5.9, −2.7; HP −6.3 ± 3.5, CI −8.1, −4.5%, p = 0.002) than those in the HC and E groups. Fat-free mass increased over time in all groups with no significant differences observed among groups (E 0.36 ± 1.49, CI −0.36, 1.07; HC 0.73 ± 1.55, CI −0.04, 1.49; HP 0.22 ± 1.51, CI −0.56, 1.00 kg, p = 0.596). An overall significant interaction was also observed among anthropometric measurements (p = 0.017) with waist and hip circumferences significantly decreasing from baseline. Analysis of mean changes with 95% CIs revealed that greater changes were observed in the HP group in waist circumference (E −0.90 ± 1.83, CI −1.78, −0.02; HC −1.55 ± 2.94, CI −3.01, −0.09; HP −3.62 ± 3.57, CI −5.46, −1.78 cm, p = 0.017) while changes in hip circumference tended to differ among groups (E −1.60 ± 2.42, CI −2.77, −0.43; HC −1.98 ± 349, CI −3.71, −0.24; HP −3.88 ± 2.86, CI −5.35, −2.42 cm, p = 0.057). When expressed as percent changes from baseline, participants in the HP group experienced significantly greater changes in waist circumference (E −1.0 ± 2.1, CI −2.0, 0.02; HC −1.6 ± 3.3, CI −0.3, 0.03; HP −3.9 ± 3.7, CI −5.8, −2.0%, p = 0.019). Resting energy expenditure did not significantly decrease over time in response to the diet and exercise intervention or differ among groups.

4.4. Hematological Markers

Table 4 presents fasting glucose homeostasis, appetite hormones, and lipid-related variables. Significant time effects (p < 0.001) were observed among glucose homeostasis variables with insulin and insulin sensitivity improving among all groups over time. However, no significant interactions were observed among groups. Mean change and 95% CI analysis revealed that fasting glucose decreased to a greater degree (p < 0.031) in the HP compared to the HC group (E −1.89 ± 10, CI −6.88, 3.10; HC 5.13 ± 16, CI –3.02, 13.3; HP −5.93 ± 17, CI −14.6, 2.8%, p = 0.089). Significant overall time (p < 0.001) and group × time (p < 0.001) effects were seen in appetite-related hormones. Specifically, post hoc analysis revealed that participants in the HP group experienced a significantly greater increase in adiponectin (E 43.1 ± 76, CI 6.34, 79.8; HC −27.8 ± 33, CI –44.5, −11.3; HP 52.4 ± 79, CI 11.9, 92.8%, p = 0.001) than the HC group and the HP group observed a greater reduction in leptin (E −1.80 ± 34, CI −18.1, 14.5; HC 43.8 ± 60, CI 16.5, 71.2; HP −26.5 ± 70, CI −62.6, 9.6%, p = 0.001) than the HC and E groups. In percentage terms, greater changes were seen in the HP group in adiponectin (E 43.1 ± 76.2, CI 6.3, 79.8; HC −27.9 ± 33.3, CI −44.4, −11.3; HP 52.4 ± 78.6, CI −11.9, 92.8%, p = 0.001) and leptin levels (E −1.80 ± 33.8, CI −18.1, 14.5; HC 43.8 ± 55.0, CI 16.5, 71.1; HP −26.5 ± 70.3, CI −62.6, 9.6%, p = 0.001). Finally, no significant overall time effects were seen in lipid-related variables (p = 0.124) while these variables tended to interact (p = 0.056). Univariate analysis revealed significant interactions in triglycerides among groups where values in the HC and E groups increased from baseline after 10 weeks, while remaining consistent in the HP group. Table S1 presents serum liver and muscle enzyme related panels. Overall multivariate time (p < 0.001) and interaction (p < 0.001) effects were observed in clinical markers of liver function. Univariate analysis revealed some variable changes over time and among groups in alanine amino transferase (ALT) and total bilirubin (TBIL) responses, but these values remained well-within normal limits and were generally lower than baseline values. No overall time (p = 0.274), or interaction effects (p = 0.122) were observed among serum protein and enzyme levels. Table S2 presents whole blood complete cell count data while Table S3 presents lymphocyte percent differentials. Although overall time effects were seen (p < 0.001) in whole blood white and red cell blood count analysis, no significant interactions were observed (p = 0.342). Moreover, changes, if any, were small and well within clinical norms for older individuals. No significant multivariate time (p = 0.394) or group × time (0.664) effects or univariate effects were seen in percentage of lymphocytes.

4.5. Exercise and Functional Capacity

Table 5 depicts health and fitness-related variables. Multivariate analysis revealed that exercise training improved resting hemodynamics over time (p = 0.047) with no significant interaction effects (p = 0.662). Univariate analysis demonstrated that resting heart rate tended to decrease over time (p = 0.074) while resting diastolic blood pressure was significantly reduced from baseline over time (p = 0.032) with no significant interactions observed among groups in resting heart rate (p = 0.455), systolic blood pressure (p = 0.814), or diastolic blood pressure (p = 0.39) responses. Significant time effects (p < 0.001) were seen in peak aerobic capacity and 6-min walk test distance with no significant differences observed among groups. The improved distance observed in 6-min walk test performance (34.5 ± 39 m) exceeded the minimal clinically important differences reported in the literature of 14 m to 20 m [49,50] but were slightly below the substantial meaningful difference of 50 m [50]. Upper and lower 1RM strength and bench press muscular endurance were significantly increased in all groups over time with no differences observed among groups. Tables S4 and S5 present balance and functional stability test results, respectively. Composite scores on the sensory organization and the limits of stability test significantly improved over time in all groups. Additionally, there was evidence that lift up index movement time, rising index, and left to right weight symmetry improved with training in all groups. However, no significant interactions among groups were observed.

5. Discussion and Conclusions

Aging is associated with an increase in adiposity in sedentary individuals that increases the prevalence of obesity and/or severity of comorbidities associated with obesity such as insulin resistance and diabetes [1]. Sedentary lifestyle is also associated with loss of muscle mass and strength which increases risk to falls and bone fracture as one ages, particularly in osteoporotic women [7,18,21]. Therefore, identifying strategies that can help overweight and/or obese older adults promote weight and fat loss while maintaining muscle mass and strength may help reduce risk to obesity, age-related comorbidities, and/or injuries. We have previously reported that adherence to a circuit-style resistance exercise program and a higher protein low fat diet promoted greater weight and fat loss while maintaining muscle mass and preserving resting energy expenditure to a greater degree in comparison to following a traditional higher carbohydrate low fat diet in women under the age of 55 [29,30,31,32,33,34,35]. Moreover, this program promoted gains in aerobic capacity, muscular strength and endurance, and improved markers of health and metabolic syndrome [29,30,31,32,33,34,35]. We hypothesized that incorporating resistance exercise while maintaining a higher protein hypo-energetic diet may promote more favorable changes in body composition in older individuals attempting to lose weight and fat mass compared to adherence to a higher carbohydrate diet and/or exercise alone. Results of this study indicate that this exercise and diet approach may be an effective way for older sedentary and overweight women to achieve meaningful weight loss and improve markers of health and functional capacity.

5.1. Weight Loss

Obesity is a significant health issue particularly as one ages [1]. However, diets that are too energy-restrictive promote weight loss at the expense of loss in muscle mass and/or reductions in resting energy expenditure [1,49]. Given concerns over sarcopenia and loss of strength as one ages, use of traditional energy deficit diet interventions may therefore exacerbate these conditions. Resistance exercise and increasing dietary protein have been recommended as a means of maintaining muscle mass and strength as one ages [17,25,27,50]. The reason for this is that resistance exercise stimulates muscle protein synthesis which can help increase and/or maintain muscle mass [51]. Additionally, digestion of dietary protein is less efficient as one ages, thereby increasing dietary protein needs [28]. There is also evidence that higher protein diets promote satiety, influence appetite hormones, and associated with a greater energy expenditure due to an increased thermic of digesting and oxidizing proteins, and improve glucose homeostasis [52].
Results from the present study indicate that adherence to a resistance-based exercise program promoted modest improvements in weight loss and fat loss while maintaining fat free mass and resting energy expenditure. Thus, encouraging older individuals to incorporate resistance exercise into their exercise program can help maintain muscle mass. Further, participants consuming a hypo-energetic diet that contained a higher amount of dietary protein experienced greater loss of weight and fat mass than those ingesting a standard higher carbohydrate and low fat diet. In percentage terms, participants in the HP group experienced a more clinically impactful reduction in fat mass loss and percent body fat than those in the HC and E groups. Moreover, fat-free mass increased in all groups and REE was well-maintained. Thus, this program promoted effective weight loss (i.e., fat loss) without a loss of fat free mass or resting energy expenditure that is often associated with dieting. It should be noted that the diet intervention used only increased daily protein intake from 0.83±0.16 to 1.28 ± 0.54 g/kg/d. Therefore, although we called this a higher protein diet, this only represented a modest increase in dietary protein intake above the Recommended Daily Allowance in the United States (i.e., 0.8 g/kg/d) and within recommendations for older adults (i.e., 1–1.3 g/kg/d) [27,49] as well as active individuals who engage in resistance training [53,54]. It is also interesting to note that fat-free mass and resting energy expenditure were maintained in the HC, suggesting that the participants ingested enough protein in their diet, in combination with the resistance exercise, to prevent the typical decline in energy expenditure and muscle mass associated with weight loss.
The present study findings are also consistent with our prior reports that adherence to the circuit-style resistance exercise program and higher protein diet promotes greater fat loss while maintaining muscle mass and resting energy expenditure in women under the age of 55 [29,30,31,32,33,34,35]. Similarly, but without exercise, energy restricted high protein diet (35%) compared to an energy-restricted diet with lower protein (20%) resulted in greater fat loss and improvements in cardio-metabolic profile variables in overweight and obese women (44 ± 9 years) [55]. These observations of improved body composition have also been noted in older men (65 ± 5 years) increasing their dietary protein intake from 97 ± 79 to 164 ± 89 g/d (1.26 to 2.12 g/kg/d) without caloric restriction compared to controls [20]. Finally, a report from Lee and colleagues [56] showed that adherence to a higher protein/low fat hypo-energetic diet (32% protein, 12% fat) was more efficacious in promoting fat loss than adherence to a lower protein hypo-energetic diet (22% protein, 12% fat) in overweight men and women.

5.2. Markers of Health

Results of the present study indicated that participation in this exercise and diet intervention promoted general improvements in a number of markers of health. For example, significant time effects were seen in waist circumference (2.1 ± 3.3%), hip circumference (−2.2 ± 2.7%), resting heart rate (−2.5 ± 15%), resting diastolic blood pressure (−3.4 ± 15%), fasting insulin (93.7 ± 140%), HOMAIR (91.8 ± 137%), and adiponectin (22.3 ± 74.1%) levels. Participants in the HP group experienced significantly greater changes in waist circumference, blood glucose, adiponectin, and leptin levels. Moreover, no clinically significant changes were seen in clinical blood profiles. These findings are consistent with our prior reports in younger women [29,30,31,32,33,34,35]. Additionally, they are consistent with reports indicating that exercise and/or diet-induced weight loss improves markers of health [20,29,30,31,32,33,34,35,45,55], insulin sensitivity [4,20,29,31,32,35,55,57,58,59,60,61,62], and can positively affect appetite hormone regulation [30,31,32,35,57,58,63,64]. Moreover, these findings are consistent with reports that replacing some dietary carbohydrate with protein in the diet may promote greater benefits for weight loss, body composition, blood lipids, and/or blood glucose management. Results also support contentions that this exercise and diet intervention is well-tolerated in healthy older women.

5.3. Functional Capacity

One of the goals of encouraging older individuals to exercise is to maintain cardiovascular and musculoskeletal health in order to reduce risk to chronic disease, falls, and injury [20,21,22,24]. Results of the present study indicate that this exercise program was effective in improving markers of fitness, strength, and functional capacity. In this regard, participants experienced a 10.8 ± 23.9% improvement in peak aerobic capacity, a 7.2 ± 8.9% increase in distance completed during a 6-min walk test, a 22.5 ± 26.7% increase in upper extremity maximal strength, a 39.9 ± 75.6% increase in upper extremity muscular endurance, a 33.6 ± 37.2% increase in low extremity maximal strength, and a 27.1 ± 65.9% increase in lower extremity muscular endurance. The improved distance observed in 6-min walk test performance (34.5 ± 39 m) exceeded the minimal clinically important differences reported in the literature of 14 m to 20 m [42,43] but were slightly below the substantial meaningful difference of 50 m [42]. Moreover, significant improvements were observed in several balance-related functional capacity tests. These findings support contentions that older individuals can significantly benefit from participation in a structured exercise program and this could play an important role in reducing risk to falls and injury [19,20,21,22,45,65]. However, increasing the proportion of dietary protein during the diet phase did not promote greater improvement in fitness, strength, and/or functional capacity than those in the HC or E groups.

5.4. Conclusions

Results from this study indicate that older but otherwise healthy women following a higher protein diet while participating in a circuit-style resistance-exercise program experienced greater loss in body weight, fat mass, percent body fat, and waist circumference than women following a higher carbohydrate weight loss diet. Additionally, weight loss can be achieved in this population without significant reductions in fat-free mass or resting energy expenditure whether exercising alone or following the HC or HP diets. Participants in the HP group also experienced better management of blood glucose and appetite-related hormones, while all participants experienced improvement in a number of health, fitness, and functional capacity related variables. Results support recommendations that older individuals participate in resistance-training [4,19,20,22,50,53,54,66,67] and consume a higher proportion of protein in their diet in order to maintain muscle mass [4,26,27,28,53]. However, future research is needed to confirm results in a larger population of healthy older individuals as well as individuals who have medical conditions in which exercise and/or weight loss may provide benefits. Additionally, it is necessary to continue to investigate the effects of different diet and exercise strategies on markers of health in older individuals in order to identify effective strategies to reduce risk of and/or manage chronic disease and improve quality of life.

Supplementary Materials

The following are available online at https://www.mdpi.com/2072-6643/10/8/1070/s1, Table S1: Serum chemistry: liver and muscle enzyme-related variables, Table S2: Serum chemistry: complete blood counts, Table S3: Serum chemistry: lymphocyte percent differentials, Table S4: Sensory organization and limits of stability test variables, Table S5: Functional balance testing parameters.

Author Contributions

R.B.K. served as Principal Investigator, designed the study, obtained external funding, provided project oversight, directed the research lab, assisted in data analysis, and finalized the manuscript. M.G. (Melyn Galbreath) served as the study coordinator, oversaw all testing and data entry, contributed to statistical analyses, and assisted in writing of the manuscript. B.C., P.L., J.B., J.D., T.H., G.H., J.L.G., L.G., and M.B.C. assisted with data collection and analyses. K.L., E.G. and A.J. assisted with data analysis and manuscript preparation. C.R. served as lab coordinator and provided project oversight. M.G. (Mike Greenwood) assisted in mentoring students and provided input on the manuscript. All authors reviewed and approved this submission.

Acknowledgments

We would like to thank the individuals who participated in this study as well as all of the students and administrative support staff at Baylor University and Texas A&M University that assisted in conducting this study. We would also like thank Kristen Beavers, Thomas Buford, Erika Deike, Erika Knue, Rui Li, Adam Parker, Monica Serra, and Brian Shelmadine for assisting in data collection and/or analysis; Rehka Chandran and Ron Wilson for providing medical supervision for this study; Darryn Willoughby for supervising hematological assays and providing input on results; and Jim Ellor and the late Rafer Lutz for providing input about the study.

Conflicts of Interest

Curves® International (Waco, TX, USA) provided funding for this project through an unrestricted research grant to Baylor University when the Principal Investigator and the Exercise & Sport Nutrition Lab were affiliated with that institution and to Texas A&M University after Kreider and his research team moved to that institution. All researchers involved independently collected, analyzed, and interpreted the results from this study and have no financial interests concerning the outcome of this investigation. Data from this study have been presented at the Federation of American Societies of Experimental Biology annual meeting and were published in abstract form but not submitted for publication prior to being submitted to the Journal of Nutrition and Diabetes Research. Publication of these findings does not constitute endorsement by the investigators or their institutions of the programs or materials investigated.

References

  1. Wilborn, C.; Beckham, J.; Campbell, B.; Harvey, T.; Galbreath, M.; La Bounty, P.; Nassar, E.; Wismann, J.; Kreider, R. Obesity: Prevalence, theories, medical consequences, management, and research directions. J. Int. Soc. Sports Nutr. 2005, 2, 4–31. [Google Scholar] [CrossRef] [PubMed]
  2. Buch, A.; Carmeli, E.; Boker, L.K.; Marcus, Y.; Shefer, G.; Kis, O.; Berner, Y.; Stern, N. Muscle function and fat content in relation to sarcopenia, obesity and frailty of old age—An overview. Exp. Gerontol. 2016, 76, 25–32. [Google Scholar] [CrossRef] [PubMed]
  3. McCullough, P.A.; Fallahzadeh, M.K.; Hegazi, R.M. Nutritional deficiencies and sarcopenia in heart failure: A therapeutic opportunity to reduce hospitalization and death. Rev. Cardiovasc. Med. 2016, 17 (Suppl. 1), S30–S39. [Google Scholar]
  4. Oh, C.; Jeon, B.H.; Reid Storm, S.N.; Jho, S.; No, J.K. The most effective factors to offset sarcopenia and obesity in the older korean: Physical activity, vitamin d, and protein intake. Nutrition 2017, 33, 169–173. [Google Scholar] [CrossRef] [PubMed]
  5. Hamer, M.; O’Donovan, G. Sarcopenic obesity, weight loss, and mortality: The english longitudinal study of ageing. Am. J. Clin. Nutr. 2017, 106, 125–129. [Google Scholar] [CrossRef] [PubMed]
  6. JafariNasabian, P.; Inglis, J.E.; Kelly, O.J.; Ilich, J.Z. Osteosarcopenic obesity in women: Impact, prevalence, and management challenges. Int. J. Womens Health 2017, 9, 33–42. [Google Scholar] [CrossRef] [PubMed]
  7. Perna, S.; Peroni, G.; Faliva, M.A.; Bartolo, A.; Naso, M.; Miccono, A.; Rondanelli, M. Sarcopenia and sarcopenic obesity in comparison: Prevalence, metabolic profile, and key differences. A cross-sectional study in italian hospitalized elderly. Aging Clin. Exp. Res. 2017, 29, 1249–1258. [Google Scholar] [CrossRef] [PubMed]
  8. Lou, N.; Chi, C.H.; Chen, X.D.; Zhou, C.J.; Wang, S.L.; Zhuang, C.L.; Shen, X. Sarcopenia in overweight and obese patients is a predictive factor for postoperative complication in gastric cancer: A prospective study. Eur. J. Surg. Oncol. 2017, 43, 188–195. [Google Scholar] [CrossRef] [PubMed]
  9. Ma, J.; Hwang, S.J.; McMahon, G.M.; Curhan, G.C.; McLean, R.R.; Murabito, J.M.; Fox, C.S. Mid-adulthood cardiometabolic risk factor profiles of sarcopenic obesity. Obesity (Silver Spring) 2016, 24, 526–534. [Google Scholar] [CrossRef] [PubMed] [Green Version]
  10. Poggiogalle, E.; Lubrano, C.; Sergi, G.; Coin, A.; Gnessi, L.; Mariani, S.; Lenzi, A.; Donini, L.M. Sarcopenic obesity and metabolic syndrome in adult caucasian subjects. J. Nutr. Health Aging 2016, 20, 958–963. [Google Scholar] [CrossRef] [PubMed]
  11. Rier, H.N.; Jager, A.; Sleijfer, S.; van Rosmalen, J.; Kock, M.; Levin, M.D. Low muscle attenuation is a prognostic factor for survival in metastatic breast cancer patients treated with first line palliative chemotherapy. Breast 2017, 31, 9–15. [Google Scholar] [CrossRef] [PubMed]
  12. Yadigar, S.; Yavuzer, H.; Yavuzer, S.; Cengiz, M.; Yuruyen, M.; Doventas, A.; Erdincler, D.S. Primary sarcopenia in older people with normal nutrition. J. Nutr. Health Aging 2016, 20, 234–238. [Google Scholar] [CrossRef] [PubMed]
  13. Badley, E.M.; Canizares, M.; Perruccio, A.V.; Hogg-Johnson, S.; Gignac, M.A. Benefits gained, benefits lost: Comparing baby boomers to other generations in a longitudinal cohort study of self-rated health. Milbank Q. 2015, 93, 40–72. [Google Scholar] [CrossRef] [PubMed]
  14. Ginsburg, P.B. High and rising health care costs. Synth. Proj. Res. Synth. Rep. 2008, 16. [Google Scholar]
  15. Whelan, D.M.; Roy, R.C. Diseases of aging that emerge from the metabolic syndrome. Anesthesiol. Clin. 2006, 24, 599–619. [Google Scholar] [CrossRef] [PubMed]
  16. Fakhouri, T.H.; Ogden, C.L.; Carroll, M.D.; Kit, B.K.; Flegal, K.M. Prevalence of obesity among older adults in the united states, 2007–2010. NCHS Data Brief 2012, 106, 1–8. [Google Scholar]
  17. Osteoporosis—Prevention, Diagnosis and Treatment: A Systematic Review. Available online: https://www.ncbi.nlm.nih.gov/pubmed/28876760 (accessed on 11 August 2018).
  18. Baccaro, L.F.; Conde, D.M.; Costa-Paiva, L.; Pinto-Neto, A.M. The epidemiology and management of postmenopausal osteoporosis: A viewpoint from Brazil. Clin. Interv. Aging 2015, 10, 583–591. [Google Scholar] [CrossRef] [PubMed]
  19. Borst, S.E. Interventions for sarcopenia and muscle weakness in older people. Age Ageing 2004, 33, 548–555. [Google Scholar] [CrossRef] [PubMed] [Green Version]
  20. Hunter, G.R.; McCarthy, J.P.; Bamman, M.M. Effects of resistance training on older adults. Sports Med. 2004, 34, 329–348. [Google Scholar] [CrossRef] [PubMed]
  21. Marzetti, E.; Calvani, R.; Tosato, M.; Cesari, M.; Di Bari, M.; Cherubini, A.; Broccatelli, M.; Savera, G.; D’Elia, M.; Pahor, M.; et al. Physical activity and exercise as countermeasures to physical frailty and sarcopenia. Aging Clin. Exp. Res. 2017, 29, 35–42. [Google Scholar] [CrossRef] [PubMed]
  22. Montero-Fernandez, N.; Serra-Rexach, J.A. Role of exercise on sarcopenia in the elderly. Eur. J. Phys. Rehabil. Med. 2013, 49, 131–143. [Google Scholar] [PubMed]
  23. American College of Sports, M.; Chodzko-Zajko, W.J.; Proctor, D.N.; Fiatarone Singh, M.A.; Minson, C.T.; Nigg, C.R.; Salem, G.J.; Skinner, J.S. American college of sports medicine position stand. Exercise and physical activity for older adults. Med. Sci. Sports Exerc. 2009, 41, 1510–1530. [Google Scholar]
  24. De Souto Barreto, P.; Morley, J.E.; Chodzko-Zajko, W.; Pitkala, K.H.; Weening-Djiksterhuis, E.; Rodriguez-Manas, L.; Barbagallo, M.; Rosendahl, E.; Sinclair, A.; Landi, F.; et al. Recommendations on physical activity and exercise for older adults living in long-term care facilities: A taskforce report. J. Am. Med. Dir. Assoc. 2016, 17, 381–392. [Google Scholar] [CrossRef] [PubMed]
  25. Agarwal, E.; Miller, M.; Yaxley, A.; Isenring, E. Malnutrition in the elderly: A narrative review. Maturitas 2013, 76, 296–302. [Google Scholar] [CrossRef] [PubMed]
  26. Boirie, Y.; Morio, B.; Caumon, E.; Cano, N.J. Nutrition and protein energy homeostasis in elderly. Mech. Ageing Dev. 2014, 136–137, 76–84. [Google Scholar] [CrossRef] [PubMed]
  27. Morais, J.A.; Chevalier, S.; Gougeon, R. Protein turnover and requirements in the healthy and frail elderly. J. Nutr. Health Aging 2006, 10, 272–283. [Google Scholar] [PubMed]
  28. Nowson, C.; O’Connell, S. Protein requirements and recommendations for older people: A review. Nutrients 2015, 7, 6874–6899. [Google Scholar] [CrossRef] [PubMed]
  29. Baetge, C.; Earnest, C.P.; Lockard, B.; Coletta, A.M.; Galvan, E.; Rasmussen, C.; Levers, K.; Simbo, S.Y.; Jung, Y.P.; Koozehchian, M.; et al. Efficacy of a randomized trial examining commercial weight loss programs and exercise on metabolic syndrome in overweight and obese women. Appl. Physiol. Nutr. Metab. 2017, 42, 216–227. [Google Scholar] [CrossRef] [PubMed] [Green Version]
  30. Kerksick, C.; Thomas, A.; Campbell, B.; Taylor, L.; Wilborn, C.; Marcello, B.; Roberts, M.; Pfau, E.; Grimstvedt, M.; Opusunju, J.; et al. Effects of a popular exercise and weight loss program on weight loss, body composition, energy expenditure and health in obese women. Nutr. Metab. (Lond.) 2009, 6, 23. [Google Scholar] [CrossRef] [PubMed] [Green Version]
  31. Kerksick, C.M.; Wismann-Bunn, J.; Fogt, D.; Thomas, A.R.; Taylor, L.; Campbell, B.I.; Wilborn, C.D.; Harvey, T.; Roberts, M.D.; La Bounty, P.; et al. Changes in weight loss, body composition and cardiovascular disease risk after altering macronutrient distributions during a regular exercise program in obese women. Nutr. J. 2010, 9, 59. [Google Scholar] [CrossRef] [PubMed] [Green Version]
  32. Kreider, R.B.; Rasmussen, C.; Kerksick, C.M.; Wilborn, C.; Taylor, L.T.; Campbell, B.; Magrans-Courtney, T.; Fogt, D.; Ferreira, M.; Li, R.; et al. A carbohydrate-restricted diet during resistance training promotes more favorable changes in body composition and markers of health in obese women with and without insulin resistance. Phys. Sportsmed. 2011, 39, 27–40. [Google Scholar] [CrossRef] [PubMed]
  33. Kreider, R.B.; Serra, M.; Beavers, K.M.; Moreillon, J.; Kresta, J.Y.; Byrd, M.; Oliver, J.M.; Gutierrez, J.; Hudson, G.; Deike, E.; et al. A structured diet and exercise program promotes favorable changes in weight loss, body composition, and weight maintenance. J. Am. Diet Assoc. 2011, 111, 828–843. [Google Scholar] [CrossRef] [PubMed]
  34. Lockard, B.; Earnest, C.P.; Oliver, J.; Goodenough, C.; Rasmussen, C.; Greenwood, M.; Kreider, R.B. Retrospective analysis of protein- and carbohydrate-focused diets combined with exercise on metabolic syndrome prevalence in overweight and obese women. Metab. Syndr. Relat. Disord. 2016, 14, 228–237. [Google Scholar] [CrossRef] [PubMed]
  35. Magrans-Courtney, T.; Wilborn, C.; Rasmussen, C.; Ferreira, M.; Greenwood, L.; Campbell, B.; Kerksick, C.M.; Nassar, E.; Li, R.; Iosia, M.; et al. Effects of diet type and supplementation of glucosamine, chondroitin, and msm on body composition, functional status, and markers of health in women with knee osteoarthritis initiating a resistance-based exercise and weight loss program. J. Int. Soc. Sports Nutr. 2011, 8, 8. [Google Scholar] [CrossRef] [PubMed] [Green Version]
  36. Farris, G.; Wismann, J.; Farris, R.; Gandy, N.; Long, L.; Pfau, E.; Campbell, B.; La Bounty, P.; Rasmussen, C.; Wilson, R.; et al. Exercise intensity and energy expenditure analysis of women participating in the curves® exercise program. FASEB J. 2006, LB, 93–94. [Google Scholar]
  37. Kreider, R.; Parker, A.; Moreillon, J.; Rasmussen, C.; Greenwood, M. Energy expenditure analysis of women participating in a computerized hydraulic circuit training program. J. Strength Cond. Res. 2008, 22, A69–A70. [Google Scholar]
  38. La Bounty, P.; Wilborn, C.; Marcello, B.; Campbell, B.; Faries, M.; Shim, J.; Rasmussen, C.; Kreider, R. Analysis of exercise intensities of women using the curves® hydraulic training equipment. FASEB J. 2006, LB, 93. [Google Scholar]
  39. Matarese, L.E. Indirect calorimetry: Technical aspects. J. Am. Diet Assoc. 1997, 97, S154–S160. [Google Scholar] [CrossRef]
  40. Acsm’s Guidelines for Exercise Testing and Prescription, 6th ed.; Lippincott Williams & Wilkins: Philadelphia, PA, USA, 2000.
  41. Almada, A.L.; Kreider, R.B.; Ransom, J.; Rasmussen, C. Comparison of the reliability of repeated whole body dexa scans to repeated spine and hip scans. J. Bone. Miner. Res. 1999, 14, S369. [Google Scholar]
  42. Steffen, T.; Seney, M. Test-retest reliability and minimal detectable change on balance and ambulation tests, the 36-item short-form health survey, and the unified parkinson disease rating scale in people with parkinsonism. Phys. Ther. 2008, 88, 733–746. [Google Scholar] [CrossRef] [PubMed]
  43. Steffen, T.M.; Hacker, T.A.; Mollinger, L. Age- and gender-related test performance in community-dwelling elderly people: Six-minute walk test, berg balance scale, timed up & go test, and gait speeds. Phys. Ther. 2002, 82, 128–137. [Google Scholar] [PubMed]
  44. Alahmari, K.A.; Marchetti, G.F.; Sparto, P.J.; Furman, J.M.; Whitney, S.L. Estimating postural control with the balance rehabilitation unit: Measurement consistency, accuracy, validity, and comparison with dynamic posturography. Arch. Phys. Med. Rehabil. 2014, 95, 65–73. [Google Scholar] [CrossRef] [PubMed]
  45. Carter, N.D.; Khan, K.M.; McKay, H.A.; Petit, M.A.; Waterman, C.; Heinonen, A.; Janssen, P.A.; Donaldson, M.G.; Mallinson, A.; Riddell, L.; et al. Community-based exercise program reduces risk factors for falls in 65- to 75-year-old women with osteoporosis: Randomized controlled trial. CMAJ 2002, 167, 997–1004. [Google Scholar] [PubMed]
  46. Cuka, S.; Dvornik, S.; Drazenovic, K.; Mihic, J. Evaluation of the dade behring dimension rxl clinical chemistry analyzer. Clin Lab 2001, 47, 35–40. [Google Scholar] [PubMed]
  47. McAuley, K.A.; Williams, S.M.; Mann, J.I.; Walker, R.J.; Lewis-Barned, N.J.; Temple, L.A.; Duncan, A.W. Diagnosing insulin resistance in the general population. Diabetes Care 2001, 24, 460–464. [Google Scholar] [CrossRef] [PubMed]
  48. Page, P. Beyond statistical significance: Clinical interpretation of rehabilitation research literature. Int. J. Sports Phys. Ther. 2014, 9, 726–736. [Google Scholar] [PubMed]
  49. Mitchell, C.J.; Milan, A.M.; Mitchell, S.M.; Zeng, N.; Ramzan, F.; Sharma, P.; Knowles, S.O.; Roy, N.C.; Sjodin, A.; Wagner, K.H.; et al. The effects of dietary protein intake on appendicular lean mass and muscle function in elderly men: A 10-wk randomized controlled trial. Am. J. Clin. Nutr. 2017, 106, 1375–1383. [Google Scholar] [CrossRef] [PubMed]
  50. Churchward-Venne, T.A.; Tieland, M.; Verdijk, L.B.; Leenders, M.; Dirks, M.L.; de Groot, L.C.; van Loon, L.J. There are no nonresponders to resistance-type exercise training in older men and women. J. Am. Med. Dir. Assoc. 2015, 16, 400–411. [Google Scholar] [CrossRef] [PubMed]
  51. Jager, R.; Kerksick, C.M.; Campbell, B.I.; Cribb, P.J.; Wells, S.D.; Skwiat, T.M.; Purpura, M.; Ziegenfuss, T.N.; Ferrando, A.A.; Arent, S.M.; et al. International society of sports nutrition position stand: Protein and exercise. J. Int. Soc. Sports Nutr. 2017, 14, 20. [Google Scholar] [CrossRef] [PubMed]
  52. Pesta, D.H.; Samuel, V.T. A high-protein diet for reducing body fat: Mechanisms and possible caveats. Nutr. Metab. (Lond.) 2014, 11, 53. [Google Scholar] [CrossRef] [PubMed]
  53. Koopman, R. Dietary protein and exercise training in ageing. Proc. Nutr. Soc. 2011, 70, 104–113. [Google Scholar] [CrossRef] [PubMed]
  54. Benton, M.J.; Whyte, M.D.; Dyal, B.W. Sarcopenic obesity: Strategies for management. Am. J. Nurs. 2011, 111, 38–44. [Google Scholar] [CrossRef] [PubMed]
  55. Mateo-Gallego, R.; Marco-Benedi, V.; Perez-Calahorra, S.; Bea, A.M.; Baila-Rueda, L.; Lamiquiz-Moneo, I.; de Castro-Oros, I.; Cenarro, A.; Civeira, F. Energy-restricted, high-protein diets more effectively impact cardiometabolic profile in overweight and obese women than lower-protein diets. Clin. Nutr. 2017, 36, 371–379. [Google Scholar] [CrossRef] [PubMed]
  56. Lee, K.; Lee, J.; Bae, W.K.; Choi, J.K.; Kim, H.J.; Cho, B. Efficacy of low-calorie, partial meal replacement diet plans on weight and abdominal fat in obese subjects with metabolic syndrome: A double-blind, randomised controlled trial of two diet plans - one high in protein and one nutritionally balanced. Int. J. Clin. Pract. 2009, 63, 195–201. [Google Scholar] [CrossRef] [PubMed]
  57. Maltais, M.L.; Perreault, K.; Courchesne-Loyer, A.; Lagace, J.C.; Barsalani, R.; Dionne, I.J. Effect of resistance training and various sources of protein supplementation on body fat mass and metabolic profile in sarcopenic overweight older adult men: A pilot study. Int. J. Sport Nutr. Exerc. Metab. 2016, 26, 71–77. [Google Scholar] [CrossRef] [PubMed]
  58. Muller, M.J.; Enderle, J.; Pourhassan, M.; Braun, W.; Eggeling, B.; Lagerpusch, M.; Gluer, C.C.; Kehayias, J.J.; Kiosz, D.; Bosy-Westphal, A. Metabolic adaptation to caloric restriction and subsequent refeeding: The minnesota starvation experiment revisited. Am. J. Clin. Nutr. 2015, 102, 807–819. [Google Scholar] [CrossRef] [PubMed]
  59. Trepanowski, J.F.; Kroeger, C.M.; Barnosky, A.; Klempel, M.C.; Bhutani, S.; Hoddy, K.K.; Gabel, K.; Freels, S.; Rigdon, J.; Rood, J.; et al. Effect of alternate-day fasting on weight loss, weight maintenance, and cardioprotection among metabolically healthy obese adults: A randomized clinical trial. JAMA Int. Med. 2017, 177, 930–938. [Google Scholar] [CrossRef] [PubMed]
  60. Malin, S.K.; Niemi, N.; Solomon, T.P.; Haus, J.M.; Kelly, K.R.; Filion, J.; Rocco, M.; Kashyap, S.R.; Barkoukis, H.; Kirwan, J.P. Exercise training with weight loss and either a high- or low-glycemic index diet reduces metabolic syndrome severity in older adults. Ann. Nutr. Metab. 2012, 61, 135–141. [Google Scholar] [CrossRef] [PubMed]
  61. Clifton, P.M.; Keogh, J.B.; Noakes, M. Long-term effects of a high-protein weight-loss diet. Am. J. Clin. Nutr. 2008, 87, 23–29. [Google Scholar] [CrossRef] [PubMed] [Green Version]
  62. Hjorth, M.F.; Ritz, C.; Blaak, E.E.; Saris, W.H.; Langin, D.; Poulsen, S.K.; Larsen, T.M.; Sorensen, T.I.; Zohar, Y.; Astrup, A. Pretreatment fasting plasma glucose and insulin modify dietary weight loss success: Results from 3 randomized clinical trials. Am. J. Clin. Nutr. 2017, 106, 499–505. [Google Scholar] [CrossRef] [PubMed]
  63. Ott, B.; Skurk, T.; Hastreiter, L.; Lagkouvardos, I.; Fischer, S.; Buttner, J.; Kellerer, T.; Clavel, T.; Rychlik, M.; Haller, D.; et al. Effect of caloric restriction on gut permeability, inflammation markers, and fecal microbiota in obese women. Sci. Rep. 2017, 7, 11955. [Google Scholar] [CrossRef] [PubMed] [Green Version]
  64. Van Gemert, W.A.; May, A.M.; Schuit, A.J.; Oosterhof, B.Y.; Peeters, P.H.; Monninkhof, E.M. Effect of weight loss with or without exercise on inflammatory markers and adipokines in postmenopausal women: The shape-2 trial, a randomized controlled trial. Cancer Epidemiol. Biomark. Prev. 2016, 25, 799–806. [Google Scholar] [CrossRef] [PubMed]
  65. Daly, R.M.; Gianoudis, J.; Prosser, M.; Kidgell, D.; Ellis, K.A.; O’Connell, S.; Nowson, C.A. The effects of a protein enriched diet with lean red meat combined with a multi-modal exercise program on muscle and cognitive health and function in older adults: Study protocol for a randomised controlled trial. Trials 2015, 16, 339. [Google Scholar] [CrossRef] [PubMed]
  66. Burton, L.A.; Sumukadas, D. Optimal management of sarcopenia. Clin. Interv. Aging 2010, 5, 217–228. [Google Scholar] [PubMed]
  67. Winett, R.A.; Davy, B.M.; Marinik, E.; Savla, J.; Winett, S.G.; Phillips, S.M.; Lutes, L.D. Developing a new treatment paradigm for disease prevention and healthy aging. Transl. Behav. Med. 2014, 4, 117–123. [Google Scholar] [CrossRef] [PubMed]
Figure 1. Consolidated standards of reporting trials (CONSORT) flow chart.
Nutrients 10 01070 g001
Figure 2. Overview of study testing and timeline.
Nutrients 10 01070 g002
Figure 3. (A) Body weight, (B) fat mass, (C) fat-free mass, (D) body fat. Mean changes with 95% confidence intervals (CIs) from baseline in body composition variables for the exercise only (E), higher carbohydrate (HC), and higher protein (HP) groups. Means and 95% CIs completely below baseline represent a significant change over time. a = p < 0.05 difference from E; b = p < 0.05 difference from HC; c = p < 0.05 difference from HP.
Nutrients 10 01070 g003aNutrients 10 01070 g003b
Table 1. Baseline demographics.
VariableEHCHPp-Value
Age (years)66.0 ± 4.363.3 ± 4.865.5 ± 5.20.87
Weight (kg)76.0 ± 9.578.6 ± 10.781.6 ± 11.40.29
Height (cm)159.6 ± 3.7161.3 ± 4.9161.7 ± 6.80.41
BMI (kg/m2)29.9 ± 4.130.3 ± 4.031.3 ± 4.20.61
Body fat (%)42.7 ± 3.744.2 ± 3.543.6 ± 3.70.46
Data are expressed as means ± standard deviations for the exercise only (E, n = 19), high carbohydrate (HC, n = 18), and high protein (HP, n = 17) groups. BMI: body mass index.
Table 2. Energy and macronutrient intake.
VariableGroupWeekGroup
(SEM)
Sourcep-Value
01014
Energy intakeE1540 ± 3971580 ± 3991490 ± 4851537 ± 70Group0.004
(kcal/d)HC1339 ± 3211253 ± 2691260 ± 3081283 ± 70 cTime0.854
HP1598 ± 4151567 ± 2921711 ± 3521626 ± 74 bG × T0.322
Mean 1489 ± 3881462 ± 3551478 ± 425
ProteinE68.3 ± 13.973.7 ± 11.0 bc68.5 ± 17.0 c70.2 ± 2.5Group<0.001
(g/d)HC57.1 ± 13.555.3 ± 9.5 ac61.6 ± 16.1 a58.0 ± 2.5 cTime0.003
HP66.1 ± 13.094.9 ± 31.4 †ab86.2 ± 18.3 †ab82.4 ± 2.6 bG × T0.002
Mean 63.7 ± 14.173.9 ± 24.9 †71.6 ± 19.6 †
CarbohydrateE196 ± 70182 ± 61 c173 ± 62187 ± 11Group0.290
(g/d)HC166 ± 52 c171 ± 56 168 ± 51163 ± 11Time0.022
HP203 ± 56 b146 ± 44 †a193 ± 67181 ± 12G × T0.017
Mean 188 ± 61173 ± 54 †182 ± 60
Total fatE58.6 ± 20.165.7 ± 19.4 b67.4 ± 22.5 b63.9 ± 3.7 bGroup0.002
(g/d)HC48.9 ± 12.543.6 ± 9.9 ac 43.4 ± 14.9 ac 45.3 ± 3.5 acTime0.415
HP54.9 ± 15.463.0 ± 21.9 b58.7 ± 23.4 b58.8 ± 3.5 bG × T0.101
Mean53.9 ± 16.357.1 ± 20.156.1 ± 22.5
CaloriesE20.1 ± 6.0 21.5 ± 5.520.4 ± 7.020.9 ± 1.06Group0.015
(kcal/kg/d)HC17.3 ± 4.5 a16.8 ± 4.4 ac17.0 ± 5.2 c17.0 ± 1.06 acTime0.550
HP19.8 ± 4.420.8 ± 4.622.7 ± 5.421.1 ± 1.12G × T0.234
Mean19.3 ± 5.219.6 ± 5.219.9 ± 6.3
ProteinE0.93 ± 0.241.01 ± 0.220.94 ± 0.270.96 ± 0.05Group<0.001
(g/kg/d)HC0.74 ± 0.19 a0.73 ± 0.150.83 ± 0.260.77 ± 0.04Time<0.001
HP0.83 ± 0.161.28 ± 0.5 ab1.15 ± 0.30 b1.09 ± 0.05 abG × T0.001
Mean0.83 ± 0.211.00 ± 0.40 †0.97 ± 0.30 †
CarbohydrateE2.66 ± 1.12.56 ± 0.9 c2.47 ± 1.02.56 ± 0.16Group0.233
(g/kg/d)HC2.14 ± 072.21 ± 0.82.14 ± 0.72.16 ± 0.16Time0.127
HP2.50 ± 0.51.92 ± 0.5 a2.54 ± 0.92.32 ± 0.17G × T0.029
Mean2.43 ± 0.802.24 ± 0.82.38 ± 0.9
Total fatE0.74 ± 0.230.85 ± 0.270.80 ± 0.320.79 ± 0.05Group0.004
(g/kg/d)HC0.63 ± 0.180.58 ± 0.140.59 ± 0.230.60 ± 0.05 acTime0.100
HP0.73 ± 0.240.87 ± 0.300.90 ± 0.340.83 ± 0.05G × T0.072
Mean0.70 ± 0.220.76 ± 0.280.76 ± 0.32
Data are expressed as means ± standard deviations for the exercise only (E, n = 19), high carbohydrate (HC, n = 18)) and high protein (HP, n = 17) groups. General linear model analysis of absolute values revealed overall Wilks’ Lambda time (p = 0.002) and group × time (p = 0.001) effects. General linear model analysis of relative diet intake values revealed overall Wilks’ Lambda time (p = 0.002) and group × time (p = 0.002) effects. Greenhouse–Geisser univariate p-levels are listed for group (G), time (T), and group × time (G × T) interaction effects. † represents p < 0.05 difference from baseline value. a = p < 0.05 difference from E; b = p < 0.05 difference from HC; c = p < 0.05 difference from HP.
Table 3. Body composition, anthropometric, and resting energy expenditure data.
VariableGroupWeeksGroup (SEM)Sourcep-Value
01014
Body weightE75.99 ± 9.575.11 ± 9.775.12 ± 9.775.39 ± 2.4Group0.606
(kg)HC78.63 ± 10.775.50 ± 11.1 †76.50 ± 11.1 †77.15 ± 2.5Time<0.001
HP81.59 ± 11.477.63 ± 10.8 †77.71 ± 10.8 †78.94 ± 2.6G × T<0.001
Mean 78.63 ± 10.676.34 ± 10.4 †78.34 ± 10.4
Fat mass E29.89 ± 6.229.05 ± 6.0 †29.07 ± 6.1 †29.34 ± 1.4Group0.772
(kg)HC31.89 ± 6.730.43 ± 6.6 †29.99 ± 6.5 †30.77 ± 1.4Time<0.001
HP32.78 ± 6.029.98 ± 5.7 †29.42 ± 5.6 †30.73 ± 1.5G × T<0.001
Mean 31.46 ± 6.329.80 ± 6.0 †29.49 ± 6.0 †
Fat free mass E39.66 ± 4.140.1 ± 4.240.01 ± 4.339.95 ± 1.2Group0.351
(kg)HC39.86 ± 4.640.1 ± 4.940.59 ± 5.440.19 ± 1.2Time0.064
HP42.40 ± 5.842.09 ± 6.142.42 ± 6.642.23 ± 1.3G × T0.427
Mean 40.53 ± 4.940.75 ± 5.140.96 ± 5.5
Body fatE42.68 ± 3.741.69 ± 3.7 †41.78 ± 3.5 †42.05 ± 0.8Group0.584
(%)HC44.17 ± 3.542.85 ± 3.5 †42.23 ± 3.3 †43.08 ± 0.8Time<0.001
HP43.57 ± 3.841.45 ± 3.8 †40.86 ± 4.3 †41.96 ± 0.9G × T0.005
Mean43.46 ± 3.642.00 ± 3.6 †41.63 ± 3.7 †
Bone mineral E1531 ± 1831527 ± 1791535 ± 1821531 ± 68 aGroup0.045
content (g)HC1613 ± 2141615 ± 2121608 ± 2271612 ± 70Time0.349
HP1789 ± 4271767 ± 4541788 ± 439 1781 ± 72 cG × T0.365
Mean1640 ± 3051632 ± 3121639 ± 312
Waist E88.4 ± 7.988.3 ± 7.387.5 ± 7.688.1 ± 2.2Group0.978
circumferenceHC89.7 ± 12.988.9 ± 12.088.2 ± 12.189.9 ± 2.2Time<0.001
(cm)HP91.2 ± 8.289.1 ± 7.5 †87.6± 7.6 †89.3 ± 2.3G × T0.016
Mean89.7 ± 9.088.7 ± 9.0 †87.8 ± 9.2 †
Hip E107.6 ± 8.1107.0 ± 8.1106.0 ± 7.4106.9 ± 1.7Group<0.001
circumferenceHC109.9 ± 5.5108.0± 6.3107.9 ± 7.6 †108.6 ± 1.7Time<0.001
(cm)HP112.7 ± 8.8109.4 ± 8.2 †108.8 ± 7.9 †110.3 ± 18G × T0.019
Mean110.0± 7.5108.1± 7.5 †107.5 ± 7.6 †
Waist:hip E0.822 ± 0.050.826 ± 0.080.827 ± 0.060.825 ± 0.01Group0.684
ratioHC0.815 ± 0.090.821 ± 0.080.815 ± 0.070.817 ± 0.02Time0.180
HP0.810 ± 0.050.815 ± 0.050.805 ± 0.050.810 ± 0.02G × T0.616
Mean0.816 ± 0.070.821 ± 0.060.816 ± 0.06
Resting energy expenditure (kcal/d)E1317 ± 1841341 ± 1981345 ± 1681334 ± 39Group0.923
HC1313 ± 1991358 ± 2111356 ± 1811342 ± 37Time0.065
HP1311 ± 1511361 ±1301287 ± 1761320 ± 43G × T0.356
Mean1314 ± 1781353 ± 1831332 ± 174
Data are expressed as means ± standard deviations for the exercise only (E, n = 19), high carbohydrate (HC, n = 18)), and high protein (HP, n = 17) groups. General linear model analysis revealed overall Wilks’ Lambda time (p < 0.001) and group × time (p < 0.001) effects for body composition variables and overall Wilks’ Lambda time (p < 0.001) and group × time (p < 0.017) effects for anthropometric measurements. Greenhouse–Geisser univariate p-levels are listed for group (G), time (T) and group × time (G × T) interaction effects. † represents p < 0.05 difference from baseline value. a = p < 0.05 difference from E; c = p < 0.05 difference from HP.
Table 4. Fasting serum hormone and metabolic markers.
VariableGroupWeeksGroup
(SEM)
Sourcep-Value
01014
GlucoseE109.0 ± 21108.3 ± 23106.5 ± 21107.9 ± 5Group0.400
(mg/dL)HC96.8 ± 1498.4 ± 9100.2 ± 1098.5 ± 5Time0.335
HP114.5 ± 61105.3 ± 2699.5 ± 19106.4 ± 5G × T0.295
Mean 103.7 ± 37104.1 ± 21102.2 ± 18
Insulin E11.1 ± 6.514.0 ± 8.017.1 ± 9.514.1 ± 1.9Group0.459
(µU/mL)HC10.1 ± 6.59.7 ± 5.916.1 ± 7.712.0 ± 1.9Time<0.001
HP12.7 ± 12.815.3 ± 10.918.1 ± 12.315.4 ± 2.0G × T0.486
Mean11.3 ± 8.813.0 ± 8.017.1 ± 9.8 †
Insulin sensitivityE3.17 ± 2.43.80 ± 4.54.61 ± 2.83.86 ± 0.6Group0.308
(HOMAIR)HC2.47 ± 1.62.39 ± 1.53.96 ± 1.92.94 ± 0.6Time<0.001
HP3.67 ± 3.84.46 ± 4.44.86 ± 4.34.33 ± 0.7G × T0.527
Mean3.10 ± 2.73.53 ± 3.14.47 ± 3.1 †
AdiponectinE11.5 ± 5.710.3 ± 3.916.6 ± 14.212.8 ± 1.8Group0.844
(µg/mL)HC13.7 ± 6.113.1 ± 4.89.5 ± 5.1 a12.1 ± 1.8Time0.007
HP14.0 ± 7.76.5 ± 2.6 †23.1 ± 25.1 †b14.6 ± 1.9G × T0.002
Mean13.1 ± 6.510.1 ± 4.7 †16.3 ± 17.3 †
Leptin E36.7 ± 13.4 c31.3 ± 23.235.2 ± 17.5 b34.4 ± 3.5Group0.218
(ng/mL)HC36.7 ± 16.4 c32.8 ± 19.550.4 ± 24.6 †ac39.9 ± 3.6Time<0.001
HP61.5 ± 18.6 ab37.9 ± 14.5 †38.4 ± 19.7 †b45.9 ± 3.7G × T<0.001
Mean 44.5 ± 19.733.9 ± 19.4 †41.3 ± 21.4
TriglyceridesE141 ± 95172 ± 125 †c138 ± 89 bc150 ± 19Group0.898
(mg/dL)HC145 ± 65160 ± 78 †158 ± 66 c154 ± 19Time0.186
HP159 ± 81149 ± 67 a157 ± 84 a155 ± 20G × T0.046
Mean 148 ± 80161 ± 79151 ± 79
Total cholesterolE200 ± 36215 ± 36191 ± 31202 ± 7Group0.343
(mg/dL)HC199 ± 64201 ± 27199 ± 31199 ± 7Time0.062
HP214 ± 32216 ± 28204 ± 24211 ± 7G × T0.470
Mean204 ± 46210 ± 31198 ± 29
Low densityE115 ± 35127 ± 28115 ± 32119 ± 6Group0.455
lipoproteinHC114 ± 43110 ± 21109 ± 24111 ± 6Time0.828
(mg/dL)HP122 ± 25123 ± 24120 ± 25121 ± 6G × T0.594
Mean117 ± 35120 ± 25115 ± 27
High densityE54.1 ± 15.455.6 ± 16.255.3 ± 15.455.0 ± 3.0Group0.876
lipoproteinHC55.06 ± 10.455.1 ± 11.257.3 ± 13.155.8 ± 3.1Time0.239
(mg/dL)HP57.8 ± 18.955.5 ± 13.855.6 ± 12.956.3 ± 3.2G × T0.216
Mean55.6 ± 15.055.4 ± 13.756.1 ± 13.7
Data are expressed as means ± standard deviations for the exercise only (E, n = 19), high carbohydrate (HC, n = 18)) and high protein (HP, n = 17) groups. General linear model analysis revealed overall Wilks’ Lambda time (p < 0.001) and group × time (p < 0.308) effects for glucose and insulin-related variables; an overall Wilks’ Lambda time (p < 0.001) and group × time (p < 0.001) effects for appetite related variables; and, an overall Wilks’ Lambda time (p = 0.124) and group × time (p < 0.056) effects for lipid related variables. Greenhouse–Geisser univariate p-levels are listed for group (G), time (T) and group × time (G × T) interaction effects. HOMAIR = homeostatic model assessment for insulin resistance. † represents p < 0.05 difference from baseline value. a = p < 0.05 difference from E; b = p < 0.05 difference from HC; c = p < 0.05 difference from HP.
Table 5. Cardiovascular, aerobic capacity, and muscular strength and endurance measures.
VariableGroupWeeksGroup
(SEM)
Sourcep-Value
014
Resting heart rateE77.4 ± 12.672.0 ± 9.374.7 ± 2.4Group0.283
(bpm)HC74.4 ± 12.873.9 ± 11.874.2 ± 2.4Time0.074
HP74.1 ± 11.471.4 ± 11.672.7 ± 2.6G × T0.455
Time 75.4 ± 12.672.4 ± 10.8
Resting systolicE125.7 ± 10.5122.8 ± 13.2124.3 ± 2.3Group0.038
blood pressureHC124.6 ± 12.5123.7 ± 14.1124.18 ± 23Time0.238
(mmHg)HP126.5 ± 16.3121.9 ± 11.3124.2 ± 2.4G × T0.814
Time 125.6 ± 13.0122.8 ± 12.8
Resting diastolicE77.8± 9.8071.9 ± 7.874.8 ± 1.6Group0.330
blood pressureHC73.3 ± 10.472.8 ± 9.473.1 ± 1.7Time0.032
(mmHg)HP75.1 ± 9.570.9 ± 7.573.0 ± 1.7G × T0.379
Time 75.4 ± 9.971.9 ± 8.1 †
Peak VO2 E17.70 ± 3.318.39 ± 3.218.05 ± 0.6Group0.110
(mL/kg/min)HC15.53 ± 2.217.14 ± 2.816.34 ± 0.7Time<0.001
HP17.13 ± 3.719.29 ± 3.118.21 ± 0.7G × T0.227
Time 16.82 ± 3.218.26 ± 3.2 †
Walk test (6-min)E496 ± 67534 ± 59516 ± 13Group0.218
(m)HC517 ± 47551 ± 40533 ± 14Time<0.001
HP538 ± 70570 ± 77554 ± 14G × T0.860
Time 516 ± 63551 ± 61 †
Bench press (1RM)E21.4 ± 5.026.2 ± 3.323.8 ± 1.2Group0.536
(kg)HC20.6 ± 5.623.4 ± 5.722.0 ± 1.2Time<0.001
HP20.6 ± 6.224.5 ± 4.522.5 ± 1.3G × T0.245
Time 20.9 ± 5.524.7 ± 4.7 †
Bench press E127.8 ± 62143.4 ± 43135.6 ± 10Group0.237
endurance volumeHC98.5 ± 53135.7 ± 58117.1 ± 10Time<0.001
(kg)HP132.9 ± 43148.0 ± 55140.4 ± 11G × T0.568
Time 119.0 ± 55142.1 ± 52 †
Leg press 1RME89.4 ± 32110.0 ± 3499.7 ± 8Group0.781
(kg)HC82.7 ± 33105.5± 3794.1 ± 8Time0.025
HP78.1 ± 32106.2 ± 2892.2± 8G × T0.636
Time 83.5 ± 32107.2 ± 33†
Leg pressE936 ± 6231182 ± 9591059 ± 147Group0.792
endurance volumeHC839 ± 4511114 ± 708977 ± 143Time0.122
(kg)HP1161 ± 7321076 ± 3751118 ± 152G × T0.229
Time 972 ± 6091125 ± 713
Data are expressed as means ± standard deviations for the exercise only (E, n = 19), high carbohydrate (HC, n = 18)) and high protein (HP, n = 17) groups. General linear model analysis revealed overall Wilks’ Lambda time (p = 0.047) and group × time (p = 0.662) effects for resting hemodynamics, an overall Wilks’ Lambda time (p < 0.001) and group × time (p = 0.578) effects for aerobic exercise capacity variables, and an overall Wilks’ Lambda time (p < 0.001) and group × time (p = 0.152) effects for muscular strength and endurance-related variables. Greenhouse–Geisser univariate p-levels are listed for group (G), time (T), and group × time (G × T) interaction effects. † represents p < 0.05 difference from baseline value. 1RM: 1 repetition maximum. VO2: oxygen uptake.

