Article

Betaine Improves Intestinal Functions by Enhancing Digestive Enzymes, Ameliorating Intestinal Morphology, and Enriching Intestinal Microbiota in High-salt stressed Rats

1
Key Laboratory of Animal Nutrition & Feed Science, Zhejiang Province, College of Animal Sciences, Zhejiang University, Hangzhou 310058, China
2
Department of Animal Science, College of Agricultural, Consumer and Environmental Science, University of Illinois at Urbana-Champaign, Urbana, IL 61801, USA
*
Author to whom correspondence should be addressed.
Nutrients 2018, 10(7), 907; https://doi.org/10.3390/nu10070907
Submission received: 29 June 2018 / Revised: 12 July 2018 / Accepted: 12 July 2018 / Published: 16 July 2018

Abstract

:
To investigate the role of betaine in the intestinal functions of high-salt stressed rats, 32 four-week-old male Sprague–Dawley rats weighing 128.0 (SD 5.06) g were randomly allotted to four groups. The control group was fed with standard chow diet (0.4% NaCl), while the treatment groups were fed a high-salt diet (4.0% NaCl) supplemented with betaine at 0.0%, 0.5%, and 1.0%, respectively. The experiment lasted 28 days. The results showed that rats in the high-salt stressed groups had a significant increase in both water intake and kidney index (p < 0.05). The level of cortisol (COR) was increased in the high-salt stressed rats (p < 0.05), and returned to normal levels with betaine supplementation (p < 0.05). Aldosterone (ALD) was decreased in all high-salt diet groups (p < 0.05). Betaine supplementation decreased antidiuretic hormone (ADH) levels significantly (p < 0.05). High salt stress decreased the activities of amylase, lipase, trypsin, and chymotrypsin in the small intestinal luminal contents (p < 0.05), however, these activities increased with betaine supplementation (p < 0.05). The gut villus height of small intestine was significantly decreased in the high-salt diet group (p < 0.05). However, they were higher in the betaine supplementation groups than in the control group (p < 0.05). A similar result was observed in the ratio of villus height to crypt depth (p < 0.05). Both alpha diversity indexes and beta diversity indexes showed that high salt stress decreased the diversity of intestinal microbiota, while supplementation with betaine counteracted the negative effect. In conclusion, the results indicate that betaine improves intestinal function by enhancing the digestive enzymes, ameliorating intestinal morphology, and enriching intestinal microbiota of high-salt stressed rats.

1. Introduction

Betaine, also known as glycine betaine (N,N,N-trimethylglycine), is a small zwitterionic compound that is extensively distributed in organisms including bacteria, fungi, plants, invertebrates, and mammals [1]. Betaine is a significant component of many food and rich dietary sources include wheat bran (1339 mg/100 g), wheat germ (1240 mg/100 g), spinach (645 mg/100 g), beets (297 mg/100 g), pretzels (236 mg/100 g), and shrimp (219 mg/ 100 g) [2,3]. In mammals, betaine can be obtained not only by absorption through dietary intake, but also by endogenous synthesis from choline, and the primary role of betaine is to donate methyl group in one-carbon metabolism in the liver [1]. It is reported that betaine could alleviate fat accumulation in the liver [4]. Some reviews even recommend using betaine to treat nonalcoholic fatty liver disease (NAFLD) [5,6,7]. In the kidney, where the osmolarity fluctuates wildly because of urine concentration and dilution, betaine functions mainly as an osmolyte in the inner medulla to preserve the osmotic equilibrium and to maintain the tertiary structure and function of macromolecules [8]. Betaine also acts as an organic osmolyte in various life forms such as microorganisms [9,10], plants [11], and marine invertebrates [12]. In vitro studies also found that betaine could play a role in osmoregulation in mouse embryos [13], mouse hybridoma cells [14], rat liver sinusoidal epithelial cells [15,16], rat hepatic stellate cells [17], and chick embryo fibroblasts [18]. As a feed additive, betaine is widely used in animal science [19]. Most researchers consider betaine as a reliable source of methyl groups that can spare the role of choline and/or methionine in animal nutrition [20,21]. It has also been reported that betaine could alleviate the growth depression caused by coccidiosis or diarrhea [22,23]. Still, Ferket [24] found clear reductions in litter moisture and occurrence of diarrhea in turkeys supplemented with betaine and assumed that it was in association with the osmoregulation role of betaine. However, less information is documented on the osmoregulation role of betaine in nutrition. In the current experiment, we used a high-salt diet to create hyperosmotic conditions in order to investigate the role of betaine in intestinal functions and intestinal microbiota in rats.

2. Materials and Methods

2.1. Animals and Experimental Design

This work was approved by the Institutional Animal Ethics Committee of Zhejiang University. The experiment was carried out in the Laboratory Animal Center of Zhejiang University. All experimental procedures were undertaken with reference to the Guidelines for the Care and Use of Laboratory Animals in China. The Sprague–Dawley rats used in the investigation were purchased from the Laboratory Animal Center of Zhejiang Academy of Medical Sciences (Hangzhou, China). Thirty-two 4-week-old male Sprague–Dawley rats weighing 128.0 (SD 5.06) g were randomly allocated to four different groups, with eight rats in each group: A, basal diet (0.4% NaCl, 0.0% betaine) which was formulated in accordance with AIN-93G (American Institute of Nutrition) [25]; B, basal diet with modified sodium content (4.0% NaCl, 0.0% betaine); C, basal diet with modified sodium and betaine content (4.0% NaCl, 0.5% betaine); and D, basal diet with modified sodium and betaine content (4.0% NaCl, 1.0% betaine). The chow diets were specialized for our experiment by SLAC Experimental Animals Co., Ltd. (Shanghai, China). The betaine (99.4% purity) used in the present study was donated by the Healthy (Hangzhou) Husbandry Sci-tech Co., Ltd (Zhejiang, China). All animals were housed in a room with constant temperature (21 ± 1 °C) and humidity (75 ± 5%) under 12 h light/dark cycle. The rats were caged individually in stainless cages with free access to water and chow diet ad libitum throughout the entire feeding period. The experiment lasted 28 days. Body weight, feed intake, and water consumption were monitored twice a week.

2.2. Sampling

On day 28, all rats were anesthetized with halothane. The plasma sample was collected from orbital blood (centrifuged at 3000× g for 10 min) and stored at −80 °C. The rats were then euthanized by cervical dislocation. Fresh livers and kidneys were weighed and collected separately. The samples were frozen in liquid nitrogen immediately. Intestinal contents from the duodenum, jejunum, ileum, and cecum were collected and rapidly frozen in liquid nitrogen. Segments of the duodenum, jejunum, and ileum were fixed in 10% formaldehyde for hematoxylin and eosin (H&E) staining. The mucosa of duodenum, jejunum, and ileum were scraped and then sharply frozen in liquid nitrogen. All snap-frozen samples in liquid nitrogen were stored at −80 °C for subsequent analysis.

2.3. Osmolarity and Electrolytes Assays

Pure deionized water was added to the samples of liver, kidney, intestinal digesta and mucosa (v/w = 9:1) separately and the suspensions were homogenized accordingly [26]. The osmolarity of the supernatants and plasma was determined by using the Fiske® 210 freezing-point osmometer (Advanced Instruments, Norwood, MA, USA). The concentrations of sodium (Na) and potassium (K) were determined by using a flame photometer (ICE3100, Thermo Scientific, Waltham, MA, USA) and the concentrations of chloride (Cl) were measured by using a colorimetric procedure.

2.4. Plasma Endocrine Hormone Assays

Plasma aldosterone (ALD), cortisol (COR), and antidiuretic hormone (ADH) were measured by using commercially available kits (Jiancheng Bioengineering, Nanjing, China).

2.5. Digestive Enzymes Assays

Digestive enzymes activities (amylase, maltase, lipase, trypsin, and chymotrypsin) of the digesta from the duodenum, jejunum, and ileum were measured by using appropriate kits (Jiancheng Bioengineering, Nanjing, China).

2.6. DNA Isolation and 16S rRNA Gene Sequencing

Total bacterial genome DNA from caecal samples was extracted following the manufacturer’s instructions of the Qiagen DNA Extraction kit (Qiagen, Hilden, Germany). The quality and quantity of the isolated DNA were monitored on 1% agarose gels electrophoresis together with a NanoDrop ND-2000c UV-vis spectrophotometer (NanoDrop Technologies, Wilmington, NC, USA). 16S rRNA genes were amplified using barcoded primer set (341F: 5′-CCTAYGGGRBGCASCAG-3′, 806R: 5′-GGACTACNNGGGTATCTAAT-3′) covering the V3–V4 region. PCR amplification was carried out with Phusion® High-Fidelity PCR Master Mix (New England Biolabs, Ipswich, MA, USA) and the protocols were summarized as follows: initial denaturation (94 °C for 3 min, 1 cycle), followed by 30 cycles of denaturation (94 °C for 45 s), annealing (62 °C for 30 s), and extension (70 °C for 45 s), with the last step at 72 °C for 5 min. The PCR products were purified using the GeneJETTM Gel Extraction Kit (Thermo Scientific) and then quantified using QuantiFluor™ ST (Promega, Fitchburg, WI, USA). Sequencing libraries were generated using Ion Plus Fragment Library Kit 48 rxns (Thermo Scientific, USA) following manufacturer’s recommendations. The library quality was assessed by the Qubit@ 2.0 Fluorometer (Thermo Scientific, Waltham, MA, USA) and Agilent Bioanalyzer 2100 system. Finally, the library was sequenced on an Illumina HiSeq platform (San Diego, CA, USA), and generated ~250 bp paired-end reads.

2.7. Data Processing

After quality control of the raw data by FastQC (version 0.11.3), paired-end reads were assigned to each sample based on their unique barcode and were then merged using FLASH (version 1.2.7) to obtain the raw tags [27]. Concatenated sequences were filtered out under specific filtering conditions [28] according to the QIIME software package (version 1.7.0) [29]. USEARCH software (version 6.1) was used to remove the chimeric sequences according to the UCHIME algorithm [30]. UPARSE software (version 7.0.1001) was used to cluster sequences into operational taxonomic units (OTUs) based on a 97% similarity threshold [31]. The phylogenetic affiliation of each 16S rRNA gene sequence was analyzed by the RDP Classifier (Version 2.2) algorithm [32] to annotate taxonomic information against the GreenGene database [33]. Alpha diversity indexes (the Observed species, Chao1, Shannon, and Simpson indexes) were calculated using the QIIME software package (version 1.7.0) and displayed with the R software package (version 2.15.3) to analyze the complexity of species diversity for a sample. Beta diversity indexes, including nonmetric multidimensional scaling (NMDS), unweighted unifrac distances, and linear discriminant analysis effect size (LEfSe) were used to evaluate differences of samples in species complexity. The NMDS ordination plot was measured according to Yue and Clayton [34], unweighted unifrac distances were calculated by QIIME software (Version 1.7.0), and LEfSe was performed using the vegan package of R software (version 2.15.3).

2.8. Statistical Analysis

Data analyses were performed using one-way ANOVA of the SAS 9.2 statistical software package (SAS Institute, Inc., Cary, NC, USA). The Duncan test was applied to multiple comparisons among groups, with significant differences being declared at p < 0.05.

3. Results

3.1. Growth Performance

From Table 1, we found that rats in high-salt stressed groups significantly increased their water intake (p < 0.05). The kidney index was also increased markedly in high-salt stressed rats (p < 0.05). There were no statistical differences in average daily feed intake (ADFI) or average daily gain (ADG) (p > 0.05).

3.2. Osmolarity and Electrolytes

As we can see from Table 2, there were no differences observed in the osmolarity of plasma, liver, kidney, luminal digesta, or mucosa of the small intestine among groups (p > 0.05). In each group, in terms of digesta osmolarity and mucosa osmolarity, the duodenum had the highest values and the ileum the lowest (p < 0.05). Table 3 showed that high salt stress decreased the Cl- content in plasma (p < 0.05), but it was increased in liver and kidney (p < 0.05). The contents of Na+ and K+ in plasma, kidney and liver were not different among groups (p > 0.05).

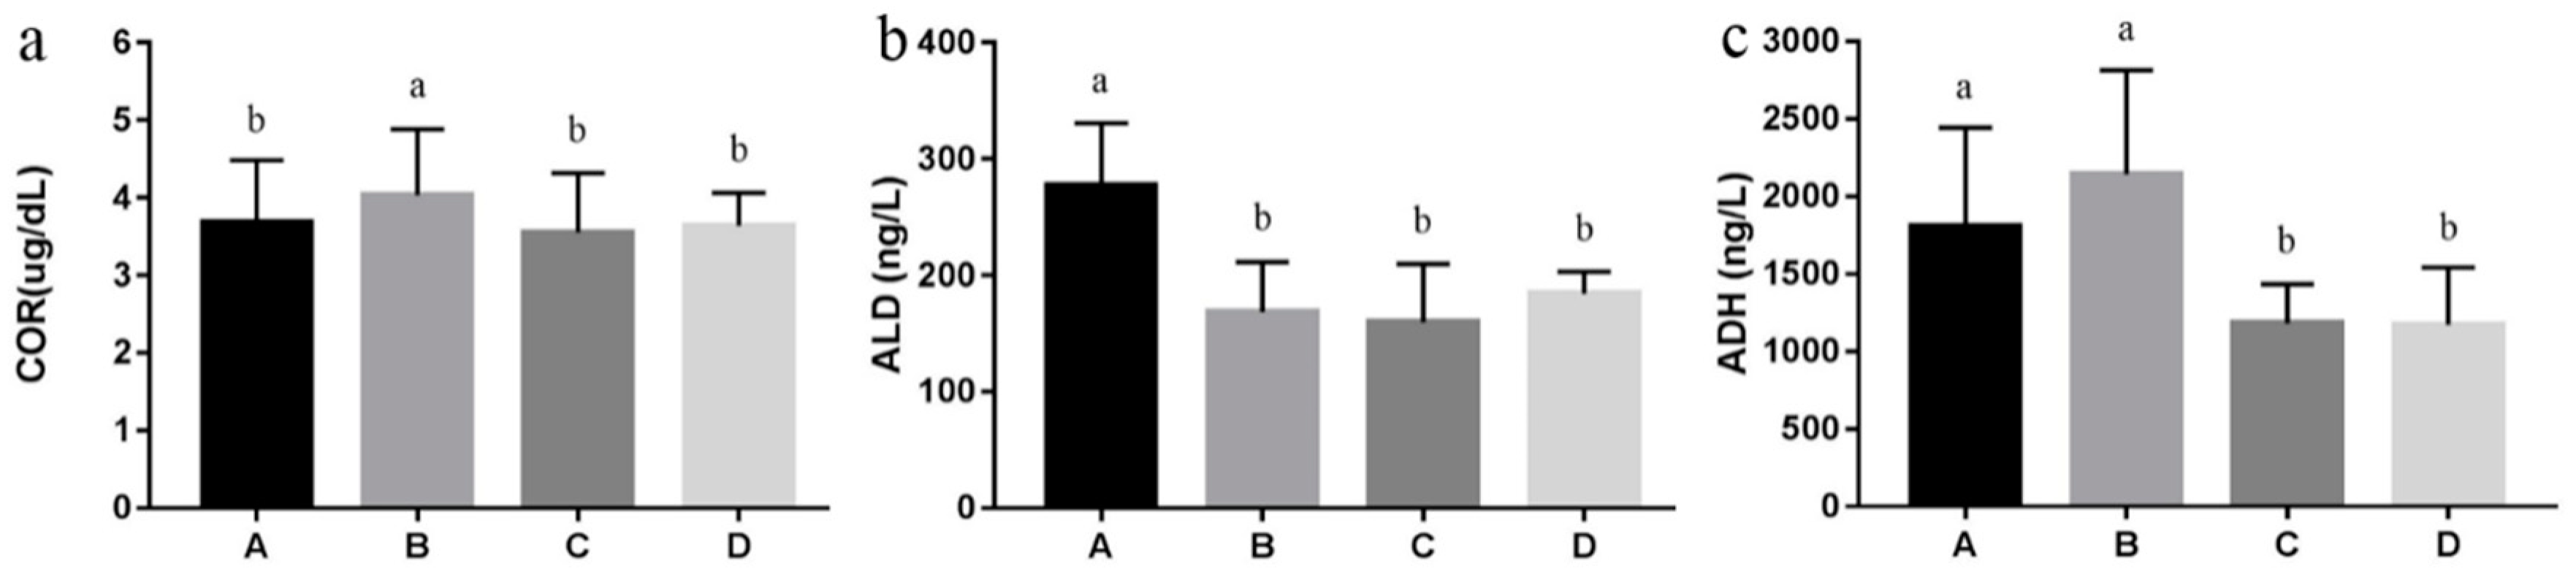
3.3. Endocrine Hormones

As can be seen in Figure 1, the level of COR was increased in high-salt stressed rats (p < 0.05), and returned to normal level with betaine supplementation (p < 0.05). ALD was decreased in all high-salt diet groups (p < 0.05). ADH was increased in high-salt stressed rats (p > 0.05), when supplemented with betaine, it decreased significantly (p < 0.05).

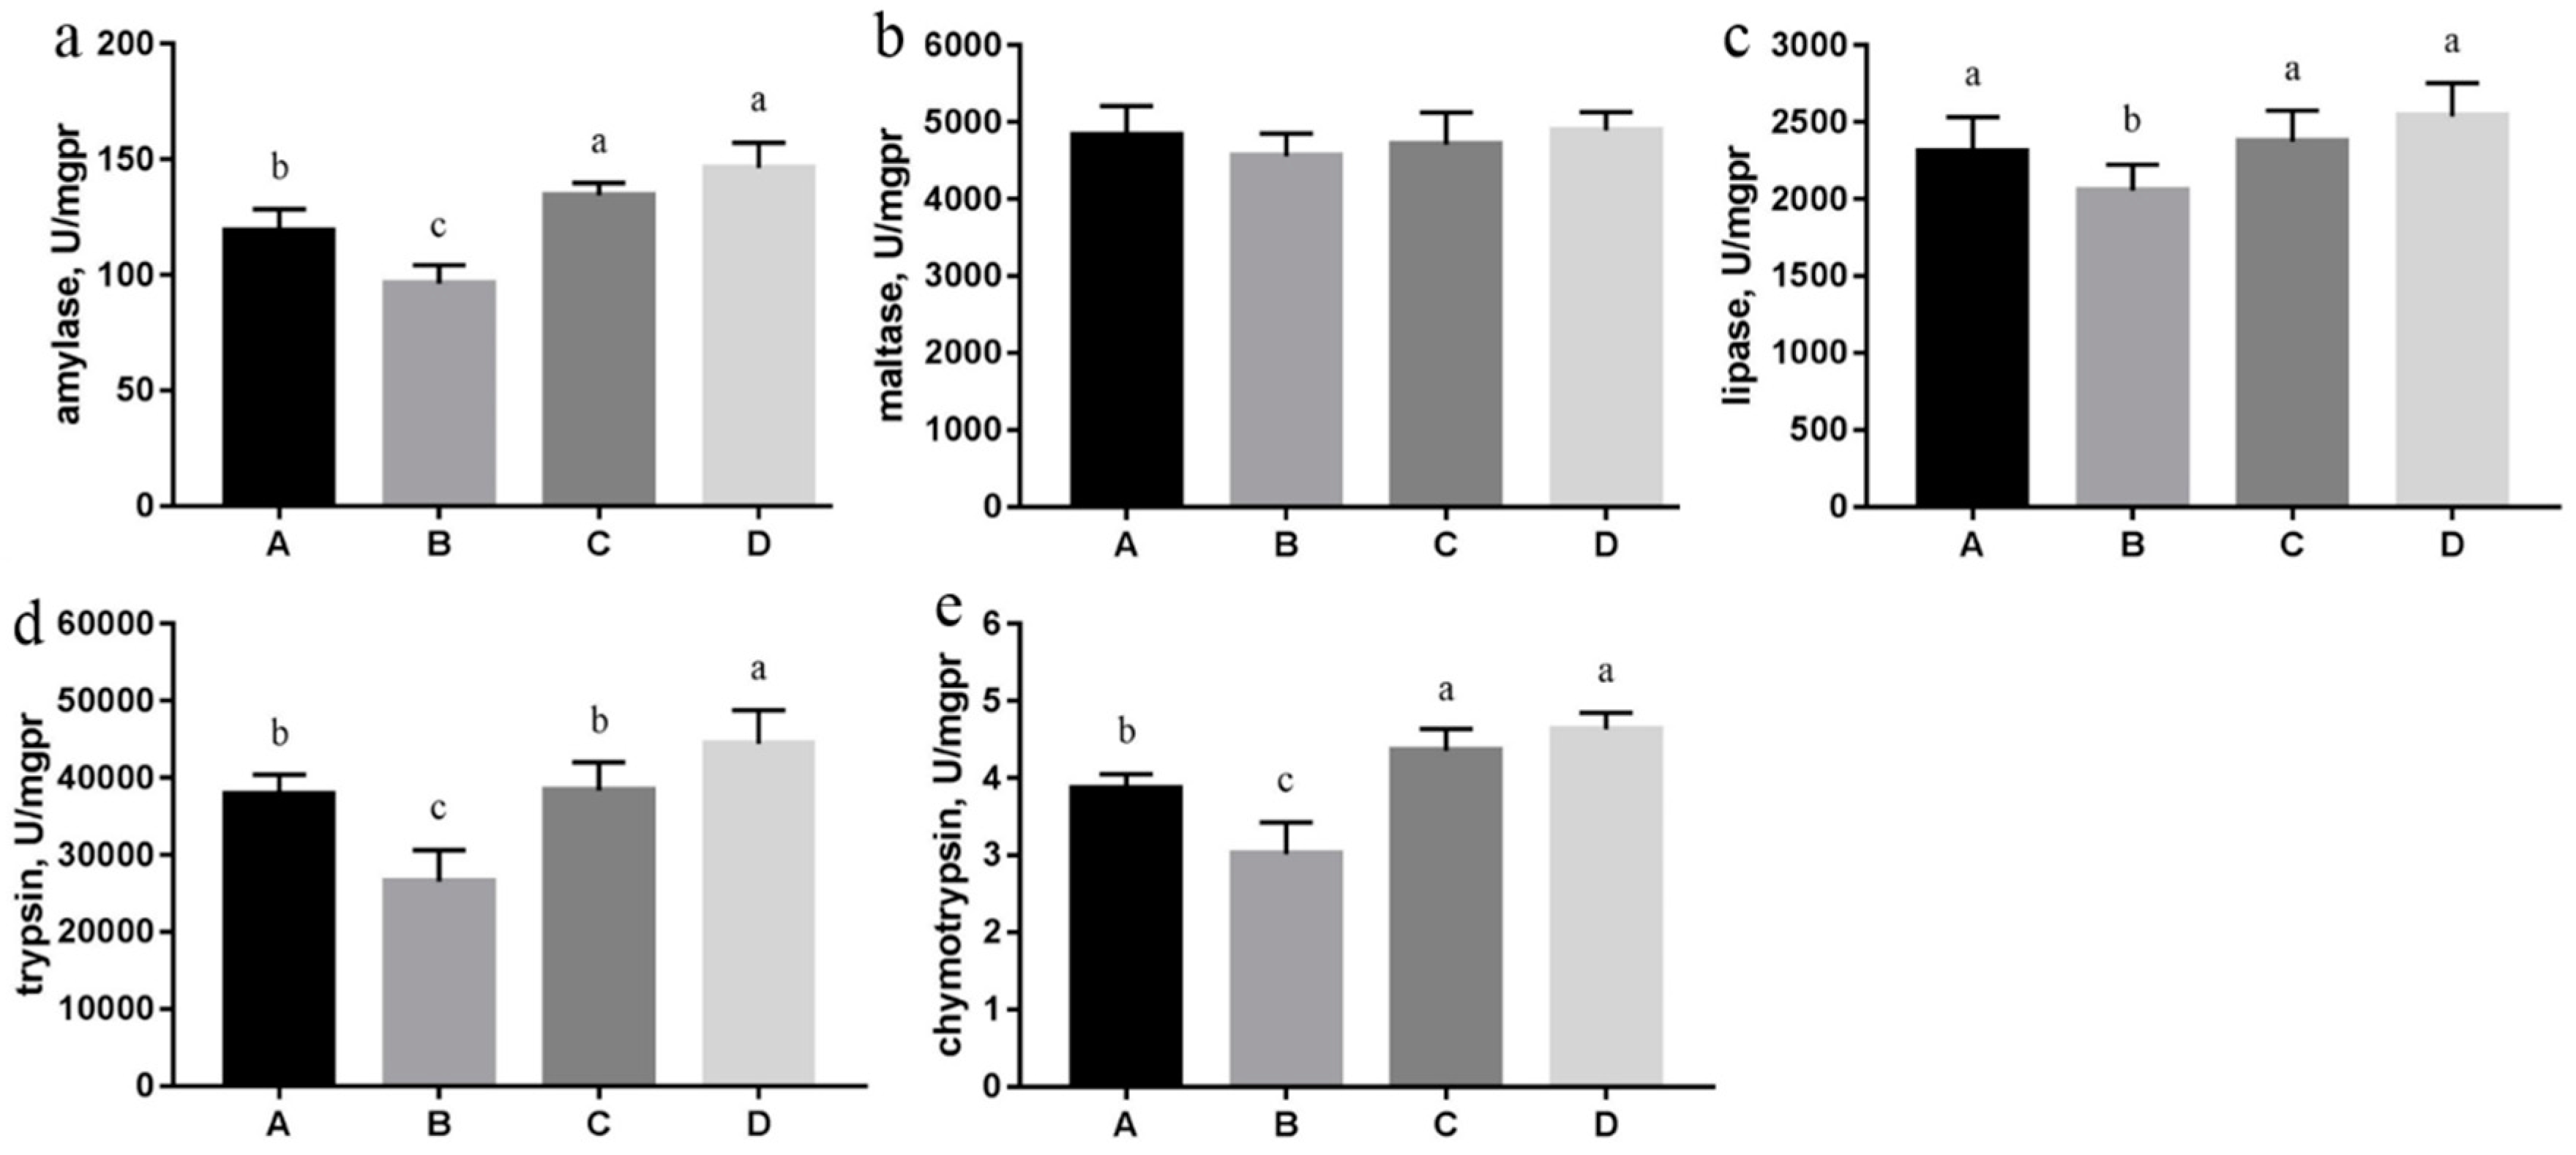
3.4. Digestive Enzyme Activities

Data from Figure 2 showed that high salt stress decreased the activities of amylase, lipase, trypsin and chymotrypsin (p < 0.05). However, the activities of these enzymes markedly increased with betaine supplementation (p < 0.05). The data in trypsin activity showed that betaine supplementation at 1.0% was more powerful than at 0.5%.

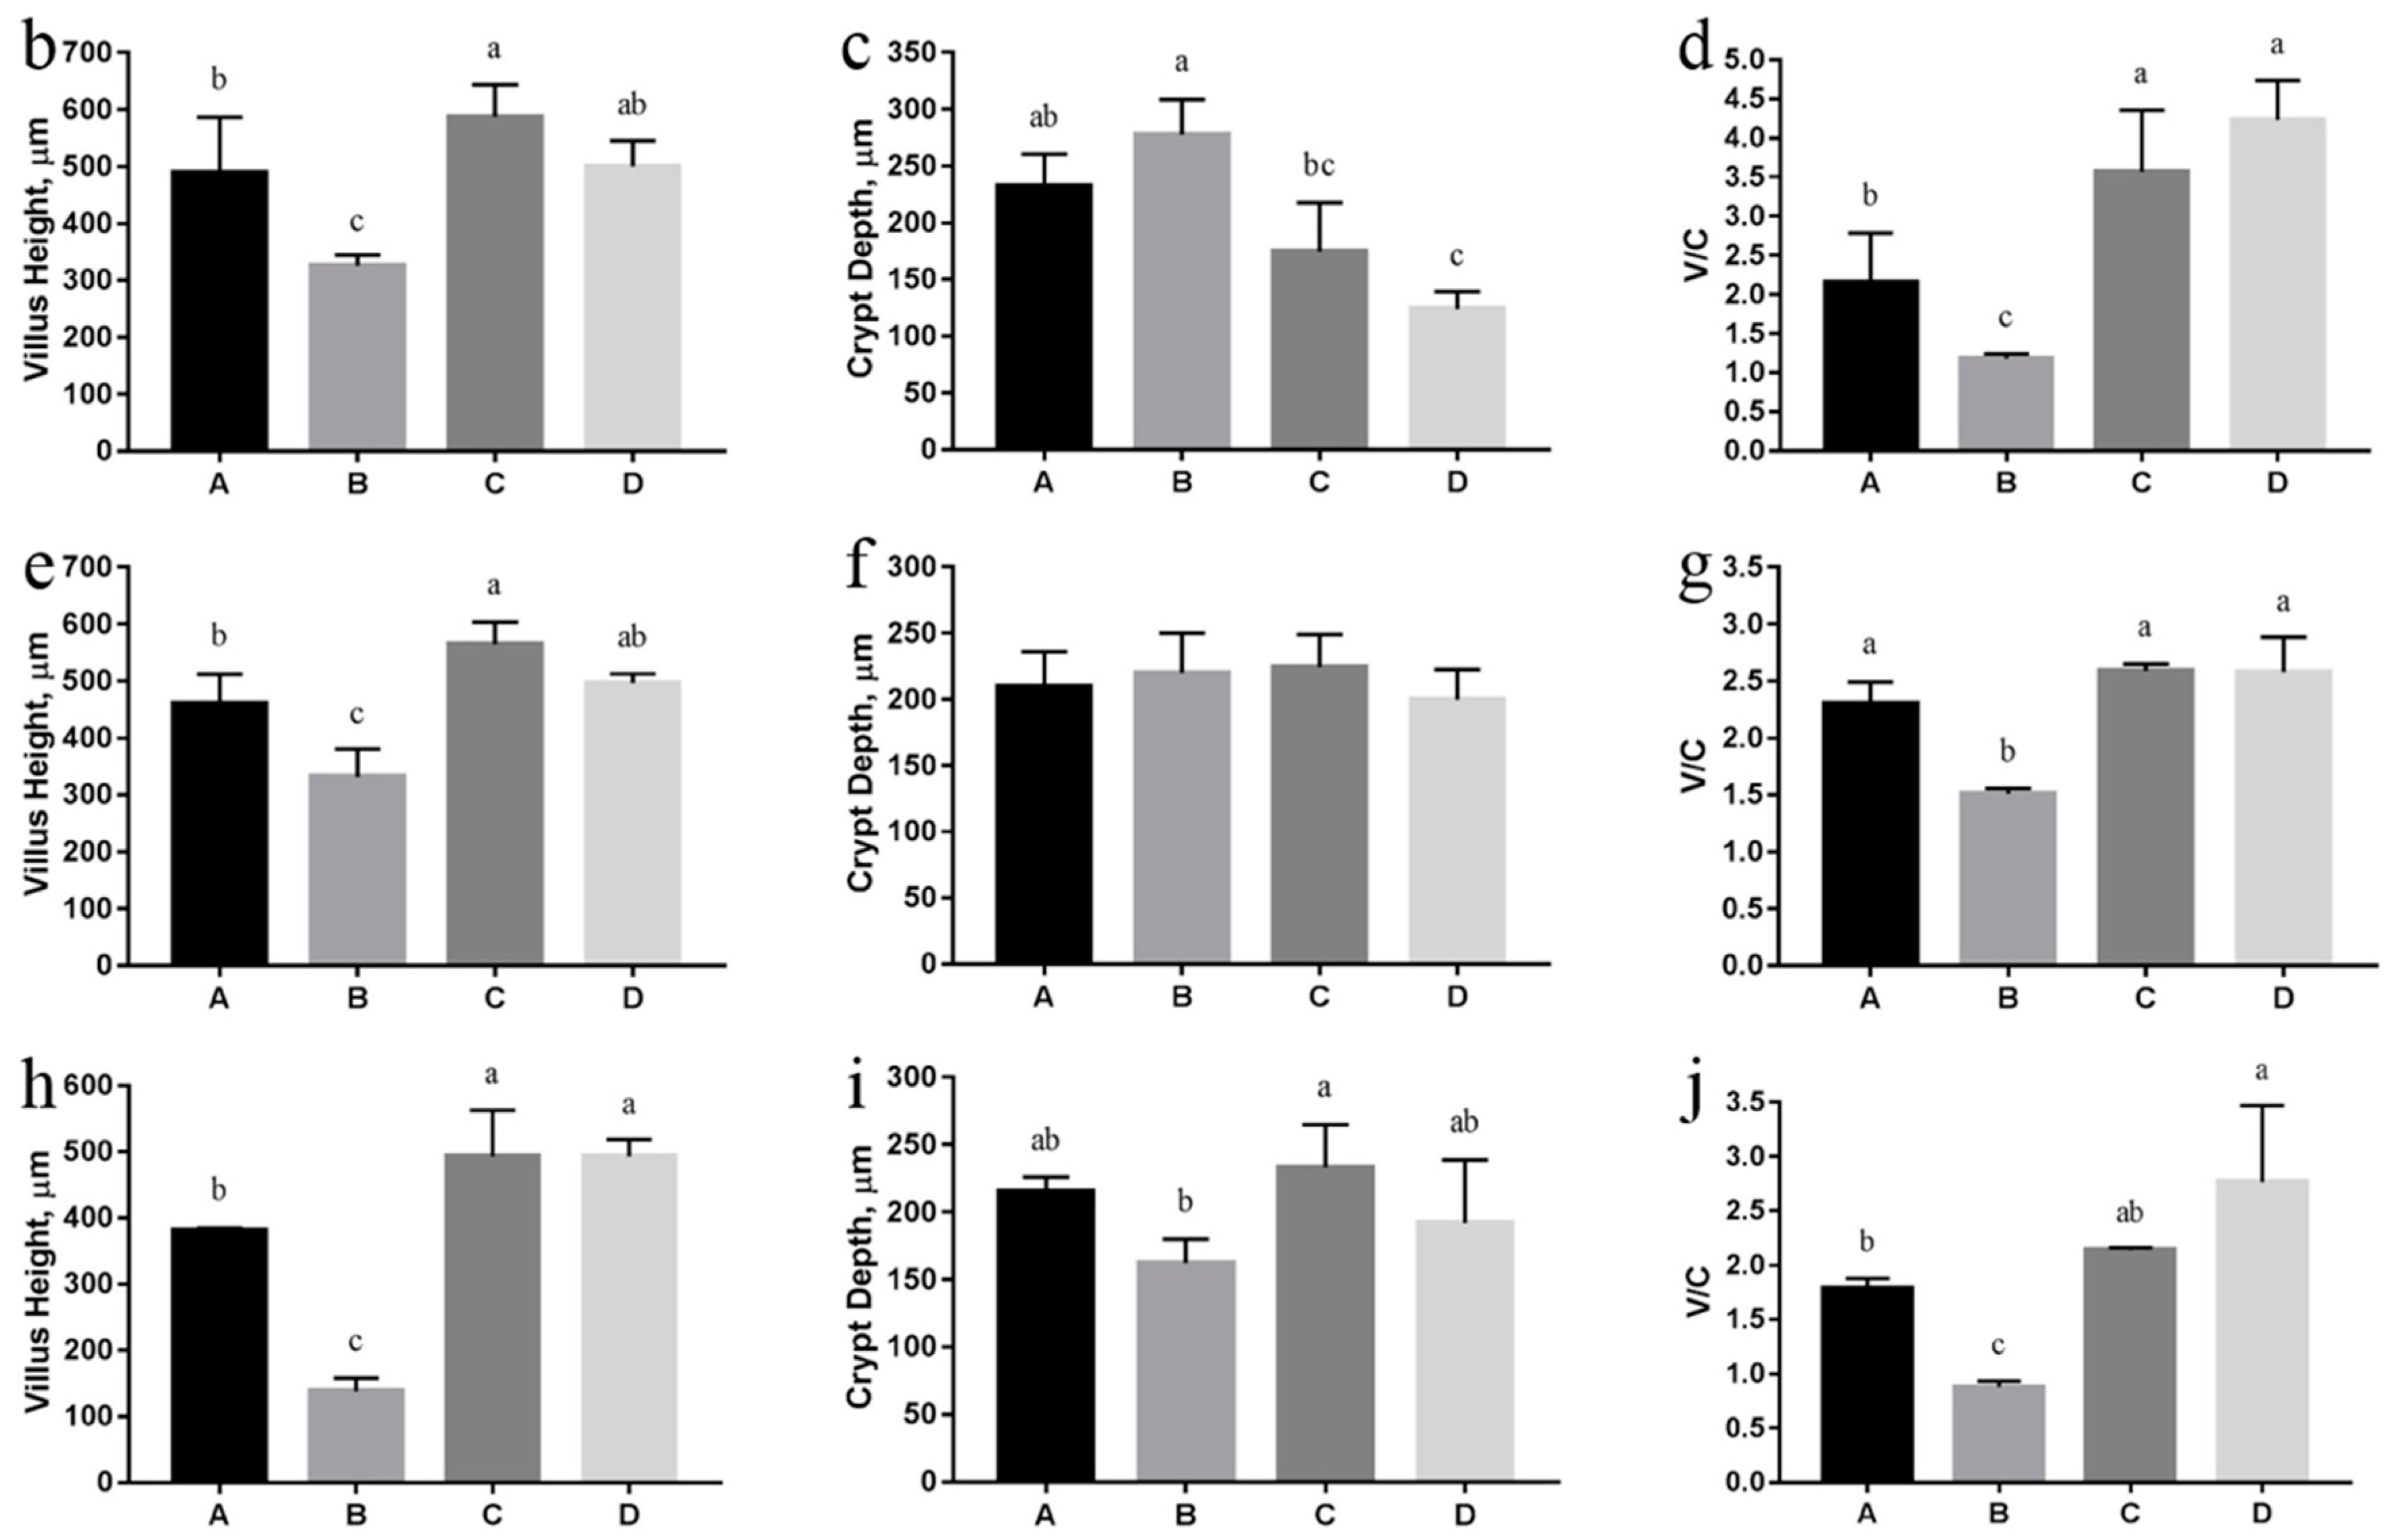
3.5. Intestinal Morphology

Light micrographs of small intestinal histomorphology are displayed in Figure 3a. It can be seen that high salt stress disturbed the morphology of gut villi. When supplemented with betaine, the damaged villi were restored. This was verified with the statistical data (Figure 3). The gut villus heights of the duodenum, jejunum and ileum were all significantly decreased in high-salt diet group (p < 0.05). However, they were higher in the betaine supplementation groups than in the control group (p < 0.05). Similar results were observed in the ratio of villus height to crypt depth (p < 0.05).

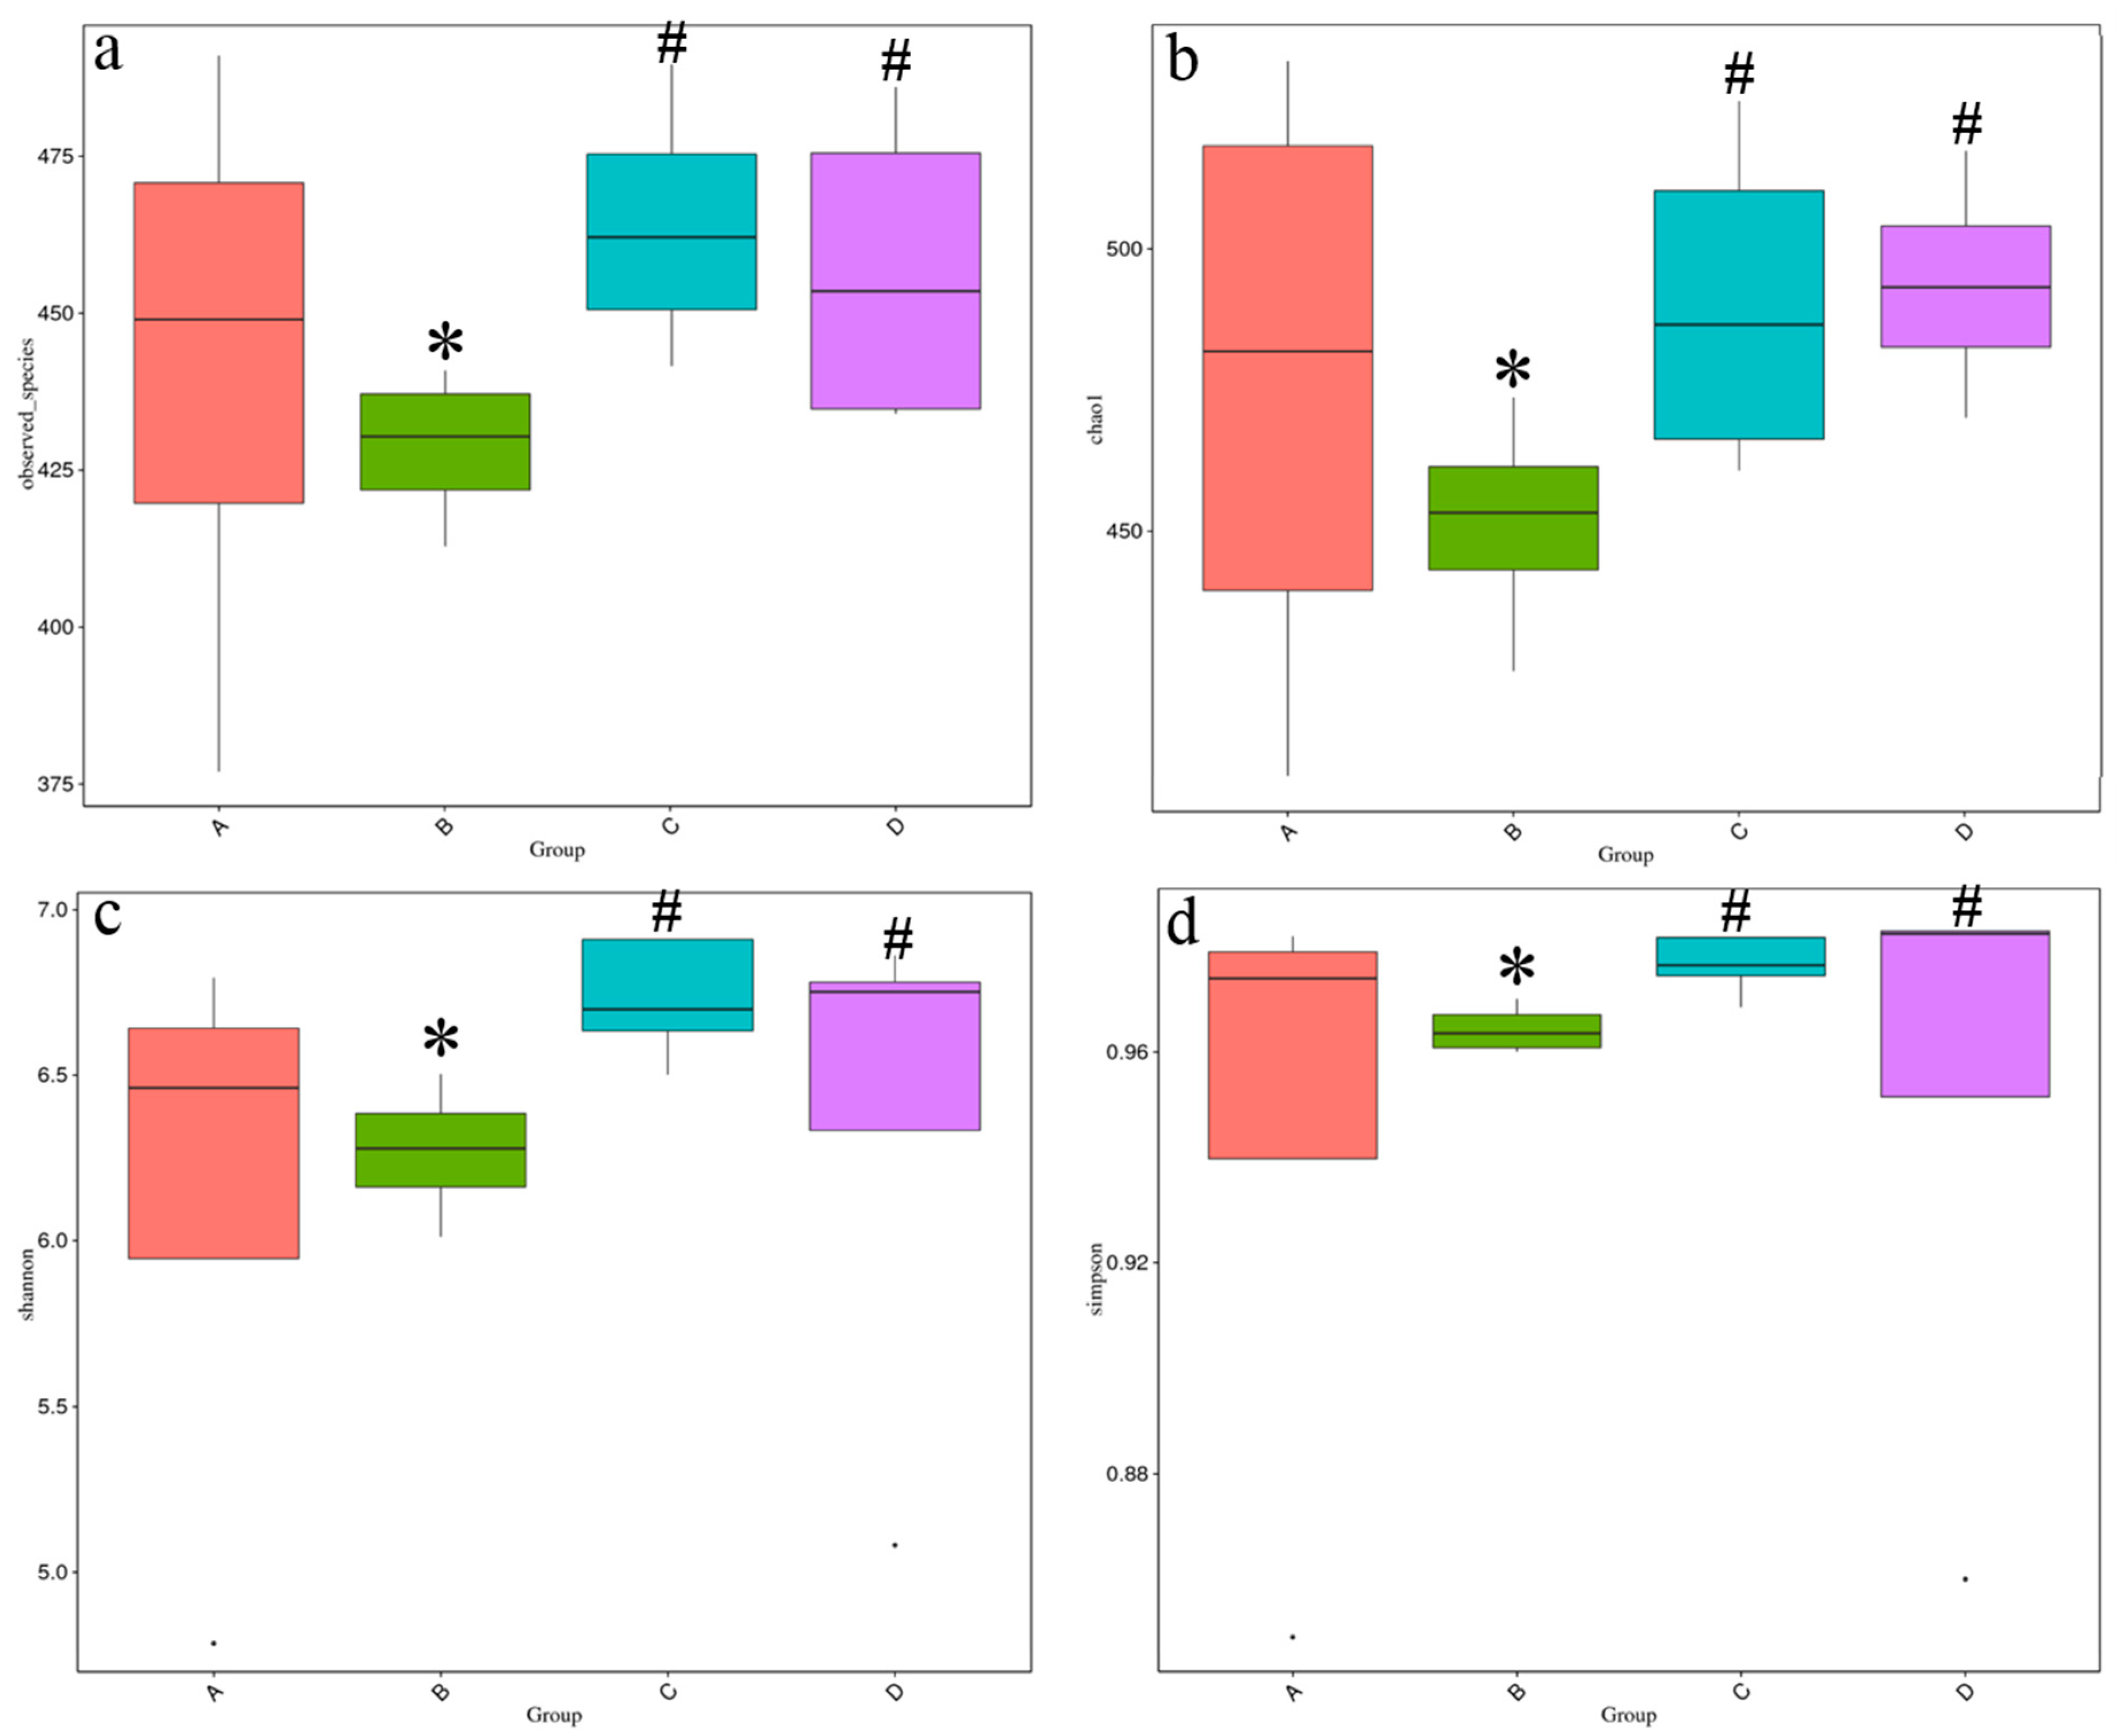
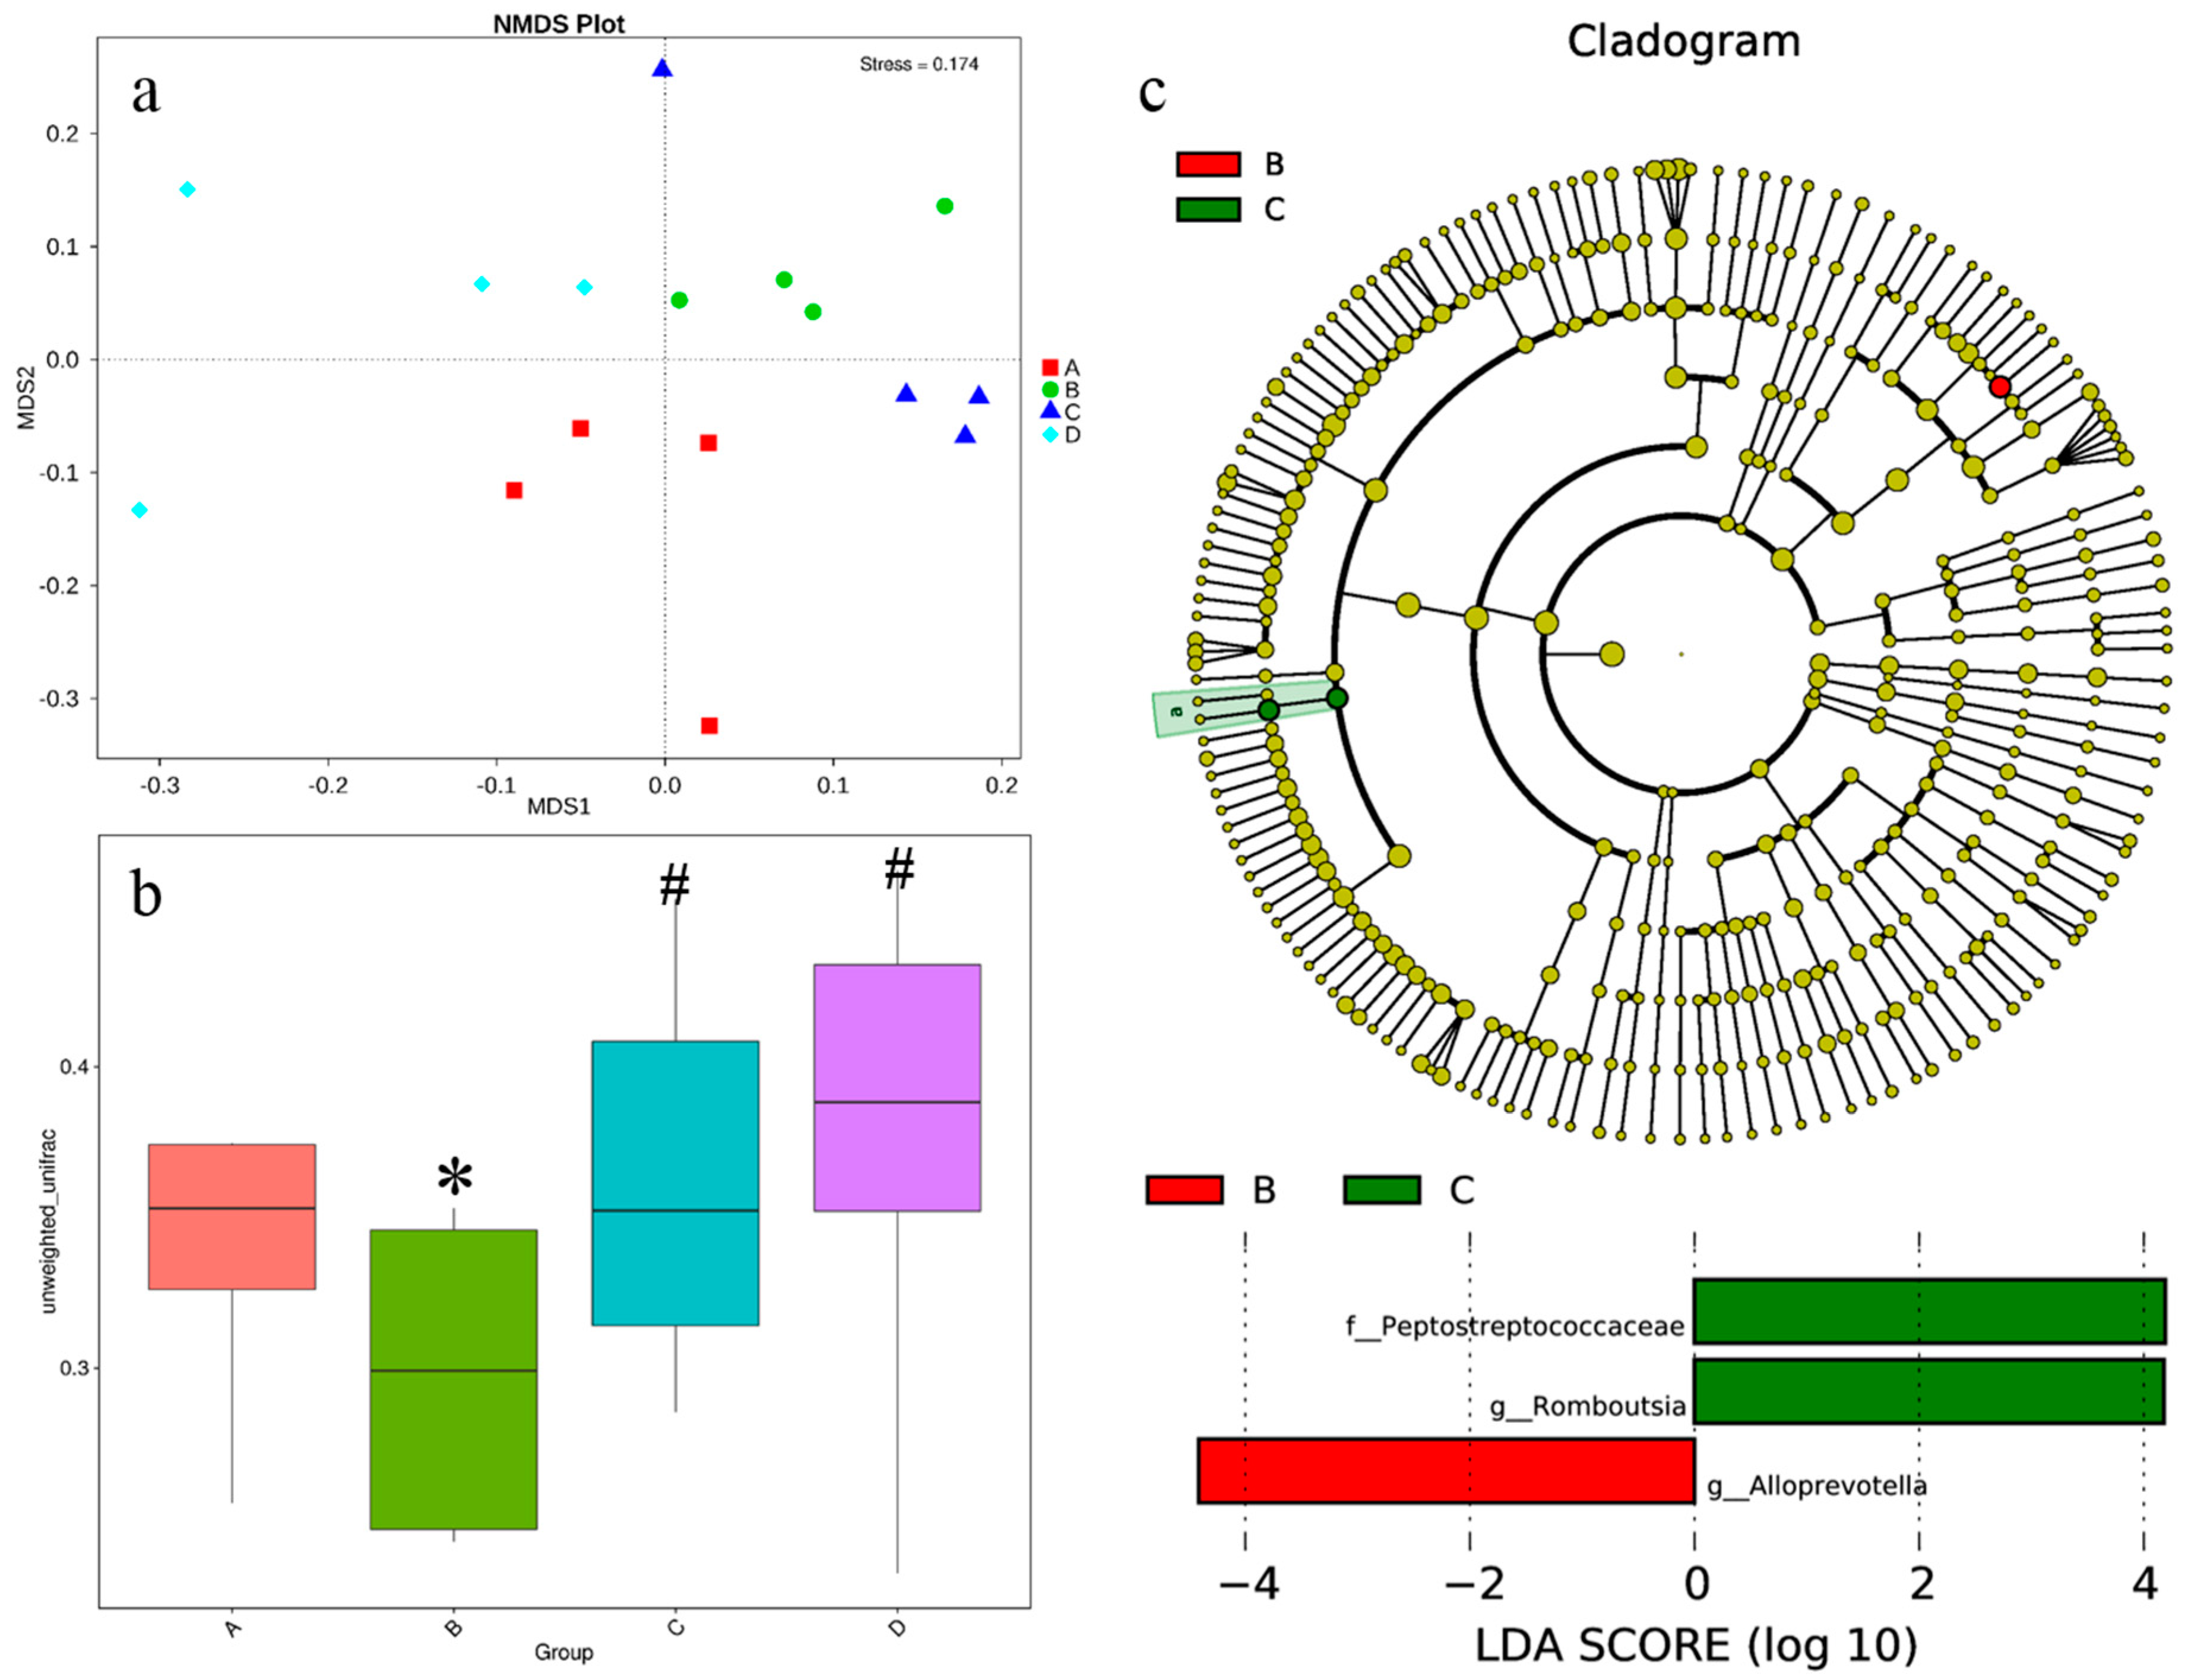
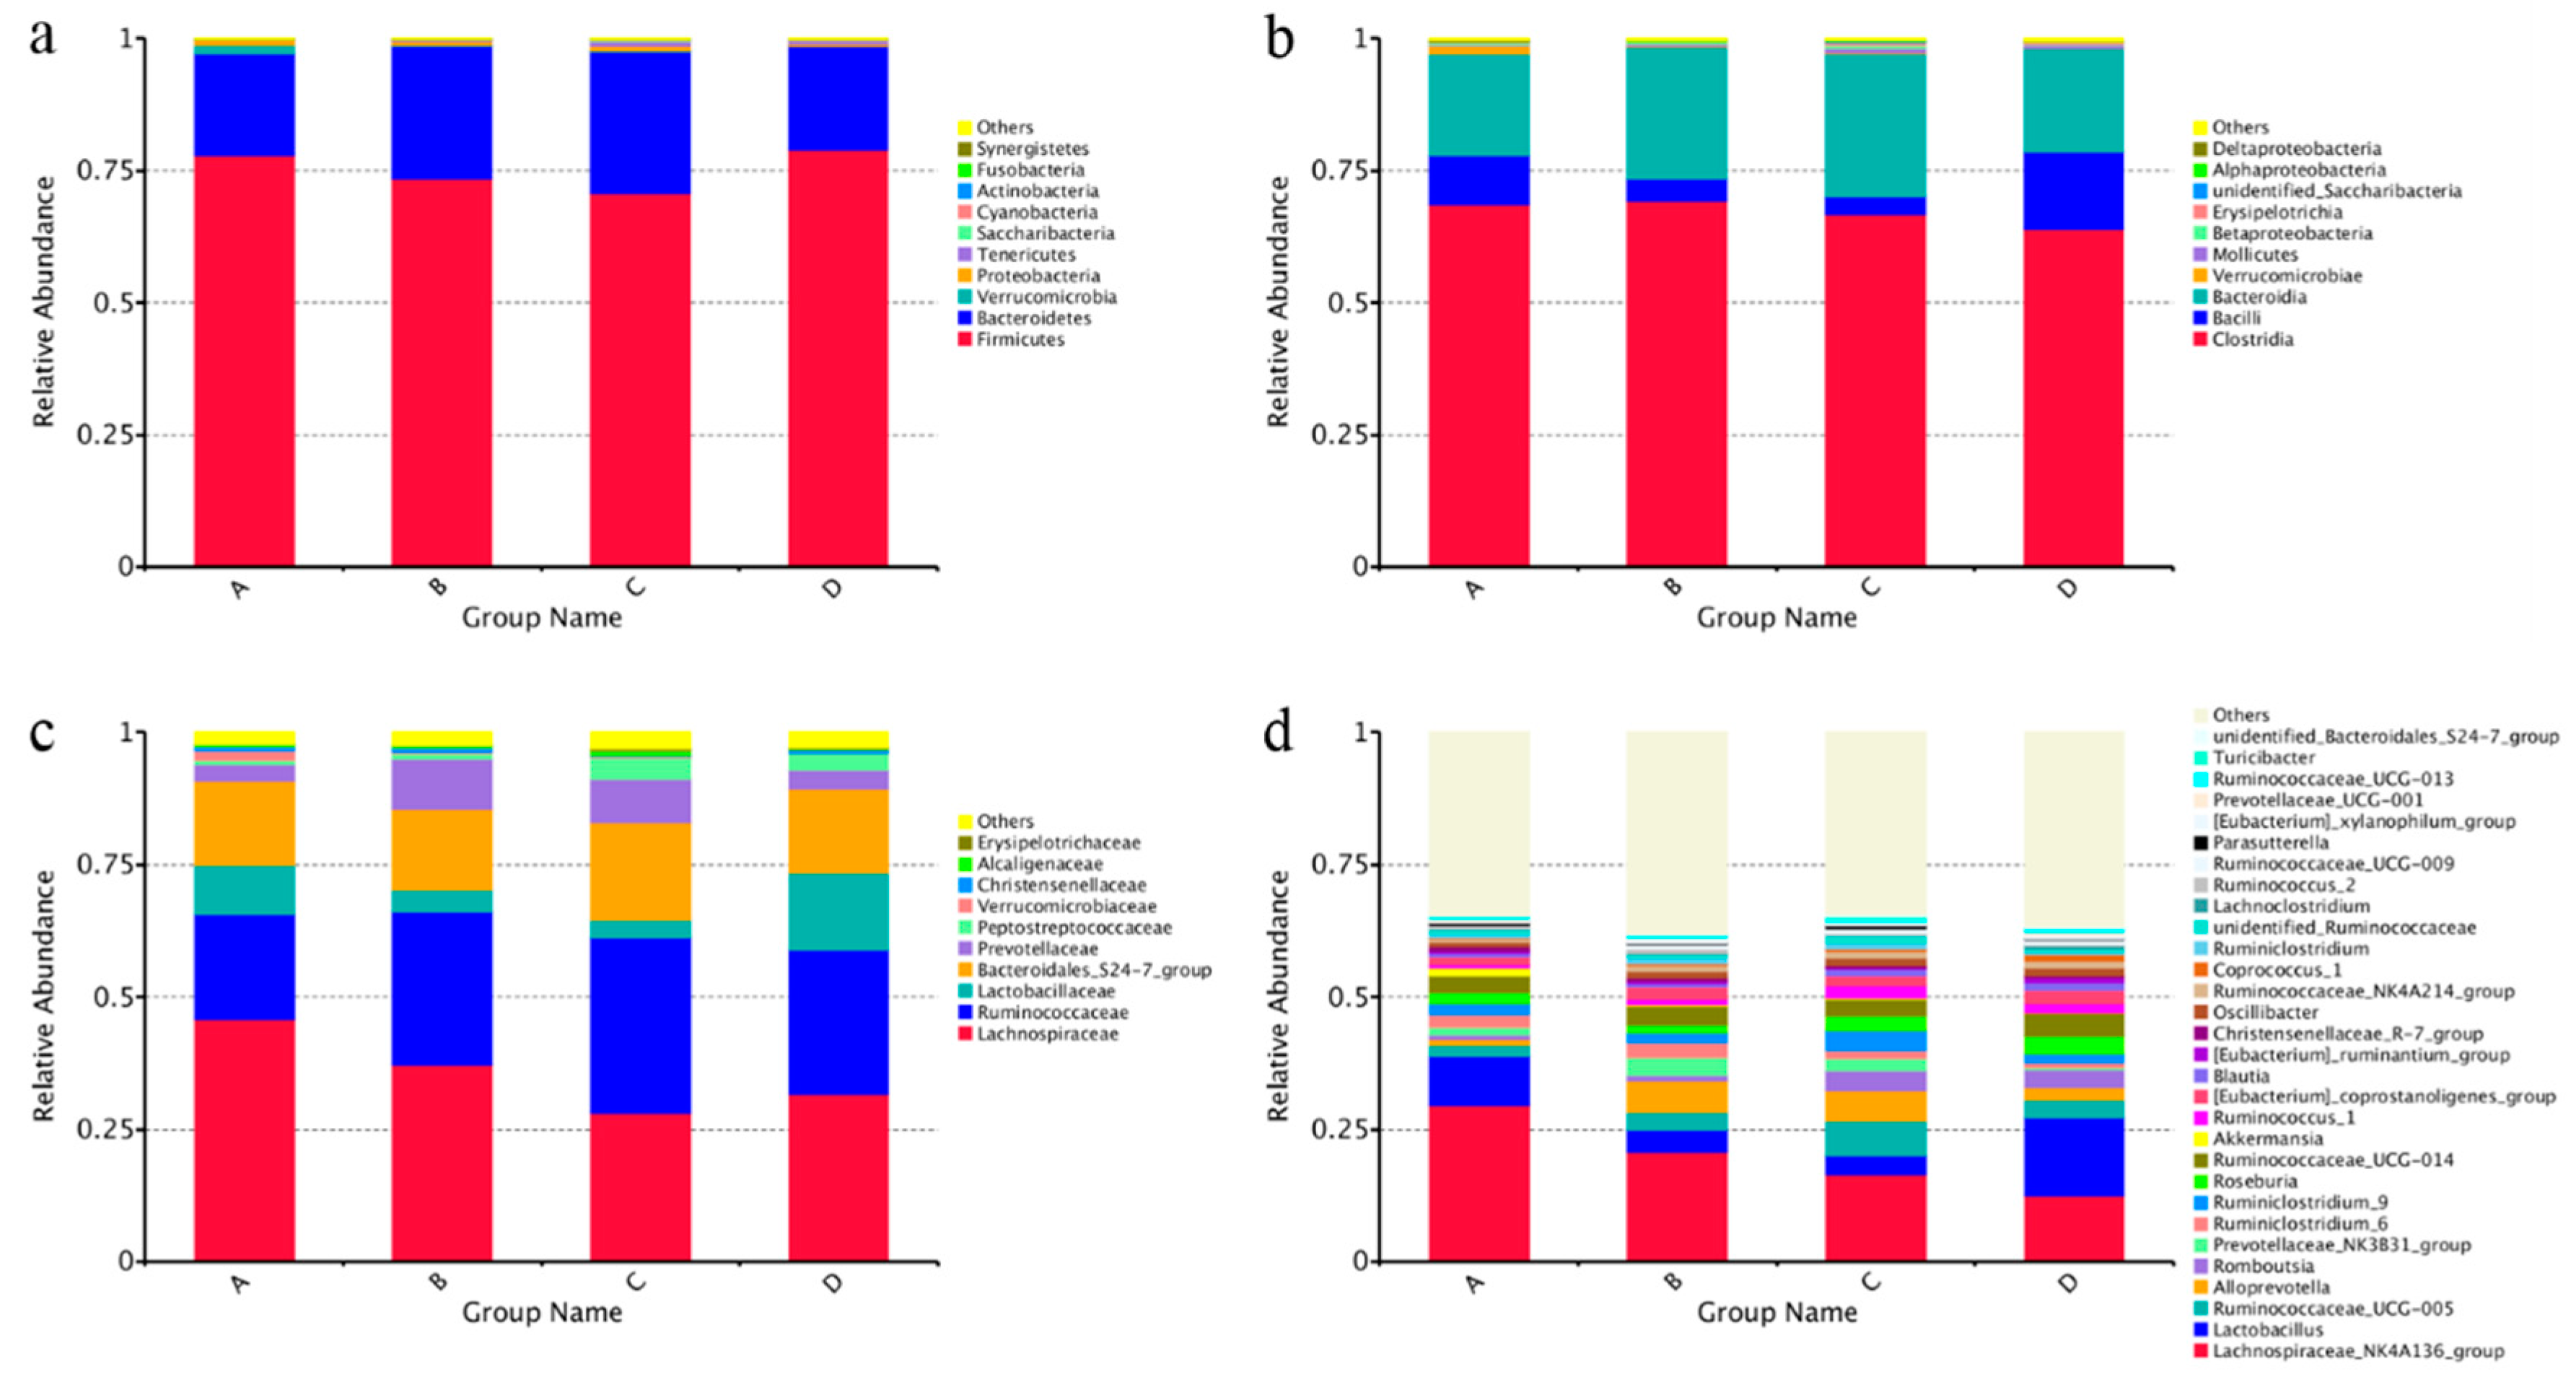
3.6. Intestinal Microbiota

Based on the high throughput sequencing, a total of 1,080,496 high-quality bacterial 16S rRNA sequences was obtained in the caecal chyme samples. Each sample yielded 67,531 sequences and 482 OTUs on average. There were fewer observed species in the high-salt stressed group than in other groups (Figure 4a). All of the alpha diversity indexes (Chao1, Shannon and Simpson indexes, Figure 4b–d) showed that high salt stress decreased the diversity of intestinal microbiota while supplementation with betaine could offset the decrease. In the NMDS plot (Figure 5a), samples from the same group had a closer distance than that between groups except that one sample in the high-salt diet supplemented with 0.5% betaine group was far away from its population. Unweighted unifrac distances were significantly altered by high salt stress (Figure 5b), which displayed a trend similar to alpha diversity indexes. LEfSe analysis showed that Alloprevotella had the greatest presence in group B, while Peptostreptococcaceae and Romboutsia were most present in group C (Figure 5c). The caecal microbiota structure is shown in Figure 6. At the phylum level (Figure 6a), the gut microbiota of all rats was dominated by Firmicutes, Bacteroidetes, Verrucomicrobia and Proteobacteria. At the class level (Figure 6b), the presence of Bacilli in group B and C was decreased, while that of Bacteroidia was increased as compared to group A and D. The presence of Verrucomicrobiae was decreased in all high-salt diet groups with or without betaine supplementation. At the family level (Figure 6c), the presence of Ruminococcaceae and Prevotellaceae in group B and C was increased while that of Lactobacillaceae was decreased as compared to group A and D. The presence of Peptostreptococcaceae was increased in both betaine supplementation groups. Lachnospiraceae and Verrucomicrobiaceae were decreased in all high-salt diet groups. At the genus level (Figure 6d), Lactobacillus in group B and C was decreased while Alloprevotella was increased as compared to group A and D. Romboutsia and Ruminiclostridium_6 were increased in both betaine supplementation groups. Lachnospiraceae_NK4A136_group and Akkermansia were decreased in all high-salt diet groups.

4. Discussion

It has long been viewed that the maintenance of osmotic balance in response to high salt intake is a passive process that is mediated largely by increased water consumption to balance the salt load [35]. The feed intake was not affected by a high-salt diet in the current experiment, however, rats in high-salt diet groups greatly increased the intake of water. We also found high excretion of urine in high-salt diet groups. Deloof et al. [36] found that salt-loaded pregnant rats were able to increase their urine flow to excrete the entire sodium intake. They also demonstrated additional evidence that the concentration of sodium in plasma was similar between the salt-loaded rats and the control group. In our study, the sodium concentration in plasma was not different among groups, which also confirmed their results. Several reports [37,38,39,40,41,42] have shown that high salt intake leads to increased water intake and increased diuresis and/or natriuresis in rats, monkeys, and humans.
Extracellular fluid volume homeostasis with regard to natriuretic regulation includes suppression of the renin–angiotensin–aldosterone System (RAAS), promotion of natriuresis, and reduction of renal nerve activities, all of which can concomitantly increase the excretion of urinary sodium and lead to an increase in the urine volume [43]. ALD is an essential mineralocorticoid hormone for sodium conservation. The level of ALD in our study was decreased in all high-salt diet groups, which also added proof that sodium was excreted in salt-loaded rats. Kitada et al. reported that high salt intake reprioritized osmolytes for body fluid conservation [43]. We found that there was an exchange of Cl- between plasma and visceral organs. The increasing water intake and urine excretion increased the burden on the kidneys. To maintain the balance of water and electrolyte metabolism, kidney developed a compensatory mechanism to support its function. This was verified by the increased kidney indexes of high-salt diet groups in our study.
An increase in plasma osmolality due to high-salt intake activated hypothalamic osmoreceptors to stimulate ADH secretion by the posterior pituitary gland [44]. The resulting increase in the level of plasma ADH leads to an increase in renal water reabsorption and a decrease in water excretion. In our study, this was verified in that high salt intake markedly increased the concentration of ADH. In the betaine supplementation group, the concentration of ADH decreased sharply. We assumed that betaine maintained body water such that less ADH was released to reabsorb water in the kidney of high-salt stressed rats. Cortisol is regarded as one of the endocrine indicators of stress [45]. Severe chronic stress results in prolonged periods of high cortisol concentration. In our study, the concentration of cortisol was significantly increased in the high-salt diet group which indicated that rats in high-salt diet group were under stress. When supplemented with betaine, cortisol concentrations fell back to normal levels, which suggested that betaine could counteract the adverse conditions caused by high salt intake.
No differences were observed in the osmolarity of the plasma, liver, kidney, luminal digesta or mucosa of small intestine among the groups in the current study. Osmotic balance is one part of the internal environment homeostasis that is rigidly monitored by the system. Though we fed rats with high-salt diet, the change in osmolarity was regulated by the neuroendocrine system. Betaine may also play a role in the regulation of osmotic homeostasis. The fluctuation of the tested endocrine hormones may be proof of this assumption. The osmotic pressure of the intestinal contents varies during the process of digestion and absorption. In our study, we found that the osmolarity of the luminal contents and the gut mucosa gradually decreased along the gastrointestinal tract. We also observed that the osmolarity of the gut mucosa was higher than that in the luminal contents of each separate tract, except in the duodenum of the high-salt stressed group. It was assumed that the difference in osmotic pressure between the intestinal luminal fluid and the epithelium was necessary to control the osmosis inside the intestinal epithelial cells [46].
The digestive enzymes, which were fundamentally proteins, were disturbed by high salt stress in our experiment, however, they were revived by the addition of betaine in a dose-dependent manner. Pollard and Wyn Jones also found the protection of betaine against salt inhibition of enzymes [47]. In the fermentation of lysine, lactate, and pullulanase, betaine could increase the activity of key cellular enzymes so as to improve the production of these products [48,49,50]. Betaine, the so-called compatible solute, could interact with macromolecules without detrimental effect and could be up- and down-regulated without disturbing cellular functions. In contrast, inorganic ions, when present at high concentrations, can destabilize proteins and nucleic acids [51]. The effect of betaine involved universal water–solute–macromolecule interactions. Destabilizing agents such as ions could bind to proteins and caused them to unfold. However, betaine was excluded from biopolymer’s surface so that the protein folded more compactly, which was called the “osmophobic” effect [52]. With the presence of osmolytes, the native state of proteins was left free to function relatively unfettered by thermodynamic focus of the osmophobic force on the denatured state [53]. This was supported by a study that established a link between the effect of betaine on water structure and the ability to stabilize protein structure [54]. Pollard and Wyn Jones found that sequential N-methylation from glycine to betaine increased the effectiveness of protection [47]. They also noted that the protection may be limited to certain enzymes and generalizations may be inappropriate.
In our experiment, the gut villi were seriously affected by high salt stress. High salt decreased the length of villi and increased the thickness of crypts. When supplemented with betaine, the histomorphology of gut microstructure was greatly improved. The ratio of villus height to crypt depth also showed similar results. Kettunen et al. [55] also found that dietary betaine supplementation increased the epithelial villus–crypt ratio in bird gut and they thought the improved mucosal structure was due to both the methyl group donor nature and the osmotic nature of betaine. Moreover, Hooper found that gut microbiota also contributed to the development of the intestinal villi [56]. In our study, the developmental trend of intestinal microstructure was in line with the diversity of gut microbiota.
Because of the close relationship between intestinal microbial flora and the host in nutrient absorption, colonization resistance, immune function and so on, intestinal microbiota has received increasing attention in recent years and was even presumed as an essential organ [57]. In this study, we used high salt as a hazard element to test the effect of betaine on gut microbiota. The results showed that the diversity of cecum microbes was decreased in high-salt stressed group and that it could be recovered with the presence of betaine. LEfSe analysis showed that Alloprevotella levels were the highest in the high-salt stressed group, while Peptostreptococcaceae and Romboutsia were most present in the betaine-supplemented group. Alloprevotella, which is obligately anaerobic, non-motile, and Gram-negative, is weakly to moderately saccharolytic, and the major end products of fermentation are acetic and succinic acids [58]. Romboutsia is anaerobic and produces acetate and formate as end products of fermentation [59]. Romboutsia belongs to the family of Peptostreptococcaceae which is dominant in rat ileum microbiota [60].
Bielinska and coworkers found that a high-salt diet altered the intestinal bacteria composition and produced gut dysbiosis in rats [61]. It is reasonable that salt could produce a hyperosmotic environment to inhibit bacterial proliferation, and it has long been used as an antiseptic and food preservative. In fact, the ability of bacteria to adapt to changes in external osmolarity directly determines their survival rate and proliferation [62]. High salt intake may favor the propagation of some bacterial strains over others due to the difference in salt tolerance between bacterial strains [63]. We assumed that in the high-salt stressed environment, betaine could not only regulate the osmotic microenvironment for the microbes to survive, but also provide extra sources of carbon and nitrogen for the microbes to live and grow. We also observed that some microbes in 0.5% betaine group had a similar abundance to the high-salt stressed group, while others in 1.0% betaine group had a similar abundance to the control group. This may be due to the dose-dependent effect whereby the concentration of betaine at 0.5% was insufficient for the stressed microbes to recover while betaine at 1.0% concentration could enable the microbes to revive to the normal level.

5. Conclusions

In summary, as a potent organic osmolyte, betaine can cooperate with endocrine hormones to regulate water and electrolyte metabolism and could play a role in osmoregulation to permit cellular adaptation to adverse osmotic environments. Betaine improves intestinal functions by enhancing the digestive enzymes, ameliorating intestinal morphology, and enriching intestinal microbiota of high-salt stressed rats.

Author Contributions

Conceptualization, H.W. and J.F.; Methodology, H.W. and J.F.; Validation, S.L., S.F. and X.Y.; Formal Analysis, H.W. and S.L.; Investigation, H.W.; Resources, J.F.; Data Curation, S.F.; Writing—Original Draft Preparation, H.W.; Writing—Review and Editing, X.Y. and J.F.; Supervision, J.F.

Funding

This research was funded by the Special Fund for Agro-scientific Research in the Public Interest of China (No. 201403047), and Zhejiang Provincial Key Science Project (No. 2015C03006, 2015C02G2010061).

Acknowledgments

The authors would like to thank Healthy Husbandry Sci-tech Co., Ltd. (Hangzhou, China) for their donation of betaine.

Conflicts of Interest

The authors declare no conflict of interest.

References

  1. De Zwart, F.J.; Slow, S.; Payne, R.J.; Lever, M.; George, P.M.; Gerrard, J.A.; Chambers, S.T. Glycine betaine and glycine betaine analogues in common foods. Food Chem. 2003, 83, 197–204. [Google Scholar] [CrossRef]
  2. Zeisel, S.H.; Mar, M.; Howe, J.C.; Holden, J.M. Concentrations of choline-containing compounds and betaine in common foods. J. Nutr. 2003, 133, 1302–1307. [Google Scholar] [CrossRef] [PubMed]
  3. Craig, S. Betaine in human nutrition. Am. J. Clin. Nutr. 2004, 80, 539–549. [Google Scholar] [CrossRef] [PubMed] [Green Version]
  4. Xu, L.; Huang, D.; Hu, Q.; Wu, J.; Wang, Y.; Feng, J. Betaine alleviates hepatic lipid accumulation via enhancing hepatic lipid export and fatty acid oxidation in rats fed with a high-fat diet. Br. J. Nutr. 2015, 113, 1835–1843. [Google Scholar] [CrossRef] [PubMed]
  5. Neuschwander-Tetri, B.A. Betaine: An old therapy for a new scourge. Am. J. Gastroenterol. 2001, 96, 2534–2536. [Google Scholar] [CrossRef] [PubMed]
  6. Patrick, L. Nonalcoholic fatty liver disease: Relationship to insulin sensitivity and oxidative stress. Treatment approaches using vitamin E, magnesium, and betaine. Altern. Med. Rev. J. Clin. Ther. 2002, 7, 276–291. [Google Scholar]
  7. Tokar, J.L.; Berg, C.L. Therapeutic Options in Nonalcoholic Fatty Liver Disease. Curr. Treat. Opt. Gastroenterol. 2002, 5, 425–436. [Google Scholar] [CrossRef]
  8. Day, C.R.; Kempson, S.A. Betaine chemistry, roles, and potential use in liver disease. Biochim. Biophys. Acta (BBA) Gen. Subj. 2016, 1860, 1098–1106. [Google Scholar] [CrossRef] [PubMed] [Green Version]
  9. Kappes, R.M.; Kempf, B.; Bremer, E. Three transport systems for the osmoprotectant glycine betaine operate in Bacilluss subtilis: Characterization of OpuD. J. Bacteriol. 1996, 178, 5071–5079. [Google Scholar] [CrossRef] [PubMed]
  10. Csonka, L.N. Physiological and genetic responses of bacteria to osmotic-stress. Microbiol. Rev. 1989, 53, 121–147. [Google Scholar] [PubMed]
  11. Yancey, P.H. Living with Water Stress: Evolution of Osmolyte Systems. Science 1982, 217, 1214–1222. [Google Scholar] [CrossRef] [PubMed]
  12. Wright, S.H.; Wunz, T.M.; Silva, A.L. Betaine transport in the gill of a marine mussel, mytilus-californianus. Am. J. Physiol. 1992, 263, r226–r232. [Google Scholar] [CrossRef] [PubMed]
  13. Dawson, K.M.; Baltz, J.M. Organic osmolytes and embryos: Substrates of the Gly and beta transport systems protect mouse zygotes against the effects of raised osmolarity. Biol. Reprod. 1997, 56, 1550–1558. [Google Scholar] [CrossRef] [PubMed]
  14. Oyaas, K.; Ellingsen, T.E.; Dyrset, N.; Levine, D.W. Transport of osmoprotective compounds in hybridoma cells exposed to hyperosmotic stress. Cytotechnology 1995, 17, 143–151. [Google Scholar] [CrossRef] [PubMed]
  15. Weik, C.; Warskulat, U.; Bode, J.; Peters-Regehr, T.; Haussinger, D. Compatible organic osmolytes in rat liver sinusoidal endothelial cells. Hepatology 1998, 27, 569–575. [Google Scholar] [CrossRef] [PubMed]
  16. Wettstein, M.; Weik, C.; Holneicher, C.; Haussinger, D. Betaine as an osmolyte in rat liver: Metabolism and cell-to-cell interactions. Hepatology 1998, 27, 787–793. [Google Scholar] [CrossRef] [PubMed] [Green Version]
  17. Peters-Regehr, T.; Bode, J.G.; Kubitz, R.; Haussinger, D. Organic osmolyte transport in quiescent and activated rat hepatic stellate cells (Ito cells). Hepatology 1999, 29, 173–180. [Google Scholar] [CrossRef] [PubMed]
  18. Petronini, P.G.; De Angelis, E.M.; Borghetti, P.; Borghetti, A.F.; Wheeler, K.P. Modulation by betaine of cellular responses to osmotic stress. Biochem. J. 1992, 282, 69–73. [Google Scholar] [CrossRef] [PubMed] [Green Version]
  19. Sales, J. A meta-analysis of the effects of dietary betaine supplementation on finishing performance and carcass characteristics of pigs. Anim. Feed Sci. Technol. 2011, 165, 68–78. [Google Scholar] [CrossRef]
  20. Kidd, M.T.; Garlich, P. Nutritional and osmoregulatory functions of betaine. World Poult. Sci. J. 1997, 53, 125–139. [Google Scholar] [CrossRef]
  21. Ratriyanto, A.; Mosenthin, R.; Bauer, E.; Eklund, M. Metabolic, osmoregulatory and nutritional functions of betaine in monogastric animals. Asian Australas. J. Anim. Sci. 2009, 22, 1461–1476. [Google Scholar] [CrossRef]
  22. Fetterer, R.H.; Augustine, P.C.; Allen, P.C.; Barfield, R.C. The effect of dietary betaine on intestinal and plasma levels of betaine in uninfected and coccidia-infected broiler chicks. Parasitol. Res. 2003, 90, 343–348. [Google Scholar] [CrossRef] [PubMed]
  23. Augustine, P.C.; Danforth, H.D. Influence of betaine and salinomycin on intestinal absorption of methionine and glucose and on the ultrastructure of intestinal cells and parasite developmental stages in chicks infected with Eimeria acervulina. Avian Dis. 1999, 43, 89–97. [Google Scholar] [CrossRef] [PubMed]
  24. Ferket, P.R. Flushing syndrome in commercial turkeys during the grow-out stage. In Proceedings of the Smithkline Beecham Pacesetter Conference, National Turkey Federation Annual Meeting, Orlando, FL, USA, 10 January 1995. [Google Scholar]
  25. Reeves, P.G.; Nielsen, F.H.; Fahey, G.C. AIN-93 purified diets for laboratory rodents—Final report of the American institute of nutrition ad hoc writing committee on the reformulation of the AIN-76a rodent diet. J. Nutr. 1993, 123, 1939–1951. [Google Scholar] [CrossRef] [PubMed]
  26. Klasing, K.C.; Adler, K.L.; Remus, J.C.; Calvert, C.C. Dietary betaine increases intraepithelial lymphocytes in the duodenum of coccidia-infected chicks and increases functional properties of phagocytes. J. Nutr. 2002, 132, 2274–2282. [Google Scholar] [CrossRef] [PubMed]
  27. Magoc, T.; Salzberg, S.L. FLASH: Fast length adjustment of short reads to improve genome assemblies. Bioinformatics 2011, 27, 2957–2963. [Google Scholar] [CrossRef] [PubMed]
  28. Bokulich, N.A.; Subramanian, S.; Faith, J.J.; Gevers, D.; Gordon, J.I.; Knight, R.; Mills, D.A.; Caporaso, J.G. Quality-filtering vastly improves diversity estimates from Illumina amplicon sequencing. Nat. Methods 2013, 10, 11–57. [Google Scholar] [CrossRef] [PubMed]
  29. Caporaso, J.G.; Kuczynski, J.; Stombaugh, J.; Bittinger, K.; Bushman, F.D.; Costello, E.K.; Fierer, N.; Pena, A.G.; Goodrich, J.K.; Gordon, J.I.; et al. QIIME allows analysis of high-throughput community sequencing data. Nat. Methods 2010, 7, 335–336. [Google Scholar] [CrossRef] [PubMed] [Green Version]
  30. Edgar, R.C.; Haas, B.J.; Clemente, J.C.; Quince, C.; Knight, R. UCHIME improves sensitivity and speed of chimera detection. Bioinformatics 2011, 27, 2194–2200. [Google Scholar] [CrossRef] [PubMed] [Green Version]
  31. Edgar, R.C. UPARSE: Highly accurate OTU sequences from microbial amplicon reads. Nat. Methods 2013, 10, 996–998. [Google Scholar] [CrossRef] [PubMed]
  32. Wang, Q.; Garrity, G.M.; Tiedje, J.M.; Cole, J.R. Naive Bayesian classifier for rapid assignment of rRNA sequences into the new bacterial taxonomy. Appl. Environ. Microbiol. 2007, 73, 5261–5267. [Google Scholar] [CrossRef] [PubMed]
  33. DeSantis, T.Z.; Hugenholtz, P.; Larsen, N.; Rojas, M.; Brodie, E.L.; Keller, K.; Huber, T.; Dalevi, D.; Hu, P.; Andersen, G.L. Greengenes, a chimera-checked 16S rRNA gene database and workbench compatible with ARB. Appl. Environ. Microbiol. 2006, 72, 5069–5072. [Google Scholar] [CrossRef] [PubMed] [Green Version]
  34. Yue, J.C.; Clayton, M.K. A similarity measure based on species proportions. Commun. Stat.-Theory Methods 2005, 34, 2123–2131. [Google Scholar] [CrossRef]
  35. Zeidel, M.L. Salt and water: Not so simple. J. Clin. Investig. 2017, 127, 1625–1626. [Google Scholar] [CrossRef] [PubMed]
  36. Deloof, S.; De Seze, C.; Montel, V.; Chatelain, A. Atrial natriuretic peptide and aldosterone secretions, and atrial natriuretic peptide-binding sites in kidneys and adrenal glands of pregnant and fetal rats in late gestation in response to a high-salt diet. Eur. J. Endocrinol. 2000, 142, 524–532. [Google Scholar] [CrossRef] [PubMed] [Green Version]
  37. Wilck, N.; Matus, M.G.; Kearney, S.M.; Olesen, S.W.; Forslund, K.; Bartolomaeus, H.; Haase, S.; Mähler, A.; Balogh, A.; Markó, L.; et al. Salt-responsive gut commensal modulates TH17 axis and disease. Nature 2017, 551, 585–589. [Google Scholar] [CrossRef] [PubMed]
  38. Leandro, S.M.; Furukawa, L.N.S.; Shimizu, M.H.M.; Casarini, D.E.; Seguro, A.C.; Patriarca, G.; Coelho, M.S.; Dolnikoff, M.S.; Heimann, J.C. Low birth weight in response to salt restriction during pregnancy is not due to alterations in uterine-placental blood flow or the placental and peripheral renin–angiotensin system. Physiol. Behav. 2008, 95, 145–151. [Google Scholar] [CrossRef] [PubMed]
  39. Wolf, K.; Kurtz, A. Influence of salt intake on atrial natriuretic peptide gene expression in rats. Pflugers Arch. Eur. J. Physiol. 1997, 433, 809–816. [Google Scholar] [CrossRef] [PubMed]
  40. Bub, A.; Rechkemmer, G.; Hock, D.; Forssmann, W.G. Urodilatin secretion in salt-loaded Wistar rats. Eur. J. Med. Res. 1996, 1, 417–424. [Google Scholar] [PubMed]
  41. Mcknight, J.A.; Roberts, G.; Sheridan, B.; Atkinson, A.B. The effect of low and high sodium diets on plasma atrial-natriuretic-factor, the renin-aldosterone system and blood-pressure in subjects with essential-hypertension. Clin. Endocrinol. 1994, 40, 73–77. [Google Scholar] [CrossRef]
  42. Seymour, A.A.; Asaad, M.M.; Abboaoffei, B.; Smith, P.L.; Rogers, W.L. Sodium loads enhance the natriuretic responses to atrial-natriuretic-peptide and neutral endopeptidase inhibitors in conscious cynomolgus monkeys. Clin. Exp. Pharmacol. Physiol. 1994, 21, 845–856. [Google Scholar] [CrossRef] [PubMed]
  43. Kitada, K.; Daub, S.; Zhang, Y.; Klein, J.D.; Nakano, D.; Pedchenko, T.; Lantier, L.; LaRocque, L.M.; Marton, A.; Neubert, P.; et al. High salt intake reprioritizes osmolyte and energy metabolism for body fluid conservation. J. Clin. Investig. 2017, 127, 1944–1959. [Google Scholar] [CrossRef] [PubMed] [Green Version]
  44. Knepper, M.A.; Kwon, T.H.; Nielsen, S. Molecular Physiology of Water Balance. N. Engl. J. Med. 2015, 372, 1349–1358. [Google Scholar] [CrossRef] [PubMed]
  45. Möstl, E.; Palme, R. Hormones as indicators of stress. Domest. Anim. Endocrinol. 2002, 23, 67–74. [Google Scholar] [CrossRef]
  46. Kettunen, H.; Peuranen, S.; Tiihonen, K. Betaine aids in the osmoregulation of duodenal epithelium of broiler chicks, and affects the movement of water across the small intestinal epithelium in vitro. Comp. Biochem. Physiol. A Mol. Integr. Physiol. 2001, 129, 595–603. [Google Scholar] [CrossRef]
  47. Pollard, A.; Wyn Jones, R. Enzyme activities in concentrated solutions of glycinebetaine and other solutes. Planta 1979, 144, 291–298. [Google Scholar] [CrossRef] [PubMed]
  48. Xu, J.; Xia, X.; Zhang, J.; Guo, Y.; Zhang, W. An Overlooked Effect of Glycine Betaine on Fermentation: Prevents Caramelization and Increases the L-Lysine Production. J. Microbiol. Biotechnol. 2014, 24, 1368–1376. [Google Scholar] [CrossRef] [PubMed]
  49. Zou, H.; Wu, Z.; Xian, M.; Liu, H.; Cheng, T.; Cao, Y. Not only osmoprotectant: Betaine increased lactate dehydrogenase activity and L-lactate production in lactobacilli. Bioresour. Technol. 2013, 148, 591–595. [Google Scholar] [CrossRef] [PubMed]
  50. Duan, X.; Chen, J.; Wu, J. Optimization of pullulanase production in Escherichia coli by regulation of process conditions and supplement with natural osmolytes. Bioresour. Technol. 2013, 146, 379–385. [Google Scholar] [CrossRef] [PubMed]
  51. Kultz, D.; Chakravarty, D. Hyperosmolality in the form of elevated NaCl but not urea causes DNA damage in murine kidney cells. Proc. Natl. Acad. Sci. USA 2001, 98, 1999–2004. [Google Scholar] [CrossRef] [PubMed] [Green Version]
  52. Auton, M.; Rösgen, J.; Sinev, M.; Holthauzen, L.M.F.; Bolen, D.W. Osmolyte effects on protein stability and solubility: A balancing act between backbone and side-chains. Biophys. Chem. 2011, 159, 90–99. [Google Scholar] [CrossRef] [PubMed] [Green Version]
  53. Bolen, D.W.; Baskakov, I.V. The osmophobic effect: Natural selection of a thermodynamic force in protein folding. J. Mol. Biol. 2001, 310, 955–963. [Google Scholar] [CrossRef] [PubMed]
  54. Bruzdziak, P.; Panuszko, A.; Stangret, J. Influence of Osmolytes on Protein and Water Structure: A Step to Understanding the Mechanism of Protein Stabilization. J. Phys. Chem. B 2013, 117, 11502–11508. [Google Scholar] [CrossRef] [PubMed]
  55. Kettunen, H.; Tiihonen, K.; Peuranen, S.; Saarinen, M.T.; Remus, J.C. Dietary betaine accumulates in the liver and intestinal tissue and stabilizes the intestinal epithelial structure in healthy and coccidia-infected broiler chicks. Comp. Biochem. Physiol. A Mol. Integr. Physiol. 2001, 130, 759–769. [Google Scholar] [CrossRef]
  56. Hooper, L.V. Bacterial contributions to mammalian gut development. Trends Microbiol. 2004, 12, 129–134. [Google Scholar] [CrossRef] [PubMed]
  57. Moya, A.; Ferrer, M. Functional Redundancy-Induced Stability of Gut Microbiota Subjected to Disturbance. Trends Microbiol. 2016, 24, 402–413. [Google Scholar] [CrossRef] [PubMed]
  58. Downes, J.; Dewhirst, F.E.; Tanner, A.C.R.; Wade, W.G. Description of Alloprevotella rava gen. nov., sp. nov., isolated from the human oral cavity, and reclassification of Prevotella tannerae Moore et al. 1994 as Alloprevotella tannerae gen. nov., comb. nov. Int. J. Syst. Evol. Microbiol. 2013, 63, 1214–1218. [Google Scholar] [CrossRef] [PubMed]
  59. Gerritsen, J.; Fuentes, S.; Grievink, W.; van Niftrik, L.; Tindall, B.J.; Timmerman, H.M.; Rijkers, G.T.; Smidt, H. Characterization of Romboutsia ilealis gen. nov., sp. nov., isolated from the gastro-intestinal tract of a rat, and proposal for the reclassification of five closely related members of the genus Clostridium into the genera Romboutsia gen. nov., Intestinibacter gen. nov., Terrisporobacter gen. nov. and Asaccharospora gen. nov. Int. J. Syst. Evol. Microbiol. 2014, 64, 1600–1616. [Google Scholar] [PubMed]
  60. Gerritsen, J.; Hornung, B.; Renckens, B.; van Hijum, S.A.F.T.; Martins Dos Santos, V.A.P.; Rijkers, G.T.; Schaap, P.J.; de Vos, W.M.; Smidt, H. Genomic and functional analysis of Romboutsia ilealis CRIBT reveals adaptation to the small intestine. PeerJ 2017, 5, e3698. [Google Scholar] [CrossRef] [PubMed]
  61. Bielinska, K.; Radkowski, M.; Grochowska, M.; Perlejewski, K.; Huc, T.; Jaworska, K.; Motooka, D.; Nakamura, S.; Ufnal, M. High salt intake increases plasma trimethylamine N-oxide (TMAO) concentration and produces gut dysbiosis in rats. Nutrition 2018, 54, 33–39. [Google Scholar] [CrossRef] [PubMed]
  62. Sleator, R.D.; Hill, C. Bacterial osmoadaptation: The role of osmolytes in bacterial stress and virulence. FEMS Microbiol. Rev. 2002, 26, 49–71. [Google Scholar] [CrossRef] [PubMed]
  63. Marshall, B.J.; Ohye, D.F.; Christian, J.H. Tolerance of bacteria to high concentrations of NaCl and glycerol in the growth medium. Appl. Microbiol. 1971, 21, 363–364. [Google Scholar] [PubMed]
Figure 1. Effect of betaine on endocrine hormones of high-salt stressed Sprague–Dawley rats (n = 8 in each group). Note: a,b Values without common letters above the histogram differ significantly (p < 0.05). A: control group with standard diet (0.4% NaCl); B: high-salt diet (4.0% NaCl); C: high-salt diet (4.0% NaCl) with 0.5% betaine; D: high-salt diet (4.0% NaCl) with 1.0% betaine; (a) COR, cortisol; (b) ALD, aldosterone; (c) ADH, antidiuretic hormone.
Nutrients 10 00907 g001
Figure 2. Effect of betaine on digestive enzyme activities of high-salt stressed Sprague–Dawley rats (n = 8 in each group). Note: a,b,c Values without common letters above the histogram differ significantly (p < 0.05). A: control group with standard diet (0.4% NaCl); B: high-salt diet (4.0% NaCl); C: high-salt diet (4.0% NaCl) with 0.5% betaine; D: high-salt diet (4.0% NaCl) with 1.0% betaine; (a) amylase; (b) maltase; (c) lipase; (d) trypsin; (e) chymotrypsin.
Nutrients 10 00907 g002
Figure 3. Histomorphology of small intestine between groups (n = 8 in each group). Note: a,b,c Values without common letters above the histogram differ significantly (p < 0.05). A: control group with standard diet (0.4% NaCl); B: high-salt diet (4.0% NaCl); C: high-salt diet (4.0% NaCl) with 0.5% betaine; D: high-salt diet (4.0% NaCl) with 1.0% betaine; (a): Hematoxylin and eosin (H&E)staining (100×); Duodenum villi height (b), crypt depth (c) and ratio of villus height to crypt depth (V/C) (d); Jejunum villi height (e), crypt depth (f) and V/C (g); Ileum villi height (h), crypt depth (i) and V/C (j).
Nutrients 10 00907 g003aNutrients 10 00907 g003b
Figure 4. Alpha diversity of caecal microbiota between groups (n = 4 in each group). Note: * shows a statistical significant difference compared with the control group with standard diet (p < 0.05). # shows a statistical significant difference compared with the high-salt diet group (p < 0.05). A: control group with standard diet (0.4% NaCl); B: high-salt diet (4.0% NaCl); C: high-salt diet (4.0% NaCl) with 0.5% betaine; D: high-salt diet (4.0% NaCl) with 1.0% betaine; (a) Observed_species; (b) Chao1 index; (c) Shannon index; (d) Simpson index.
Nutrients 10 00907 g004
Figure 5. Beta diversity of caecal microbiota between groups (n = 4 in each group). Note: * shows a statistical significant difference compared with the control group with standard diet (p < 0.05). # shows a statistical significant difference compared with the high-salt diet group (p < 0.05). A: control group with standard diet (0.4% NaCl); B: high-salt diet (4.0% NaCl); C: high-salt diet (4.0% NaCl) with 0.5% betaine; D: high-salt diet (4.0% NaCl) with 1.0% betaine; (a) nonmetric multidimensional scaling (NMDS) plot; (b) unweighted_unifrac; (c) linear discriminant analysis effect size (LEfSe) analysis.
Nutrients 10 00907 g005
Figure 6. Caecal microbiota structure between groups (n = 4 in each group). Note: A: control group with standard diet (0.4% NaCl); B: high-salt diet (4.0% NaCl); C: high-salt diet (4.0% NaCl) with 0.5% betaine; D: high-salt diet (4.0% NaCl) with 1.0% betaine; (a) phylum level; (b) class level; (c) family level; (d) genus level.
Nutrients 10 00907 g006
Table 1. Effect of betaine on growth performance of high-salt stressed Sprague–Dawley rats.
ItemsABCDSEMp
Initial weight (g)128.4128.1127.9127.80.900.9956
Final weight (g)320.6309.0315.8317.92.860.5424
ADG (g/day)6.876.466.716.790.100.5562
ADFI (g/day)24.7726.3226.7426.070.460.5675
Water intake (mL/day)32.74 b57.37 a58.99 a58.00 a4.160.0002
Liver index (%)4.074.284.424.240.060.2475
Kidney index (%)0.79 b0.91 a0.90 a0.88 a0.010.0160
Note: a,b Values without common superscript letters differ significantly (p < 0.05) (n = 8 in each group); A: control group with standard diet (0.4% NaCl); B: high-salt diet (4.0% NaCl); C: high-salt diet (4.0% NaCl) with 0.5% betaine; D: high-salt diet (4.0% NaCl) with 1.0% betaine; SEM: standard error of means; ADG: average daily gain; ADFI: average daily feed intake.
Table 2. Effect of betaine on osmolarity of high-salt stressed Sprague–Dawley rats (mOsm/kg).
ItemsABCDSEMp
Plasma3363293383331.20.8451
Liver5705795635556.30.6042
Kidney4985004664896.20.2071
Digesta
 Duodenum61265057060516.60.3940
 Jejunum49051449047613.00.7976
 Ileum41336138037410.60.3752
Mucosa
 Duodenum62058568063318.80.3823
 Jejunum52054856050515.40.6194
 Ileum47549351852824.40.8943
Note: A: control group with standard diet (0.4% NaCl); B: high-salt diet (4.0% NaCl); C: high-salt diet (4.0% NaCl) with 0.5% betaine; D: high-salt diet (4.0% NaCl) with 1.0% betaine; (n = 8 in each group). SEM: standard error of means.
Table 3. Effect of betaine on electrolytes of high-salt stressed Sprague–Dawley rats (mmol/L).
ItemsABCDSEMp
Plasma
Na142.2143.1141.8141.30.320.2730
K5.755.825.845.950.090.8801
Cl100.3 a99.8 ab98.5 bc97.9 c0.330.0174
Liver
Na98.699.0101.9101.41.150.6940
K83.983.684.283.80.620.9901
Cl118.6 b130.6 a134.3 a134.4 a1.740.0008
Kidney
Na119.6124.6126.3121.31.380.3140
K67.167.167.668.71.210.9668
Cl97.9 b102.5 ab105.8 a104.4 a0.960.0150
Note: a,b,c Values without common superscript letters differ significantly (p < 0.05) (n = 8 in each group). A: control group with standard diet (0.4% NaCl); B: high-salt diet (4.0% NaCl); C: high-salt diet (4.0% NaCl) with 0.5% betaine; D: high-salt diet (4.0% NaCl) with 1.0% betaine; SEM: standard error of means; Na: sodium; K: potassium; Cl: chloride.

