Proteomic Analysis of Proteins Responsive to Drought and Low Temperature Stress in a Hard Red Spring Wheat Cultivar

 , , , ,
Abstract
:1. Introduction
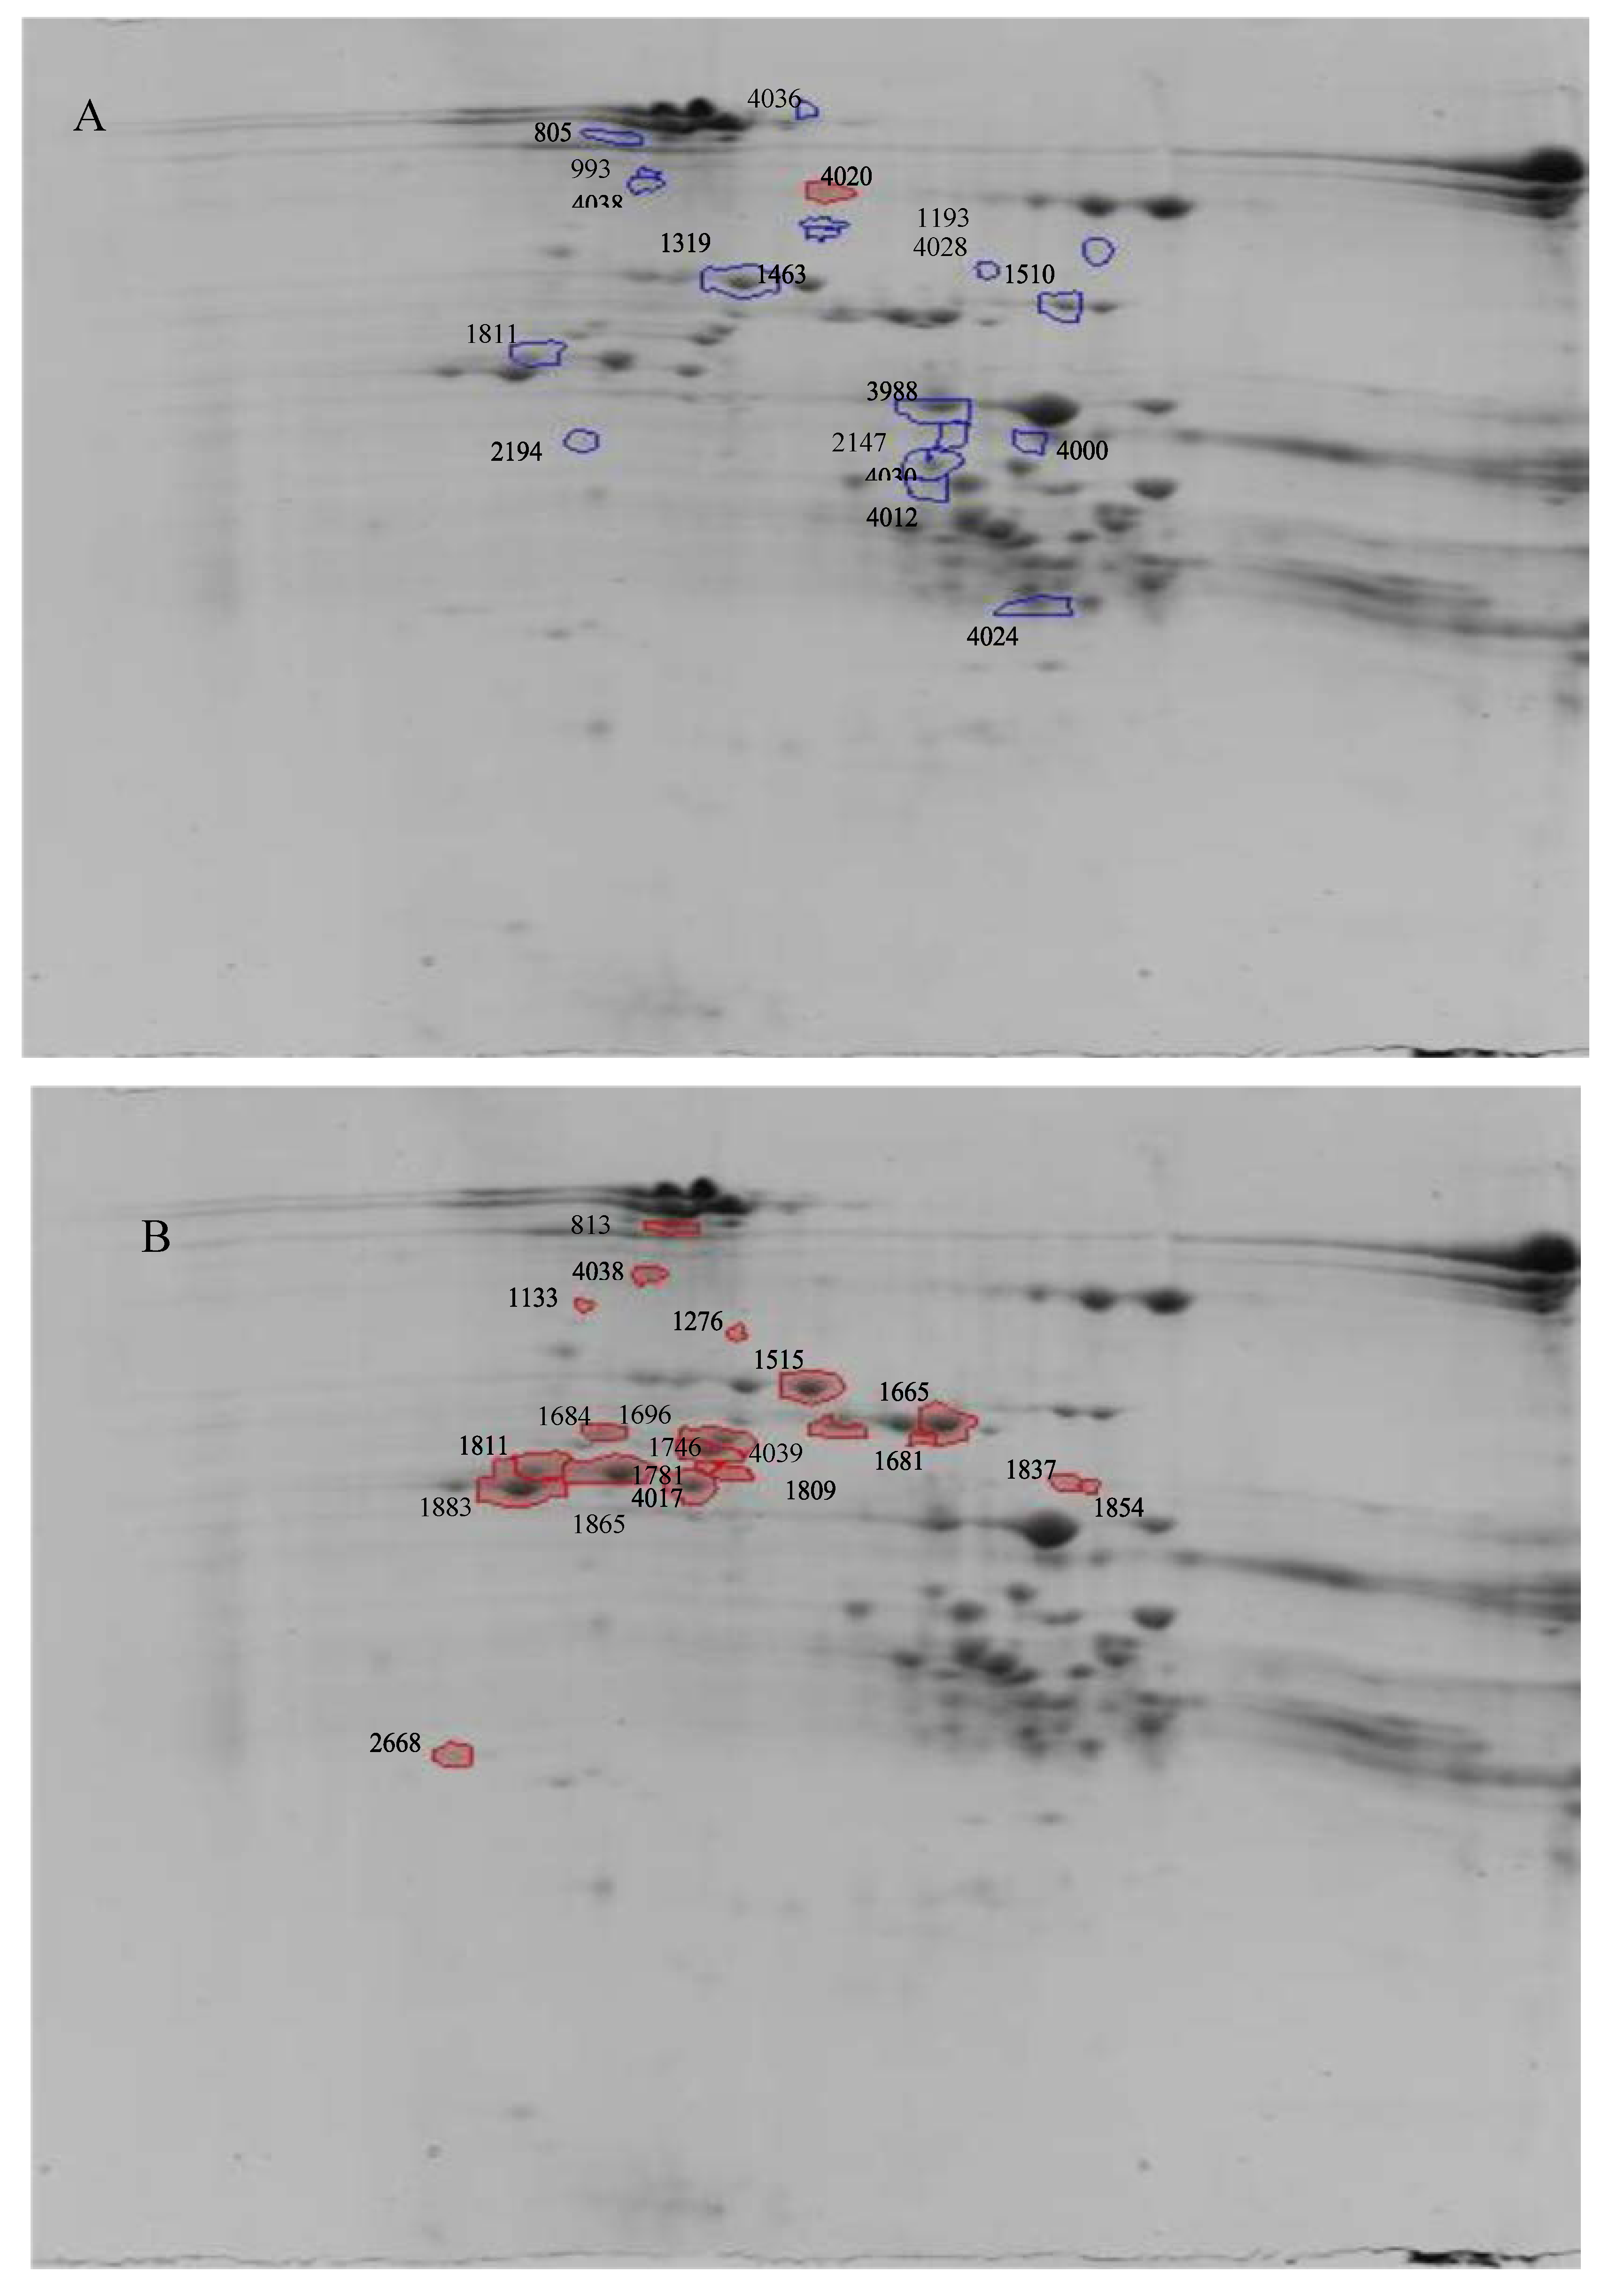
2. Results
3. Discussion
4. Materials and Methods
4.1. Glutenin Subunits Extraction and 2D Electrophoretic Analysis
4.2. Protein Staining, Image Acquisition and Gel Spots Excision
4.3. In-gel Digestion and Mass Spectrometric Analysis
4.4. Database Search and Protein Identification
Supplementary Materials
Author Contributions
Funding
Conflicts of Interest
References
- Buts, K.; Michielssens, S.; Hertog, M.L.A.T.M.; Hayakawa, E.; Cordewener, J.; America, A.H.P.; Nicolai, B.M.; Carpentier, S.C. Improving the identification rate of data independent label-free quantitative proteomics experiments on non-model crops: A case study on apple fruit. J. Proteomics 2014, 105, 31–45. [Google Scholar] [CrossRef] [PubMed]
- Chevalier, F.; Martin, O.; Rofidal, V.; Devauchelle, A.D.; Barteau, S.; Sommerer, N.; Rossignol, M. Proteomic investigation of natural variation between Arabidopsis ecotypes. Proteomics 2004, 4, 1372–1381. [Google Scholar] [CrossRef] [PubMed]
- Beyene, B.; Haile, G.; Matiwos, T.; Deribe, H. Review on proteomics technologies and its application for crop improvement. Innov. Sys. Design Eng. 2016, 7, 7–15. [Google Scholar]
- León, E.; Marín, S.; Giménez, M.J.; Piston, F.; Rodríguez-Quijano, M.; Shewry, P.R.; Barro, F. Mixing properties and dough functionality of transgenic lines of a commercial wheat cultivar expressing the 1Ax1, 1Dx5 and 1Dy10 HMW glutenin subunit genes. J. Cer. Sci. 2009, 49, 148–156. [Google Scholar] [CrossRef]
- León, E.; Piston, F.; Rodríguez-Quijano, M.; Shewry, P.R.; Barro, F. Stacking HMW-GS transgenes in bread wheat: Combining subunit 1Dy10 gives improved mixing properties and dough functionality. J. Cer. Sci. 2010, 51, 13–20. [Google Scholar] [CrossRef] [Green Version]
- Altenbach, S.B.; Tanaka, C.K.; Whitehand, L.C.; Vensel, W.H. Effects of post-anthesis fertilizer on the protein composition of the gluten polymer in a US bread wheat. J. Cer. Sci. 2016, 68, 66–73. [Google Scholar] [CrossRef] [Green Version]
- Wieser, H. Chemistry of gluten proteins. Food Microbiol. 2007, 24, 115–119. [Google Scholar] [CrossRef]
- Altenbach, S.B. New insights into the effects of high temperature, drought and post-anthesis fertilizer on wheat grain development. J. Cer. Sci. 2012, 56, 39–50. [Google Scholar] [CrossRef]
- Xu, J.; Zhang, Y.X.; Guan, Z.Q.; Wei, W.; Han, L.; Chai, T.Y. Expression and function of two dehydrins under environmental stresses in I Brassica juncea L. Molecular Breeding 2008, 21, 431–438. [Google Scholar] [CrossRef]
- Xu, J.; Li, Y.; Sun, J.; Du, L.; Zhang, Y.; Yu, Q.; Liu, X. Comparative physiological and proteomic response to abrupt low temperature stress between two winter wheat cultivars differing in low temperature tolerance. Plant. Biology 2013, 15, 292–303. [Google Scholar] [CrossRef]
- Zhang, Y.; Pan, J.; Huang, X.; Guo, D.; Lou, H.; Hou, Z.; Su, M.; Liang, R.; Xie, C.; You, M.; et al. Differential effects of a post-anthesis heat stress on wheat (Triticum aestivum L.) grain proteome determined by iTRAQ. Scient. Rep. 2017, 7, 3468. [Google Scholar] [CrossRef] [Green Version]
- Padula, M.P.; Berry, I.J.; O’Rourke, M.; Raymon, B.B.A.; Santos, J.; Djordjevic, P. A comprehensive guide for performing sample preparation and top-down protein analysis. Proteomes 2017, 5, 11. [Google Scholar] [CrossRef] [Green Version]
- Finnie, C.; Sultan, A.; Grasser, K.D. From protein catalogues towards targeted proteomics approaches in cereal grains. Phytochem. 2011, 72, 1145–1153. [Google Scholar] [CrossRef] [PubMed]
- Rasheed, A.; Xia, X.; Yan, Y.; Appels, R.; Mahmood, T.; He, Z. Wheat seed storage proteins: Advances in molecular genetics, diversity and breeding applications. J. Cer. Sci. 2014, 60, 11–24. [Google Scholar] [CrossRef] [Green Version]
- Ribeiro, M.; Nunes-Miranda, J.D.; Branlard, G.; Carillo, J.M.; Rodriguez-Quijano, M.; Igrejas, G. One hundred years of grain omics: identifying the glutens that feed the world. J. Proteome Res. 2013, 12, 4702–4716. [Google Scholar] [CrossRef]
- Vensel, W.H.; Tanaka, C.K.; Altenbach, S.B. Protein composition of wheat gluten polymer fractions determined by quantitative two-dimensional gel electrophoresis and tandem mass spectrometry. Proteome Sci. 2014, 12, 8. [Google Scholar] [CrossRef] [Green Version]
- Muccilli, V.; Cunsolo, V.; Saletti, R.; Foti, S.; Margiotta, B.; Scossa, F.; Masci, S.; Lafiandra, D. Characterisation of a specific class of typical low molecular weight glutenin subunits of durum wheat by a proteomic approach. J. Cer. Sci. 2010, 51, 134–139. [Google Scholar] [CrossRef] [Green Version]
- D’Ovidio, R.; Simeone, M.; Masci, S.; Porceddu, E.; Kasarda, D.D. Nucleotide sequence of a γ-gliadin type gene from a durum wheat: Correlation with a γ-type glutenin subunit from the same biotype. Cereal Chem. 1995, 72, 443–449. [Google Scholar]
- Masci, S.; Egorov, T.A.; Ronchi, C.; Kuzmicky, D.D.; Kasarda, D.D.; Lafiandra, D. Evidence for the presence of only one cysteine residue in the D-type Low-Molecular-Weight subunits of wheat glutenin. J. Cer. Sci. 1999, 29, 17–25. [Google Scholar] [CrossRef]
- Masci, S.; Rovelli, L.; Kasarda, D.D.; Vensel, W.H.; Lafiandra, D. Characterisation and chromosomal localisation of C-type low molecular weight glutenin subunits in the bread wheat cultivar Chinese Spring. Theor. Appl. Genet. 2002, 104, 422–428. [Google Scholar] [CrossRef] [PubMed]
- D’Ovidio, R.; Masci, S. The low-molecular-weight glutenin subunits of wheat gluten. J. Cer. Sci. 2004, 39, 321–339. [Google Scholar] [CrossRef]
- MacRtichie, F. Theories of glutenin/dough systems. J. Cer. Sci. 2014, 60, 4–6. [Google Scholar] [CrossRef]
- Yang, F.; Jørgensen, A.D.; Li, H.; Søndergard, I.; Finnie, C.; Svensson, B.; Jiang, D.; Wollenweber, B.; Jacobsen, S. Implications of high-temperature events and water deficits on protein profiles in wheat (Triticum aestivum L. cv. Vinjett) grain. Proteomics 2011, 11, 1684–1695. [Google Scholar] [CrossRef] [PubMed]
- Zhang, Y.; Huang, X.; Wang, L.; Wei, L.; Wu, Z.; You, M.; Li, B. Proteomics analysis of wheat seed in response to drought stress. J. Integr. Agric. 2014, 13, 919–925. [Google Scholar] [CrossRef]
- Salekdeh, G.H.; Komatsu, S. Crop proteomics. Aim at sustainable agriculture for tomorrow. Proteomics 2007, 7, 2976–2996. [Google Scholar] [CrossRef] [PubMed]
- Holman, J.D.; Dasari, S.; Tabb, D.L. Informatics of protein and posttranslational modification detection via shotgun proteomics. Meth. Mol. Biol. 2013, 1002, 167–179. [Google Scholar]
- Cunsolo, V.; Muccilli, V.; Saletti, R.; Foti, S. Mass spectrometry in the proteome analysis of mature cereal grains. Mass. Spec. Rev. 2012, 31, 448–465. [Google Scholar] [CrossRef]
- Anderson, W.; Garlinge, J. The Wheat Book: Principle and Practices; Department of Agriculture, Western Australia: Perth, WA, Australia, 2000.
- Singh, N.K.; Shepherd, K.W.; Cornish, G.B. Rapid communication. A simplified SDS-PAGE procedure for separating LMW subunits of glutenin. J. Cer. Sci. 1991, 14, 203–208. [Google Scholar] [CrossRef]
- Neuhoff, V.; Arold, N.; Taube, D.; Ehrhardt, W. Improved staining of proteins in polyacrylamide gels including isoelectric focusing gels with clear background at nanogram sensitivity using Coomassie Brilliant Blue G-250 and R-250. Electroph. 1988, 9, 255–262. [Google Scholar] [CrossRef]
- O’Gorman, M.; Beauvallet, C.; Lepercq, P.; David, O.; Seksik, P.; Beaugerie, L.; Doré, J.; Martin, P.; Bogard, P.; Juste, C. An investigation into Crohn’s disease using the progenesis SameSpots analysis platform. In Proceedings of the 24th Journée Françaises de Spectrométrie de Masse, Pau, France, 2007. [Google Scholar]
- Sestili, F.; Paoletti, F.; Botticella, E.; Masci, S.; Saletti, R.; Muccilli, V.; Lafiandra, D. Comparative proteomic analysis of kernel proteins of two high amylose transgenic durum wheat lines obtained by biolistic and Agrobacterium-mediated transformations. J. Cer. Sci. 2013, 58, 15–22. [Google Scholar] [CrossRef]
- García-Molina, M.D.; Muccilli, V.; Saletti, R.; Foti, S.; Masci, S.; Barro, F. Comparative proteomic analysis of two transgenic low-gliadin wheat lines and non-transgenic wheat control. J. Proteomics 2017, 165, 102–112. [Google Scholar] [CrossRef] [PubMed]
- Perez-Riverol, Y.; Csordas, A.; Bai, J.; Bernal-Llinares, M.; Hewapathirana, S.; Kundu, D.J.; Inuganti, A.; Griss, J.; Mayer, G.; Eisenacher, M.; et al. The PRIDE database and related tools and resources in 2019: improving support for quantification data. Nucleic Acids Res. 2019, 47, D442–D450. [Google Scholar] [CrossRef] [PubMed]
Sample Availability: Samples of the flour are available from the corresponding author. |

| Treatment | Spot number | P value | Q Value | Power | Fold Change | Protein Identification | Acc.No | Score; Coverage (%) | Identified Peptides | M + H*; z |
|---|---|---|---|---|---|---|---|---|---|---|
| Cold stress | 4020 | 0.008 | 0.82 | 0.811 | 1.7 | HMW PW212 | P08489 | 209.1; 7 | GGSFYPGETTPPQQLQQR IFWGIPALLK QpyroSGQGQQGYYSSYHVSVEHQAASLK SLQQTGQGQQSGQGQQGYYSSYHVSVEHQAASLK | 1989.9; 2 1156.7; 2 2721.2; 2 3665.7; 2 |
| 4020 | HMW 12 | P08488 | 173.9; 6 | LPWSTGLQMR LPWSTGLQMoxR QVVDQQLAGR QGYDSPYHVSAEQQAASPMoxVAK QpyroVVDQQLAGR | 1187.6; 2 1203.6; 2 1112.6; 2 2379.1; 2 1095.6; 2 | |||||
| 4000 | 0.017 | 0.82 | 0.703 | 1.3 | γ-gliadin | P08453 | 81.15; 4 | APFASIVAGIGGQ | 1186.6; 2 | |
| 3988 | 0.018 | 0.82 | 0.698 | 1.3 | LMW | P10385 | 87.7; 3 | QpyroIPEQSRHESIR QpyroIPEQSR PEQSRHESIR | 1461.7; 2 839.4; 2 1237.6; 2 | |
| 4038 | HMW 12 | P08488 | 147.5; 3 | LPWSTGLQMR LPWSTGLQMoxR QVVDQQLAGR | 1187.6; 2 1203.6; 2 1112.6; 2 | |||||
| 4038 | Fragment HMW PC256 | P02861 | 107.5; 30 | LEGGDALLASQ QWLQPR AQQLAAQLPAMoxCR | 1072.5; 2 826.4; 2 1472.7; 2 | |||||
| 1463 | 0.022 | 0.82 | 0.666 | 1.8 | HMW 12 | P08488 | 203.1; 12 | QpyroGYDSPYHVSAEQQAASPMoxVAK SLQQPGQGQQIGK LPWSTGLQMR QGYDSPYHVSAEQQAASPMoxVAK QGYYPTSLQQPGQGQQIGQGQQGYYPTSPQHTGQR LPWSTGLQMoxR | 2362.0; 2 1367.7; 2 1187.6; 2 2379.1; 2 3862.8; 3 1203.6; 2 | |
| 1193 | 0.029 | 0.82 | 0.614 | 1.6 | HMW 12 | P08488 | 217.6; 14 | LPWSTGLQMR SVAVSQVAR LPWSTGLQMoxR QVVDQQLAGR QpyroVVDQQLAGR QYEQTVVPPK QGYDSPYHVSAEQQAASPMoxVAK LVLFAAVVIALVALTTAEGEASR EpyroLQESSLE | 1187.6; 2 915.5; 2 1203.6; 2 1112.6; 2 1095.6; 2 1187.6; 2 2379.0; 3 2313.3; 3 915.4 ;2 | |
| 1193 | HMW PW212 | P08849 | 94.3; 2 | GGSFYPGETTPPQQLQQR | 1989.9; 2 | |||||
| 4028 | 0.031 | 0.82 | 0.606 | 1.6 | HMW PW212 | P08849 | 71.8; 2 | GGSFYPGETTPPQQLQQR | 1989.9; 2 | |
| 1811 | 0.032 | 0.82 | 0.595 | 1.4 | HMW PW212 | P08849 | 187.8; 2 | GGSFYPGETTPPQQLQQR ELQELQER | 1989.9; 2 1043.5; 2 | |
| 2147 | 0.033 | 0.82 | 0.590 | 1.3 | γ-gliadin | P8453 | 97.14; 4 | APFASIVAGIGGQ | 1186.6; 2 | |
| 2147 | HMW PW212 | P08849 | 187.8; 3 | GGSFYPGETTPPQQLQQR | 1989.9; 2 | |||||
| 2194 | 0.034 | 0.82 | 0.587 | 1.5 | HMW PW212 | P08849 | 1164.1; 3 | GGSFYPGETTPPQQLQQR IFWGIPALLK | 1989.9; 2 1156.7; 2 | |
| 2194 | LMW PTDUCD1 | P16315 | 48.3; 3 | QLPQIPEQSR | 1194.6 | |||||
| 1319 | 0.034 | 0.82 | 0.584 | 1.5 | HMW 12 | P08488 | 204.4; 15 | QpyroGYYPTSLQQPGQGQQIGQGQQGYYPTSPQHTGQR QGYDSPYHVSAEQQAASPMoxVAK QpyroVVDQQLAGR LPWSTGLQMR EpyroQQAASPMVAKAQQPATQLPTVCRMEGGDALSASQ QpyroGYDSPYHVSAEQQAASPMoxVAK LPWSTGLQMoxR | 3845.7; 3 2379.1; 3 1095.6; 3 1187.6; 2 3637.7; 3 2362.1; 2 1203.6; 2 | |
| 4012 | 0.044 | 0.82 | 0.537 | 1.4 | α/β-gliadin A-IV | P04724 | 101.1; 12 | GSVQPQQLPQFEEIR QpyroLPQFEEIR DVVLQQHSIAHGSSQVLQQSTY SVQPQQLPQFEEIR | 1754.8; 2 1141.6; 2 2424.2; 3 1697.8; 2 | |
| 4024 | 0.046 | 0.82 | 0.531 | 1.3 | α/β-gliadin | P02863 | 232.4; 21 | PSQQNPQAQGSVQPQQLPQFEEIR SVQPQQLPQFEEIR GSVQPQQLPQFEEIR PQQLPQFEEIR QQQQPSSQVSFQQPLQQYPLGQGSFR PQFEEIR AIILHQQQK | 2733.3; 3 1697.8; 2 1754.8; 2 1383.7; 3 2990.5; 3 917.4; 1 1077.6; 2 | |
| 4024 | α/β-gliadin clone PTO-A10 | P04728 | 63.1; 14 | QQQQPSSQFSFQQPLQQYPLGQGSFR | 3038.5; 3 | |||||
| 4024 | γ-gliadin | P08453 | 92.9; 5 | GIIQPQQPAQLEAIR | 1660.9; 2 | |||||
| 1510 | 0.047 | 0.82 | 0.526 | 1.3 | HMW PW212 | P08849 | 100.6; 3 | GGSFYPGETTPPQQLQQR ELQELQER | 1989.9; 2 1043.5; 2 | |
| Drought stress | 1883 | 0.003 | 0.74 | 0.907 | 1.6 | HMW PW212 | P08849 | 110.4; 2 | GGSFYPGETTPPQQLQQR | 1989.9; 2 |
| 1811 | 0.003 | 0.74 | 0.902 | 1.7 | HMW PW212 | P08849 | 187.3; 2 | GGSFYPGETTPPQQLQQR ELQELQER | 1989.9; 2 1043.5; 2 | |
| 1865 | 0.006 | 0.74 | 0.850 | 1.6 | HMW PW212 | P08849 | 98.3; 2 | GGSFYPGETTPPQQLQQR | 1989.9; 2 | |
| 4017 | 0.006 | 0.74 | 0.843 | 1.4 | HMW PW212 | P08849 | 120.2; 3 | GGSFYPGETTPPQQLQQR | 1989.9; 2 | |
| 4039 | 0.016 | 0.74 | 0.718 | 1.5 | Eukaryotic translation initiation factor isoform 4G-2 | Q41583 | 37.7; 5 | NGRNAPGGPLSPGGFS FDLLKGELLDSGITTADILKDVISLIF | 1483.7; 2 2948.6; 3 | |
| 1854 | 0.025 | 0.74 | 0.641 | 1.5 | HMW 12 | P08488 | 134.3; 3 | LPWSTGLQMoxR LPWSTGLQMR QYEQTVVPPK | 1203.6; 2 1187.6; 2 1187.6; 2 | |
| 1854 | α/β-gliadin A-II | P04722 | 70.8; 3 | LWQIPEQSR | 1155.6; 2 | |||||
| 1133 | 0.027 | 0.74 | 0.630 | 1.4 | HMW PW212 | P08489 | 79.7; 2 | GGSFYPGETTPPQQLQQR | 1989.9; 2 | |
| 1781 | 0.027 | 0.74 | 0.628 | 1.6 | HMW PW212 | P08489 | 100.7; 2 | GGSFYPGETTPPQQLQQR | 1989.9; 2 | |
| 4038 | HMW 12 | P08488 | 147.5; 3 | LPWSTGLQMR LPWSTGLQMoxR QVVDQQLAGR | 1187.6; 2 1203.6; 2 1112.6; 2 | |||||
| 4038 | Fragment HMW PC256 | P02861 | 107.5; 30 | LEGGDALLASQ QWLQPR AQQLAAQLPAMoxCR | 1072.5; 2 826.4; 2 1472.7; 2 | |||||
| 1809 | 0.031 | 0.74 | 0.600 | 1.7 | HMW PW212 | P08849 | 148.9; 3 | GGSFYPGETTPPQQLQQR IFWGIPALLK | 1989.9; 2 1156.7; 2 | |
| 1696 | 0.033 | 0.74 | 0.592 | 1.6 | HMW PW212 | P08489 | 98.3; 2 | GGSFYPGETTPPQQLQQR | 1989.9; 2 | |
| 1681 | 0.036 | 0.74 | 0.575 | 1.4 | HMW PW212 | P08849 | 113.4; 6 | GGSFYPGETTPPQQLQQR MoxAKRLVLFVAVVVALVALTVAEGEASEQLQCER | 1989.9; 2 3614.9; 3 | |
| 1681 | HMW 12 | P08488 | 24.9; 5 | QpyroGYYPTSLQQPGQGQQIGQGQQGYYPTSPQHTGQR | 3845.7; 3 | |||||
| 1684 | 0.043 | 0.74 | 0.544 | 1.3 | HMW PW212 | P08849 | 187.3; 3 | GGSFYPGETTPPQQLQQR IFWGIPALLK ELQELQER | 1989.9; 2 1156.7; 2 1043.5; 2 | |
| 1515 | 0.046 | 0.74 | 0.531 | 1.4 | HMW PW212 | P08489 | 174.9; 4 | GGSFYPGETTPPQQLQQR | 1989.9; 2 | |
| 1837 | 0.049 | 0.74 | 0.519 | 1.6 | Plasma membrane ATPase | P83970 | 36.9; 6 | EpyroMSALYLQVSIVSQALIFVT EpyroMoxSALYLQVSIVSQALIFVT LGMoxGTNMYPSSALLGQSK LGDIVPADARLLEGDPLK | 2193.1; 2 2209.1; 2 1869.9; 2 1891.7; 2 | |
| 1665 | 0.049 | 0.74 | 0.516 | 1.3 | HMW PW212 | P08849 | 147.9; 4 | GGSFYPGETTPPQQLQQR | 1989.9; 2 | |
| Cold and drought stress | 1811 | 0.003 | 0.61 | 0.901 | 1.7 | HMW PW212 | P08849 | 187.3; 3 | GGSFYPGETTPPQQLQQR ELQELQER | 1989.9; 2 1043.5; 2 |
| 4038 | HMW 12 | P08488 | 147.5; 3 | LPWSTGLQMR LPWSTGLQMoxR QVVDQQLAGR | 1187.6; 2 1203.6; 2 1112.6; 2 | |||||
| 4038 | Fragment HMW PC256 | P02861 | 107.5; 30 | LEGGDALLASQ QWLQPR AQQLAAQLPAMoxCR | 1072.5; 2 826.4; 2 1472.7; 2 |
© 2020 by the authors. Licensee MDPI, Basel, Switzerland. This article is an open access article distributed under the terms and conditions of the Creative Commons Attribution (CC BY) license (http://creativecommons.org/licenses/by/4.0/).
Share and Cite
Labuschagne, M.; Masci, S.; Tundo, S.; Muccilli, V.; Saletti, R.; van Biljon, A. Proteomic Analysis of Proteins Responsive to Drought and Low Temperature Stress in a Hard Red Spring Wheat Cultivar. Molecules 2020, 25, 1366. https://doi.org/10.3390/molecules25061366
Labuschagne M, Masci S, Tundo S, Muccilli V, Saletti R, van Biljon A. Proteomic Analysis of Proteins Responsive to Drought and Low Temperature Stress in a Hard Red Spring Wheat Cultivar. Molecules. 2020; 25(6):1366. https://doi.org/10.3390/molecules25061366
Chicago/Turabian StyleLabuschagne, Maryke, Stefania Masci, Silvio Tundo, Vera Muccilli, Rosaria Saletti, and Angeline van Biljon. 2020. "Proteomic Analysis of Proteins Responsive to Drought and Low Temperature Stress in a Hard Red Spring Wheat Cultivar" Molecules 25, no. 6: 1366. https://doi.org/10.3390/molecules25061366