Chloroplast Genome of the Folk Medicine and Vegetable Plant Talinum paniculatum (Jacq.) Gaertn.: Gene Organization, Comparative and Phylogenetic Analysis


Abstract
:1. Introduction
2. Results
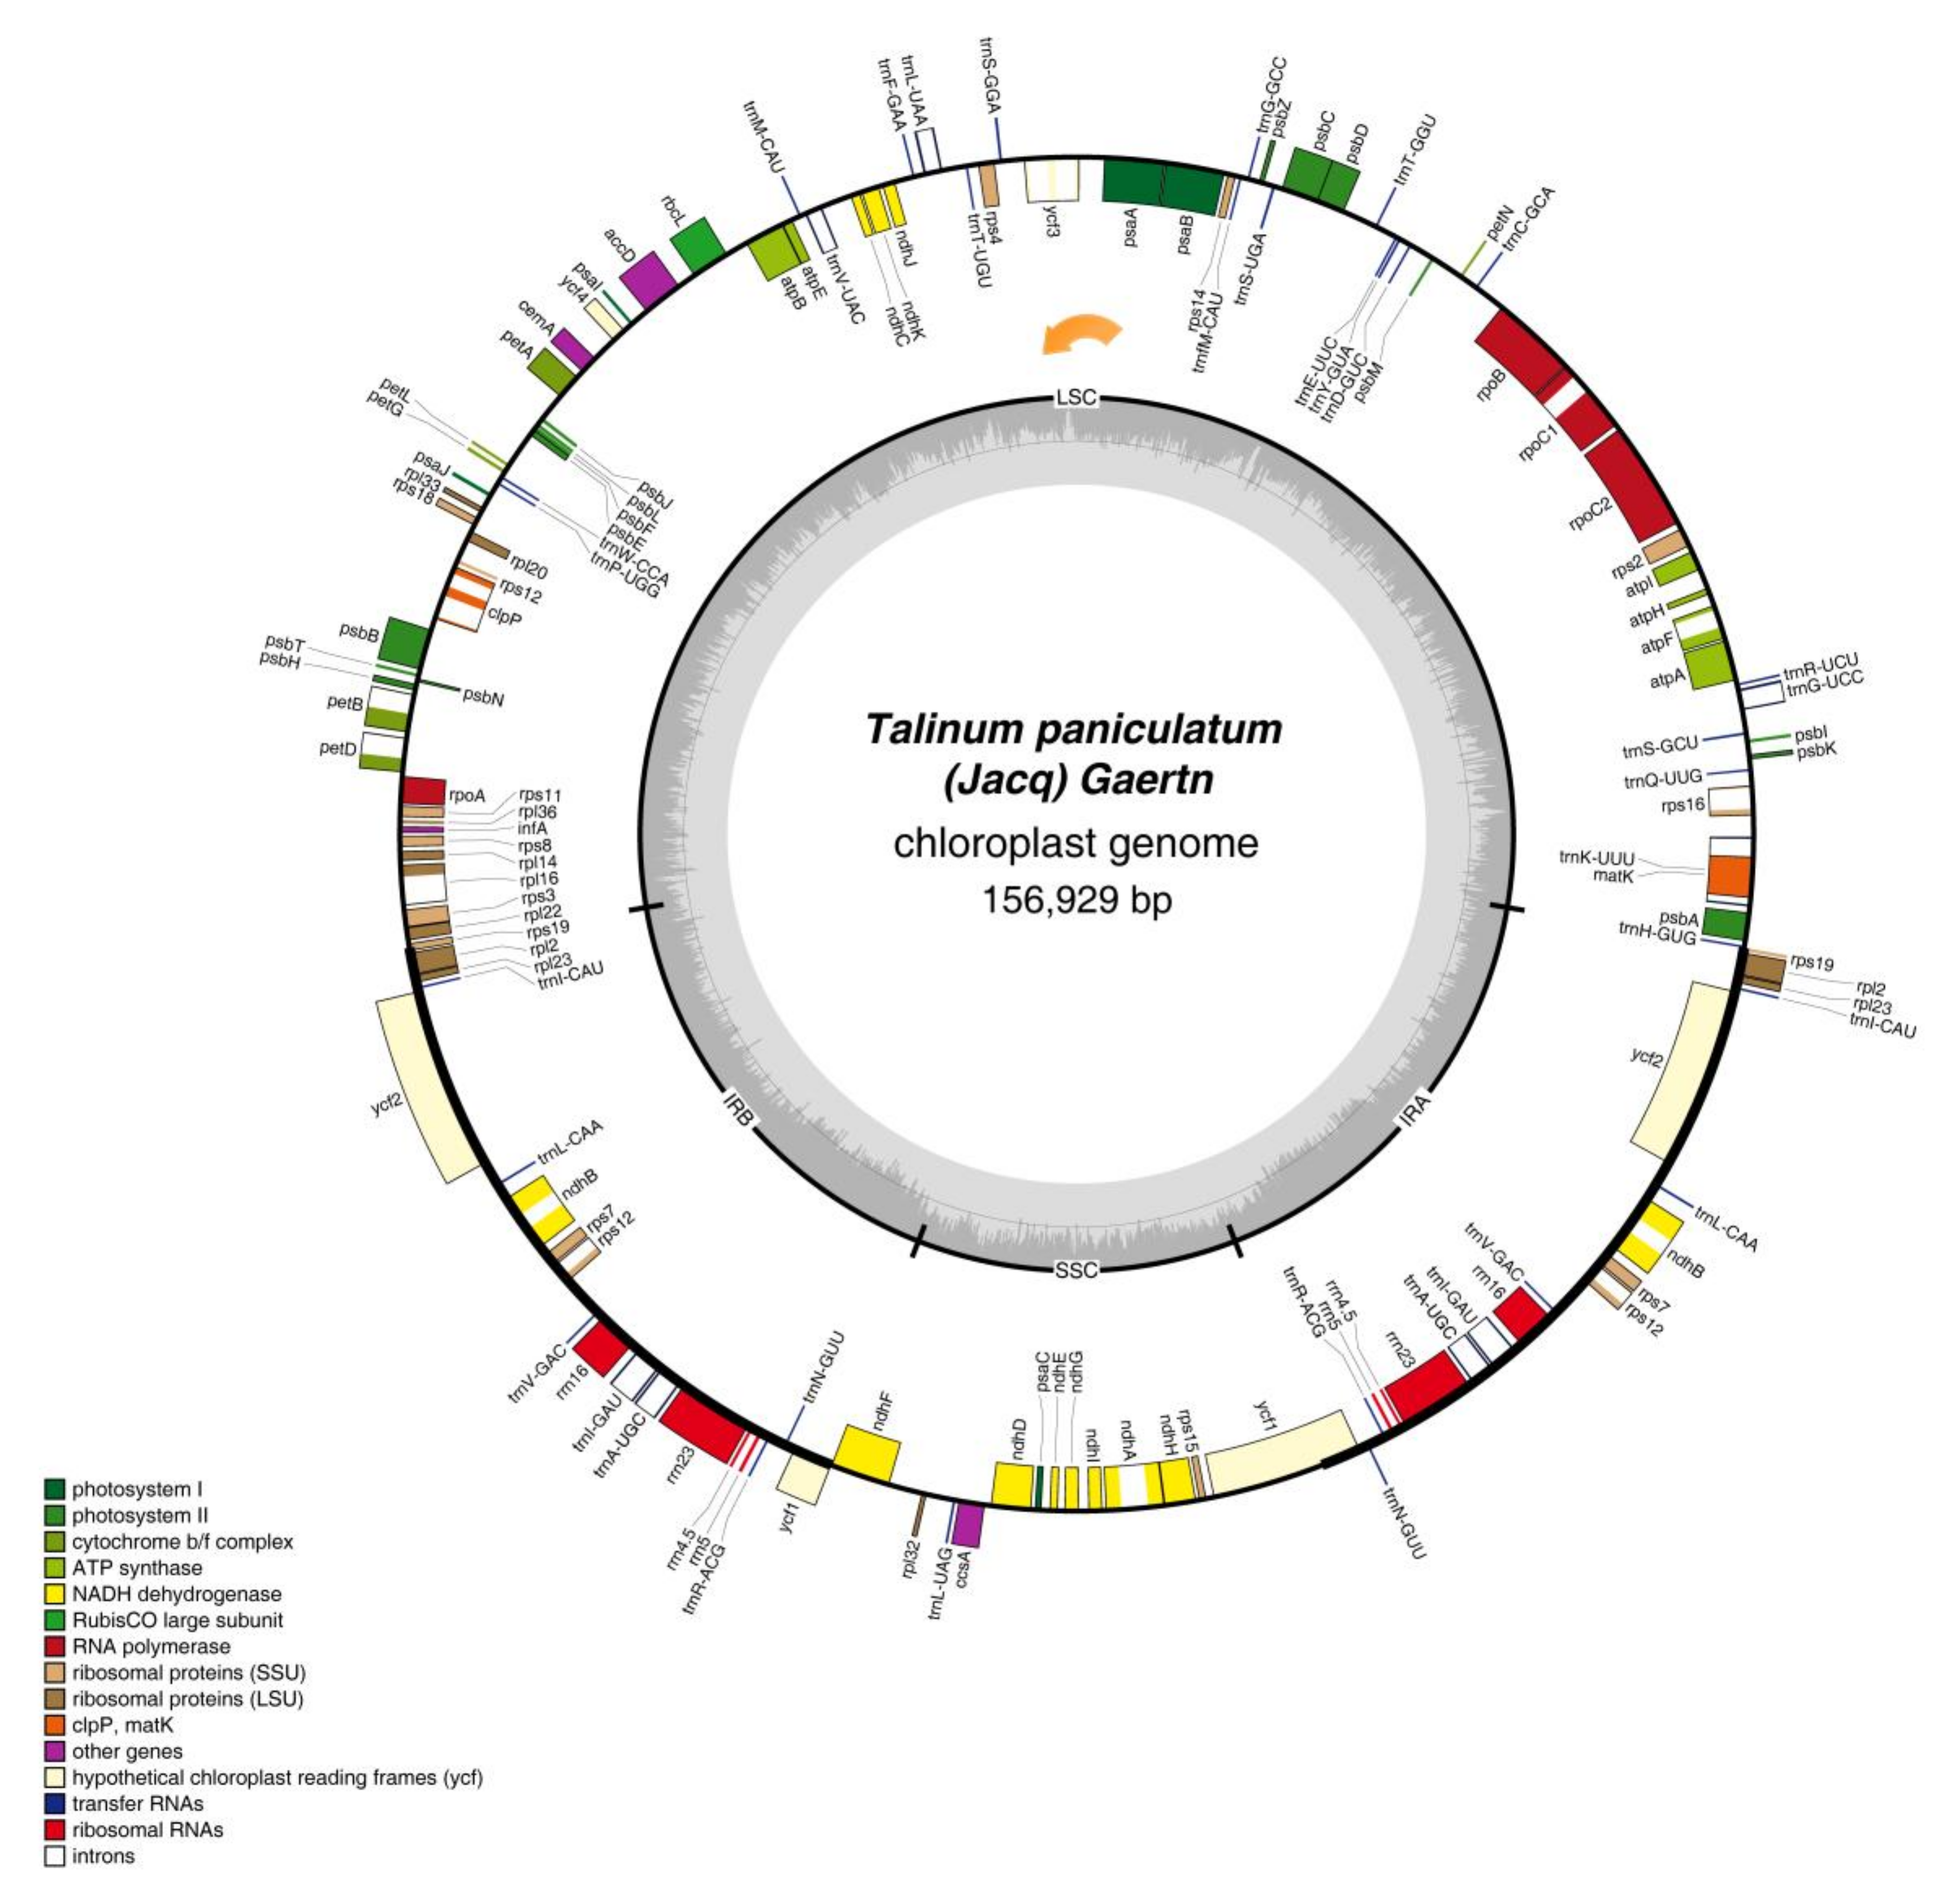
2.1. Features of the T. paniculatum cp Genome
2.2. Codon Usage of the T. paniculatum cp Genome
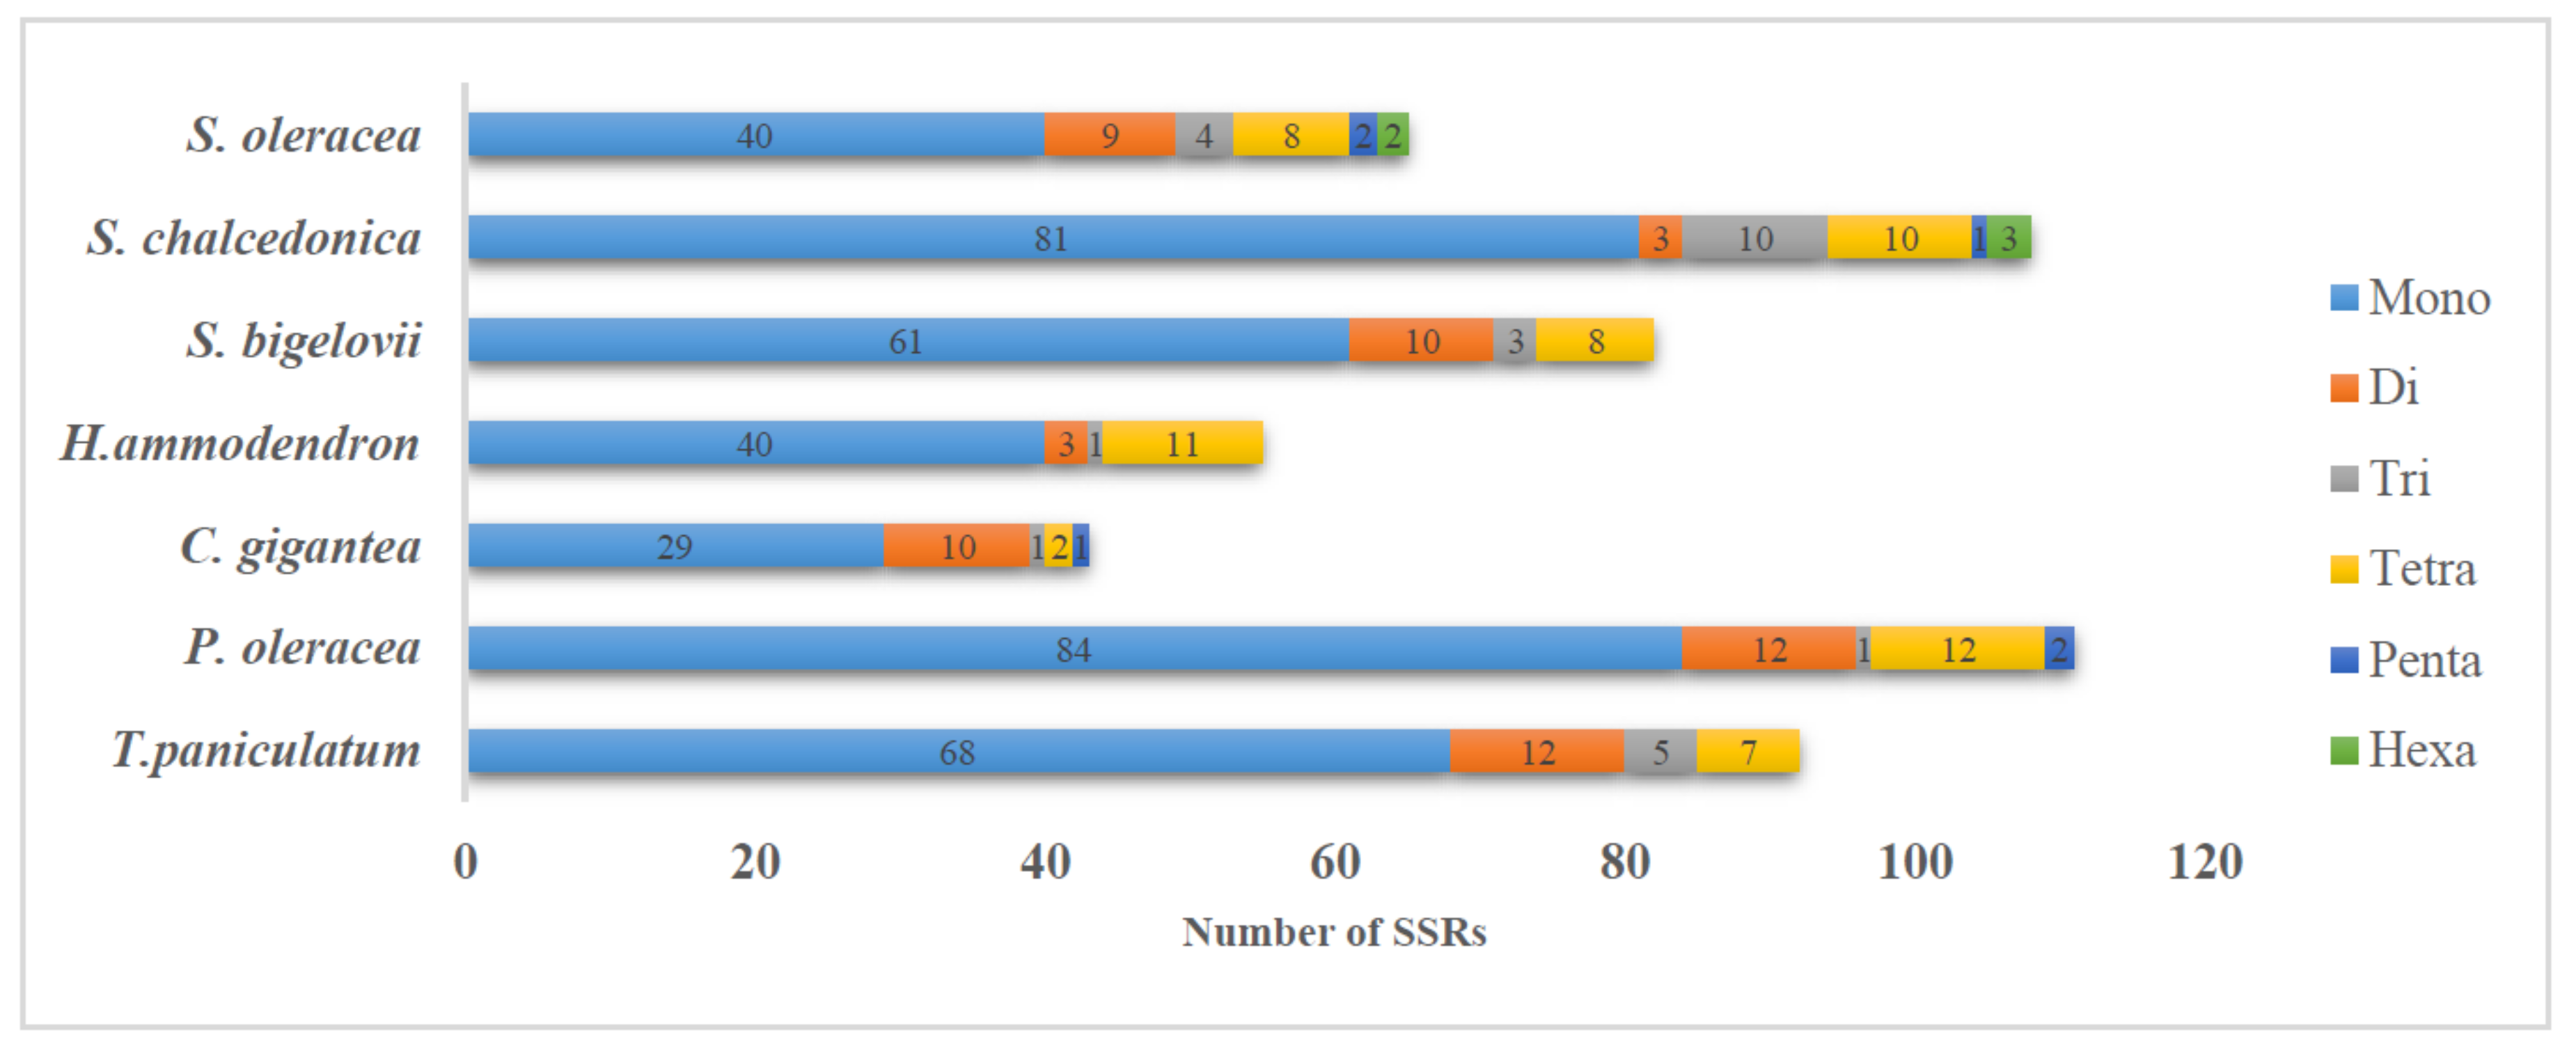
2.3. Repeats Structure and SSR in T. paniculatum cp Genome
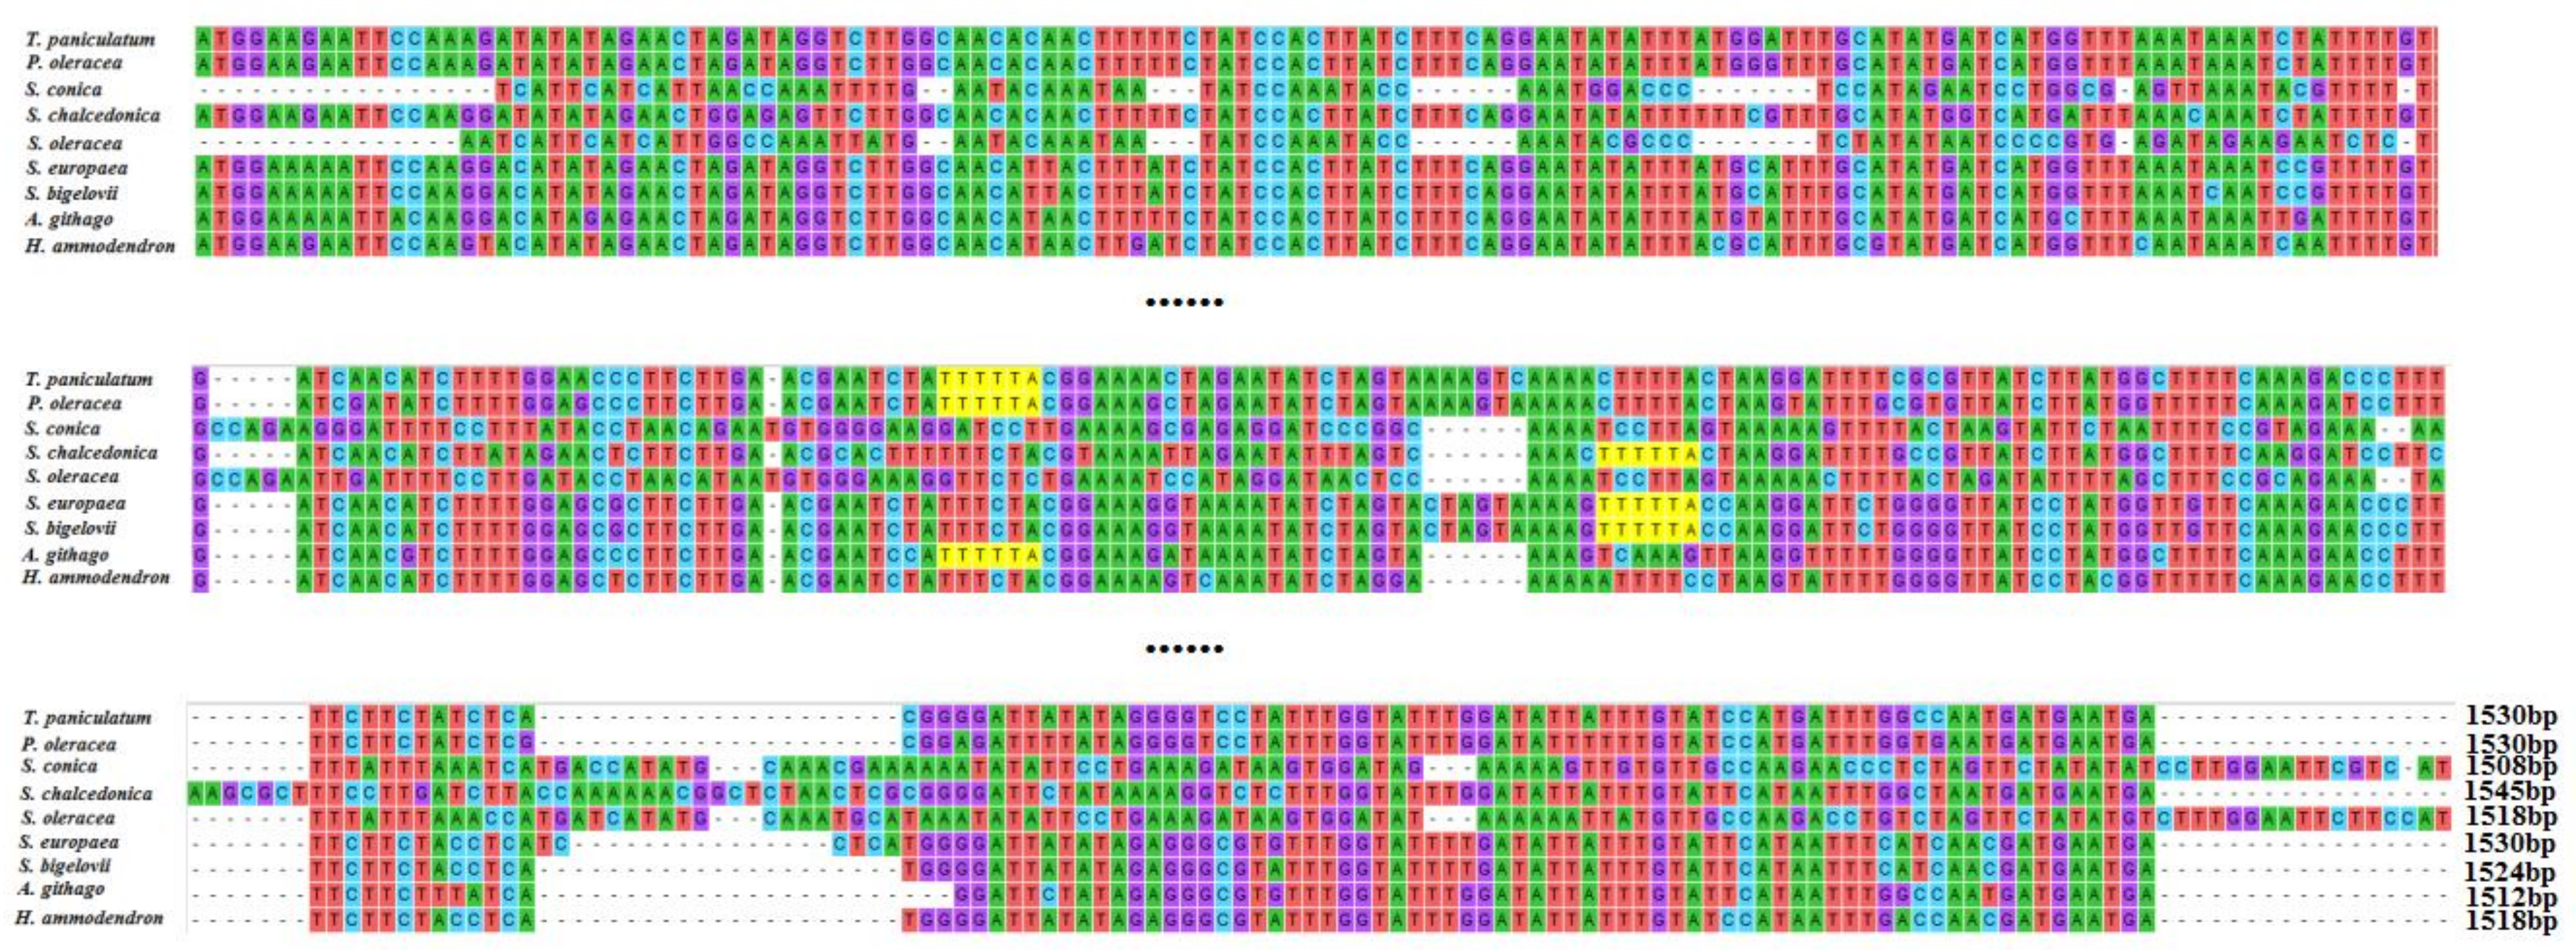
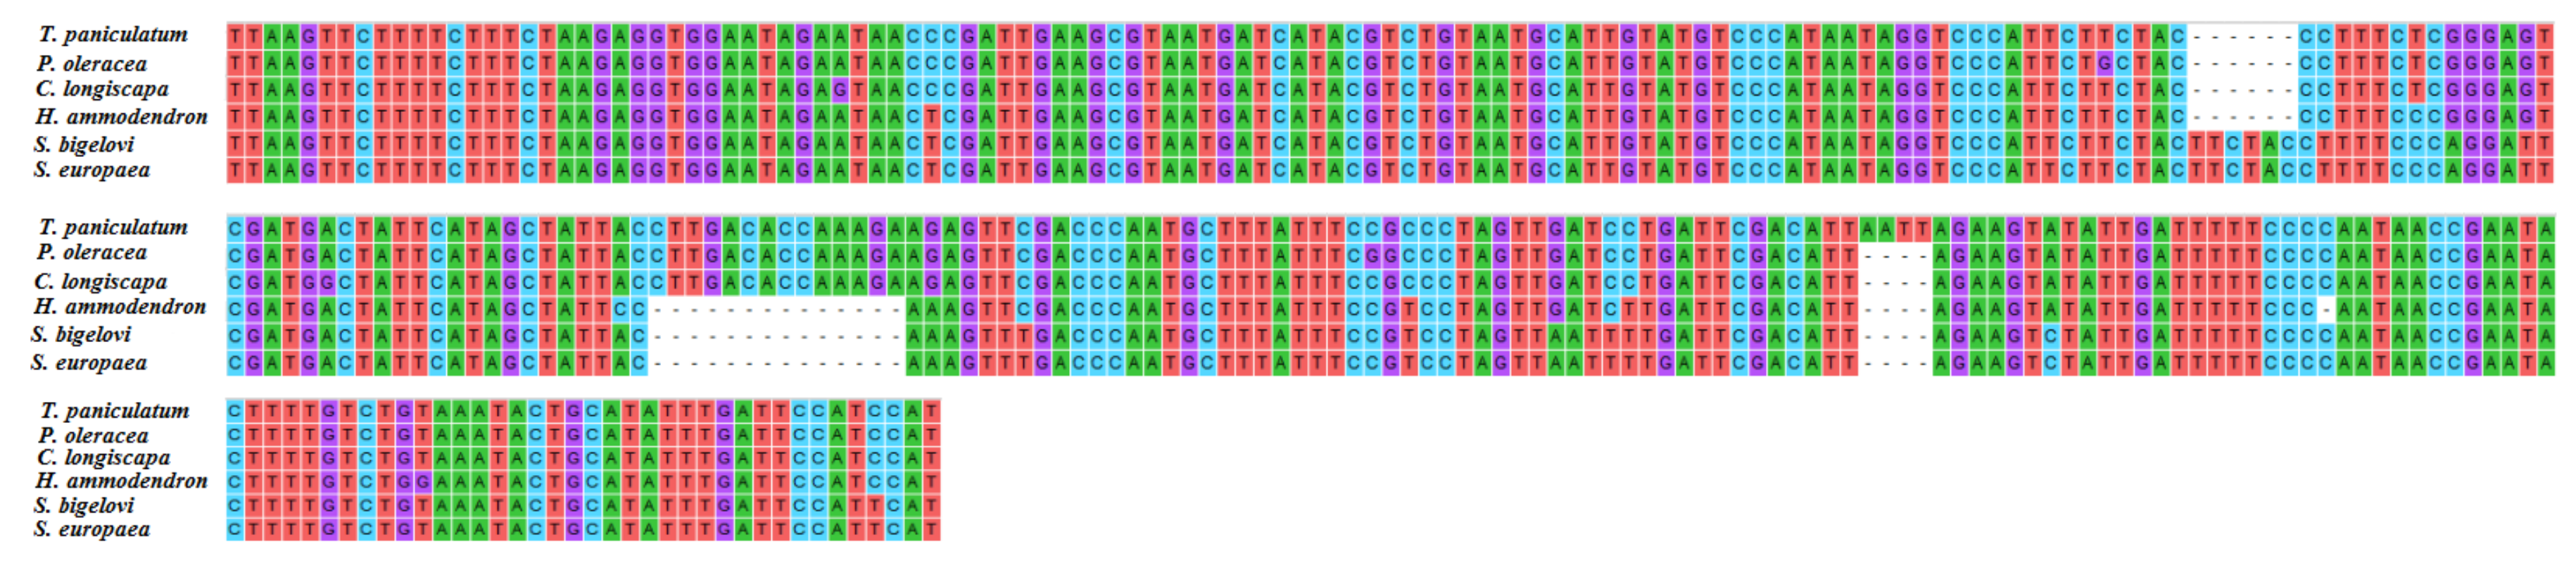
2.4. matK and rpl23 Diversity Analysis
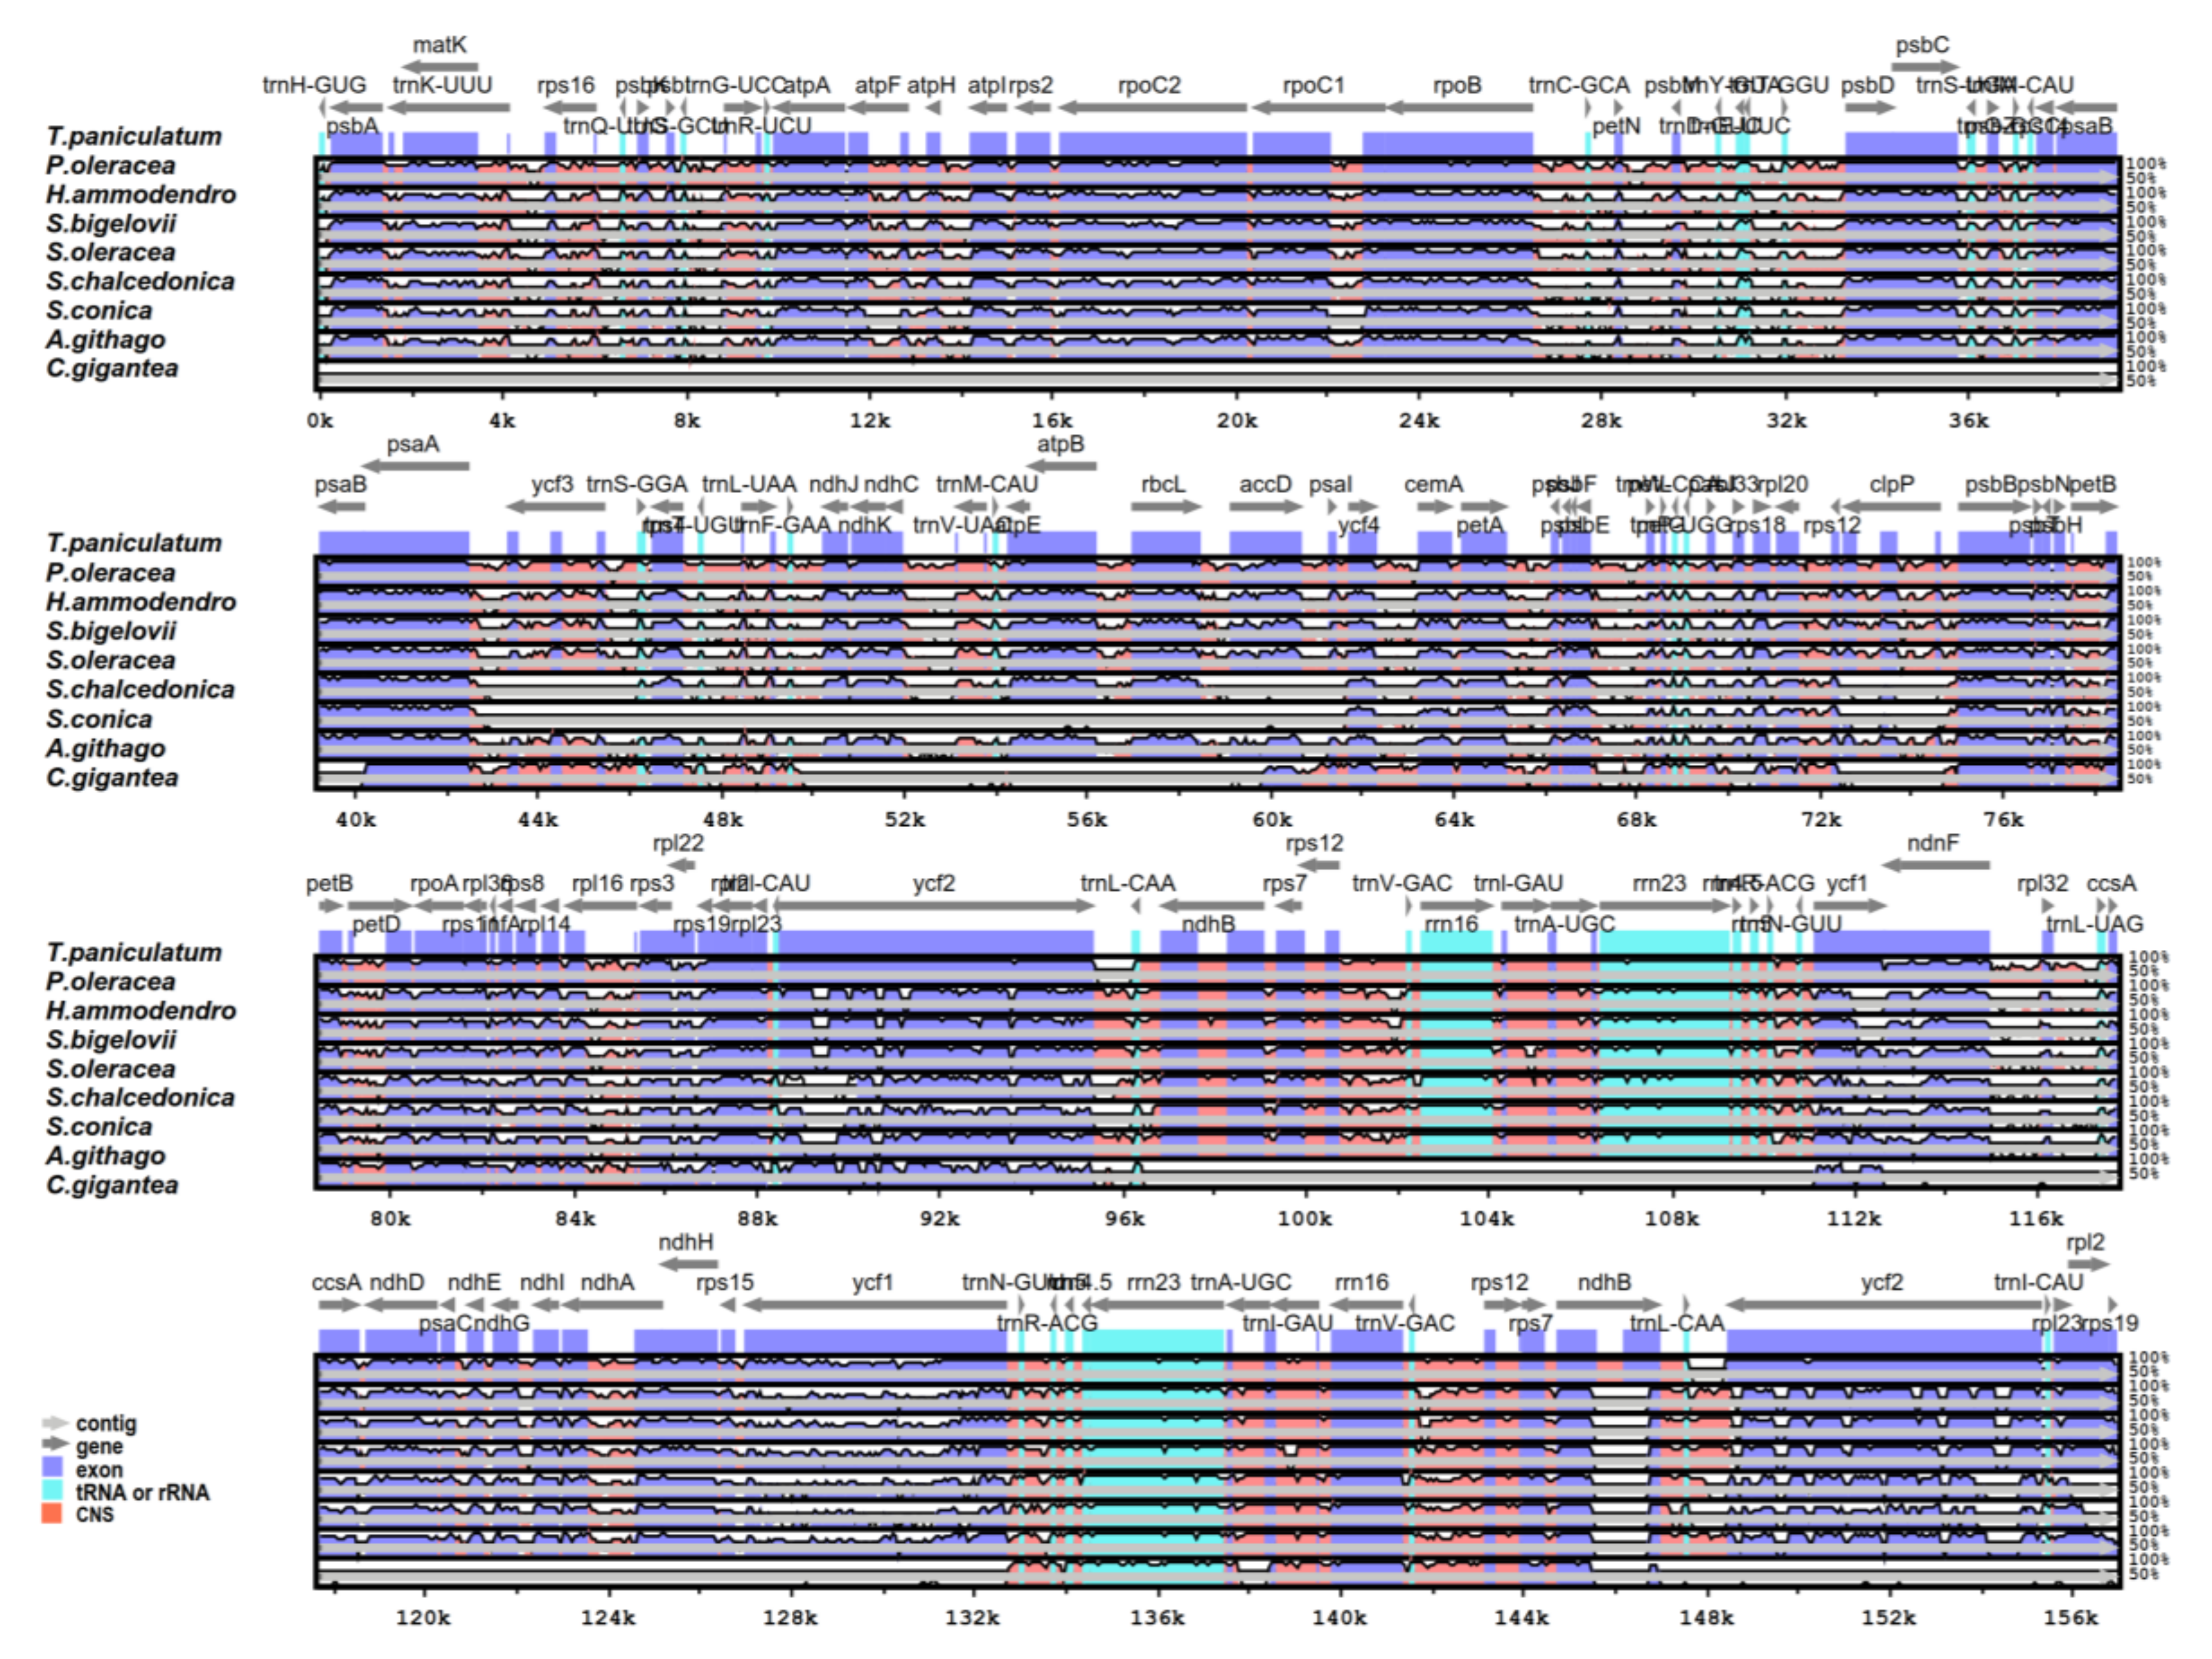
2.5. Comparative Analysis of the Chloroplast Genomes of the Caryophyllales
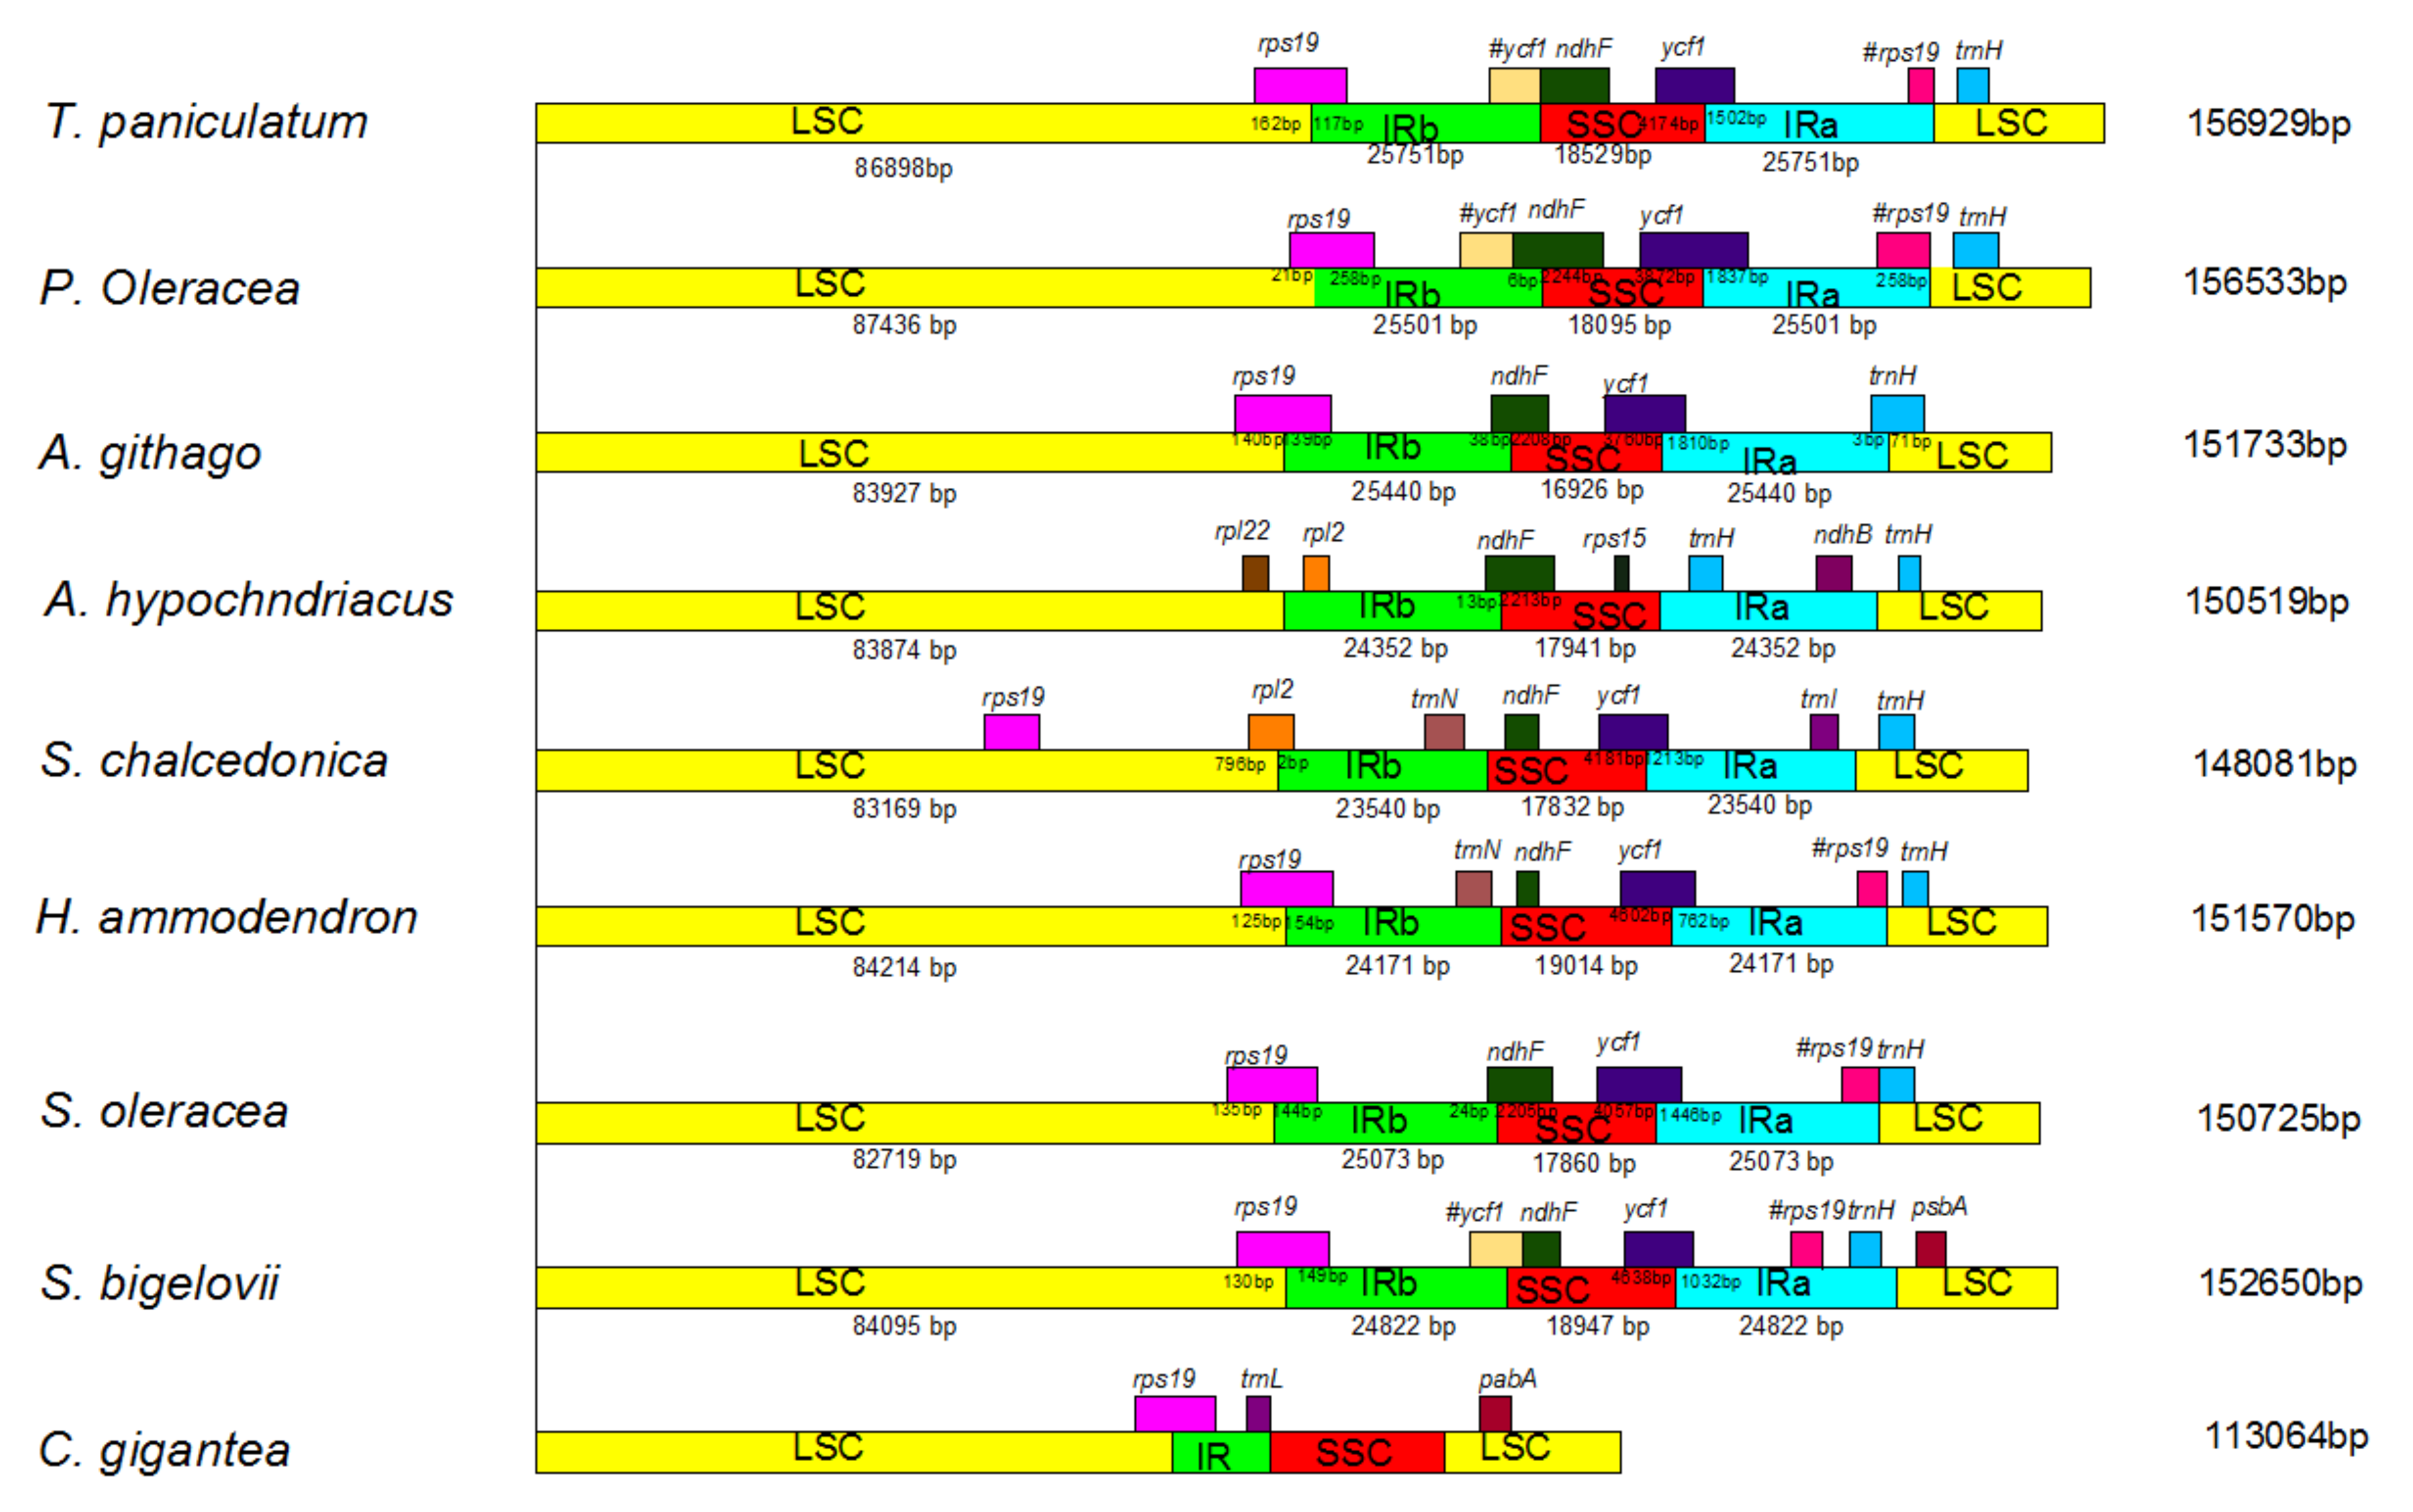
2.6. IR Expansion and Contraction
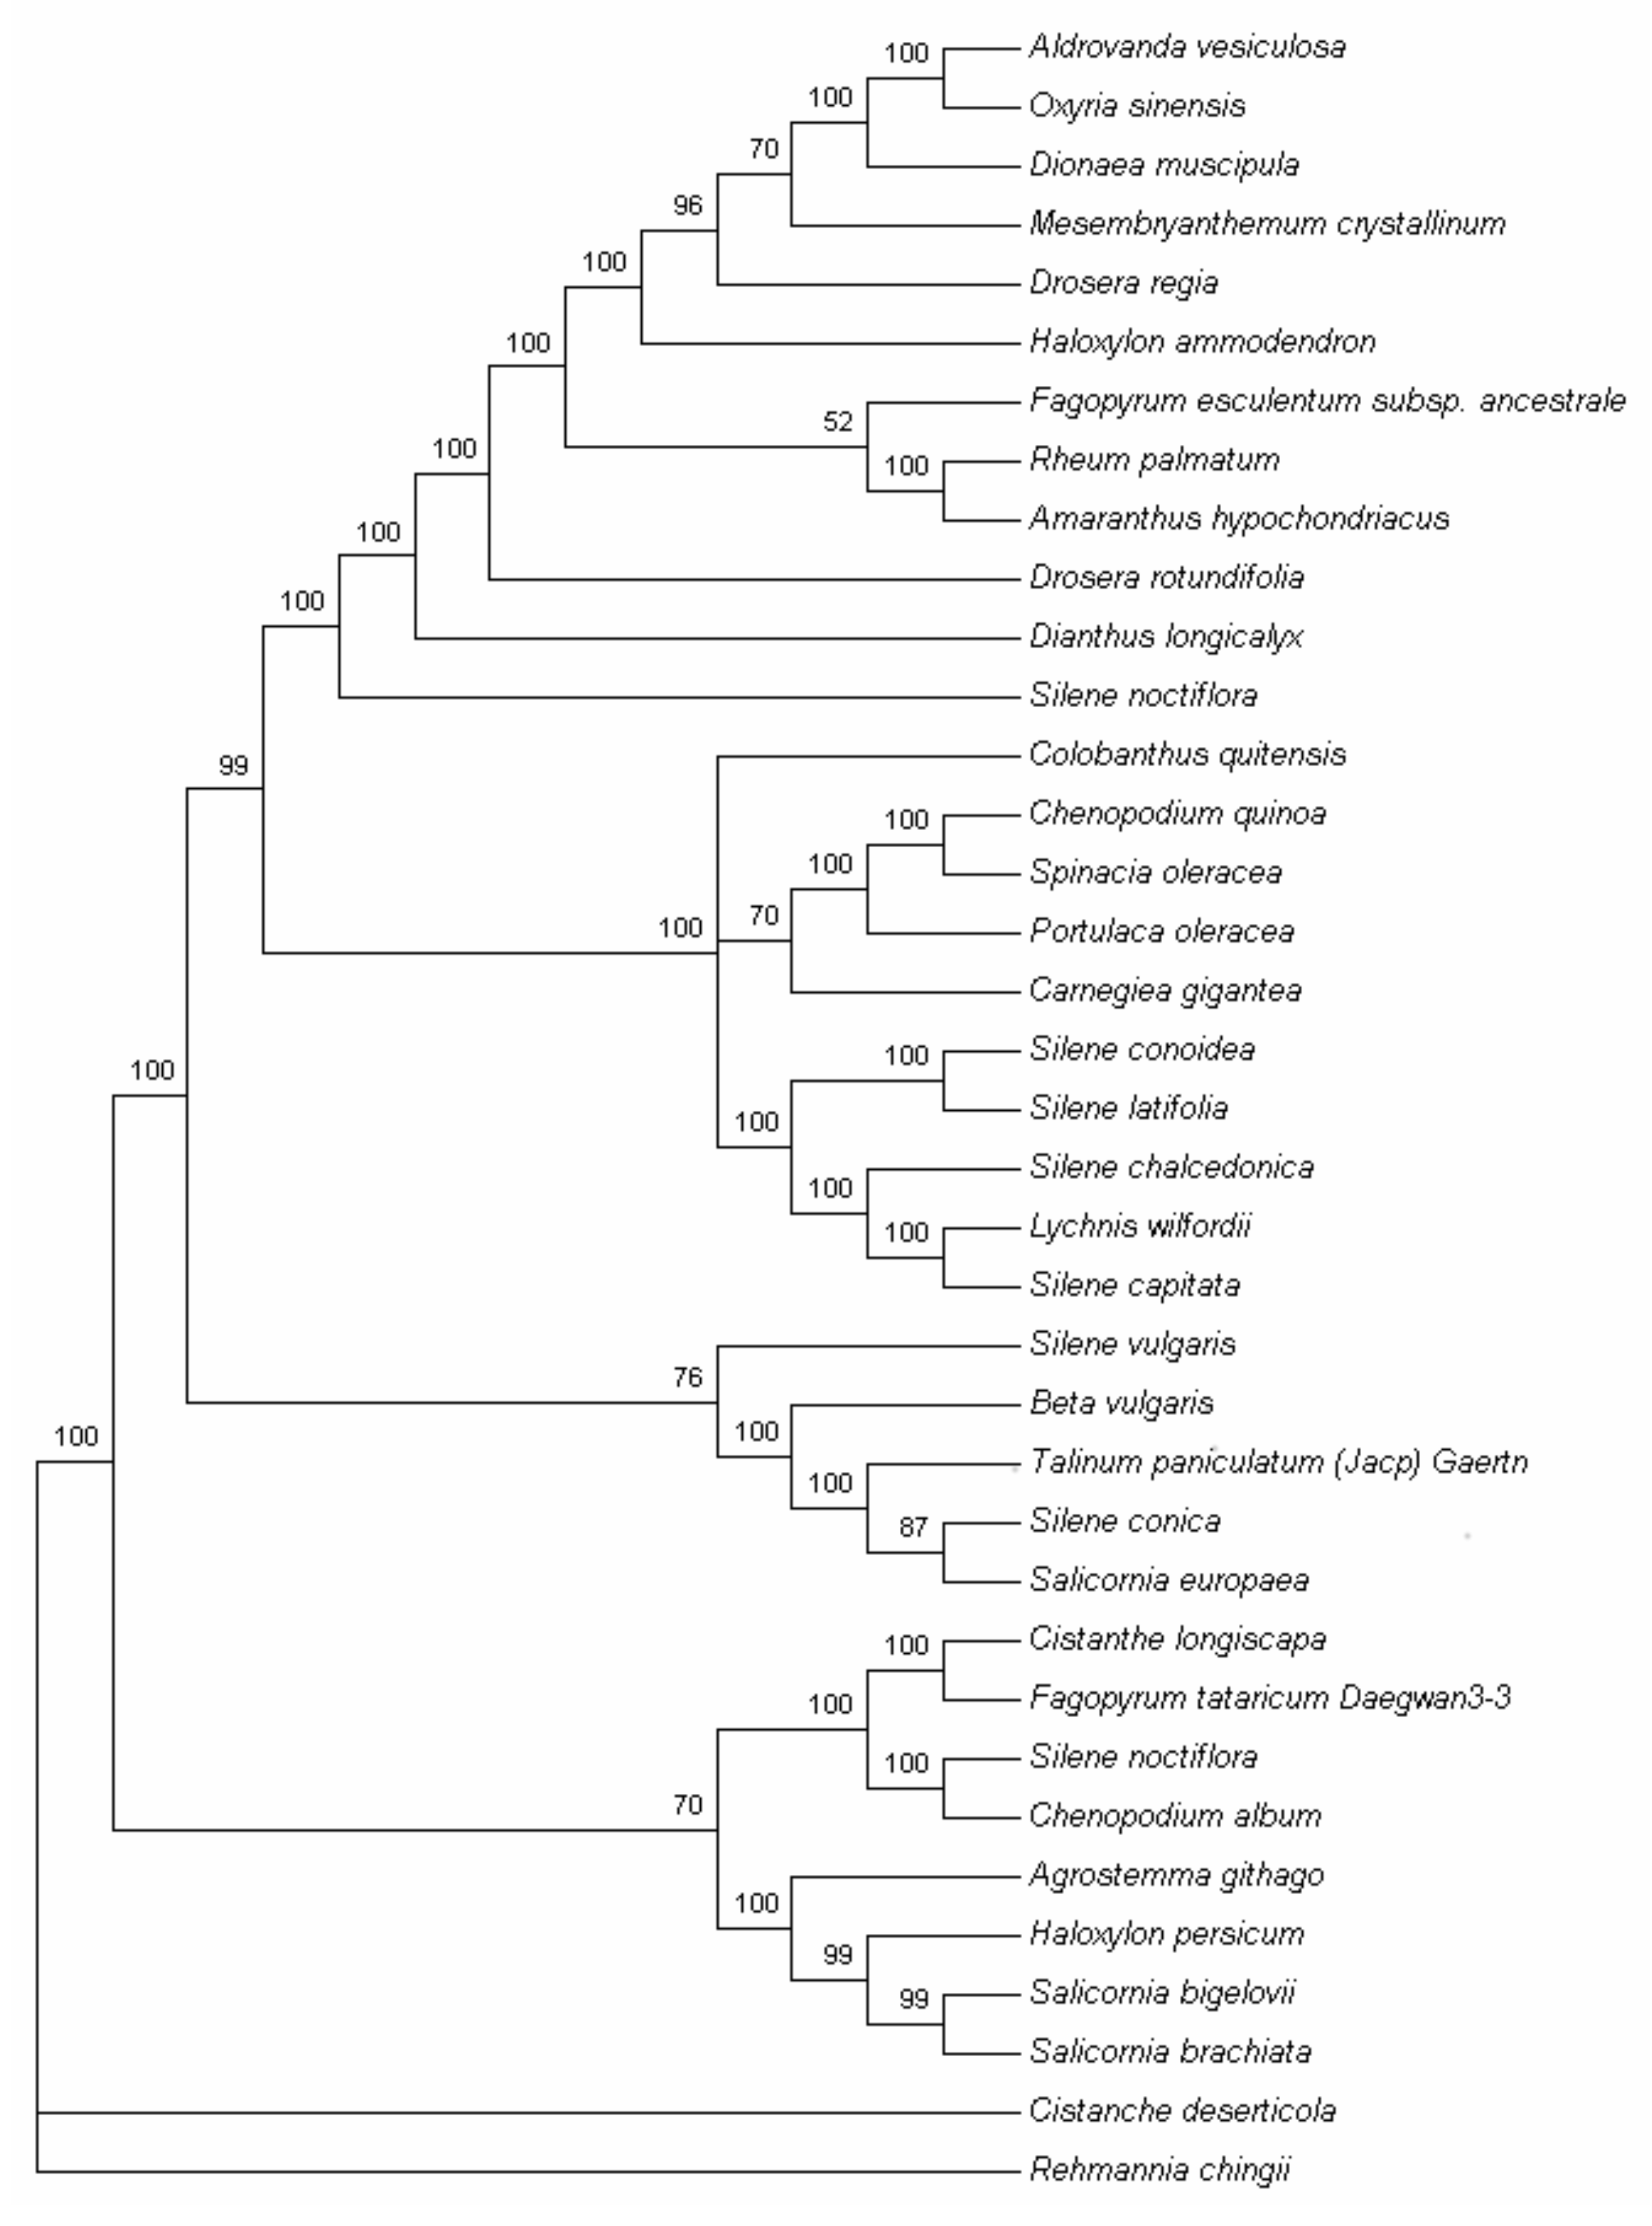
2.7. Phylogenetic Analysis
3. Discussion
4. Conclusions
5. Materials and Methods
5.1. DNA Sequencing and Genome Assembly
5.2. Gene Annotation and Codon Usage Analysis
5.3. Repeat Structure and Single Sequence Repeats (SSRs) Analysis
5.4. Comparative Genome Analysis of the T. paniculatum with Eight cp Genomes of Caryophyllales
5.5. Phylogenetic Analysis
Acknowledgments
Author Contributions
Conflicts of Interest
References
- Cazzonelli, C.I. Carotenoids in nature: Insights from plants and beyond. Funct. Plant Biol. 2011, 38, 833–847. [Google Scholar] [CrossRef]
- Daniell, H.; Lin, C.; Yu, M.; Chang, W. Chloroplast genomes: Diversity, evolution, and applications in genetic engineering. Genome Biol. 2016. [Google Scholar] [CrossRef] [PubMed]
- Bobik, K.; Burch-Smith, T.M. Chloroplast signaling within, between and beyond cells. Front. Plant Sci. 2015. [Google Scholar] [CrossRef] [PubMed]
- Bohne, A.; Schwarz, C.; Schottkowski, M.; Lidschreiber, M.; Piotrowski, M.; Zerges, W.; Nickelsen, J. Reciprocal Regulation of Protein Synthesis and Carbon Metabolism for Thylakoid Membrane Biogenesis. PLoS Biol. 2013. [Google Scholar] [CrossRef] [PubMed] [Green Version]
- Song, Y.; Chen, Y.; Lv, J.; Xu, J.; Zhu, S.; Li, M.; Chen, N. Development of Chloroplast Genomic Resources for Oryza Species Discrimination. Front. Plant Sci. 2017, 8, 1854. [Google Scholar] [CrossRef] [PubMed]
- Kang, Y.; Deng, Z.; Zang, R.; Long, W. DNA barcoding analysis and phylogenetic relationships of tree species in tropical cloud forests. Sci. Rep. UK 2017. [Google Scholar] [CrossRef] [PubMed]
- Baczkiewicz, A.; Szczecinska, M.; Sawicki, J.; Stebel, A.; Buczkowska, K. DNA barcoding, ecology and geography of the cryptic species of Aneura pinguis and their relationships with Aneura maxima and Aneura mirabilis (Metzgeriales, Marchantiophyta). PLoS ONE 2017, 12, e0188837. [Google Scholar] [CrossRef] [PubMed]
- Jansen, R.K.; Cai, Z.; Raubeson, L.A.; Daniell, H.; DePamphilis, C.W.; Leebens-Mack, J.; Mueller, K.F.; Guisinger-Bellian, M.; Haberle, R.C.; Hansen, A.K.; et al. Analysis of 81 genes from 64 plastid genomes resolves relationships in angiosperms and identifies genome-scale evolutionary patterns. Proc. Natl. Acad. Sci. USA 2007, 104, 19369–19374. [Google Scholar] [CrossRef] [PubMed]
- Su, J.; Zhu, L.; Sherman, A.; Wang, X.; Lin, S.; Kamesh, A.; Norikane, J.H.; Streatfield, S.J.; Herzog, R.W.; Daniell, H. Low cost industrial production of coagulation factor IX bioencapsulated in lettuce cells for oral tolerance induction in hemophilia B. Biomaterials 2015, 70, 84–93. [Google Scholar] [CrossRef] [PubMed]
- Sukwan, C.; Wray, S.; Kupittayanant, S. The effects of Ginseng Java root extract on uterine contractility in nonpregnant rats. Physiol. Rep. 2014, 2, e12230. [Google Scholar] [CrossRef] [PubMed]
- Jung, M.; Park, M.; Lee, H.C.; Kang, Y.H.; Kang, E.S.; Kim, S.K. Antidiabetic agents from medicinal plants. Curr. Med. Chem. 2006, 13, 1203–1218. [Google Scholar] [CrossRef] [PubMed]
- Odonne, G.; Bourdy, G.; Castillo, D.; Estevez, Y.; Lancha-Tangoa, A.; Alban-Castillo, J.; Deharo, E.; Rojas, R.; Stien, D.; Sauvain, M. Ta’ta’, Huayani: Perception of leishmaniasis and evaluation of medicinal plants used by the Chayahuita in Peru. Part II. J. Ethnopharmacol. 2009, 126, 149–158. [Google Scholar] [CrossRef] [PubMed]
- Dos Reis, L.F.C.; Cerdeira, C.D.; De Paula, B.F.; Da Silva, J.J.; Coelho, L.F.L.; Silva, M.A.; Marques, V.B.B.; Chavasco, J.K.; Alves-Da-Silva, G. Chemical Characterization and Evaluation of Antibacterial, Antifungal, Antimycobacterial, and Cytotoxic Activities of Talinum paniculatum. Rev. Inst. Med. Trop. SP 2015, 57, 397–405. [Google Scholar] [CrossRef] [PubMed]
- Thanamool, C.; Papirom, P.; Chanlun, S.; Kupittayanant, S. Talinum paniculatum (Jacq.) Gertn: A medicinal plant with potential estrogenic activity in ovariectomized rats. Int. J. Pharm. Pharm. Sci. 2013, 5, 478–485. [Google Scholar]
- Shaw, P.C.; But, P.P. Authentication of Panax species and their adulterants by random-primed polymerase chain reaction. Planta Med. 1995, 61, 466–469. [Google Scholar] [CrossRef] [PubMed]
- Assaha, D.V.M.; Mekawy, A.M.M.; Liu, L.; Noori, M.S.; Kokulan, K.S.; Ueda, A.; Nagaoka, T.; Saneoka, H. Na+ Retention in the Root is a Key Adaptive Mechanism to Low and High Salinity in the Glycophyte, Talinum paniculatum (Jacq.) Gaertn. (Portulacaceae). J. Agron. Crop Sci. 2017, 203, 56–67. [Google Scholar] [CrossRef]
- Nyffeler, R. The closest relatives of cacti: Insights from phylogenetic analyses of chloroplast and mitochondrial sequences with special emphasis on relationships in the tribe Anacampseroteae. Am. J. Bot. 2007, 94, 89–101. [Google Scholar] [CrossRef] [PubMed]
- Nyffeler, R.; Eggli, U. Disintegrating Portulacaceae: A New Familial Classification of the Suborder Portulacineae (Caryophyllales) Based on Molecular and Morphological Data. Taxon 2010, 59, 227–240. [Google Scholar]
- Nyananyo, B.L. Taxonomic studies in the genus Portulaca L. (Portulacaceae). Feddes Repert. 1987, 98, 399–402. [Google Scholar] [CrossRef]
- Ocampo, G.; Columbus, J.T. Molecular phylogenetics, historical biogeography, and chromosome number evolution of Portulaca (Portulacaceae). Mol. Phylogenet. Evol. 2012, 63, 97–112. [Google Scholar] [CrossRef] [PubMed]
- Christenhusz, M.J.M.; Byng, J.W. The number of known plant species in the world and its annual increase. Phytotaxa 2016, 261, 201–217. [Google Scholar] [CrossRef]
- Atichokudomchai, N.; Varavinit, S. Characterization and utilization of acid-modified cross-linked Tapioca starch in pharmaceutical tablets. Carbohyd. Polym. 2003, 53, 263–270. [Google Scholar] [CrossRef]
- Liu, X.; Yang, H.; Zhao, J.; Zhou, B.; Li, T.; Xiang, B. The complete chloroplast genome sequence of the folk medicinal and vegetable plant purslane (Portulaca oleracea L.). J. Hortic. Sci. Biotechnol. 2017, 92, 1–10. [Google Scholar] [CrossRef]
- Sanderson, M.J.; Copetti, D.; Burquez, A.; Bustamante, E.; Charboneau, J.L.M.; Eguiarte, L.E.; Kumar, S.; Lee, H.O.; Lee, J.; McMahon, M.; et al. Exceptional reduction of the plastid genome of saguaro cactus (Carnegiea gigantea): Loss of the ndh gene suite and inverted repeat. Am. J. Bot. 2015, 102, 1115–1127. [Google Scholar] [CrossRef] [PubMed]
- Li, X.; Yang, Y.; Henry, R.J.; Rossetto, M.; Wang, Y.; Chen, S. Plant DNA barcoding: From gene to genome. Biol. Rev. Camb. Philos. Soc. 2015, 90, 157–166. [Google Scholar] [CrossRef] [PubMed]
- Morton, B.R. Codon use and the rate of divergence of land plant chloroplast genes. Mol. Biol. Evol. 1994, 11, 231–238. [Google Scholar] [PubMed]
- Muse, S.V.; Gaut, B.S. Comparing patterns of nucleotide substitution rates among chloroplast loci using the relative ratio test. Genetics 1997, 146, 393–399. [Google Scholar] [PubMed]
- Muse, S.V. Examining rates and patterns of nucleotide substitution in plants. Plant Mol. Biol. 2000, 42, 25–43. [Google Scholar] [CrossRef] [PubMed]
- Wakeley, J. Substitution-rate variation among sites and the estimation of transition bias. Mol. Biol. Evol. 1994, 11, 436–442. [Google Scholar] [PubMed]
- Zhou, J.; Cui, Y.; Chen, X.; Li, Y.; Xu, Z.; Duan, B.; Li, Y.; Song, J.; Yao, H. Complete Chloroplast Genomes of Papaver rhoeas and Papaver orientale: Molecular Structures, Comparative Analysis, and Phylogenetic Analysis. Molecules 2018, 23, 437. [Google Scholar] [CrossRef] [PubMed]
- Zuo, L.; Shang, A.; Zhang, S.; Yu, X.; Ren, Y.; Yang, M.; Wang, J. The first complete chloroplast genome sequences of Ulmus species by de novo sequencing: Genome comparative and taxonomic position analysis. PLoS ONE 2017. [Google Scholar] [CrossRef] [PubMed]
- Jian, H.; Zhang, Y.; Yan, H.; Qiu, X.; Wang, Q.; Li, S.; Zhang, S. The Complete Chloroplast Genome of a Key Ancestor of Modern Roses, Rosa chinensis var. spontanea, and a Comparison with Congeneric Species. Molecules 2018, 23, 389. [Google Scholar] [CrossRef] [PubMed]
- Li, Z.; Saina, J.K.; Gichira, A.W.; Kyalo, C.M.; Wang, Q.; Chen, J. Comparative Genomics of the Balsaminaceae Sister Genera Hydrocera triflora and Impatiens pinfanensis. Int. J. Mol. Sci. 2018, 19, 319. [Google Scholar] [CrossRef] [PubMed]
- Carbonell-Caballero, J.; Alonso, R.; Ibanez, V.; Terol, J.; Talon, M.; Dopazo, J. A Phylogenetic Analysis of 34 Chloroplast Genomes Elucidates the Relationships between Wild and Domestic Species within the Genus Citrus. Mol. Biol. Evol. 2015, 32, 2015–2035. [Google Scholar] [CrossRef] [PubMed]
- Zoschke, R.; Nakamura, M.; Liere, K.; Sugiura, M.; Boerner, T.; Schmitz-Linneweber, C. An organellar maturase associates with multiple group II introns. Proc. Natl. Acad. Sci. USA 2010, 107, 3245–3250. [Google Scholar] [CrossRef] [PubMed]
- Sloan, D.B.; Alverson, A.J.; Wu, M.; Palmer, J.D.; Taylor, D.R. Recent Acceleration of Plastid Sequence and Structural Evolution Coincides with Extreme Mitochondrial Divergence in the Angiosperm Genus Silene. Genome Biol. Evol. 2012, 4, 294–306. [Google Scholar] [CrossRef] [PubMed]
- Sloan, D.B.; Triant, D.A.; Forrester, N.J.; Bergner, L.M.; Wu, M.; Taylor, D.R. A recurring syndrome of accelerated plastid genome evolution in the angiosperm tribe Sileneae (Caryophyllaceae). Mol. Phylogenet. Evol. 2014, 72, 82–89. [Google Scholar] [CrossRef] [PubMed]
- Bafeel, S.O.; Arif, I.A.; Bakir, M.A.; Khan, H.A.; Al Farhan, A.H.; Al Homaidan, A.A.; Ahamed, A.; Thomas, J. Comparative evaluation of PCR success with universal primers of maturase K (matK) and ribulose-1,5-bisphosphate carboxylase oxygenase large subunit (rbcL) for barcoding of some arid plants. Plant Omics 2011, 4, 195–198. [Google Scholar]
- Yu, J.; Xue, J.; Zhou, S. New universal matK primers for DNA barcoding angiosperms. J. Syst. Evol. 2011, 49, 176–181. [Google Scholar] [CrossRef]
- Heckenhauer, J.; Barfuss, M.H.J.; Samuel, R. Universal Multiplexable Matk Primers for Dna Barcoding of Angiosperms. Appl. Plant Sci. 2016, 4. [Google Scholar] [CrossRef] [PubMed]
- Qi, Y.; Li, X.; Chang, C.; Xu, F.; He, Q.; Zhao, Y.; Wu, L. Ribosomal protein L23 negatively regulates cellular apoptosis via the RPL23/Miz-1/c-Myc circuit in higher-risk myelodysplastic syndrome. Sci. Rep. 2017, 7, 2323. [Google Scholar] [CrossRef] [PubMed]
- Stoll, A.; Harpke, D.; Schutte, C.; Stefanczyk, N.; Brandt, R.; Blattner, F.R.; Quandt, D. Development of microsatellite markers and assembly of the plastid genome in Cistanthe longiscapa (Montiaceae) based on low-coverage whole genome sequencing. PLoS ONE 2017, 12, e178402. [Google Scholar] [CrossRef] [PubMed]
- Ni, L.; Zhao, Z.; Xu, H.; Chen, S.; Dorje, G. The complete chloroplast genome of Gentiana straminea (Gentianaceae), an endemic species to the Sino-Himalayan subregion. Gene 2016, 577, 281–288. [Google Scholar] [CrossRef] [PubMed]
- Khakhlova, O.; Bock, R. Elimination of deleterious mutations in plastid genomes by gene conversion. Plant J. 2006, 46, 85–94. [Google Scholar] [CrossRef] [PubMed]
- Veselova, T.D.; Dzhalilova, K.K.; Remizowa, M.V.; Timonin, A.C. Embryology of Talinum paniculatum (Jacq.) Gaertn. and T-triangulare (Jacq.) Willd. (Portulacaceae s.l., Caryophyllales). Wulfenia 2012, 19, 107–129. [Google Scholar]
- Steyn, E.; Smith, G.F. Portulacaceae-Talinum paniculatum, a naturalized weed in South Africa. Bothalia 2001, 31, 195–197. [Google Scholar]
- Lee, M.; Park, J.; Lee, H.; Sohn, S.; Lee, J. Complete chloroplast genomic sequence of Citrus platymamma determined by combined analysis of Sanger and NGS data. Hortic. Environ. Biotechnol. 2015, 56, 704–711. [Google Scholar] [CrossRef]
- Su, H.; Hogenhout, S.A.; Al-Sadi, A.M.; Kuo, C. Complete Chloroplast Genome Sequence of Omani Lime (Citrus aurantiifolia) and Comparative Analysis within the Rosids. PLoS ONE 2014. [Google Scholar] [CrossRef] [PubMed] [Green Version]
- Wang, W.; Messing, J. High-Throughput Sequencing of Three Lemnoideae (Duckweeds) Chloroplast Genomes from Total DNA. PLoS ONE 2011. [Google Scholar] [CrossRef] [PubMed]
- Yang, Y.; Zhu, J.; Feng, L.; Zhou, T.; Bei, G.; Yang, J.; Zhao, G. Plastid Genome Comparative and Phylogenetic Analyses of the Key Genera in Fagaceae: Highlighting the Effect of Codon Composition Bias in Phylogenetic Inference. Front. Plant Sci. 2018, 9. [Google Scholar] [CrossRef] [PubMed]
- Guo, S.; Guo, L.; Zhao, W.; Xu, J.; Li, Y.; Zhang, X.; Shen, X.; Wu, M.; Hou, X. Complete Chloroplast Genome Sequence and Phylogenetic Analysis of Paeonia ostii. Molecules 2018, 23, 246. [Google Scholar] [CrossRef] [PubMed]
- Wang, W.; Yu, H.; Wang, J.; Lei, W.; Gao, J.; Qiu, X.; Wang, J. The Complete Chloroplast Genome Sequences of the Medicinal Plant Forsythia suspensa (Oleaceae). Int. J. Mol. Sci. 2017, 18, 2288. [Google Scholar] [CrossRef] [PubMed]
- Shen, X.; Wu, M.; Liao, B.; Liu, Z.; Bai, R.; Xiao, S.; Li, X.; Zhang, B.; Xu, J.; Chen, S. Complete Chloroplast Genome Sequence and Phylogenetic Analysis of the Medicinal Plant Artemisia annua. Molecules 2017, 22, 1330. [Google Scholar] [CrossRef] [PubMed]
- Saina, J.K.; Gichira, A.W.; Li, Z.; Hu, G.; Wang, Q.; Liao, K. The complete chloroplast genome sequence of Dodonaea viscosa: Comparative and phylogenetic analyses. Genetica 2018, 146, 101–113. [Google Scholar] [CrossRef] [PubMed]
- Zhou, J.; Chen, X.; Cui, Y.; Sun, W.; Li, Y.; Wang, Y.; Song, J.; Yao, H. Molecular Structure and Phylogenetic Analyses of Complete Chloroplast Genomes of Two Aristolochia Medicinal Species. Int. J. Mol. Sci. 2017, 18, 1839. [Google Scholar] [CrossRef] [PubMed]
- Zhou, T.; Chen, C.; Wei, Y.; Chang, Y.; Bai, G.; Li, Z.; Kanwal, N.; Zhao, G. Comparative Transcriptome and Chloroplast Genome Analyses of Two Related Dipteronia Species. Front. Plant. Sci. 2016, 7. [Google Scholar] [CrossRef] [PubMed]
- Abugalieva, S.; Volkova, L.; Genievskaya, Y.; Ivaschenko, A.; Kotukhov, Y.; Sakauova, G.; Turuspekov, Y. Taxonomic assessment of Allium species from Kazakhstan based on ITS and matK markers. BMC Plant Biol. 2017, 172. [Google Scholar] [CrossRef] [PubMed]
- Allen, G.C.; Flores-Vergara, M.A.; Krasynanski, S.; Kumar, S.; Thompson, W.F. A modified protocol for rapid DNA isolation from plant tissues using cetyltrimethylammonium bromide. Nat. Protoc. 2006, 1, 2320–2325. [Google Scholar] [CrossRef] [PubMed]
- Wyman, S.K.; Jansen, R.K.; Boore, J.L. Automatic annotation of organellar genomes with DOGMA. Bioinformatics 2004, 20, 3252–3255. [Google Scholar] [CrossRef] [PubMed]
- Schattner, P.; Brooks, A.N.; Lowe, T.M. The tRNAscan-SE, snoscan and snoGPS web servers for the detection of tRNAs and snoRNAs. Nucl. Acids Res. 2005, 33, W686–W689. [Google Scholar] [CrossRef] [PubMed]
- Lohse, M.; Drechsel, O.; Bock, R. OrganellarGenomeDRAW (OGDRAW): A tool for the easy generation of high-quality custom graphical maps of plastid and mitochondrial genomes. Curr. Genet. 2007, 52, 267–274. [Google Scholar] [CrossRef] [PubMed]
- Tamura, K.; Peterson, D.; Peterson, N.; Stecher, G.; Nei, M.; Kumar, S. MEGA5: Molecular evolutionary genetics analysis using maximum likelihood, evolutionary distance, and maximum parsimony methods. Mol. Biol. Evol. 2011, 28, 2731–2739. [Google Scholar] [CrossRef] [PubMed]
- Kurtz, S.; Choudhuri, J.V.; Ohlebusch, E.; Schleiermacher, C.; Stoye, J.; Giegerich, R. REPuter: The manifold applications of repeat analysis on a genomic scale. Nucl. Acids Res. 2001, 29, 4633–4642. [Google Scholar] [CrossRef] [PubMed]
- Kurtz, S.; Phillippy, A.; Delcher, A.L.; Smoot, M.; Shumway, M.; Antonescu, C.; Salzberg, S.L. Versatile and open software for comparing large genomes. Genome Biol. 2004, 5, R12. [Google Scholar] [CrossRef] [PubMed]
- Frazer, K.A.; Pachter, L.; Poliakov, A.; Rubin, E.M.; Dubchak, I. VISTA: Computational tools for comparative genomics. Nucl. Acids Res. 2004, 32, W273–W279. [Google Scholar] [CrossRef] [PubMed]
- Swofford, D.L. PAUP*. Phylogenetic Analysis Using Parsimony (*and Other Methods); Version 4.0b10; Sinauer Associates: Sunderland, MA, USA, 2003. [Google Scholar]
Sample Availability: Samples of the T. paniculatum are available from the authors. |


| Region | Size (bp) | T(U) (%) | C (%) | A (%) | G (%) | Genes | Protein-Coding Genes | tRNA Genes | rRNA Genes |
|---|---|---|---|---|---|---|---|---|---|
| LSC | 86,898 | 33.2 | 17.8 | 32.2 | 16.8 | 83 | 56 | 22 | 0 |
| SSC | 18,529 | 34.6 | 15.9 | 34.9 | 14.6 | 12 | 12 | 1 | 0 |
| IRA | 25,751 | 29.0 | 22.3 | 28.2 | 20.4 | 19 | 7 | 7 | 4 |
| IRB | 25,751 | 28.2 | 20.4 | 29.0 | 22.3 | 19 | 8 | 7 | 4 |
| Total | 156,929 | 31.8 | 19.0 | 30.7 | 18.5 | 128 | 83 (4) | 37 (7) | 8 (4) |
| CDS | 78,438 | 31.5 | 17.6 | 30.8 | 20.1 | ||||
| 1st position | 26,146 | 23.7 | 18.8 | 30.7 | 26.7 | ||||
| 2nd position | 26,146 | 32.7 | 20.2 | 29.4 | 17.8 | ||||
| 3rd position | 26,146 | 38.1 | 13.7 | 32.4 | 15.7 |
| Group of Genes | Name of Gene | No. |
|---|---|---|
| Photosytem I | psaA, psaB, psaC, psaI, psaJ | 5 |
| Photosytem II | psbA, psbB, psbC, psbD, psbE, psbF, psbH, psbI, psbJ, psbK, psbL, psbM, psbN, psbT, psbZ | 15 |
| Cytochrome b/f complex | petA, petB, petD, petG, petL, petN | 6 |
| ATP system | atpA, atpB, atpF, atpF, atpH, atpI | 6 |
| NADH dehydrogenase | ndhA, ndhB *, ndhC, ndhD, ndhE, ndhF, ndhG, ndhH, ndhI, ndhJ, ndhK | 12 |
| RuBisCO large subnit | rbcL | 1 |
| RNA polymerase | rpoA, rpoB, rpoC1, rpoC2 | 4 |
| Ribosomal proteins (SSU) | rps2, rps3, rps4, rps7 *, rps8, rps11, rps12 *, rps14, rps15, rps16, rps18, rps19 | 14 |
| Ribosomal proteins (LSU) | rpl2, rpl14, rpl16, rpl19, rpl20, rpl22, rpl32, rpl33, rpl36 | 9 |
| Miscellaneous proteins | accD, cemA, ccsA, clpP, infA, matK | 6 |
| Hypothetical chloroplast reading frames (ycf) | ycf1, ycf2 *, ycf3, ycf4 | 5 |
| Transfer RNAs | trnA-UGC *, trnC-GCA, trnD-GUC, trnE-UUC, trnF-GAA, trnG-UCC, trnG-GCC, trnH-GUG, trnI-CAU *, trnIGAU *, trnK-UUU, trnL-UAA, trnL-CAA *, trnL-UAG, trnM-CAU, trnN-GUU *, trnP-UGG, trnQ-UUG, trnR-UCU, trnRACG *, trnS-GCU, trnS-UGA, trnS-GGA, trnT-GGU, trnT-UGU, trnV-UAC, trnV-GAC *, trnW-CCA, trnY-GUA, trnfM-CAU | 37 |
| Ribosomal RNAs | rrn4.5 *, rrn5 *, rrn16 *, rrn23 * | 8 |
| Pseudogene | rpl23 *, rps19, ycf1 | 4 |
| Total | 132 |
| No. | Gene | Location | ExonI (bp) | IntronI (bp) | ExonII (bp) | IntronII (bp) | ExonIII (bp) |
|---|---|---|---|---|---|---|---|
| 1 | trnK-UUU | LSC | 35 | 2502 | 37 | ||
| 2 | rps16 | LSC | 202 | 867 | 41 | ||
| 3 | trnG-UCC | LSC | 23 | 707 | 48 | ||
| 4 | atpF | LSC | 410 | 745 | 145 | ||
| 5 | rpoC1 | LSC | 1611 | 794 | 432 | ||
| 6 | ycf3 | LSC | 153 | 773 | 229 | 769 | 125 |
| 7 | trnL-UAA | LSC | 37 | 599 | 50 | ||
| 8 | trnV-UAC | LSC | 35 | 586 | 38 | ||
| 9 | clpP | LSC | 229 | 590 | 291 | 894 | 71 |
| 10 | petB | LSC | 6 | 768 | 642 | ||
| 11 | petD | LSC | 8 | 792 | 475 | ||
| 12 | rpl16 | LSC | 399 | 1102 | 9 | ||
| 13 | ndhB * | IR | 756 | 668 | 777 | ||
| 14 | rps12 * | IR | 114 | - | 232 | 533 | 26 |
| 15 | trnI-GAU * | IR | 37 | 947 | 35 | ||
| 16 | trnA-UGC * | IR | 38 | 818 | 35 | ||
| 17 | ndhA | SSC | 539 | 1087 | 553 |
| Amino Acid | Codon | Count | RSCU | Amino Acid | Codon | Count | RSCU | Amino Acid | Codon | Count | RSCU | Amino Acid | Codon | Count | RSCU |
|---|---|---|---|---|---|---|---|---|---|---|---|---|---|---|---|
| Phe | UUU(F) | 975 | 1.3 | Ser | UCU(S) | 556 | 1.67 | Tyr | UAU(Y) | 779 | 1.61 | Stop | UGA(*) | 20 | 0.72 |
| Phe | UUC(F) | 527 | 0.7 | Ser | UCC(S) | 331 | 0.99 | Tyr | UAC(Y) | 190 | 0.39 | Trp | UGG(W) | 460 | 1 |
| Leu | UUA(L) | 854 | 1.84 | Ser | UCA(S) | 408 | 1.22 | Stop | UAA(*) | 46 | 1.66 | Ala | GCU(A) | 615 | 1.75 |
| Leu | UUG(L) | 554 | 1.2 | Ser | UCG(S) | 187 | 0.56 | Stop | UAG(*) | 17 | 0.61 | Ala | GCC(A) | 234 | 0.66 |
| Leu | CUU(L) | 601 | 1.3 | Ser | AGU(S) | 393 | 1.18 | His | CAU(H) | 448 | 1.49 | Ala | GCA(A) | 416 | 1.18 |
| Leu | CUC(L) | 179 | 0.39 | Ser | AGC(S) | 127 | 0.38 | His | CAC(H) | 155 | 0.51 | Ala | GCG(A) | 144 | 0.41 |
| Leu | CUA(L) | 408 | 0.88 | Pro | CCU(P) | 426 | 1.6 | Gln | CAA(Q) | 729 | 1.54 | Arg | CGU(R) | 360 | 1.36 |
| Leu | CUG(L) | 184 | 0.4 | Pro | CCC(P) | 200 | 0.75 | Gln | CAG(Q) | 216 | 0.46 | Arg | CGC(R) | 92 | 0.35 |
| Ile | AUU(I) | 1130 | 1.5 | Pro | CCA(P) | 299 | 1.12 | Asn | AAU(N) | 960 | 1.53 | Arg | CGA(R) | 366 | 1.38 |
| Ile | AUC(I) | 410 | 0.54 | Pro | CCG(P) | 143 | 0.54 | Asn | AAC(N) | 297 | 0.47 | Arg | CGG(R) | 120 | 0.45 |
| Ile | AUA(I) | 718 | 0.95 | Thr | ACU(T) | 531 | 1.61 | Lys | AAA(K) | 1061 | 1.5 | Arg | AGA(R) | 475 | 1.79 |
| Met | AUG(M) | 607 | 1 | Thr | ACC(T) | 250 | 0.76 | Lys | AAG(K) | 357 | 0.5 | Arg | AGG(R) | 175 | 0.66 |
| Val | GUU(V) | 514 | 1.48 | Thr | ACA(T) | 402 | 1.22 | Asp | GAU(D) | 883 | 1.66 | Gly | GGU(G) | 552 | 1.26 |
| Val | GUC(V) | 160 | 0.46 | Thr | ACG(T) | 134 | 0.41 | Asp | GAC(D) | 184 | 0.34 | Gly | GGC(G) | 190 | 0.43 |
| Val | GUA(V) | 522 | 1.5 | Cys | UGU(C) | 235 | 1.55 | Glu | GAA(E) | 1041 | 1.53 | Gly | GGA(G) | 712 | 1.62 |
| Val | GUG(V) | 194 | 0.56 | Cys | UGC(C) | 68 | 0.45 | Glu | GAG(E) | 323 | 0.47 | Gly | GGG(G) | 302 | 0.69 |
| No. | Size (bp) | Type | Repeat 1 Start | Repeat 1 Location | Repeat 2 Start | Repeat 2 Location | Location |
|---|---|---|---|---|---|---|---|
| 1 | 35 | F | 3144 | matK | 6441 | IGS (rps16, trnQ-UUG) | LSC |
| 2 | 30 | P | 4153 | IGS (trnK-UUU (exon), rps16) | 4211 | IGS (trnK-UUU (exon), rps16) | LSC |
| 3 | 30 | R | 4578 | IGS (trnK-UUU (exon), rps16) | 4581 | IGS (trnK-UUU (exon), rps16) | LSC |
| 4 | 30 | C | 4581 | IGS (trnK-UUU (exon), rps16) | 4582 | IGS (trnK-UUU (exon), rps16) | LSC |
| 5 | 30 | R | 6862 | IGS (trnQ-UUG, psbK) | 8268 | IGS (trnS-GCU, trnG-UCC) | LSC |
| 6 | 30 | F | 7743 | IGS (psbI, trnS-GCU) | 7770 | IGS (psbI, trnS-GCU) | LSC |
| 7 | 32 | F | 7896 | IGS (psbI, trnS-GCU) | 36,017 | IGS (psbC, trnS-UGA) | LSC |
| 8 | 30 | P | 7898 | IGS (psbI, trnS-GCU) | 46,268 | trnS-GGA | LSC |
| 9 | 37 | R | 8258 | IGS (trnS-GCU, trnG-UCC) | 8261 | IGS (trnS-GCU, trnG-UCC) | LSC |
| 10 | 37 | R | 8258 | IGS (trnS-GCU, trnG-UCC) | 8264 | IGS (trnS-GCU, trnG-UCC) | LSC |
| 11 | 35 | F | 8258 | IGS (trnS-GCU, trnG-UCC) | 8277 | IGS (trnS-GCU, trnG-UCC) | LSC |
| 12 | 35 | R | 8266 | IGS (trnS-GCU, trnG-UCC) | 8277 | IGS (trnS-GCU, trnG-UCC) | LSC |
| 13 | 34 | R | 8258 | IGS (trnS-GCU, trnG-UCC) | 8261 | IGS (trnS-GCU, trnG-UCC) | LSC |
| 14 | 33 | F | 8261 | IGS (trnS-GCU, trnG-UCC) | 8283 | IGS (trnS-GCU, trnG-UCC) | LSC |
| 15 | 32 | R | 8263 | IGS (trnS-GCU, trnG-UCC) | 8280 | IGS (trnS-GCU, trnG-UCC) | LSC |
| 16 | 31 | F | 8261 | IGS (trnS-GCU, trnG-UCC) | 8264 | IGS (trnS-GCU, trnG-UCC) | LSC |
| 17 | 31 | R | 8261 | IGS (trnS-GCU, trnG-UCC) | 8280 | IGS (trnS-GCU, trnG-UCC) | LSC |
| 18 | 31 | R | 8267 | IGS (trnS-GCU, trnG-UCC) | 29,873 | IGS (psbM, trnD-GUC) | LSC |
| 19 | 30 | P | 8267 | IGS (trnS-GCU, trnG-UCC) | 62,668 | IGS (ycf4, cemA) | LSC |
| 20 | 30 | P | 8280 | IGS (trnS-GCU, trnG-UCC) | 31,428 | IGS (trnE-UUC, trnT-GGU) | LSC |
| 21 | 31 | F | 9566 | trnG-UCC | 37,057 | trnG-GCC | LSC |
| 22 | 30 | P | 36,019 | IGS (psbC, trnS-UGA) | 46,268 | trnS-GGA | LSC |
| 23 | 30 | F | 39,314 | psaB | 41,538 | psaA | LSC |
| 24 | 42 | F | 44,540 | ycf3 (intronII) | 123,558 | ndhA (intron) | LSC, SSC |
| 25 | 39 | F | 44,543 | ycf3 (intronII) | 100,738 | IGS (rps12, trnV-GAC) | LSC, IRb |
| 26 | 39 | P | 44,543 | ycf3 (intronII) | 143,050 | IGS (trnV-GAC, rps12) | LSC, IRa |
| 27 | 30 | F | 44,555 | ycf3 (intronII) | 100,750 | IGS (rps12, trnV-GAC) | LSC, IRb |
| 28 | 30 | P | 44,555 | ycf3 (intronII) | 143,047 | IGS (trnV-GAC, rps12) | LSC, IRa |
| 29 | 40 | P | 76,849 | IGS (psbT, psbN) | 76,849 | IGS (psbT, psbN) | LSC |
| 30 | 30 | P | 84,344 | IGS (trnS-GCU, trnG-UCC) | 84,346 | IGS (trnS-GCU, trnG-UCC) | LSC |
| 31 | 61 | F | 93,517 | ycf2 | 93,535 | ycf2 | IRb |
| 32 | 61 | P | 93,517 | ycf2 | 150,231 | ycf2 | IRb, IRa |
| 33 | 61 | P | 93,535 | ycf2 | 150,249 | ycf2 | IRb, IRa |
| 34 | 61 | F | 150,231 | ycf2 | 150,249 | ycf2 | IRa |
| 35 | 52 | F | 93,526 | ycf2 | 93,544 | ycf2 | IRb |
| 36 | 52 | P | 93,526 | ycf2 | 150,231 | ycf2 | IRb, IRa |
| 37 | 52 | P | 93,544 | ycf2 | 150,249 | ycf2 | IRb, IRa |
| 38 | 34 | F | 93,526 | ycf2 | 93,562 | ycf2 | IRb |
| 39 | 34 | P | 93,526 | ycf2 | 150,231 | ycf2 | IRb, IRa |
| 40 | 34 | P | 93,562 | ycf2 | 150,267 | ycf2 | IRb, IRa |
| 41 | 43 | F | 93,517 | ycf2 | 93,533 | ycf2 | IRb |
| 42 | 43 | P | 93,517 | ycf2 | 150,231 | ycf2 | IRb, IRa |
| 43 | 43 | P | 93,553 | ycf2 | 150,267 | ycf2 | IRb, IRa |
| 44 | 43 | F | 150,231 | ycf2 | 150,267 | ycf2 | IRa |
| 45 | 40 | F | 100,738 | IGS (rps12, trnV-GAC) | 123,561 | ndhA (intron) | IRb, SSC |
| 46 | 34 | F | 109,506 | IGS (rrn4.5, rrn5) | 109,538 | IGS (rrn4.5, rrn5) | IRb |
| 47 | 34 | F | 109,506 | IGS (rrn4.5, rrn5) | 134,255 | IGS (rrn5, rrn4.5) | IRb, IRa |
| 48 | 34 | P | 109,538 | IGS (rrn4.5, rrn5) | 134,287 | IGS (rrn5, rrn4.5) | IRb, IRa |
| 49 | 34 | P | 134,255 | IGS (rrn5, rrn4.5) | 134,287 | IGS (rrn5, rrn4.5) | IRa |
| 50 | 38 | P | 118,646 | IGS (ccsA, ndhD) | 118,646 | IGS (ccsA, ndhD) | SSC |
| 51 | 40 | P | 123,561 | ndhA (intron) | 143,049 | IGS(trnV-GAC, rps12) | SSC, IRa |
| Length Unit | 10 | 10 | 11 | 12 | 13 | 14 | 15 | 16 | 17 | 18 | 19 | 20 | Total |
|---|---|---|---|---|---|---|---|---|---|---|---|---|---|
| A | 15 | 15 | 3 | 8 | 1 | 1 | 3 | 1 | 1 | 33 | |||
| T | 14 | 14 | 4 | 7 | 3 | 2 | 1 | 1 | 1 | 33 | |||
| C | 1 | 1 | 1 | ||||||||||
| G | 1 | 1 | 1 | ||||||||||
| AG | 1 | 1 | 1 | ||||||||||
| AT | 4 | 4 | 3 | 7 | |||||||||
| TA | 2 | 2 | 1 | 1 | 4 | ||||||||
| AAT | 1 | 1 | 1 | ||||||||||
| ATA | 1 | 1 | |||||||||||
| TTA | 2 | 2 | |||||||||||
| TAT | 1 | 1 | |||||||||||
| AGGT | 1 | 1 | |||||||||||
| ATGG | 1 | 1 | |||||||||||
| AATT | 1 | 1 | |||||||||||
| CTAC | 1 | 1 | |||||||||||
| TTTC | 1 | 1 | |||||||||||
| TAAT | 1 | 1 | |||||||||||
| GGAA | 1 | 1 |
| No. | Type | Motif | Size | Start | End | Location | Region |
|---|---|---|---|---|---|---|---|
| 1 | P1 | (A)10 | 10 | 47 | 56 | trnH-UGG | LSC |
| 2 | P1 | (A)10 | 10 | 637 | 646 | psbA | LSC |
| 3 | P1 | (A)11 | 11 | 2104 | 2114 | matK | LSC |
| 4 | P1 | (A)12 | 12 | 3942 | 3953 | trnK-UUU (intron) | LSC |
| 5 | P2 | (AT)5 | 10 | 755 | 764 | psbA | LSC |
| 6 | P4 | (AATT)3 | 12 | 3974 | 3985 | trnK-UUU (intron) | LSC |
| 7 | P4 | (CCAT)3 | 12 | 54 | 65 | trnH-UGG | LSC |
© 2018 by the authors. Licensee MDPI, Basel, Switzerland. This article is an open access article distributed under the terms and conditions of the Creative Commons Attribution (CC BY) license (http://creativecommons.org/licenses/by/4.0/).
Share and Cite
Liu, X.; Li, Y.; Yang, H.; Zhou, B. Chloroplast Genome of the Folk Medicine and Vegetable Plant Talinum paniculatum (Jacq.) Gaertn.: Gene Organization, Comparative and Phylogenetic Analysis. Molecules 2018, 23, 857. https://doi.org/10.3390/molecules23040857
Liu X, Li Y, Yang H, Zhou B. Chloroplast Genome of the Folk Medicine and Vegetable Plant Talinum paniculatum (Jacq.) Gaertn.: Gene Organization, Comparative and Phylogenetic Analysis. Molecules. 2018; 23(4):857. https://doi.org/10.3390/molecules23040857
Chicago/Turabian StyleLiu, Xia, Yuan Li, Hongyuan Yang, and Boyang Zhou. 2018. "Chloroplast Genome of the Folk Medicine and Vegetable Plant Talinum paniculatum (Jacq.) Gaertn.: Gene Organization, Comparative and Phylogenetic Analysis" Molecules 23, no. 4: 857. https://doi.org/10.3390/molecules23040857