Smart Tactile Sensing Systems Based on Embedded CNN Implementations


Abstract
1. Introduction
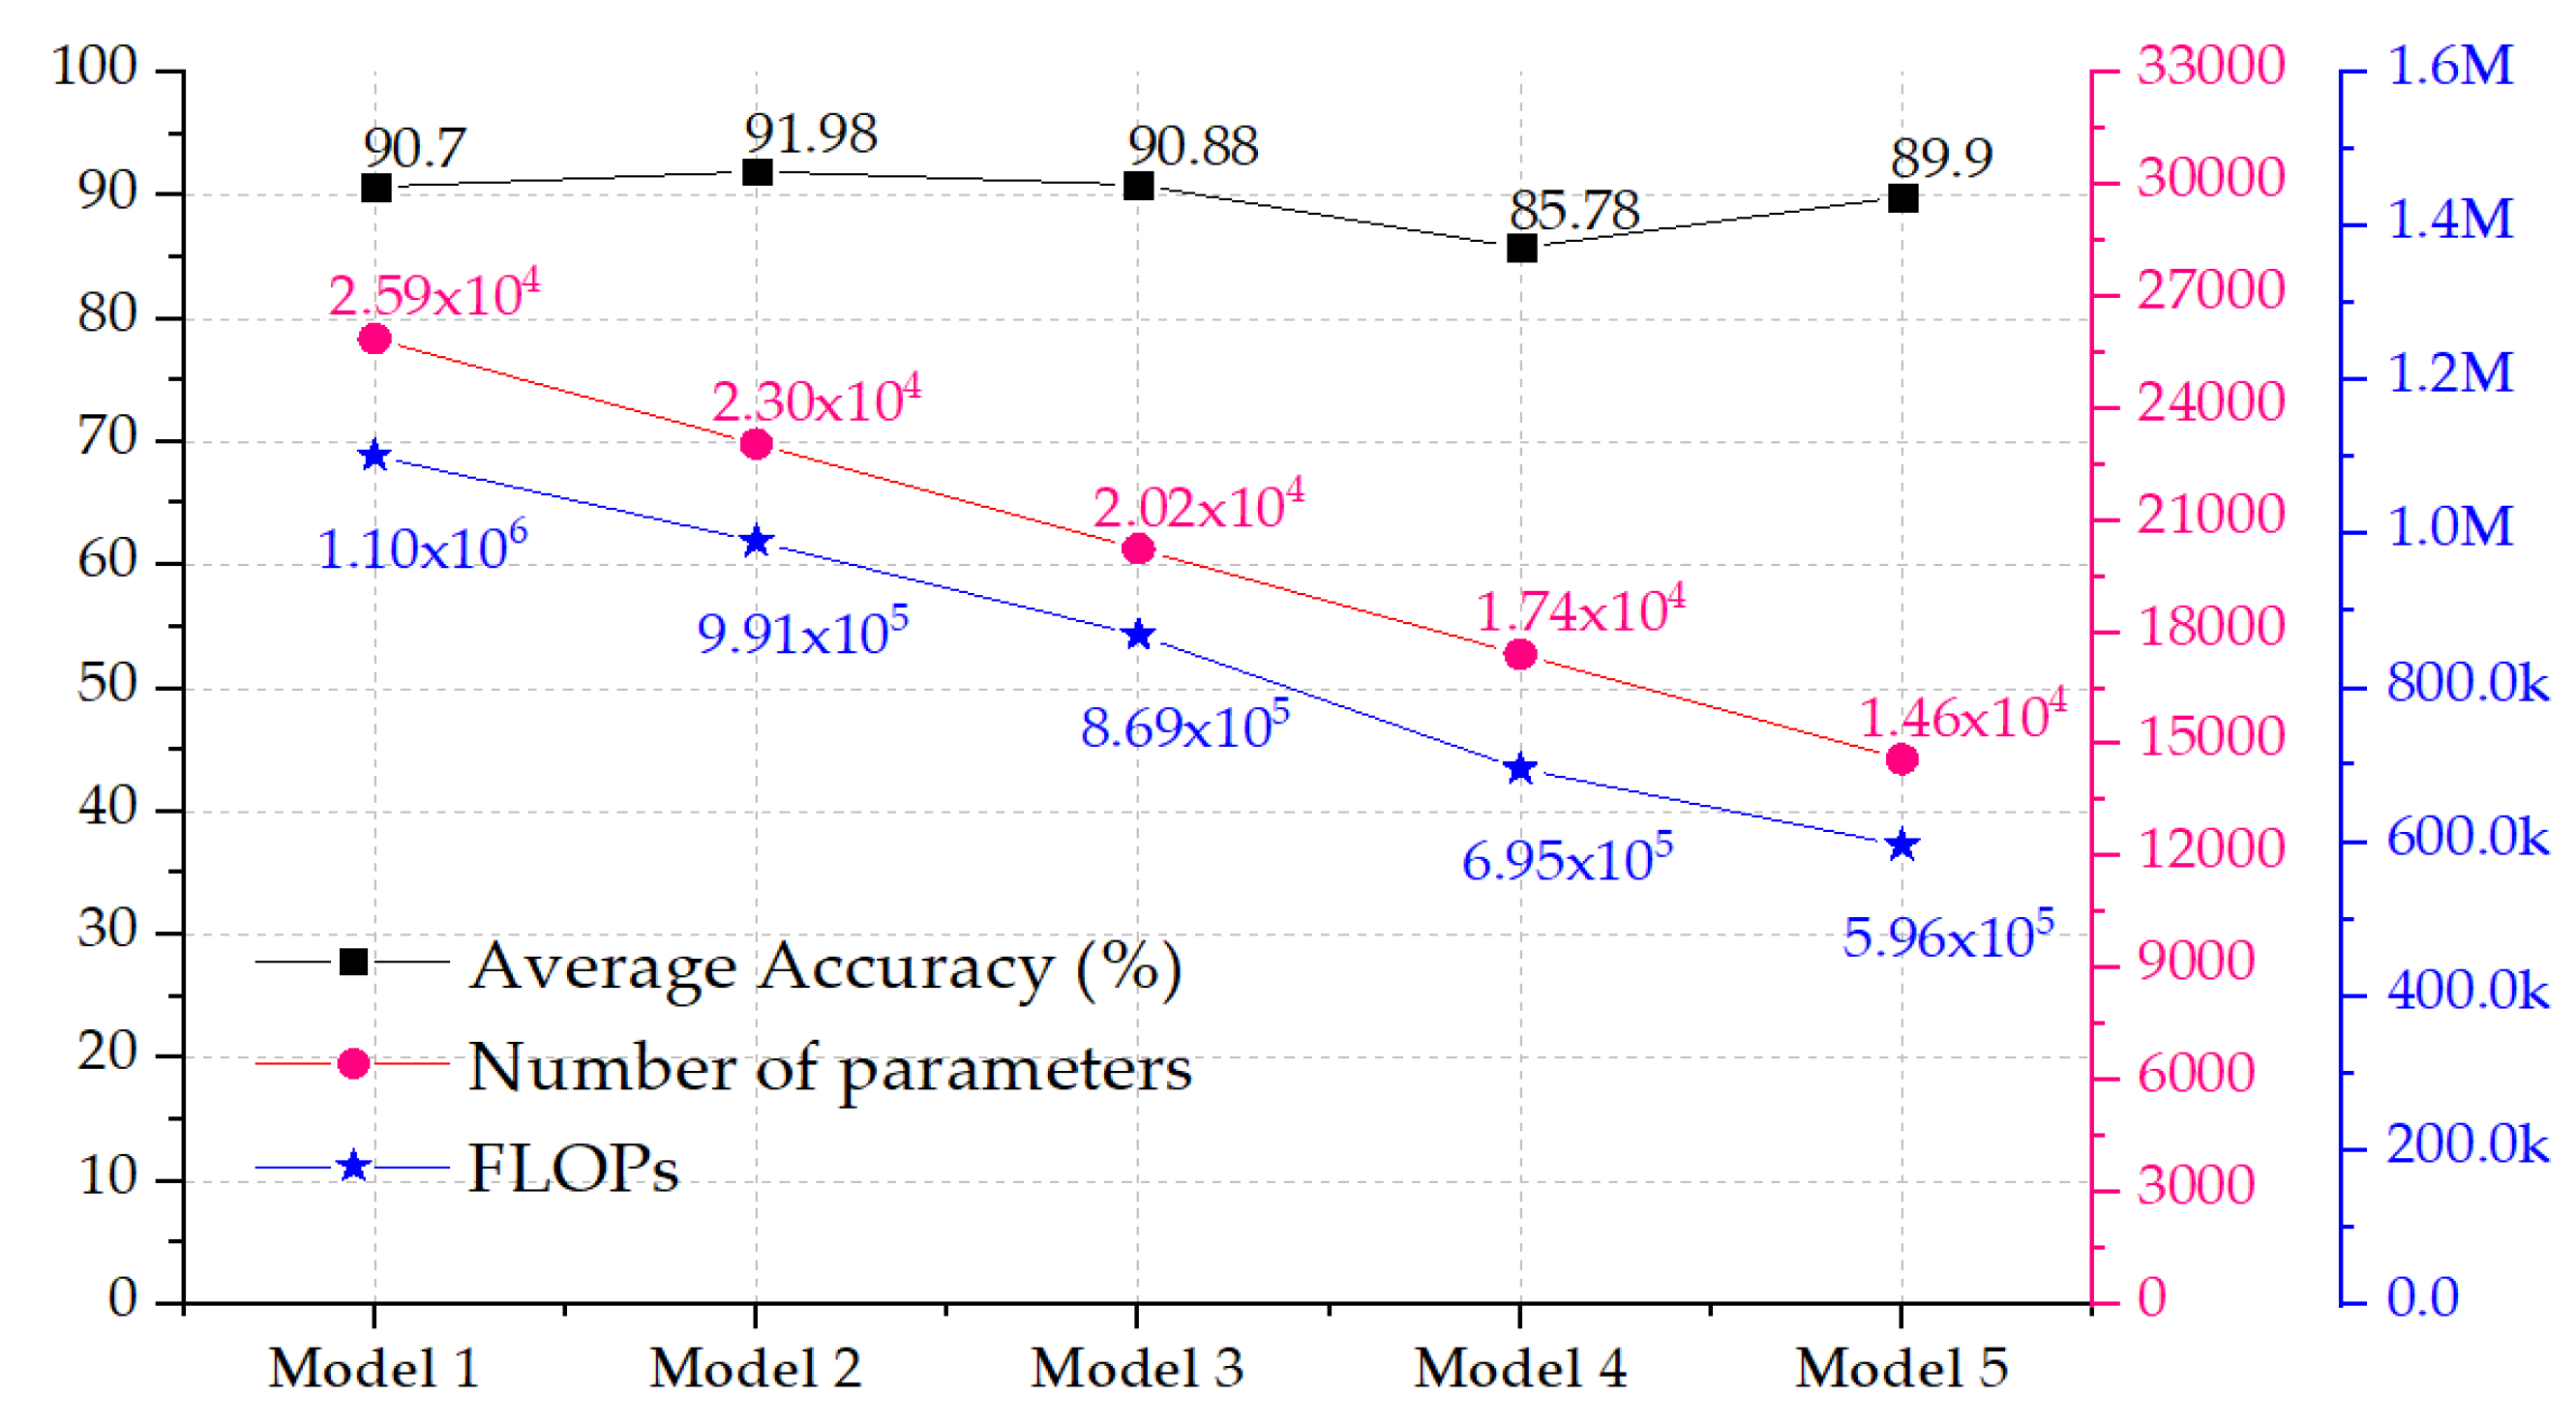
- It proposes an optimized CNN model, adopted from Gandarias et al.’s research [5], based on reduced data, which demonstrates the ability to provide comparable results in terms of accuracy, i.e., 90.88%, with reduced hardware complexity.
- It presents efficient implementations of the CNN model on different hardware platforms for embedded tactile data processing. The proposed implementations achieve a time inference of 1.2 ms while consuming around 900 J. The work demonstrates its suitability for real-time embedded tactile sensing systems.
- It raises a discussion about integrating intelligence into tactile sensing systems and how it enables tactile sensing systems in different application domains.
2. State-of-the-Art
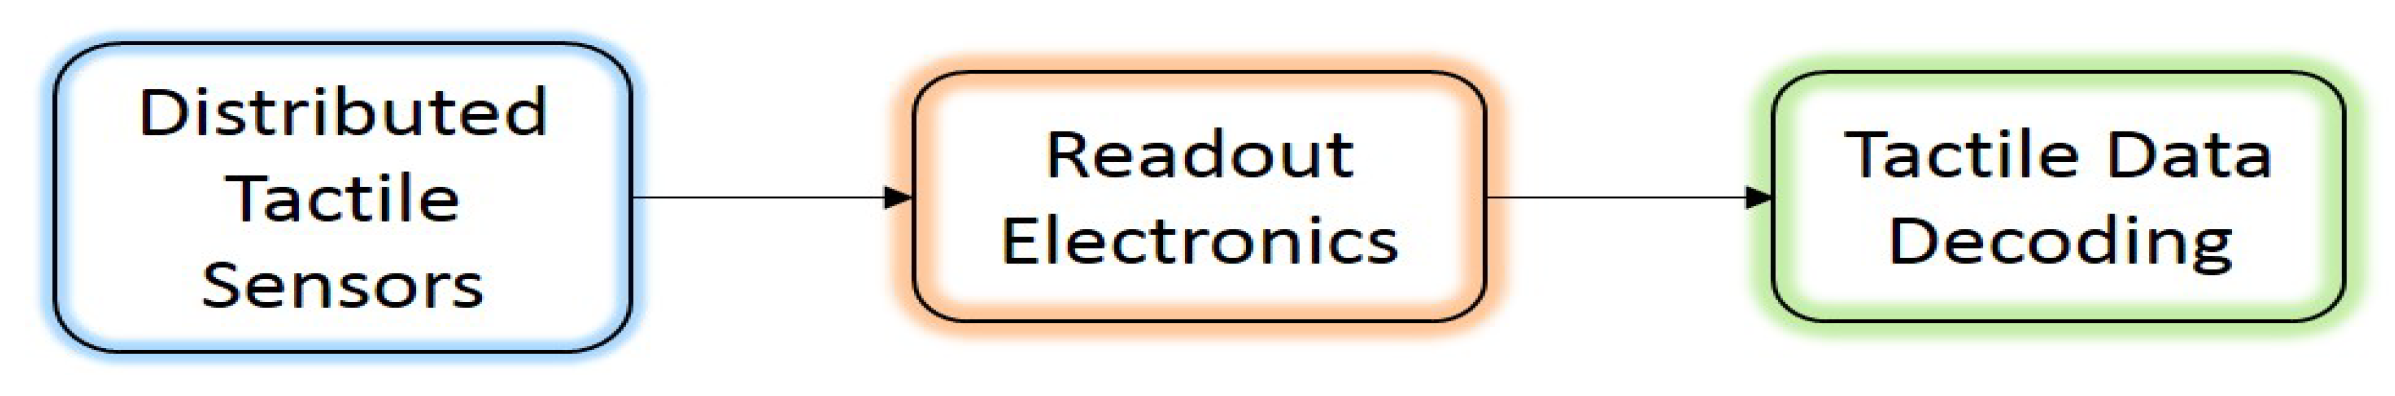
3. Experimental Setup and Methodology
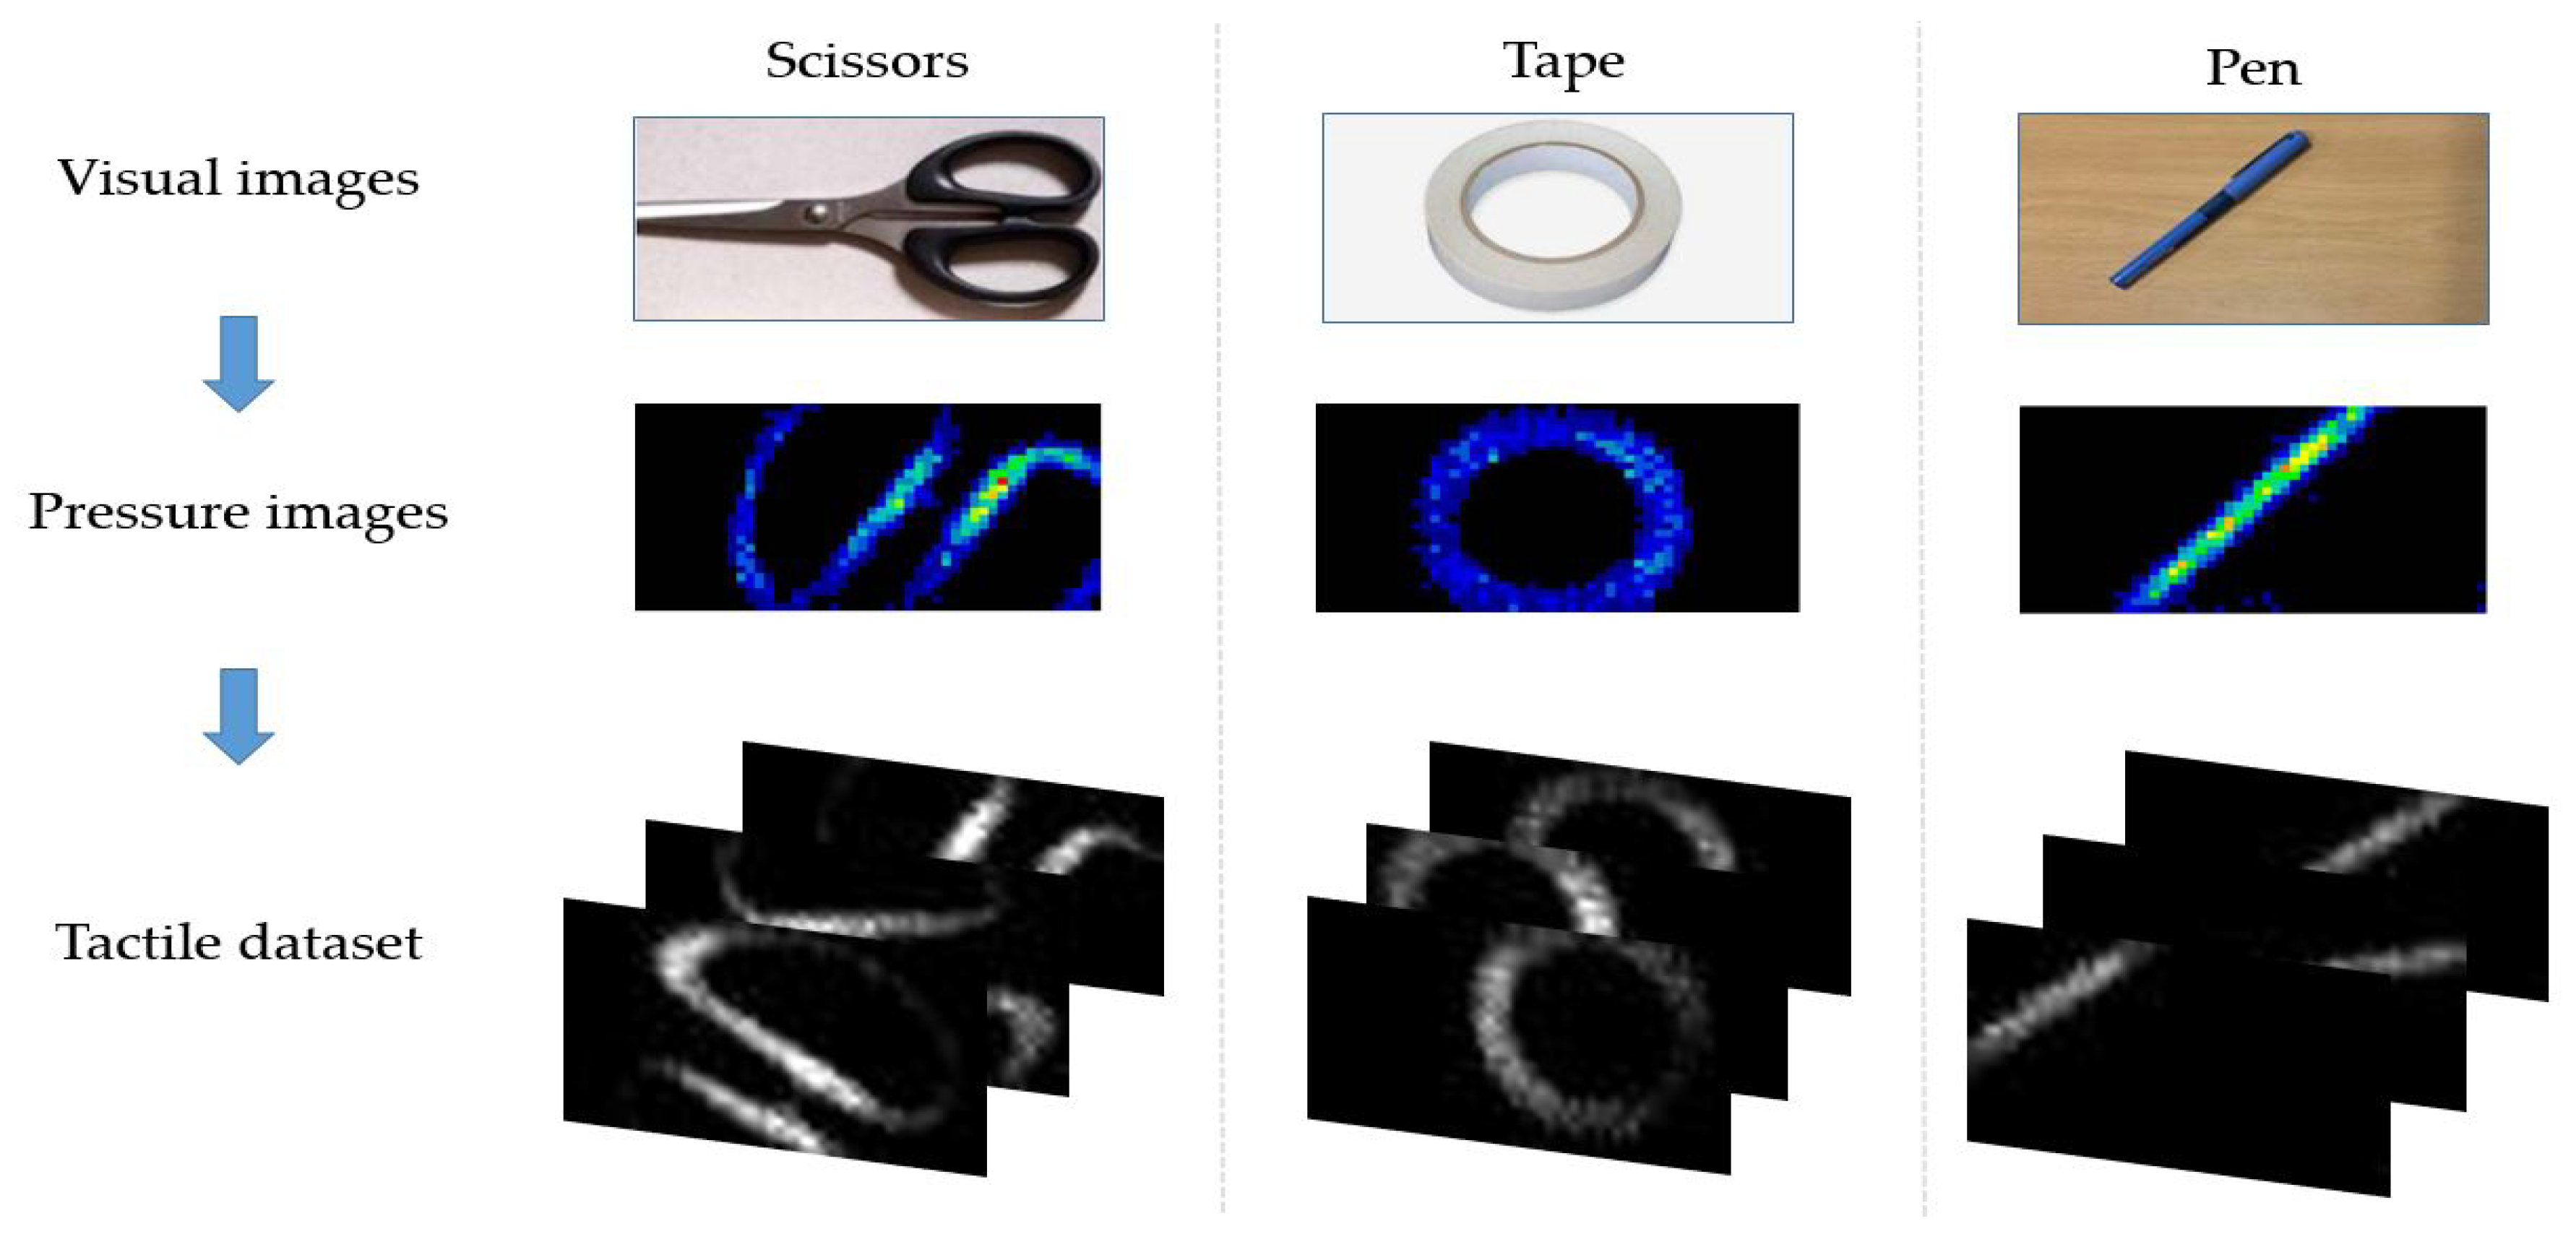
3.1. Dataset
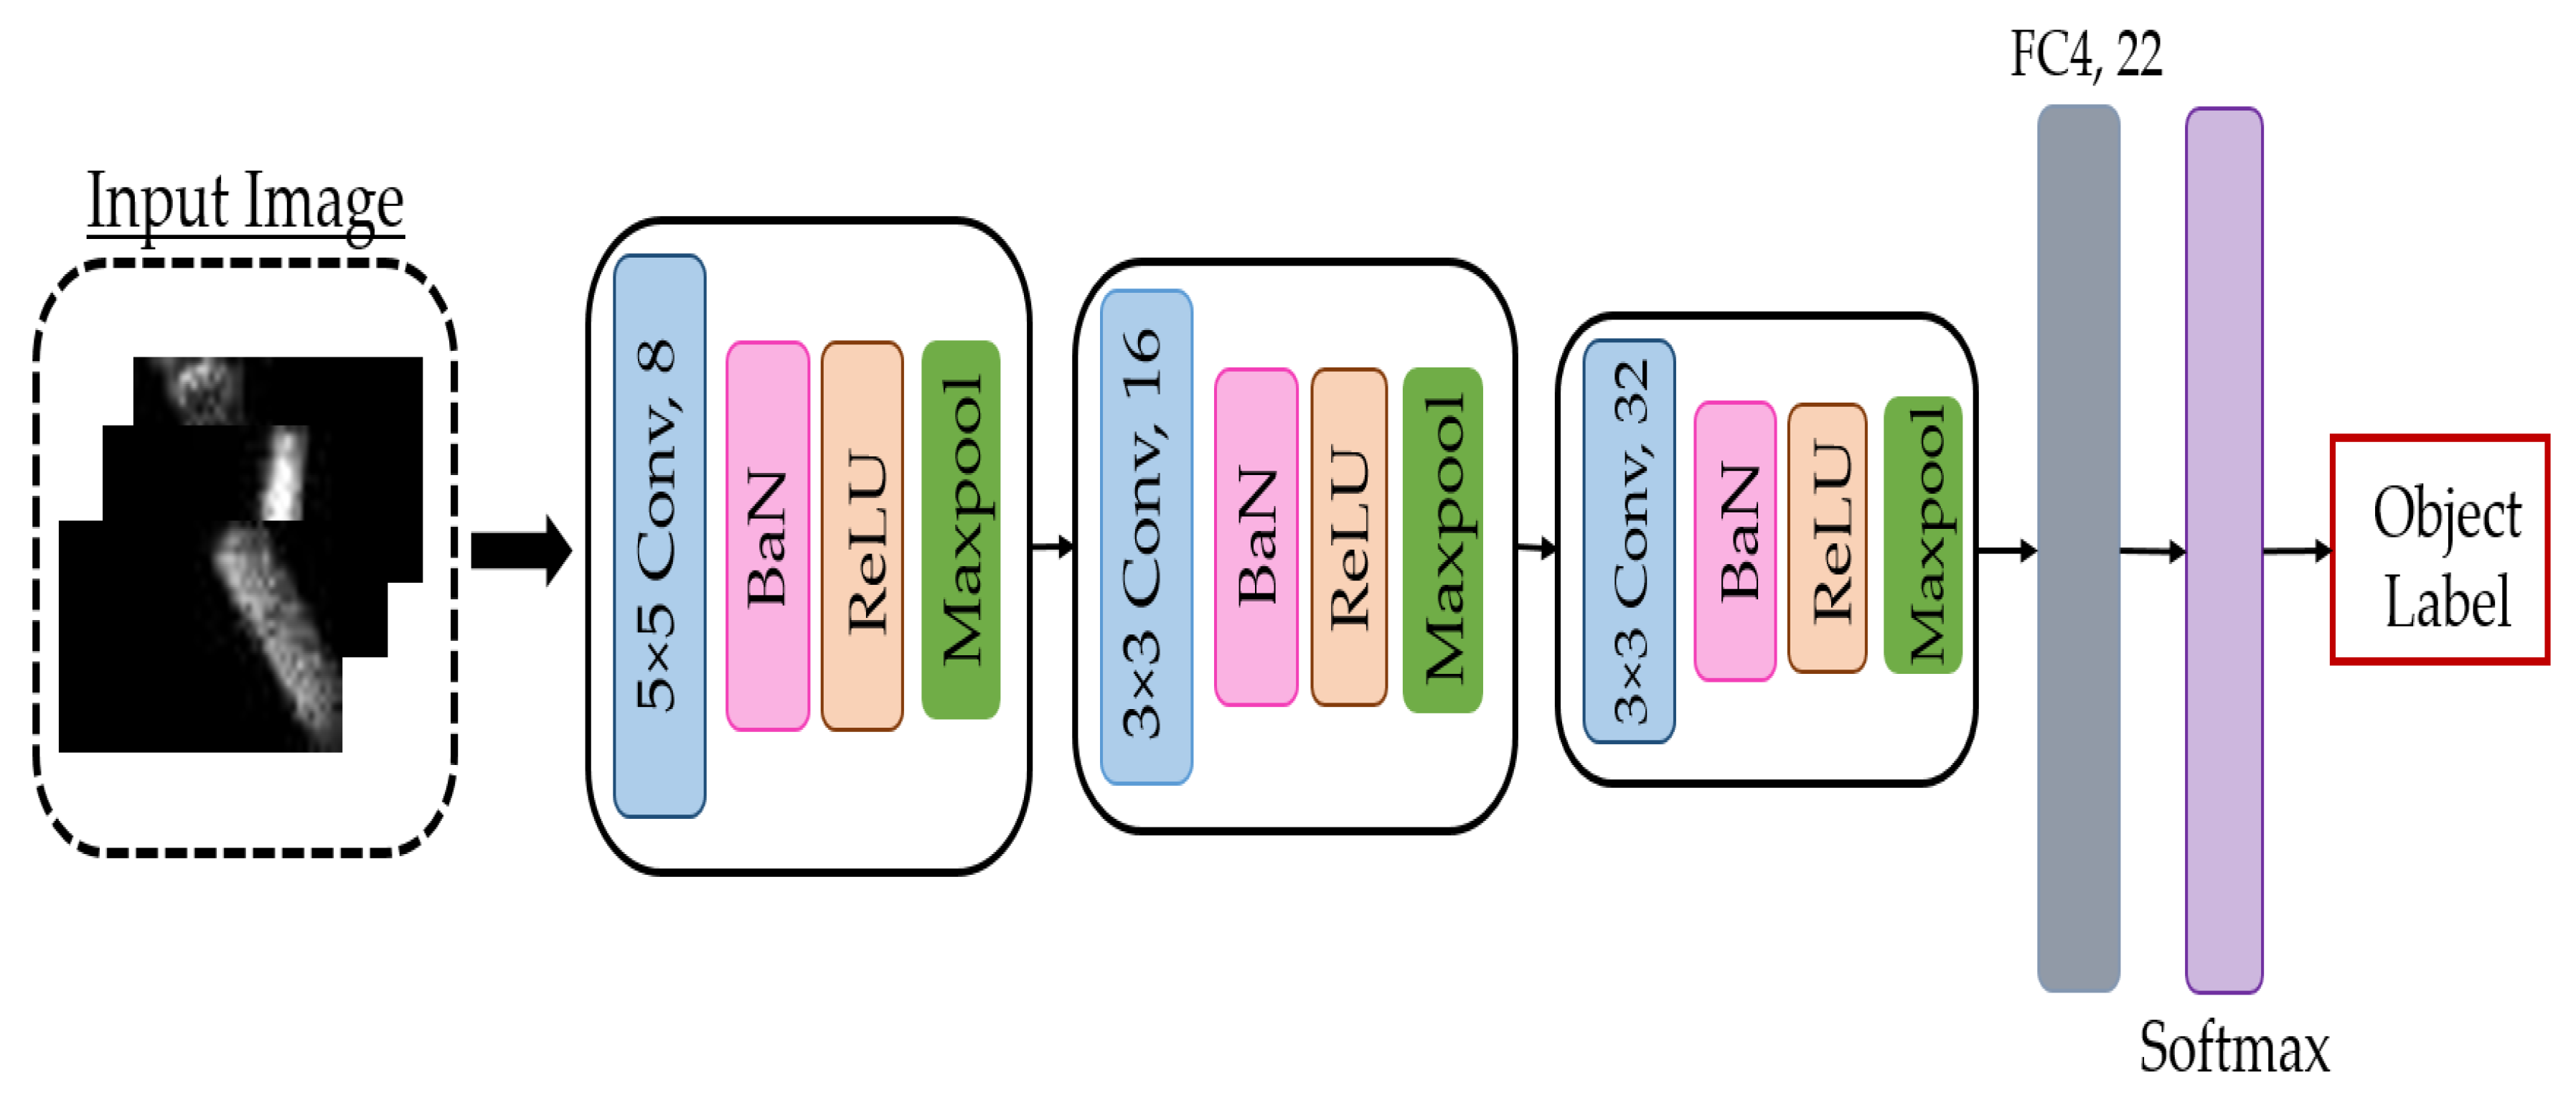
3.2. Tested Model
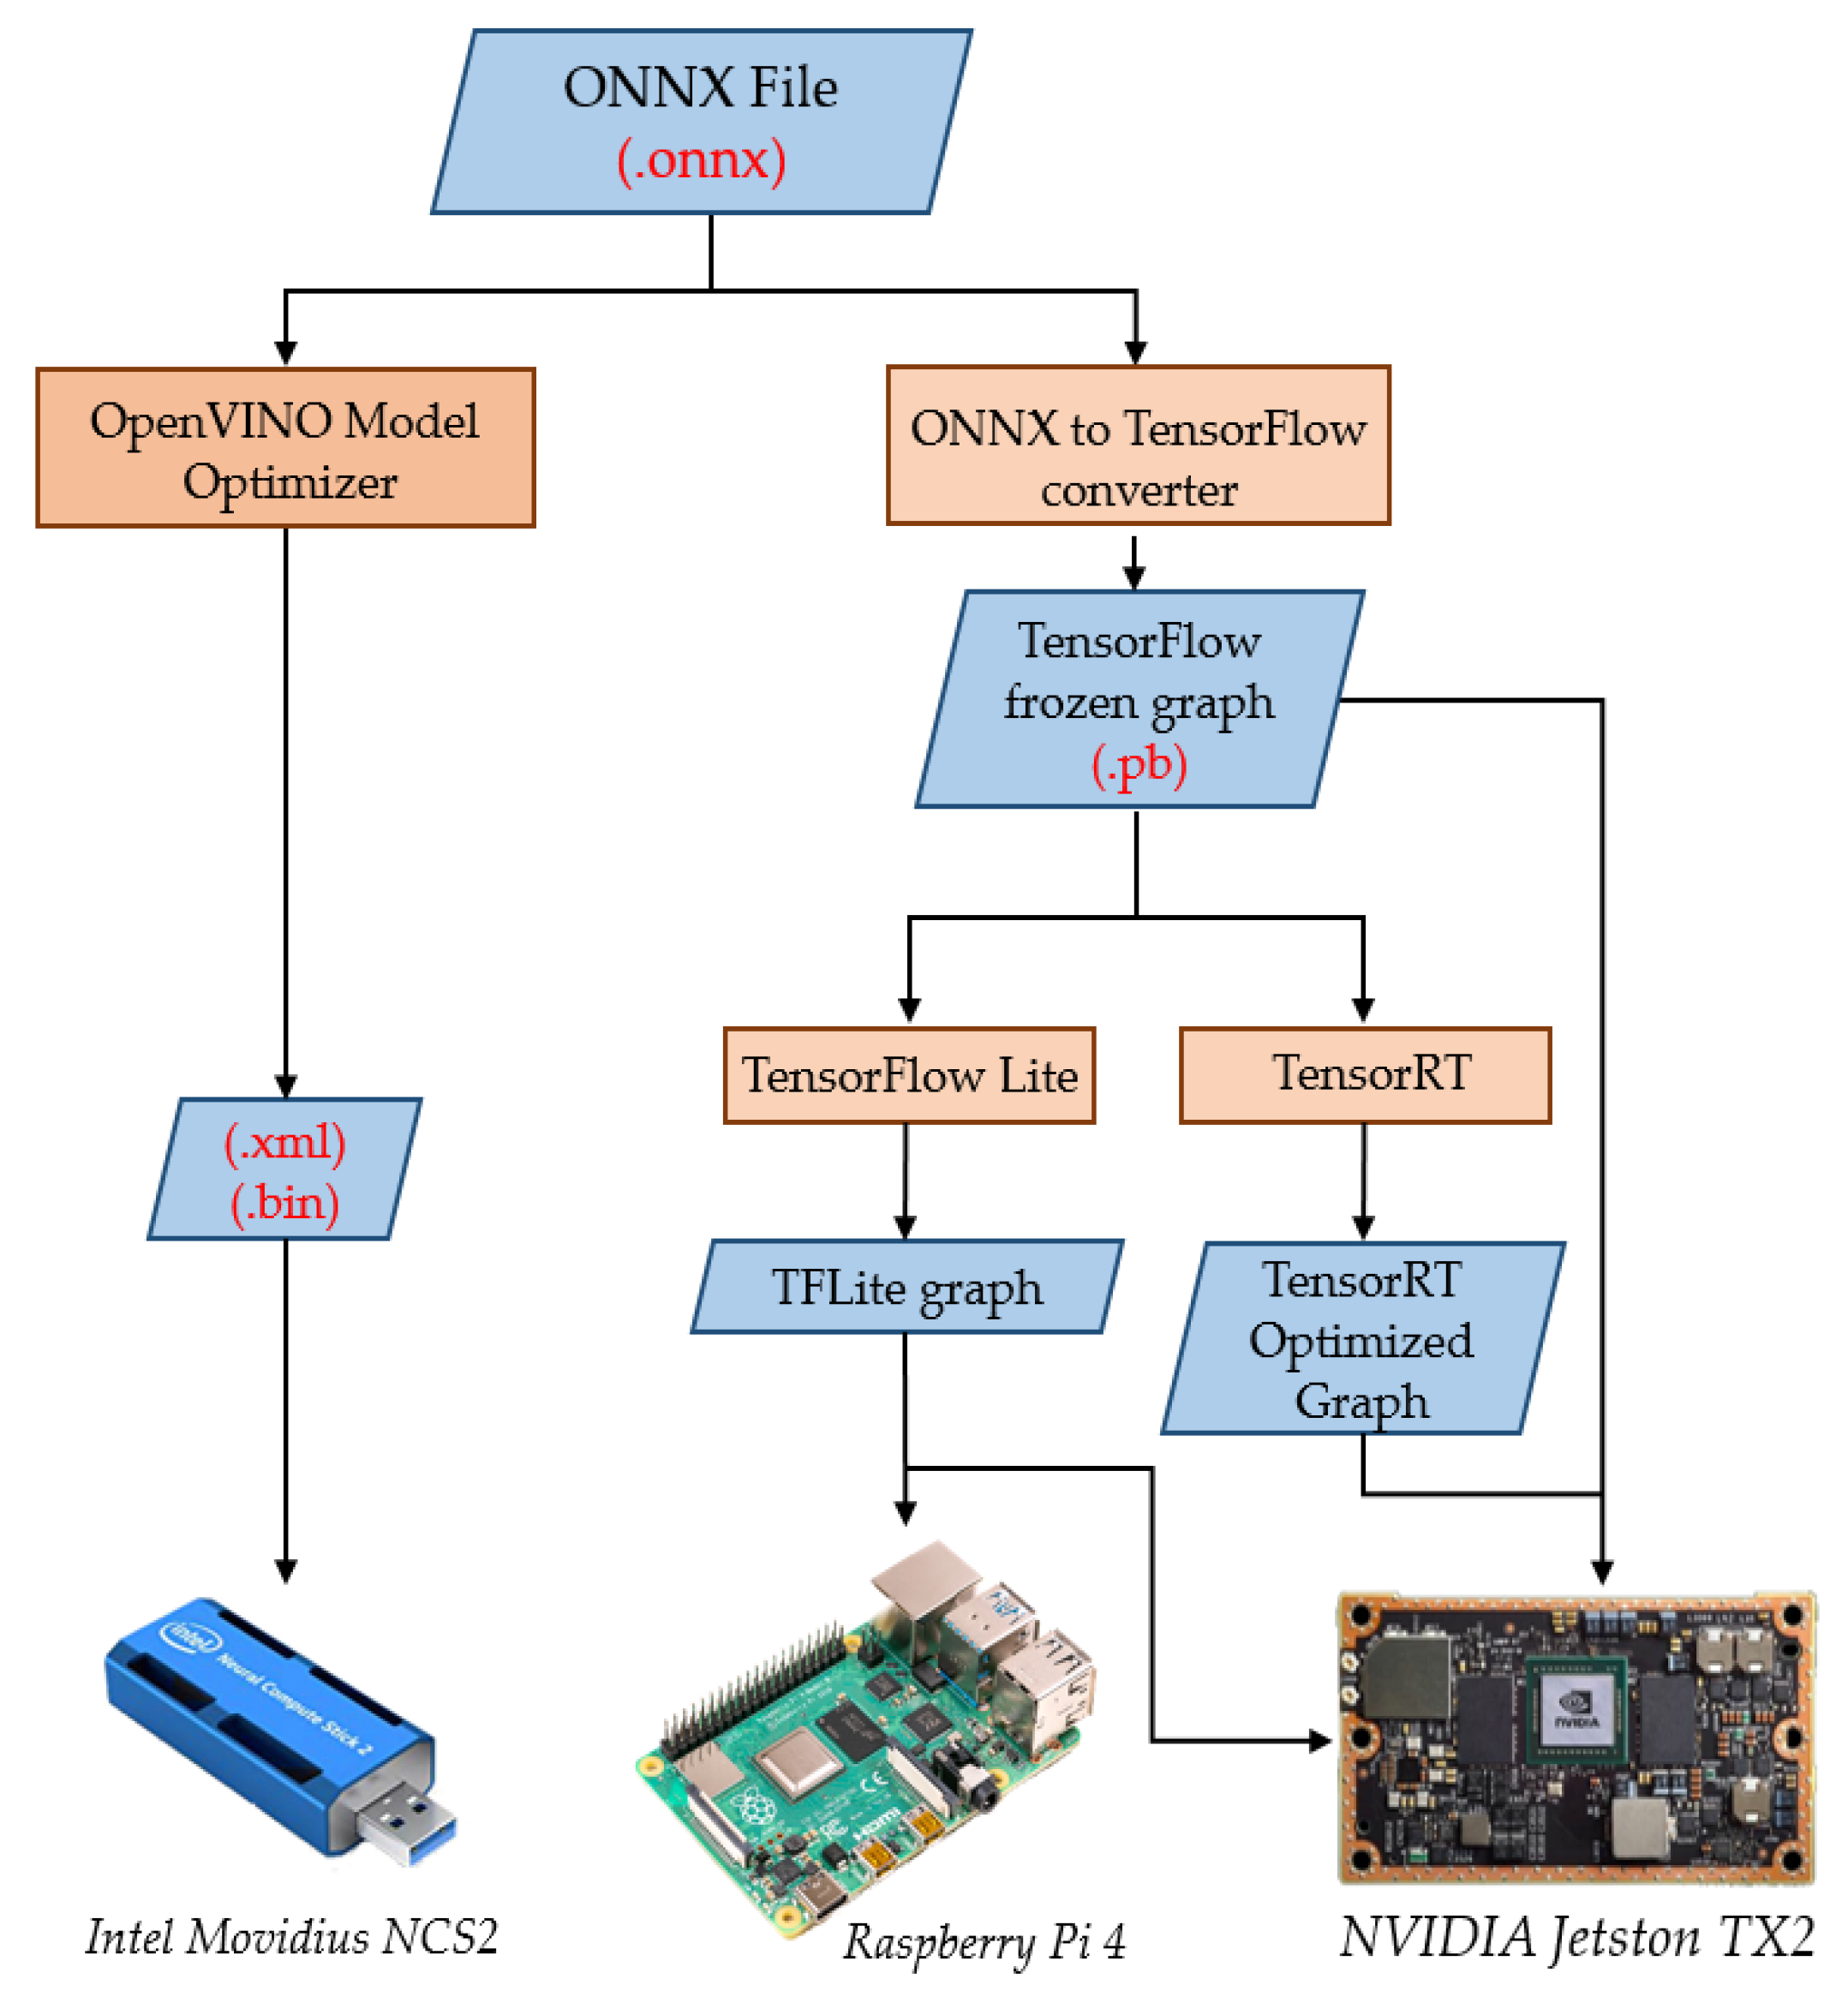
4. Embedded Hardware Implementations
- The custom architecture targeting the embedded implementation of neural networks, e.g., Movidius NCS2.
- The high usability of ARM processors in embedded architectures, e.g., Raspberry Pi 4.
- The high performance architecture, designed for parallel processing in general, and also optimized for embedded applications: e.g., NVidia Jetson TX2.
- The support for the execution of pretrained neural network models coming from different platforms without retraining.
4.1. Movidius Neural Compute Stick 2
4.2. Jetson TX2
4.3. ARM
- the provided APIs in Jetson TX2, which provided readings about voltage, power, and input current to the GPU.
- the external USB multimeter, connected in serial to the power source for both Raspberry Pi and the Movidius NCS2.
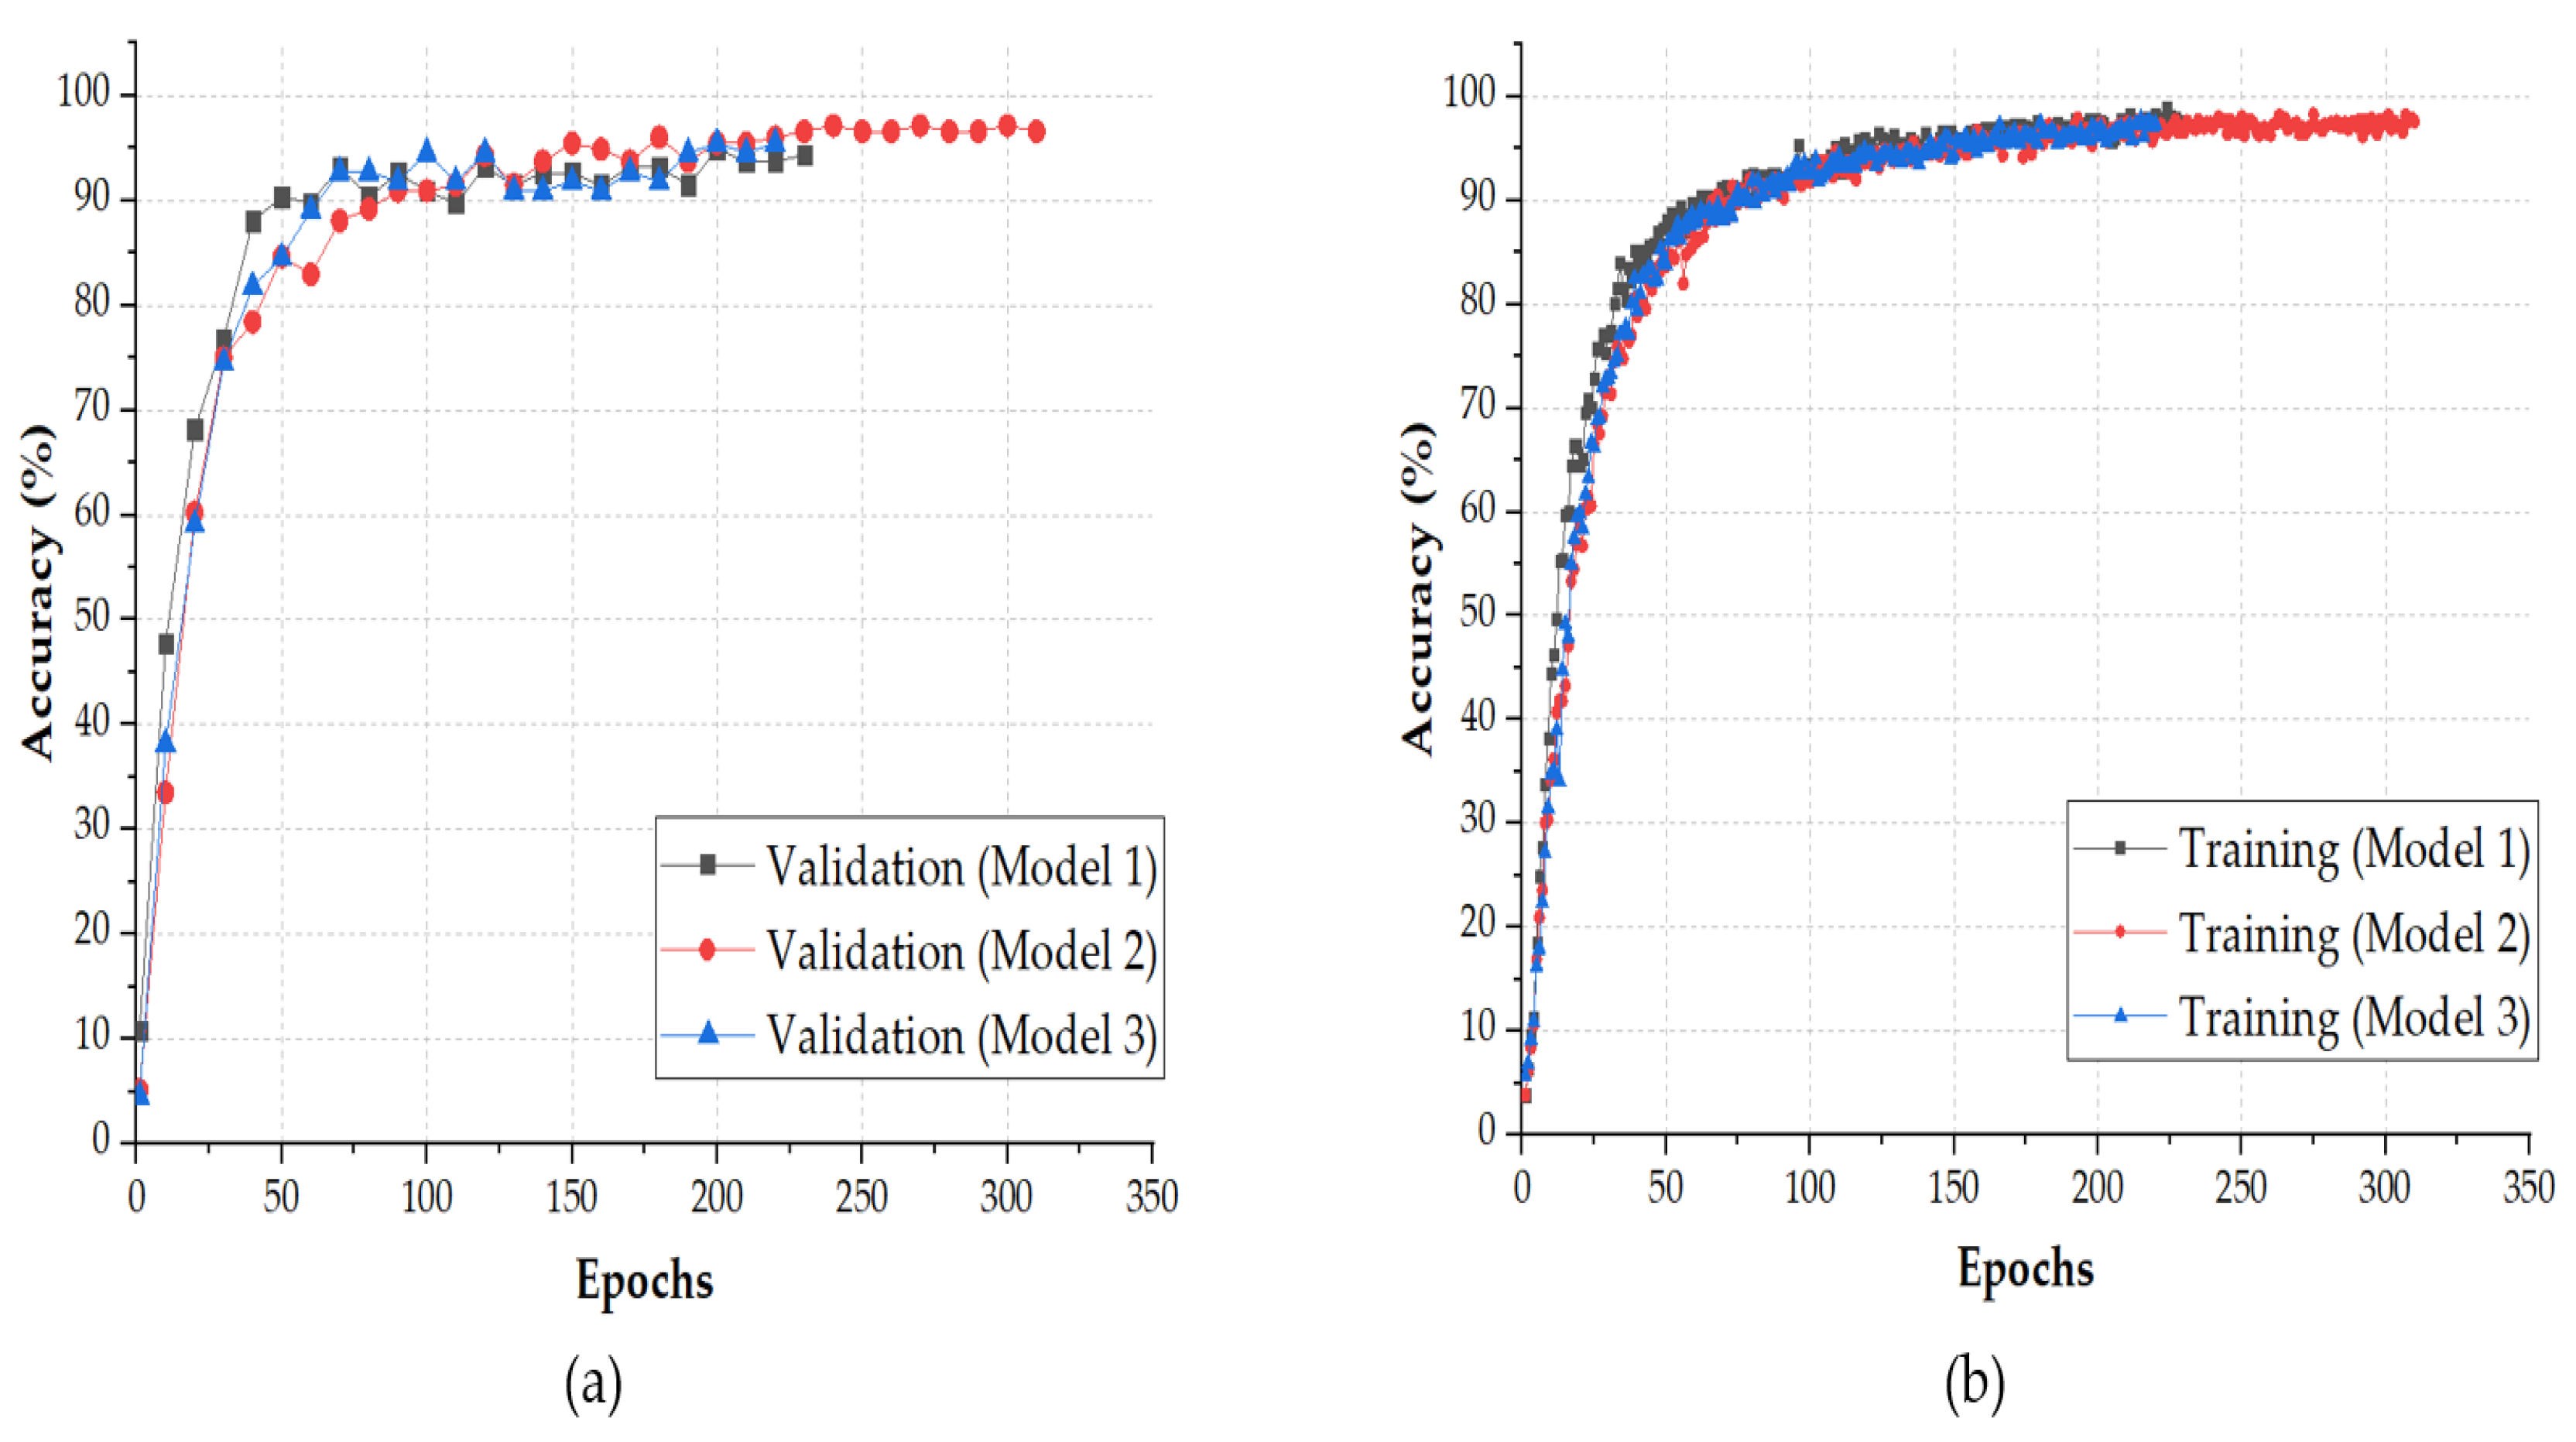
5. Results and Discussion
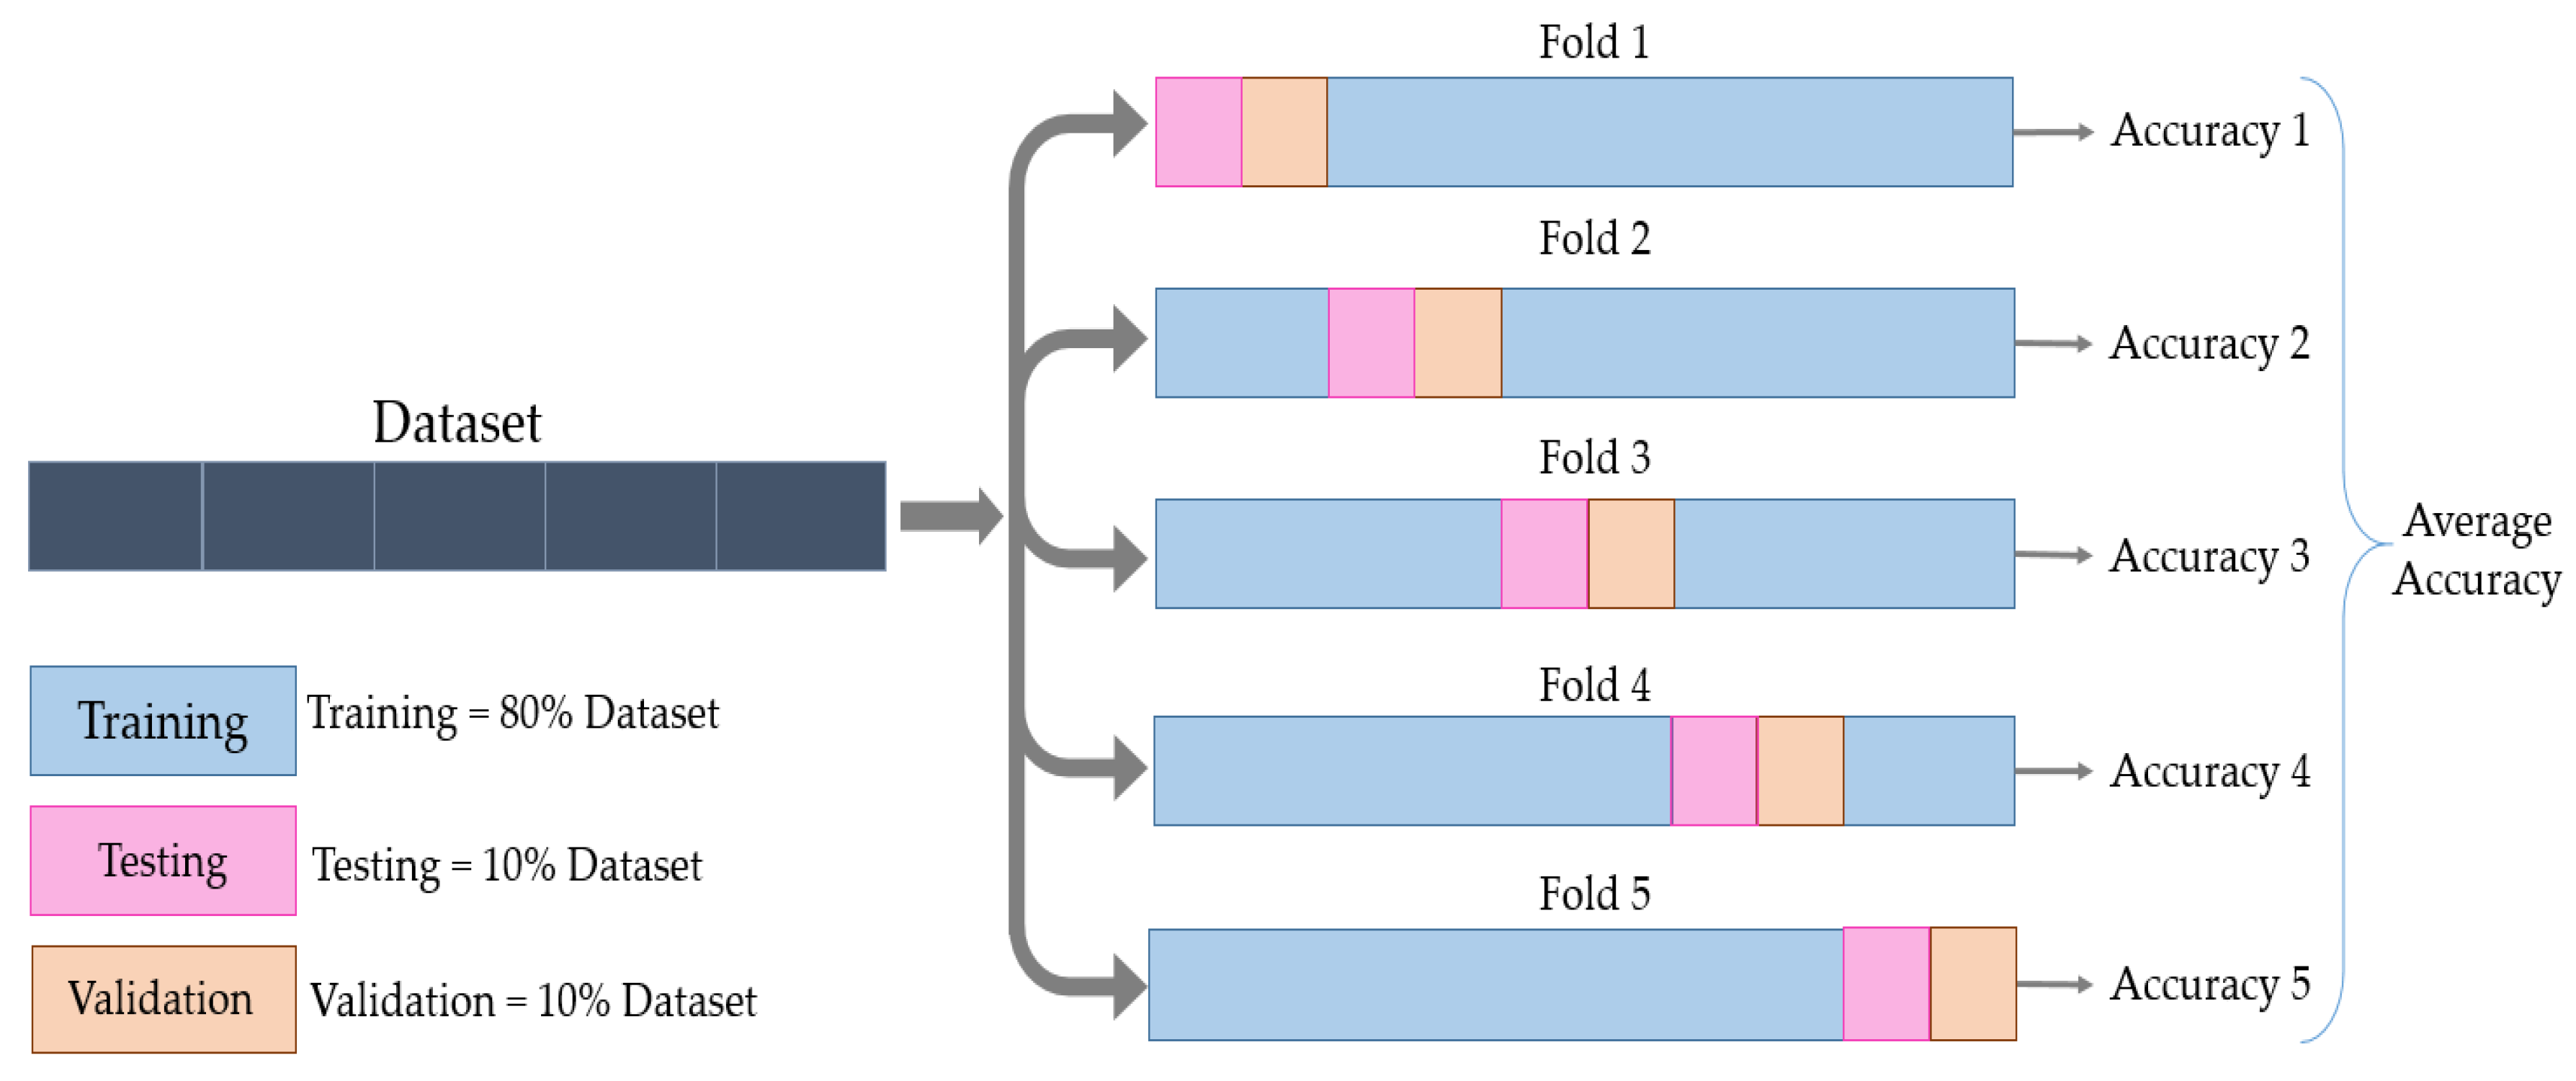
- The random initialization of the weights may lead in different runs to different accuracy results, e.g., 10 different runs for training Fold 4 of Model 2 with the same hyperparameters gave different results, as shown in Table 2, which shows an average of 94.36% and a standard deviation of 1.904%.
- Random selection of batch data and data shuffling would affect also the update of the weights and make them different from one training to another.
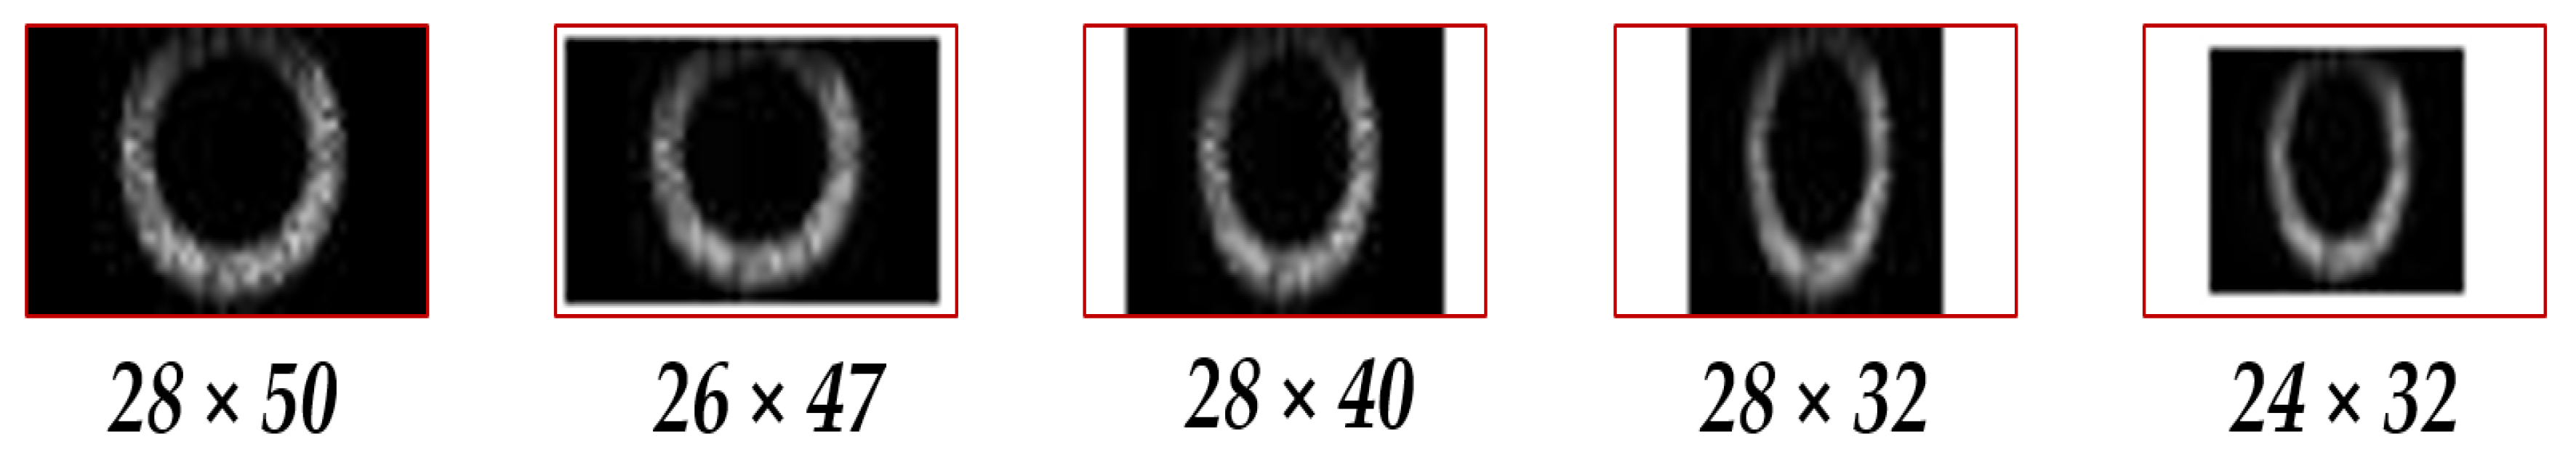
- The feature extraction process achieved by CNN was error resilient [32]. A CNN could still extract features even with some manipulation of the input image. This was one of the reasons for data augmentation [33] when training neural networks, which was to let the neural network learn the features even from augmented images (scaled, rotated, flipped, etc.), instead of learning only the samples in the original dataset. In our case, the features were still detectable even after image resizing, as shown in Figure 5.
6. Conclusions
Author Contributions
Funding
Acknowledgments
Conflicts of Interest
Abbreviations
| CNN | Convolutional Neural Network |
| DCNN | Deep Convolutional Neural Network |
| SVM | Support Vector Machine |
| ML | Machine Learning |
| FPGA | Field-Pogrammable Gate Array |
References
- Ibrahim, A.; Pinna, L.; Seminara, L.; Valle, M. Achievements and Open Issues Toward Embedding Tactile Sensing and Interpretation into Electronic Skin Systems. In Material-Integrated Intelligent Systems-Technology and Applications; John Wiley & Sons, Ltd.: WeinHeim, Germany, 1 December 2017; Chapter 23; pp. 571–594. [Google Scholar] [CrossRef]
- Saleh, M.; Abbass, Y.; Ibrahim, A.; Valle, M. Experimental assessment of the interface electronic system for PVDF-based piezoelectric tactile sensors. Sensors 2019, 19, 4437. [Google Scholar] [CrossRef] [PubMed]
- Alameh, M.; Ibrahim, A.; Valle, M.; Moser, G. DCNN for Tactile Sensory Data Classification based on Transfer Learning. In Proceedings of the 2019 15th Conference on Ph.D Research in Microelectronics and Electronics (PRIME), Lausanne, Switzerland, 15–18 July 2019; pp. 237–240. [Google Scholar] [CrossRef]
- Luo, S.; Bimbo, J.; Dahiya, R.; Liu, H. Robotic tactile perception of object properties: A review. Mechatronics 2017, 48, 54–67. [Google Scholar] [CrossRef]
- Gandarias, J.M.; Garcia-Cerezo, A.J.; Gomez-de Gabriel, J.M. CNN-Based Methods for Object Recognition With High-Resolution Tactile Sensors. IEEE Sens. J. 2019, 19, 6872–6882. [Google Scholar] [CrossRef]
- Cheng, G.; Dean-Leon, E.; Bergner, F.; Olvera, J.R.G.; Leboutet, Q.; Mittendorfer, P. A Comprehensive Realization of Robot Skin: Sensors, Sensing, Control, and Applications. Proc. IEEE 2019, 107, 2034–2051. [Google Scholar] [CrossRef]
- Martinez-Hernandez, U.; Dodd, T.J.; Prescott, T.J. Feeling the Shape: Active Exploration Behaviors for Object Recognition With a Robotic Hand. IEEE Trans. Syst. Man Cybern. Syst. 2018, 48, 2339–2348. [Google Scholar] [CrossRef]
- Zou, L.; Ge, C.; Wang, Z.; Cretu, E.; Li, X. Novel tactile sensor technology and smart tactile sensing systems: A review. Sensors 2017, 17, 2653. [Google Scholar] [CrossRef] [PubMed]
- Li, R.; Adelson, E.H. Sensing and Recognizing Surface Textures Using a GelSight Sensor. In Proceedings of the 2013 IEEE Conference on Computer Vision and Pattern Recognition, Portland, OR, USA, 23–28 June 2013; IEEE: Portland, OR, USA, 2013; pp. 1241–1247. [Google Scholar] [CrossRef]
- Schmitz, A.; Bansho, Y.; Noda, K.; Iwata, H.; Ogata, T.; Sugano, S. Tactile object recognition using deep learning and dropout. In Proceedings of the 2014 IEEE-RAS International Conference on Humanoid Robots, Madrid, Spain, 18–20 November 2014; pp. 1044–1050. [Google Scholar] [CrossRef]
- Gandarias, J.M.; Gomez-de Gabriel, J.M.; Garcia-Cerezo, A. Human and object recognition with a high-resolution tactile sensor. In Proceedings of the 2017 IEEE SENSORS, Glasgow, UK, 29 October–1 November 2017; IEEE: Glasgow, UK, 2017; pp. 1–3. [Google Scholar] [CrossRef]
- Yuan, W.; Mo, Y.; Wang, S.; Adelson, E. Active Clothing Material Perception using Tactile Sensing and Deep Learning. arXiv 2017, arXiv:1711.00574. [Google Scholar]
- ImageNet. Available online: http://www.image-net.org (accessed on 20 November 2019).
- Rouhafzay, G.; Cretu, A.M. An Application of Deep Learning to Tactile Data for Object Recognition under Visual Guidance. Sensors 2019, 19, 1534. [Google Scholar] [CrossRef] [PubMed]
- Abderrahmane, Z.; Ganesh, G.; Crosnier, A.; Cherubini, A. Visuo-Tactile Recognition of Daily-Life Objects Never Seen or Touched Before. In Proceedings of the 2018 IEEE 15th International Conference on Control, Automation, Robotics and Vision (ICARCV), Singapore, 18–21 November 2018; pp. 1765–1770. [Google Scholar]
- Abderrahmane, Z.; Ganesh, G.; Crosnier, A.; Cherubini, A. Haptic Zero-Shot Learning: Recognition of objects never touched before. Robot. Auton. Syst. 2018, 105, 11–25. [Google Scholar] [CrossRef]
- Li, J.; Dong, S.; Adelson, E. Slip detection with combined tactile and visual information. In Proceedings of the 2018 IEEE International Conference on Robotics and Automation (ICRA), Brisbane, QLD, Australia, 21–25 May 2018; pp. 7772–7777. [Google Scholar]
- Wu, H.; Jiang, D.; Gao, H. Tactile motion recognition with convolutional neural networks. In Proceedings of the 2017 IEEE/RSJ International Conference on Intelligent Robots and Systems (IROS), Vancouver, BC, Canada, 24–28 September 2017; pp. 1572–1577. [Google Scholar]
- Kwiatkowski, J.; Cockburn, D.; Duchaine, V. Grasp stability assessment through the fusion of proprioception and tactile signals using convolutional neural networks. In Proceedings of the 2017 IEEE/RSJ International Conference on Intelligent Robots and Systems (IROS), Vancouver, BC, Canada, 24–28 September 2017; IEEE: Vancouver, BC, Canada, 2017; pp. 286–292. [Google Scholar] [CrossRef]
- Fares, H.; Seminara, L.; Ibrahim, A.; Franceschi, M.; Pinna, L.; Valle, M.; Dosen, S.; Farina, D. Distributed Sensing and Stimulation Systems for Sense of Touch Restoration in Prosthetics. In Proceedings of the 2017 New Generation of CAS (NGCAS), Genova, Italy, 6–9 September 2017; pp. 177–180. [Google Scholar] [CrossRef]
- Osta, M.; Ibrahim, A.; Magno, M.; Eggimann, M.; Pullini, A.; Gastaldo, P.; Valle, M. An Energy Efficient System for Touch Modality Classification in Electronic Skin Applications. In Proceedings of the 2019 IEEE International Symposium on Circuits and Systems (ISCAS), Sapporo, Japan, 26–29 May 2019; pp. 1–4. [Google Scholar]
- Ibrahim, A.; Gastaldo, P.; Chible, H.; Valle, M. Real-time digital signal processing based on FPGAs for electronic skin implementation. Sensors 2017, 17, 558. [Google Scholar] [CrossRef] [PubMed]
- Jansen, K.; Zhang, H. Scheduling malleable tasks. In Handbook of Approximation Algorithms and Metaheuristics; Chapman and Hall/CRC: New York, NY, USA, 15 May 2007; pp. 45-1–45-16. [Google Scholar] [CrossRef]
- Lu, Z.; Rallapalli, S.; Chan, K.; La Porta, T. Modeling the resource requirements of convolutional neural networks on mobile devices. In Proceedings of the MM 2017—Proceedings of the 2017 ACM Multimedia Conference, Mountain View, CA, USA, 23–27 October 2017; pp. 1663–1671. [Google Scholar] [CrossRef]
- Open Neural Network Exchange. Available online: https://github.com/onnx/onnx/ (accessed on 20 November 2019).
- Intel Movidius NCS2. Available online: https://software.intel.com/en-us/neural-compute-stick (accessed on 20 November 2019).
- OpenVino Model Optimization Techniques. Available online: https://docs.openvinotoolkit.org/latest/_docs_MO_DG_prepare_model_Model_Optimization_Techniques.html (accessed on 20 November 2019).
- NVIDIA Jetson Modules and Developer Kits for Embedde Systems Development. Available online: https://www.nvidia.com/en-us/autonomous-machines/embedded-systems (accessed on 20 November 2019).
- TensorFlow. Available online: https://www.tensorflow.org (accessed on 20 November 2019).
- NVIDIA TensorRT. Available online: https://developer.nvidia.com/tensorrt (accessed on 20 November 2019).
- TensorFlow Lite. Available online: https://www.tensorflow.org/lite (accessed on 20 November 2019).
- Hanif, M.A.; Hafiz, R.; Shafique, M. Error resilience analysis for systematically employing approximate computing in convolutional neural networks. In Proceedings of the 2018 Design, Automation Test in Europe Conference Exhibition (DATE), Dresden, Germany, 19–23 March 2018; pp. 913–916. [Google Scholar] [CrossRef]
- Perez, L.; Wang, J. The Effectiveness of Data Augmentation in Image Classification using Deep Learning. arXiv 2017, arXiv:1712.04621. [Google Scholar]


| Layers | Model 1 | Model 2 | Model 3 | Model 4 | Model 5 |
|---|---|---|---|---|---|
| (28 × 50) | (26 × 47) | (28 × 40) | (28 × 32) | (24 × 32) | |
| Conv1 | 208 | 208 | 208 | 208 | 208 |
| BaN1 | 16 | 16 | 16 | 16 | 16 |
| Conv2 | 1168 | 1168 | 1168 | 1168 | 1168 |
| BaN2 | 32 | 32 | 32 | 32 | 32 |
| Conv3 | 4640 | 4640 | 4640 | 4640 | 4640 |
| BaN3 | 64 | 64 | 64 | 64 | 64 |
| FC | 19,734 | 16,918 | 14,102 | 11,286 | 8470 |
| Total | 25,862 | 23,046 | 20,230 | 17,414 | 14,598 |
| Trials | Accuracy (%) |
|---|---|
| 1 | 96.36 |
| 2 | 92.73 |
| 3 | 94.55 |
| 4 | 91.82 |
| 5 | 97.27 |
| 6 | 93.64 |
| 7 | 92.73 |
| 8 | 95.45 |
| 9 | 96.36 |
| 10 | 92.73 |
| Average ± Stdev | 94.36 ± 1.904% |
| Platform | Inference Time (ms) | |||
|---|---|---|---|---|
| Hardware | Software | Model 1 | Model 2 | Model 3 |
| Jetson TX2 | TensorRT | 5.5597 | 5.2905 | 5.919 |
| TF | 6.2943 | 5.4691 | 5.946 | |
| TFLite | 1.3384 | 1.2181 | 1.2445 | |
| Core i7 | MATLAB | 3.245 | 2.6139 | 2.4715 |
| Movidius NCS2 | OpenVINO | 1.9 | 1.9 | 1.86 |
| Raspberry Pi4 | TFLite | 1.615 | 1.473 | 1.21 |
| Platform | Current (mA) | Voltage (V) | Consumed Power (mW) | ||||
|---|---|---|---|---|---|---|---|
| Hardware | Software | Static | Total | Static | Total | Dynamic | |
| Jetson | TensorRT | 8 | 16 | 19.072 | 152 | 305 | 153 |
| TF | 8 | 16 | 19.072 | 152 | 305 | 153 | |
| Movidius NCS2 | OpenVINO | - | 160 | 5 | - | 800 | 800 |
| Raspberry Pi4 | TFLite | 560 | 700 | 5 | 2800 | 3500 | 700 |
| Platform | Energy Consumption (J) | |||
|---|---|---|---|---|
| Hardware | Software | Model 1 | Model 2 | Model 3 |
| Jetson TX2 | TensorRT | 850.6341 | 809.4465 | 905.607 |
| TF | 963.0279 | 836.7723 | 909.738 | |
| Movidius NCS2 | Open VINO | 1520 | 1520 | 1488 |
| Raspberry Pi4 | TFLite | 1130.5 | 1031.1 | 847 |
© 2020 by the authors. Licensee MDPI, Basel, Switzerland. This article is an open access article distributed under the terms and conditions of the Creative Commons Attribution (CC BY) license (http://creativecommons.org/licenses/by/4.0/).
Share and Cite
Alameh, M.; Abbass, Y.; Ibrahim, A.; Valle, M. Smart Tactile Sensing Systems Based on Embedded CNN Implementations. Micromachines 2020, 11, 103. https://doi.org/10.3390/mi11010103
Alameh M, Abbass Y, Ibrahim A, Valle M. Smart Tactile Sensing Systems Based on Embedded CNN Implementations. Micromachines. 2020; 11(1):103. https://doi.org/10.3390/mi11010103
Chicago/Turabian StyleAlameh, Mohamad, Yahya Abbass, Ali Ibrahim, and Maurizio Valle. 2020. "Smart Tactile Sensing Systems Based on Embedded CNN Implementations" Micromachines 11, no. 1: 103. https://doi.org/10.3390/mi11010103
APA StyleAlameh, M., Abbass, Y., Ibrahim, A., & Valle, M. (2020). Smart Tactile Sensing Systems Based on Embedded CNN Implementations. Micromachines, 11(1), 103. https://doi.org/10.3390/mi11010103