1. Introduction
According to Planck’s law, the thermal radiation of an ideal black body depends only on its temperature. However, in general, the thermal emissions from realistic objects differ substantially depending on their dielectric response and surface morphologies. Theoretical study and engineering designs of thermal emission devices are not only important in thermal emitters and infrared sensors but also useful for MEMS-based systems and micromachines. Therefore, some researchers are aiming to artificially tailor the emission spectrum by selecting the constituent materials and rationally designing their surface nanostructures to utilize thermal energy and heat management in a more efficient manner. For example, Dao et al. [
1] demonstrated mid-infrared metamaterial perfect absorbers by using Al-Al
2O
3-Al tri-layers structure, which an exhibited excellent absorptivity of 98% and a flexible wavelength selective response in the infrared region tuned by the disk diameter. They also demonstrated that the sharpness of the emission peak of the device, which only uses inexpensive industrial material, was comparable to that of absorbers composed of gold or silver. Yang et al. [
2] applied four elemental metals (Al, Au, Mo, W) to realize a Tamm plasmon polariton to achieve a narrow band thermal emission, which may efficiently confine the energy and result in a sharp peak in absorption spectrum in the infrared region. Yokoyama et al. [
3] achieved high emission intensity by developing a thermal emitter operative at very high temperature of 1000 °C using refractive molybdenum and aluminum oxide in a metal–insulator–metal structure. Both reported the wavelength selective characteristics by adequately selecting the material and structural parameter, to achieve higher device performance in the infrared region. Regarding the operation temperature, it is an important factor which may cause the degradation of material and damage to the devices. Therefore, exploring new refractory materials is expected to bring about greater potential to work in high-temperature environments. TiN thin film has suitable plasmonic properties similar to Au as well as a substantially high thermal stability up to about 500 °C [
4]. Kaur et al. [
5] combined TiN nanoparticles and transparent ceramic microfiber wools to efficiently desalinate water by the broadband photothermal heat generation by absorbing ultraviolet to near-infrared light. Sugavaneshwar et al. [
6] demonstrated high-quality TiN film on a flexible polymer film at room temperature, and illustrated the better and swifter conversion from light to heat energy in the infrared region.
On the other hand, due to the strong transmission and low hazard of infrared light to the living body, it is used for non-destructive sensing applications. For example, surface-enhanced Raman spectroscopy (SERS) is a technique widely used detection and sensing microdevices. With localized surface plasmons, Bansal et al. [
7] simulated the effects of scattering efficiencies on the different shapes of Ag-Cu alloy, such as sphere, cube, and nanobar with an effective radius 50 nm. Dodson et al. [
8] adjusted the gap between bowties to be 10 nm to pursue an extremely high enhancement factor. The effects of amplifying the electric field can be utilized in a sparse solution. The object in sparse solution can be concentrated with magnetic nanoparticles by applying the magnetic field, which reinforces the sensing efficiency. Brullot et al. [
9] simulated and discussed the relations between the structure, size, and optical properties of magnetite-core gold-shell nanoparticles. They developed the comprehensive mechanism for designing the core-shell nanoparticles in the near-infrared light region. Kwizera et al. [
10] successfully synthesized different shapes (sphere, popcorn, and star) and sizes of iron-oxide-core and gold-shell nanoparticles. The optical and magnetic properties of nanoparticles that may be exploited in different applications have been demonstrated. Liu et al. [
11] synthesized urchin-like Ag-coated Ni nanoparticles. The rhodamine-6G sparse solution can be easily detected due to the large amount of hot spots. It has also been shown that such nanoparticles are quickly and simply manipulated by a magnetic field due to their nickel cores. Zhang et al. [
12] applied nanoparticles in realistic applications and showed the differentiation of three different bacteria using Fe
3O
4-Au core-shell nanoparticles, and the signal was about 60 times higher than that obtained without a magnetic field.
Most bio-molecules vibrate in the infrared light, hence, infrared light is widely used in bio-sensing applications. Also, plasmonic nanoparticles surrounded by a catalyst are believed to improve the activities for the chemical transformations, e.g., by decreasing the chemical potential and increasing the number of free electrons. Both procedures increase the efficiency of decomposition reactions. Song et al. [
13] provided an exhaustive investigation of the mechanism by which the photocatalytic reduction of carbon dioxide is achieved. The results revealed that the CO
2 decomposition efficiency of Au-Pt-SiO
2 nanoparticles was about twice as high compared to Pt-SiO
2 nanoparticles under the light intensity of 0.6 (W/cm
2); the efficiency of Au-Pt-SiO
2 nanoparticles was found to be better than that of Au-SiO
2 and Pt-SiO
2 nanoparticles. Bora et al. [
14] discussed the surface temperature of Au-ZnO nanorods under resonant excitation up to about 300 °C, which gave an apparent quantum yield (for the degradation of methylene blue) about 6 times higher than that achieved by bare ZnO nanorods. Mukherjee et al. [
15] showed that the H
2 dissociation can be achieved at room temperature due to the surface plasmon-induced hot electrons at the Au nanoparticle surface, as H
2 has an extremely high dissociation energy (4.51 eV).
The operation frequency is one of the most important factors influencing device efficiency. Some researchers have tuned the structure parameters of nanoparticles, as discussed above, to achieve the desired result. Instead of changing the morphology of the microstructures or nanostructures, one could focus on the optical properties of the selected materials, which are key parameters that strongly affect the plasmonic responses of materials. Different classes of materials have been explored, and they were found to depend on the operating wavelength of the applications. Some materials give a relatively low imaginary part of the permittivity as compared to metallic layers, such as graphene [
16] or indium tin oxide [
17,
18]. Although graphene has been employed as a plasmonic material and has a negative real part of the permittivity under suitable operating conditions in the infrared light region, its magnitude of the real part of the permittivity is not so large and it gives a lower electric field enhancement on the surface of materials. To mitigate the loss of metallic materials (low imaginary part of permittivity) and maintain a relatively strong electric field enhancement (high magnitude of real part of permittivity), we propose a method of adding other components to obtain a hybrid alloy. The operating wavelength of a material can be adjusted with different atomic ratios for different applications. Silva et al. [
19] gave the experimental and analytic data of AuCu alloy, which illustrated that the AuCu alloy possesses superior plasmonic properties from 500 nm to 690 nm. Keast et al. [
20] simulated a series of Au-based intermetallic materials (Al, Cd, Mg, Pd, Pt, Sn, Zn, Zr) and discussed the localized surface plasmon properties of the materials. Gong et al. [
21] synthesized alloys combining two out of Au, Ag, and Cu, which give a tunable wavelength characteristic in the visible light region. The authors also mentioned that the permittivity of the alloys cannot be approximated by a simple linear combination of the dielectric function from the different metals making up the composition of the material. However, most of the strong plasmonic effects of noble metals occur in the visible region, which is dominated by interband transition. Blaber et al. [
22] also stated that the partially occupied d bands of the alloy may affect the efficiency of its plasmonic effects, but the dopants may disrupt the low energy transition, which would in turn increase the plasmonic quality. Hence, the alloy may suitable for applications operating in the infrared region.
In this work, we explore the materials that will be potentially operated in the infrared region, and discuss Au-based and Pt-based noble metal alloys mixed with other six metals (Ir, Mo, Ni, Pb, Ta, W). Au and Pt are widely used in the fields of plasmonics and catalysis. The permittivity of the noble metals supports a very good quality surface plasmon in the visible to infrared regions, and they are stable in normal environments. However, Au has a relatively low melting point (1377 K), while Pt has a slightly higher melting point (2041 K) but a rather high loss compared to Au. It is predicted that the melting point will increase when the alloy is combined with refractory metals such as Ir, Mo, Ta, and W, whose melting points are 2739, 2896, 3290, and 3698 K, respectively. It is shown that the tensile strength of the alloys increases with the inclusion of Ir in PtIr [
23]. Moreover, Ni-based alloys may also exhibit magnetic properties due to their ferromagnetic characteristic, and thus they will be useful in nano-bio applications. It is also predicted that the thermal stability of alloys will increase with the introduction of Ni. In addition to the transition metal, the poor metal is also discussed. Compared to the transition metals, the poor metals have a higher electronegativity, a lower melting point, and may be used in organic and biomolecule applications. Pb is one of the poor metals that is reported to show plasmonic properties in nanoparticles in the ultraviolent region [
24]. In this work, we focus on the infrared optical properties of these unexplored alloys and discuss their potential to be used in infrared devices and systems. To investigate the optical responses of some practical nano objects, nanorods made of pure metals and different alloy materials are examined by finite-different time-domain simulations. These nanorods can be applied in high-temperature environments, localized surface plasmon polaritons, and catalysts. It should be noted that some of the alloys were found to have better plasmonic properties or magnetic properties than pure elemental metals, indicating the effectiveness of the alloying strategy for exploring high-performance infrared devices.
3. Pure Au
The permittivity of bulk gold was first calculated and compared with the experimental data [
31,
32,
33,
34,
35,
36,
37,
38,
39] to check the accuracy of the computation procedures. The permittivity was constructed by the interband and intraband contributions. The intraband is related to the behavior of the free electrons, which can be depicted by Drude’s model. The real and imaginary parts of the intraband are expressed by Equations (1) and (2):
where
represents the intraband free electron plasma frequency and
is the damping frequency. In this paper,
is calculated by DFT and
is obtained from the experimental data or high accuracy simulation.
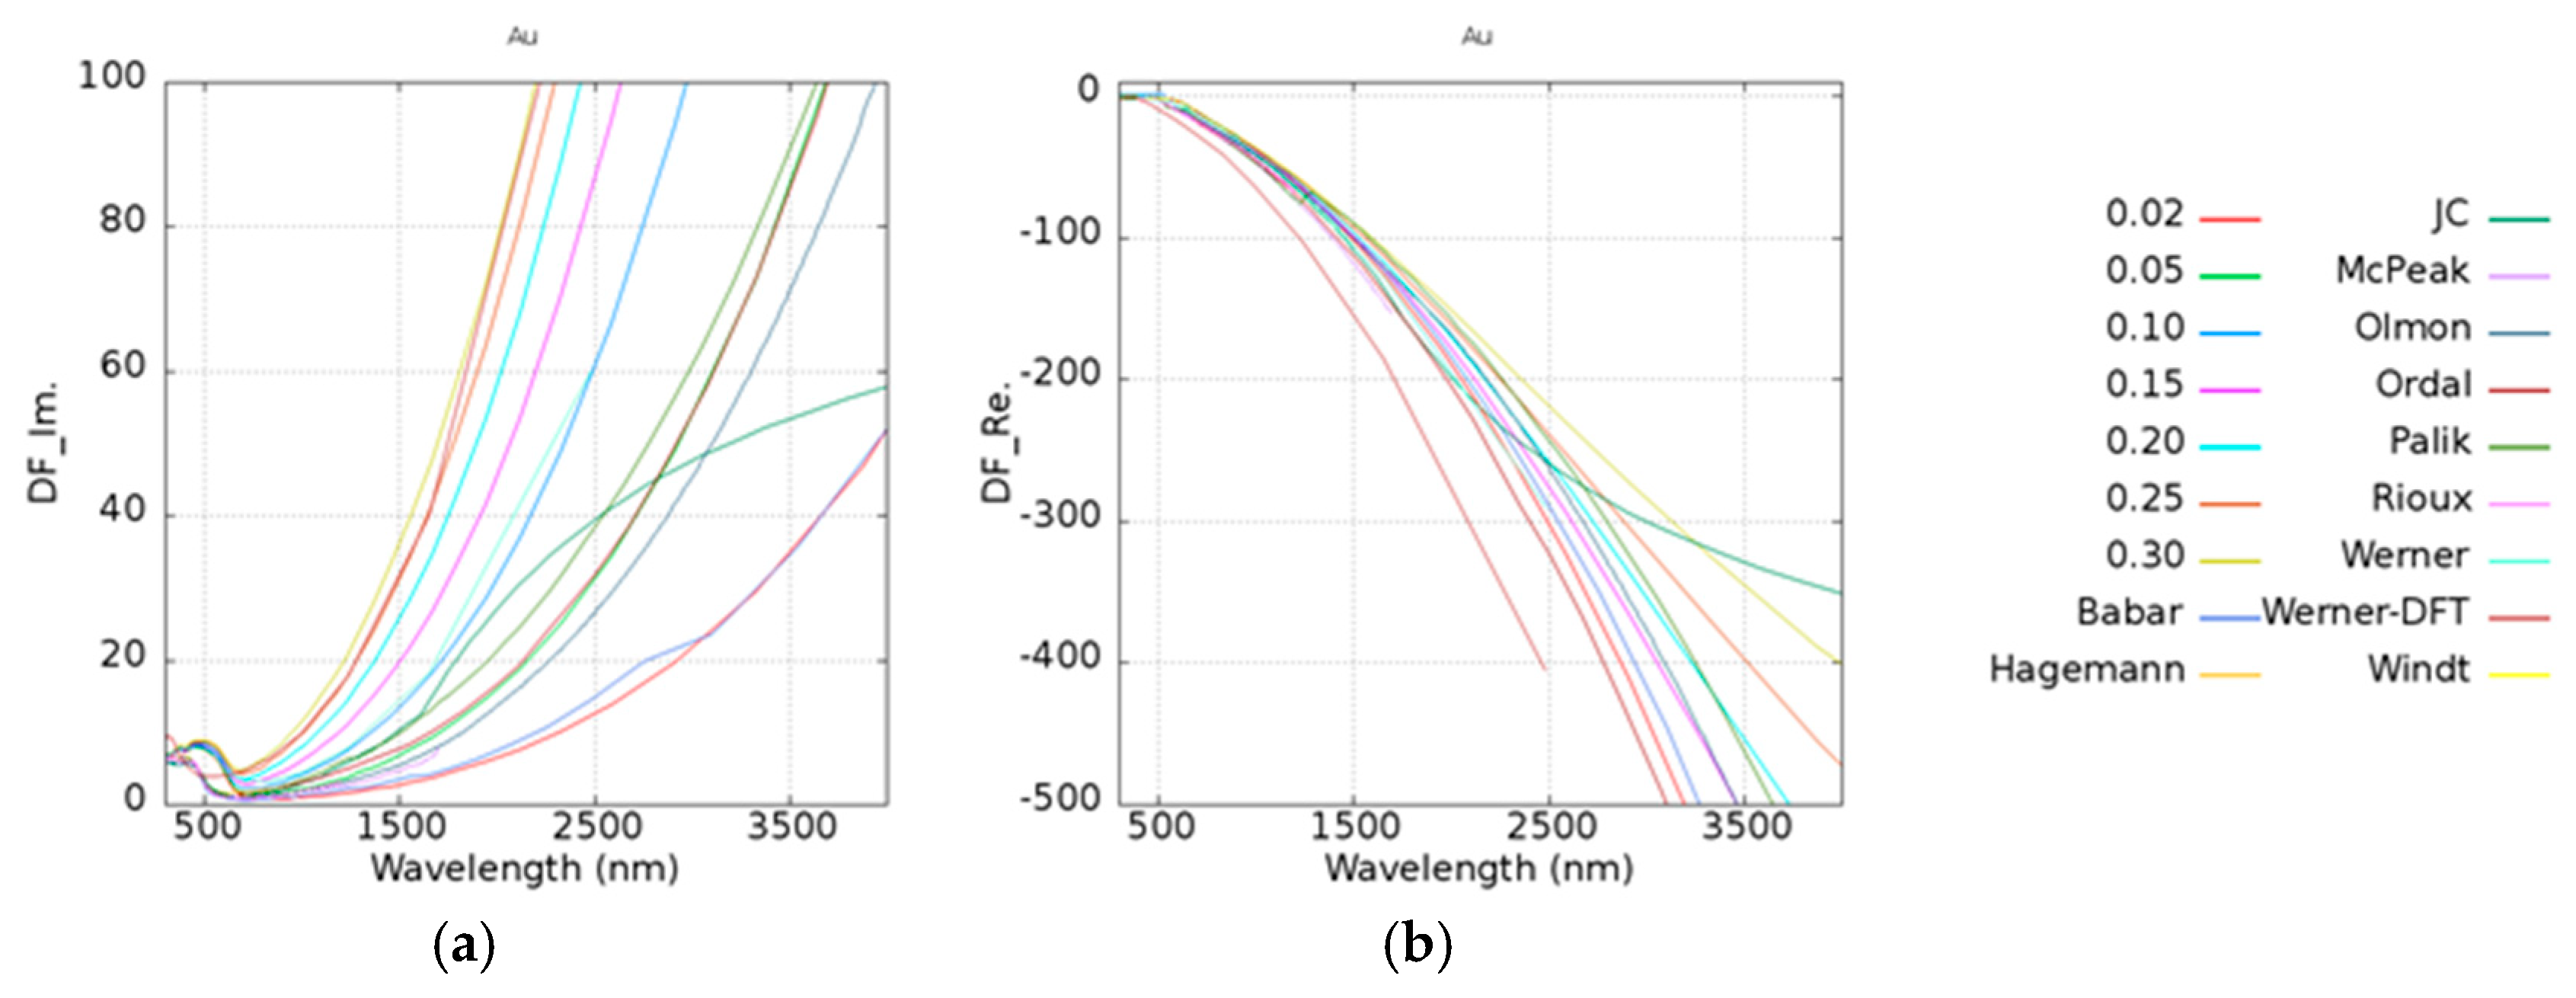
To determine the effect of
, we took Au as an example. In
Table 2, the damping frequency is shown to fit Drude’s model according to Blaber [
40], Ordal [
41], and Zeman [
42]. For the comparisons, the damping frequency was calculated from 0.02 to 0.3 eV, and the experimental data of imaginary and real parts of dielectric constants are shown in
Figure 3a,b. DF_Im. and DF_Re. along the
y-axes in
Figure 3 are denoted as the imaginary and real parts of the dielectric functions. It was found that the trend of Badar’s data [
31] which has a fitting parameter
with a value of 0.0184 eV, is similar to the calculated case of
equal to 0.02 eV. Zeman’s [
42] data was fitted by Hagemann’s [
32] experimental results which are located between 0.05 and 0.1 eV. Although Hagemann only provided experimental data under 826 nm, the trend of this data is similar to that of our simulation data. Olmon et al. [
35] discussed the relationship between the parameter
and the permittivity of the different morphologies of gold in detail.
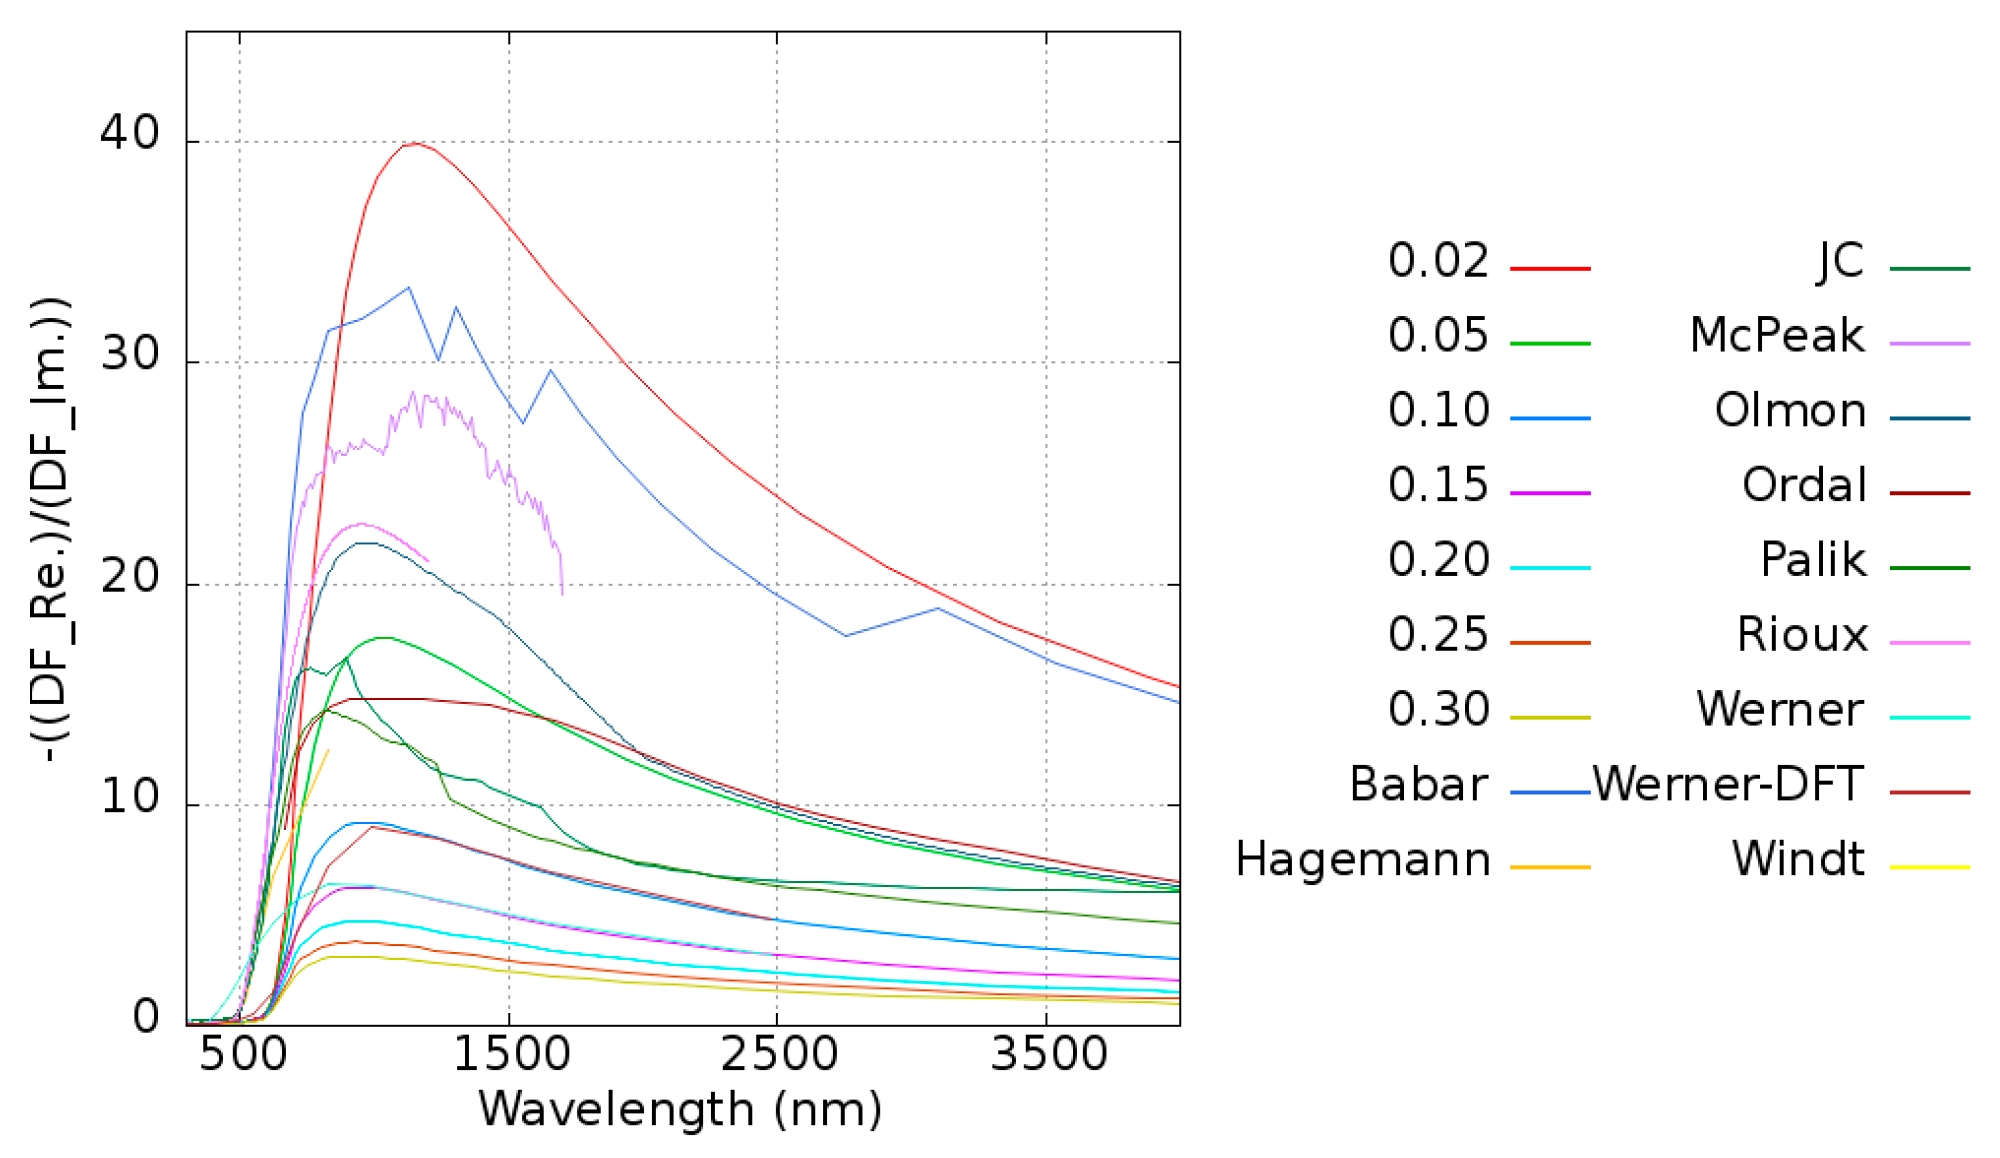
To excite the plasmons, the real part of the dielectric function should be negative to match the condition of the adjacent dielectric material. The parameter quality factor (
Q) is introduced to examine the performance of plasmons, and it is defined as Equation (3).
For a given material, a high
Q means that it has less loss and a stronger resonance property for inducing plasmons in this frequency range. The
Q of pure Au is shown in
Figure 4. The maximum of
Q is located at around 1100 nm, which is consistent with the experimental data [
31,
32,
33,
34,
35,
36,
37,
38,
39]. Most of the experimental data’s
are located between 0.02 and 0.1 eV. Considering the different metals employed in this work, the damping frequency is taken as 0.1 eV for all systems except pure Au.
4. Au-Based Alloy
The permittivity of alloys was calculated by combining the DFT calculated interband transition and Drude’s term of intraband transition. To justify the calculated results, we took AuNi as an example. Jain et al. [
43] reported an AuNi alloy wire generated by melting 99.99% pure nickel and gold ingot. It was predicted that the alloy atomic ratio would be 0.5 due to the vacuum system and repeated re-melting process. The quality factors of the AuNi from Jain’s results were 0.575, 0.660, and 0.606 at 1000, 1500, and 2000 nm wavelengths, respectively. The trend of the quality factor was consistent with our data on Au
0.5Ni
0.5 (BCC_mix), which exhibited quality factors of 0.668, 0.686, and 0.682 at the same wavelengths.
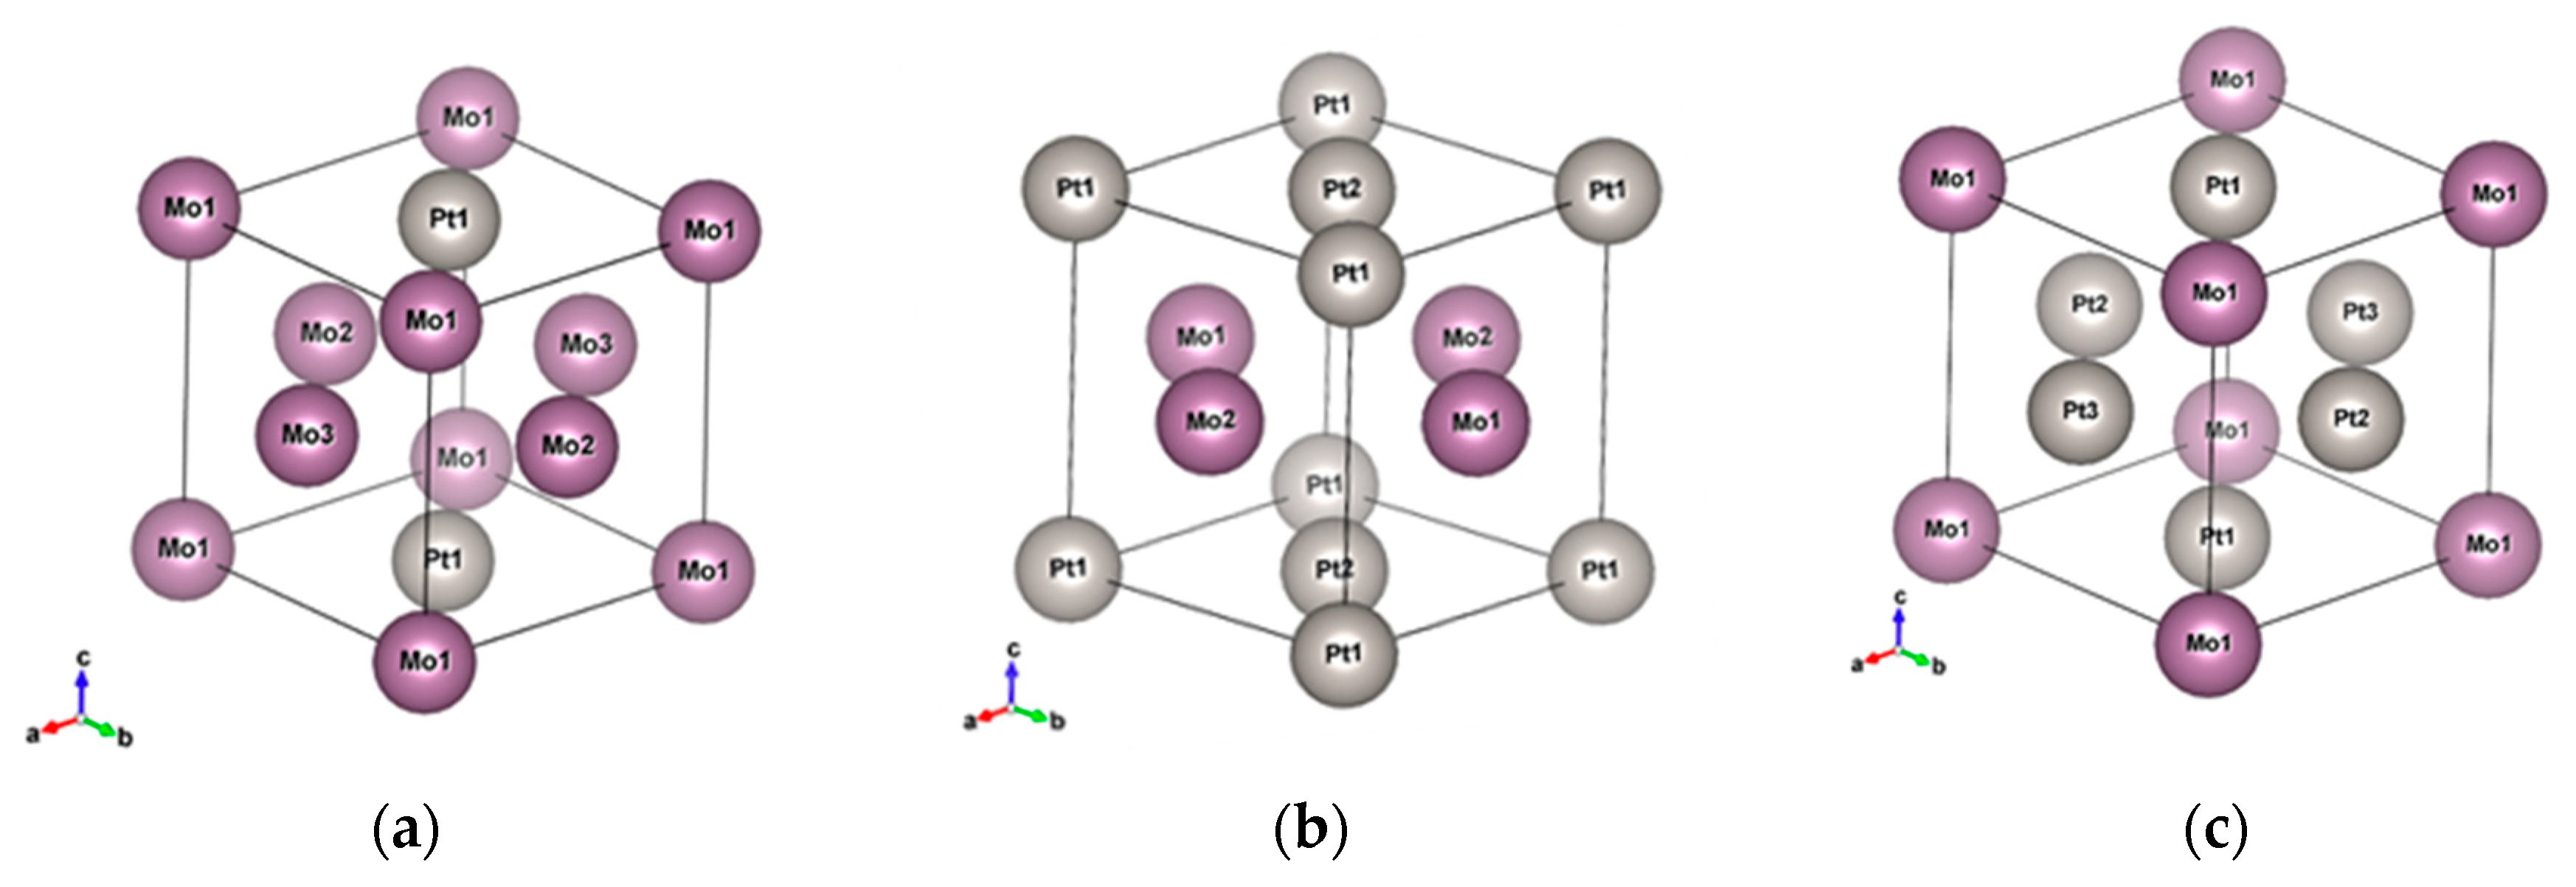
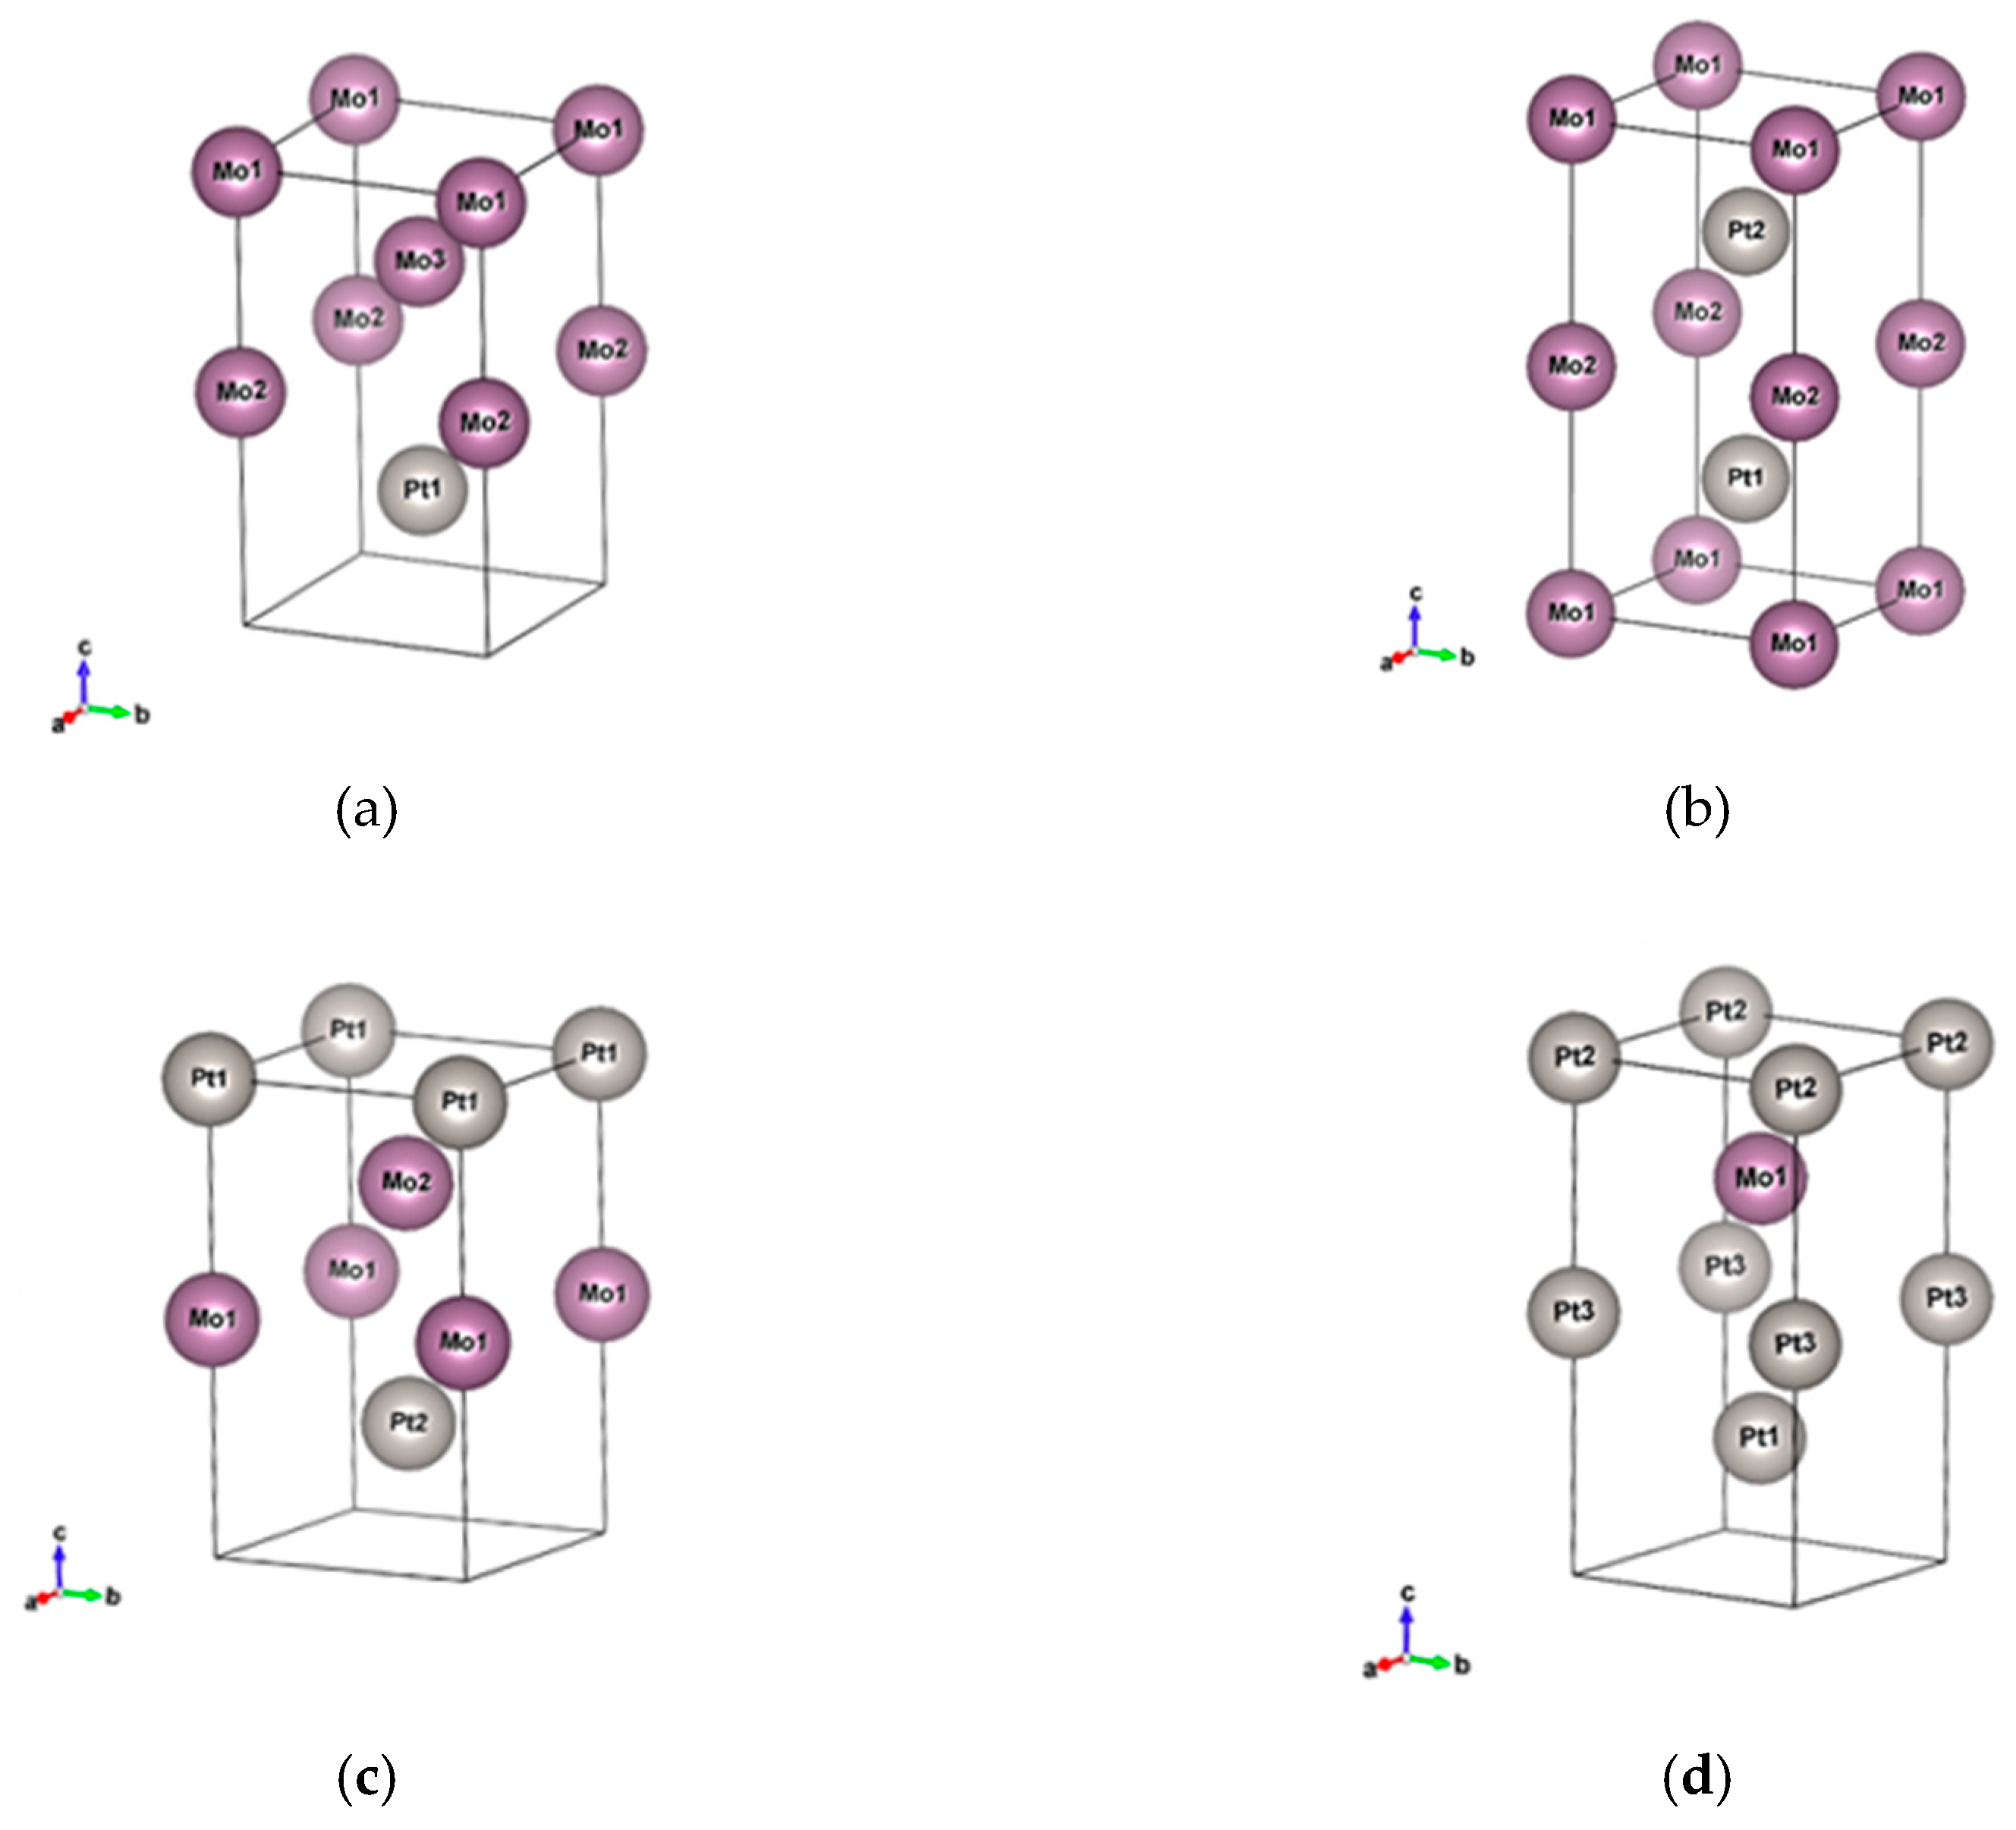
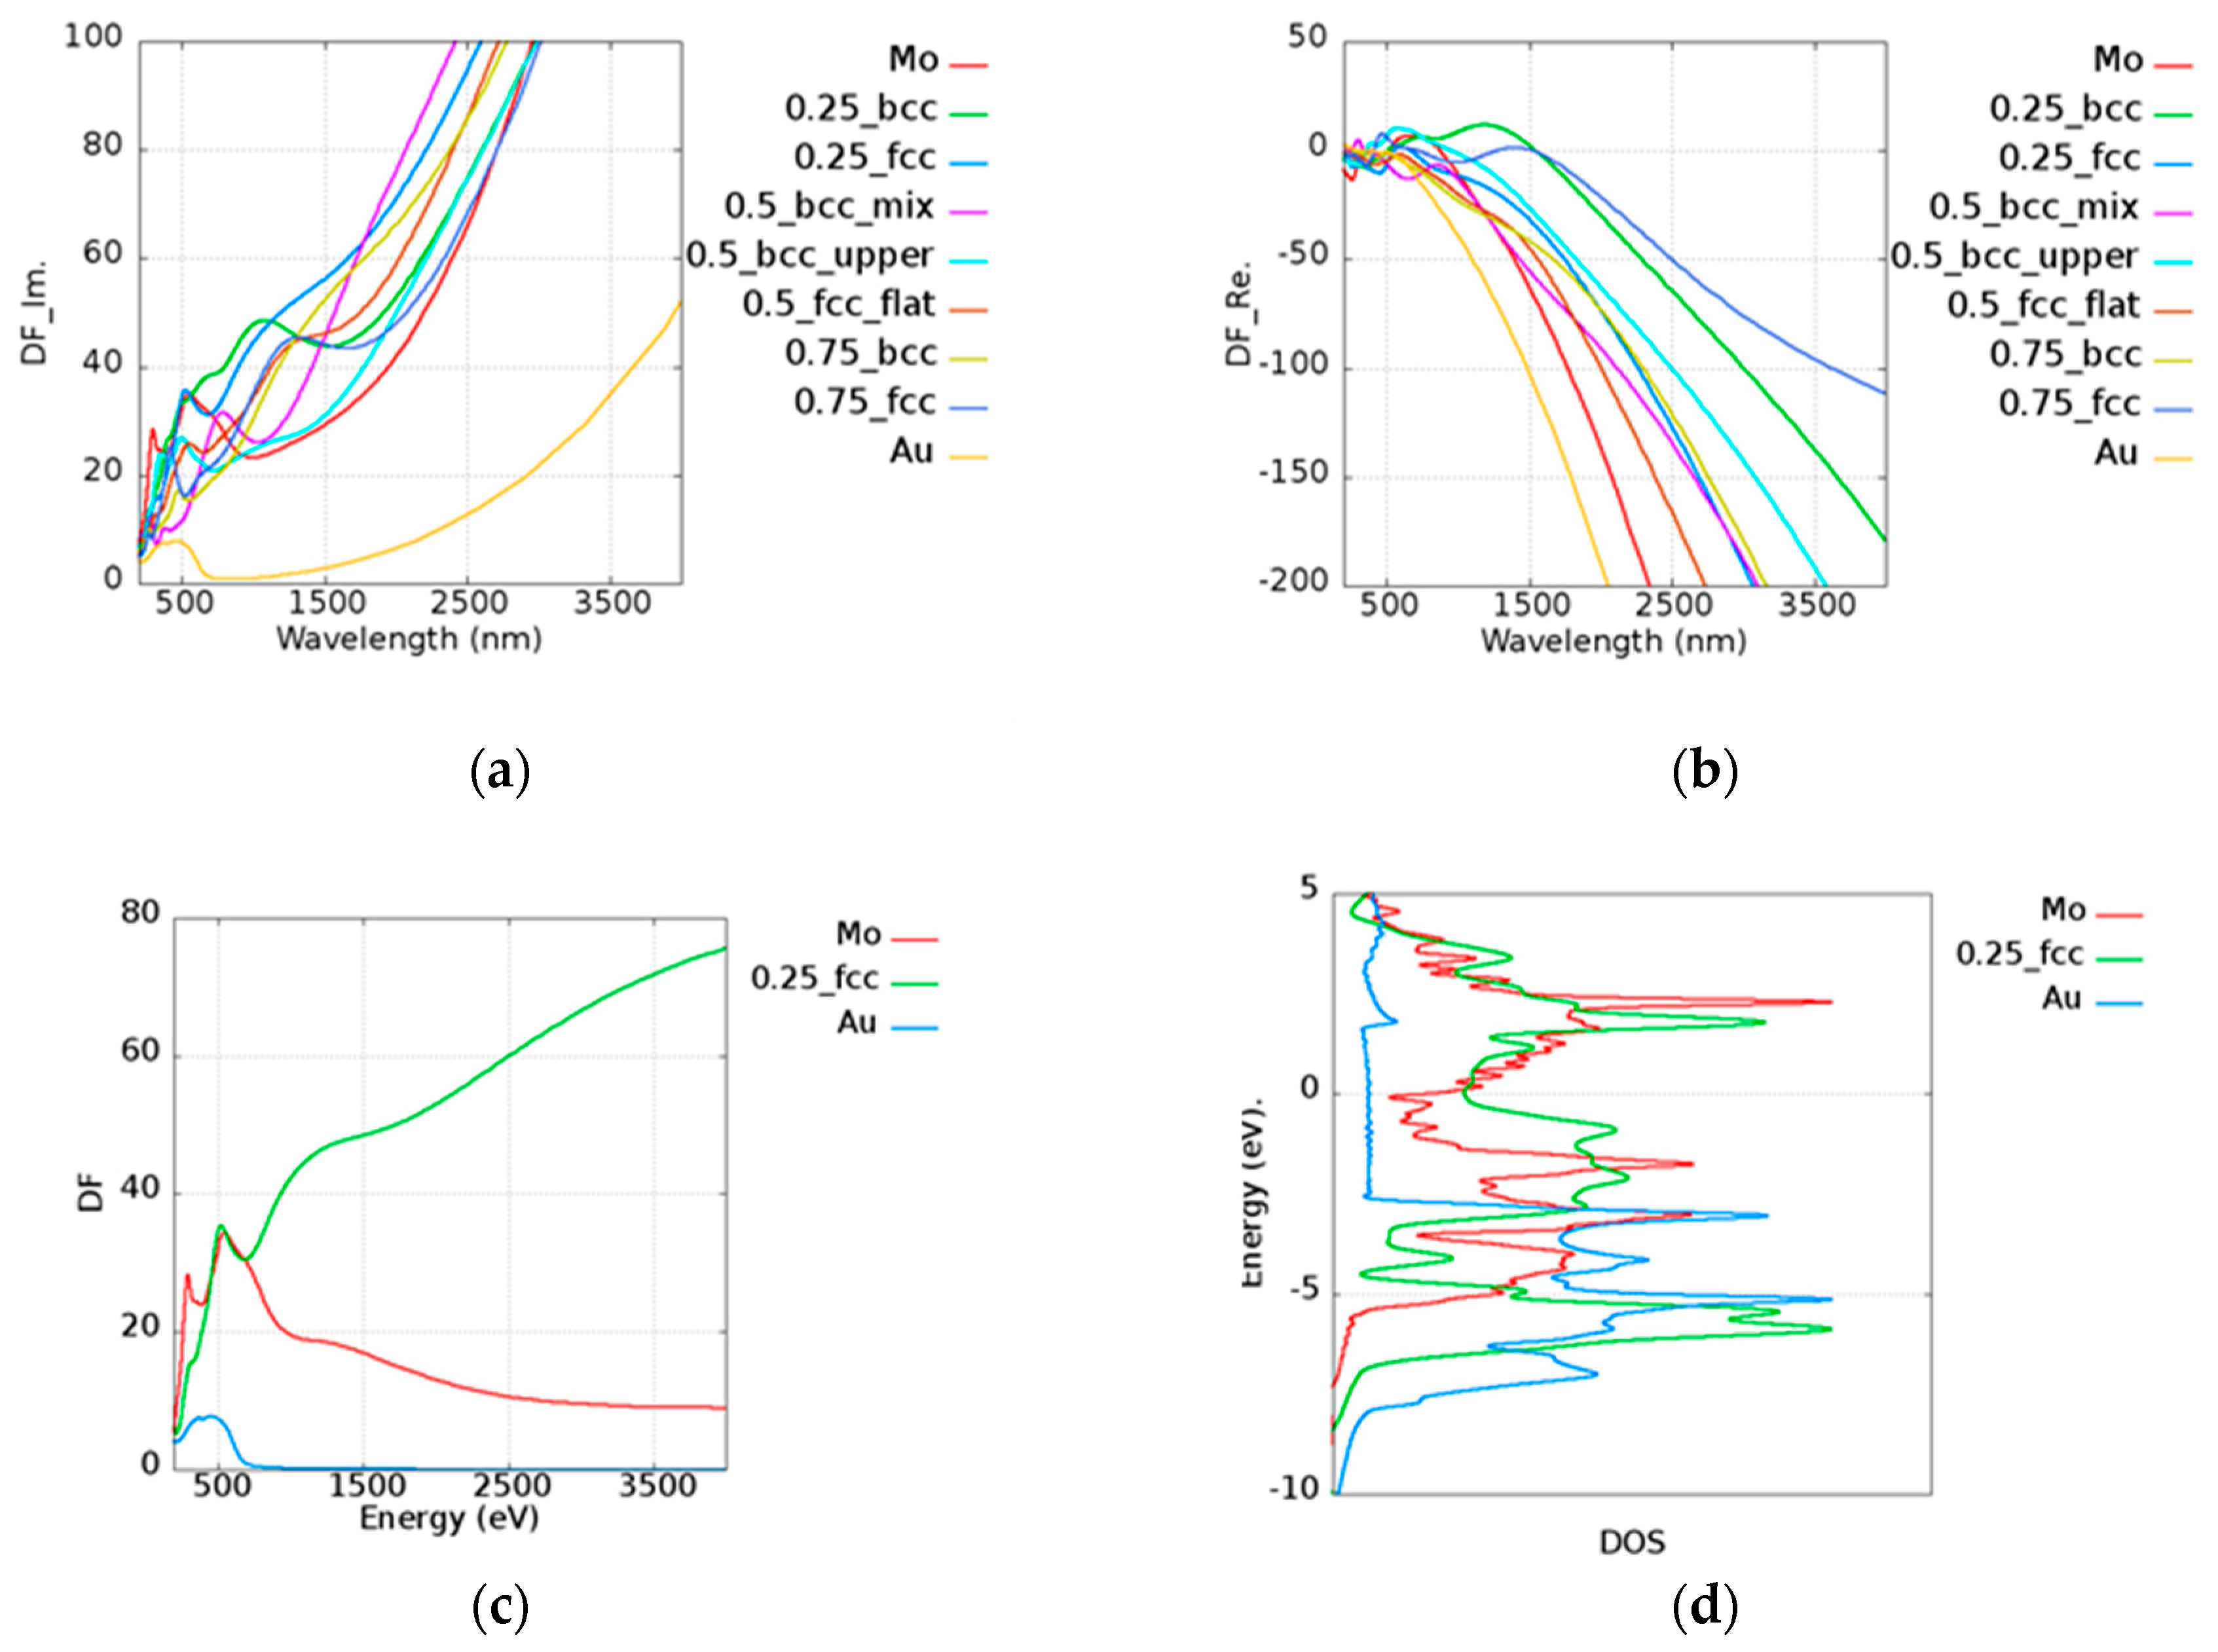
To inspect the optical properties of alloys, we took Au
xMo
(1−x) alloy as an example. The imaginary and real parts of the permittivity of Au
xMo
(1−x) alloy are shown in
Figure 5a,b, respectively. In the legend of the plots in
Figure 5, the first and the last ones characterize the pure metallic elements. The number represents the atomic ratio of Au, while the text after the number denotes the structure and the morphology under the given atomic ratio condition. For example, 0.25_bcc represents Au
0.25Mo
0.75 with a BCC structure. In the Au
xMo
(1−x) alloy, all cases possessed a higher imaginary part of the permittivity than pure Au and Mo above 1000 nm. In addition to intraband transition, the interband transition also has the contribution to the imaginary part of the permittivity. Here, Au
0.25Mo
0.75 (FCC) was taken as an example for further discussion. The permittivity contributed by the interband transition of Au
0.25Mo
0.75 (FCC), pure Au, and Mo is shown in
Figure 5c, and the corresponding density of states (DOS) is shown in
Figure 5d. The DOS for each case is normalized by the maximum value within the range of −10 to 5 eV. It was shown that the onset of interband transition is roughly consistent with the distance between the large quantity states and the Fermi level. For instance, it was shown that the first huge DOS peak below the Fermi’s level is around 2.5 eV in the case of Au (
Figure 5d, blue line), whereas the occurrence of interband transition is around 516 nm. The combination of Au and Mo leads to additional states, which are known as the virtual states [
20] and add the possibility of photon absorptions for the higher imaginary part of the permittivity.
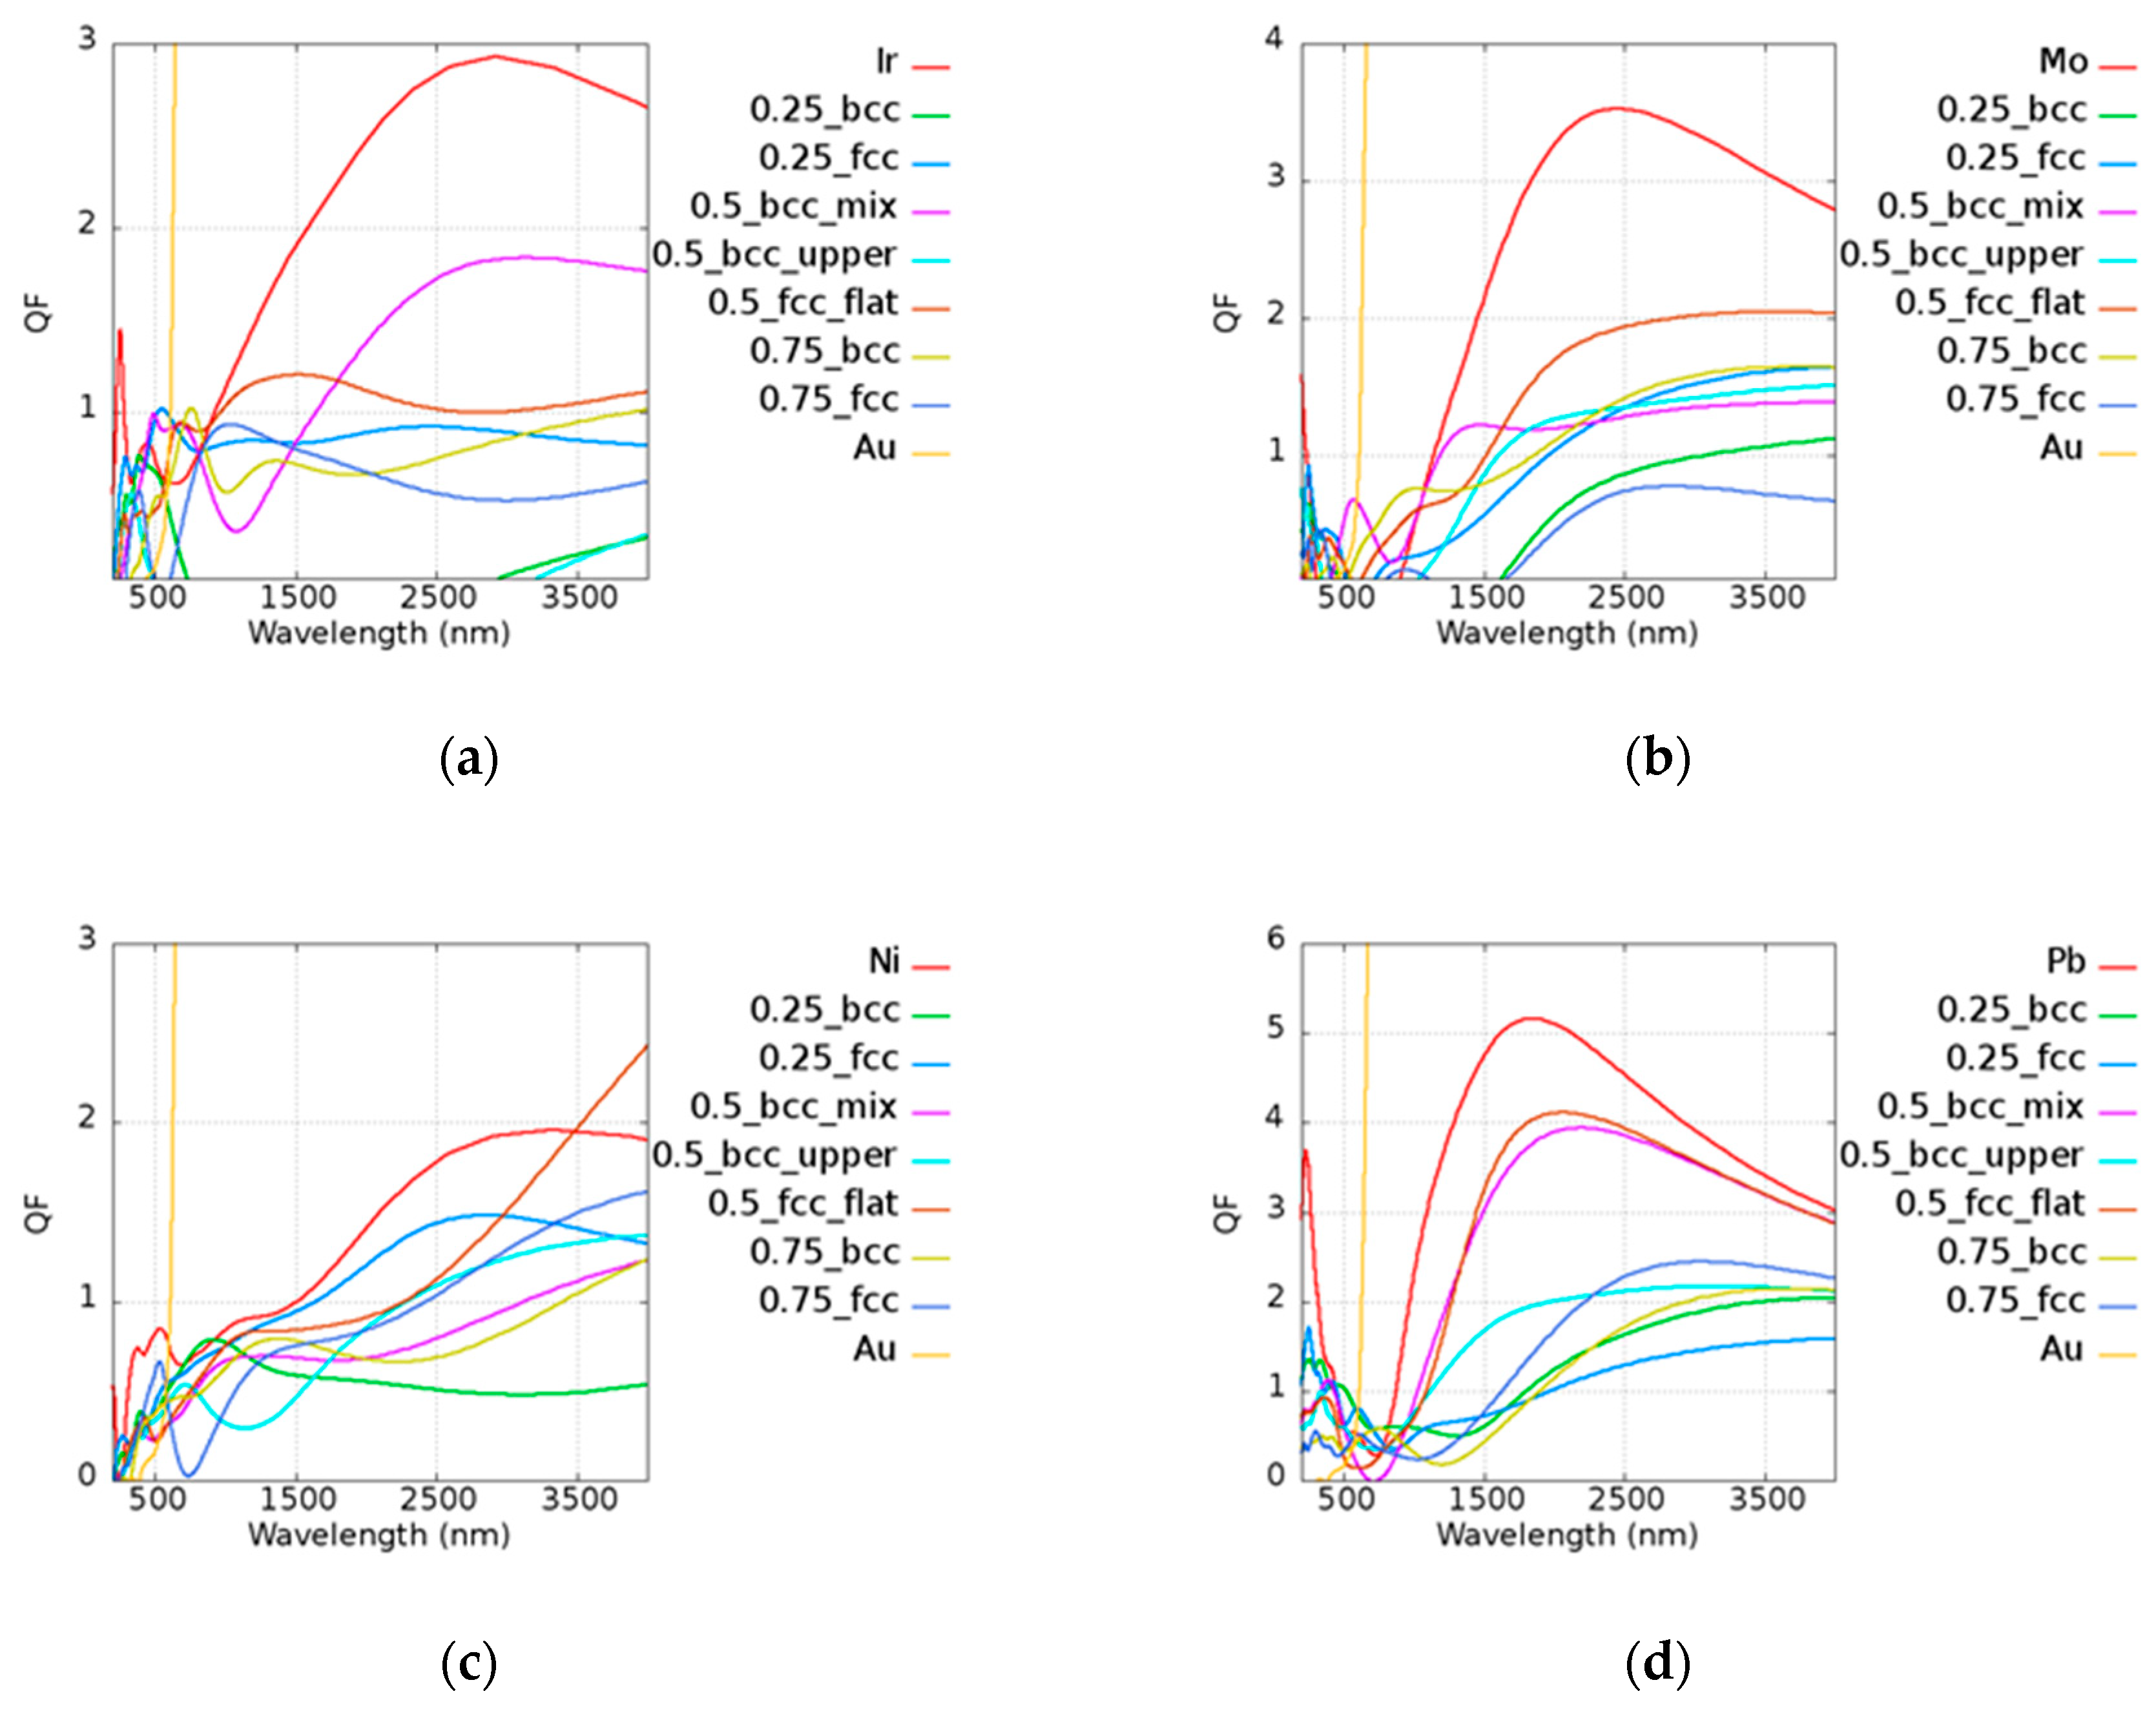
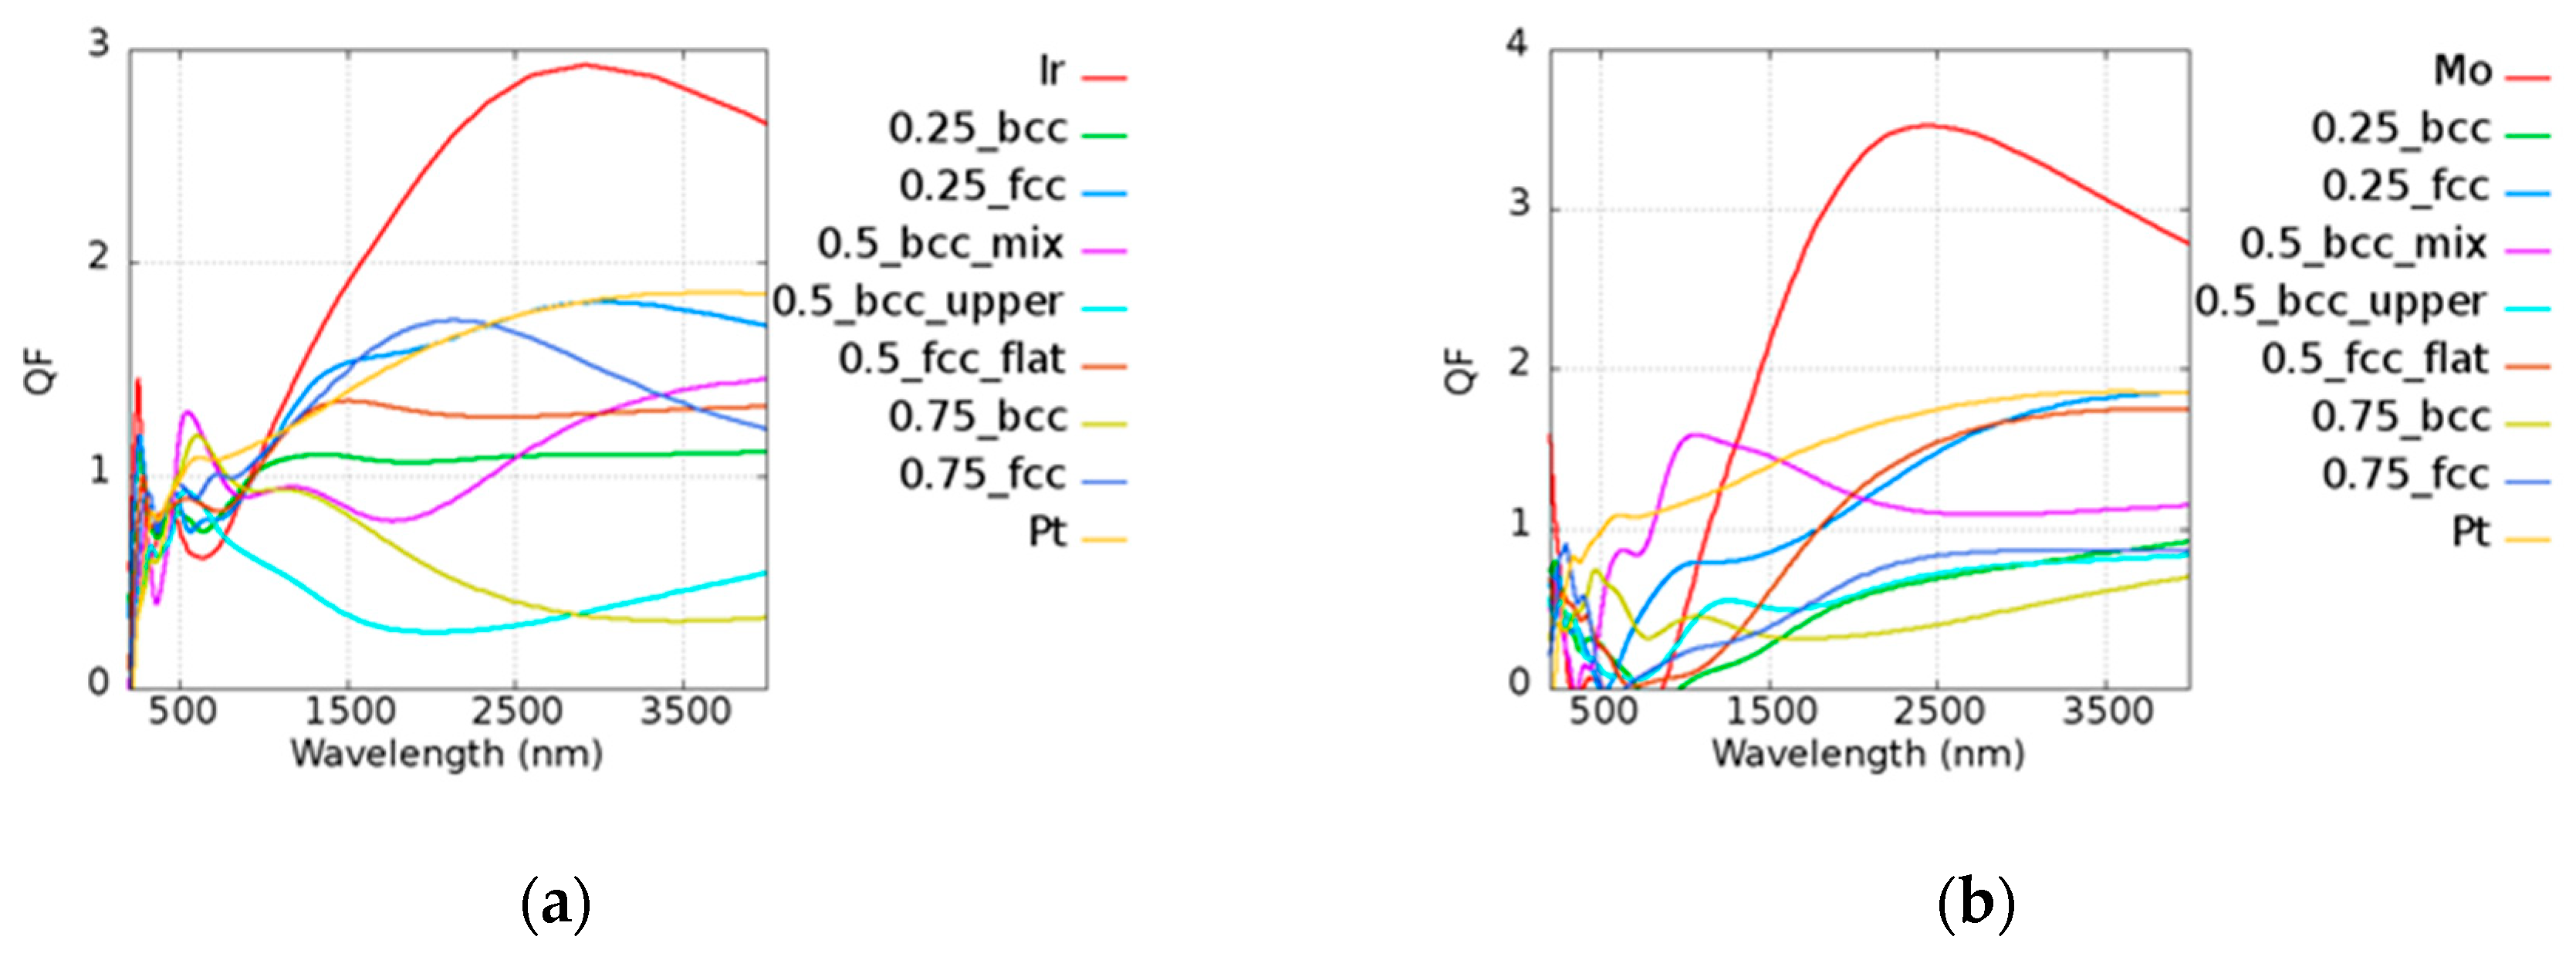
The results of
Q of the Au-based alloy are shown in
Figure 6. In the legend of the plots, the first and the last ones characterize the pure metallic elements. The number represents the atomic ratio ofe Au, while the text after the number denotes the structure and the morphology under the given atomic ratio condition. For example, in
Figure 6a, 0.5_bcc_mix represents Au
0.5Ir
0.5_mix with a BCC structure. The extreme high
Q of Au is not fully shown here, although it is given in
Figure 4. A material which has a
Q value lower than 1 may not be a good plasmonic material in such a frequency. Low-
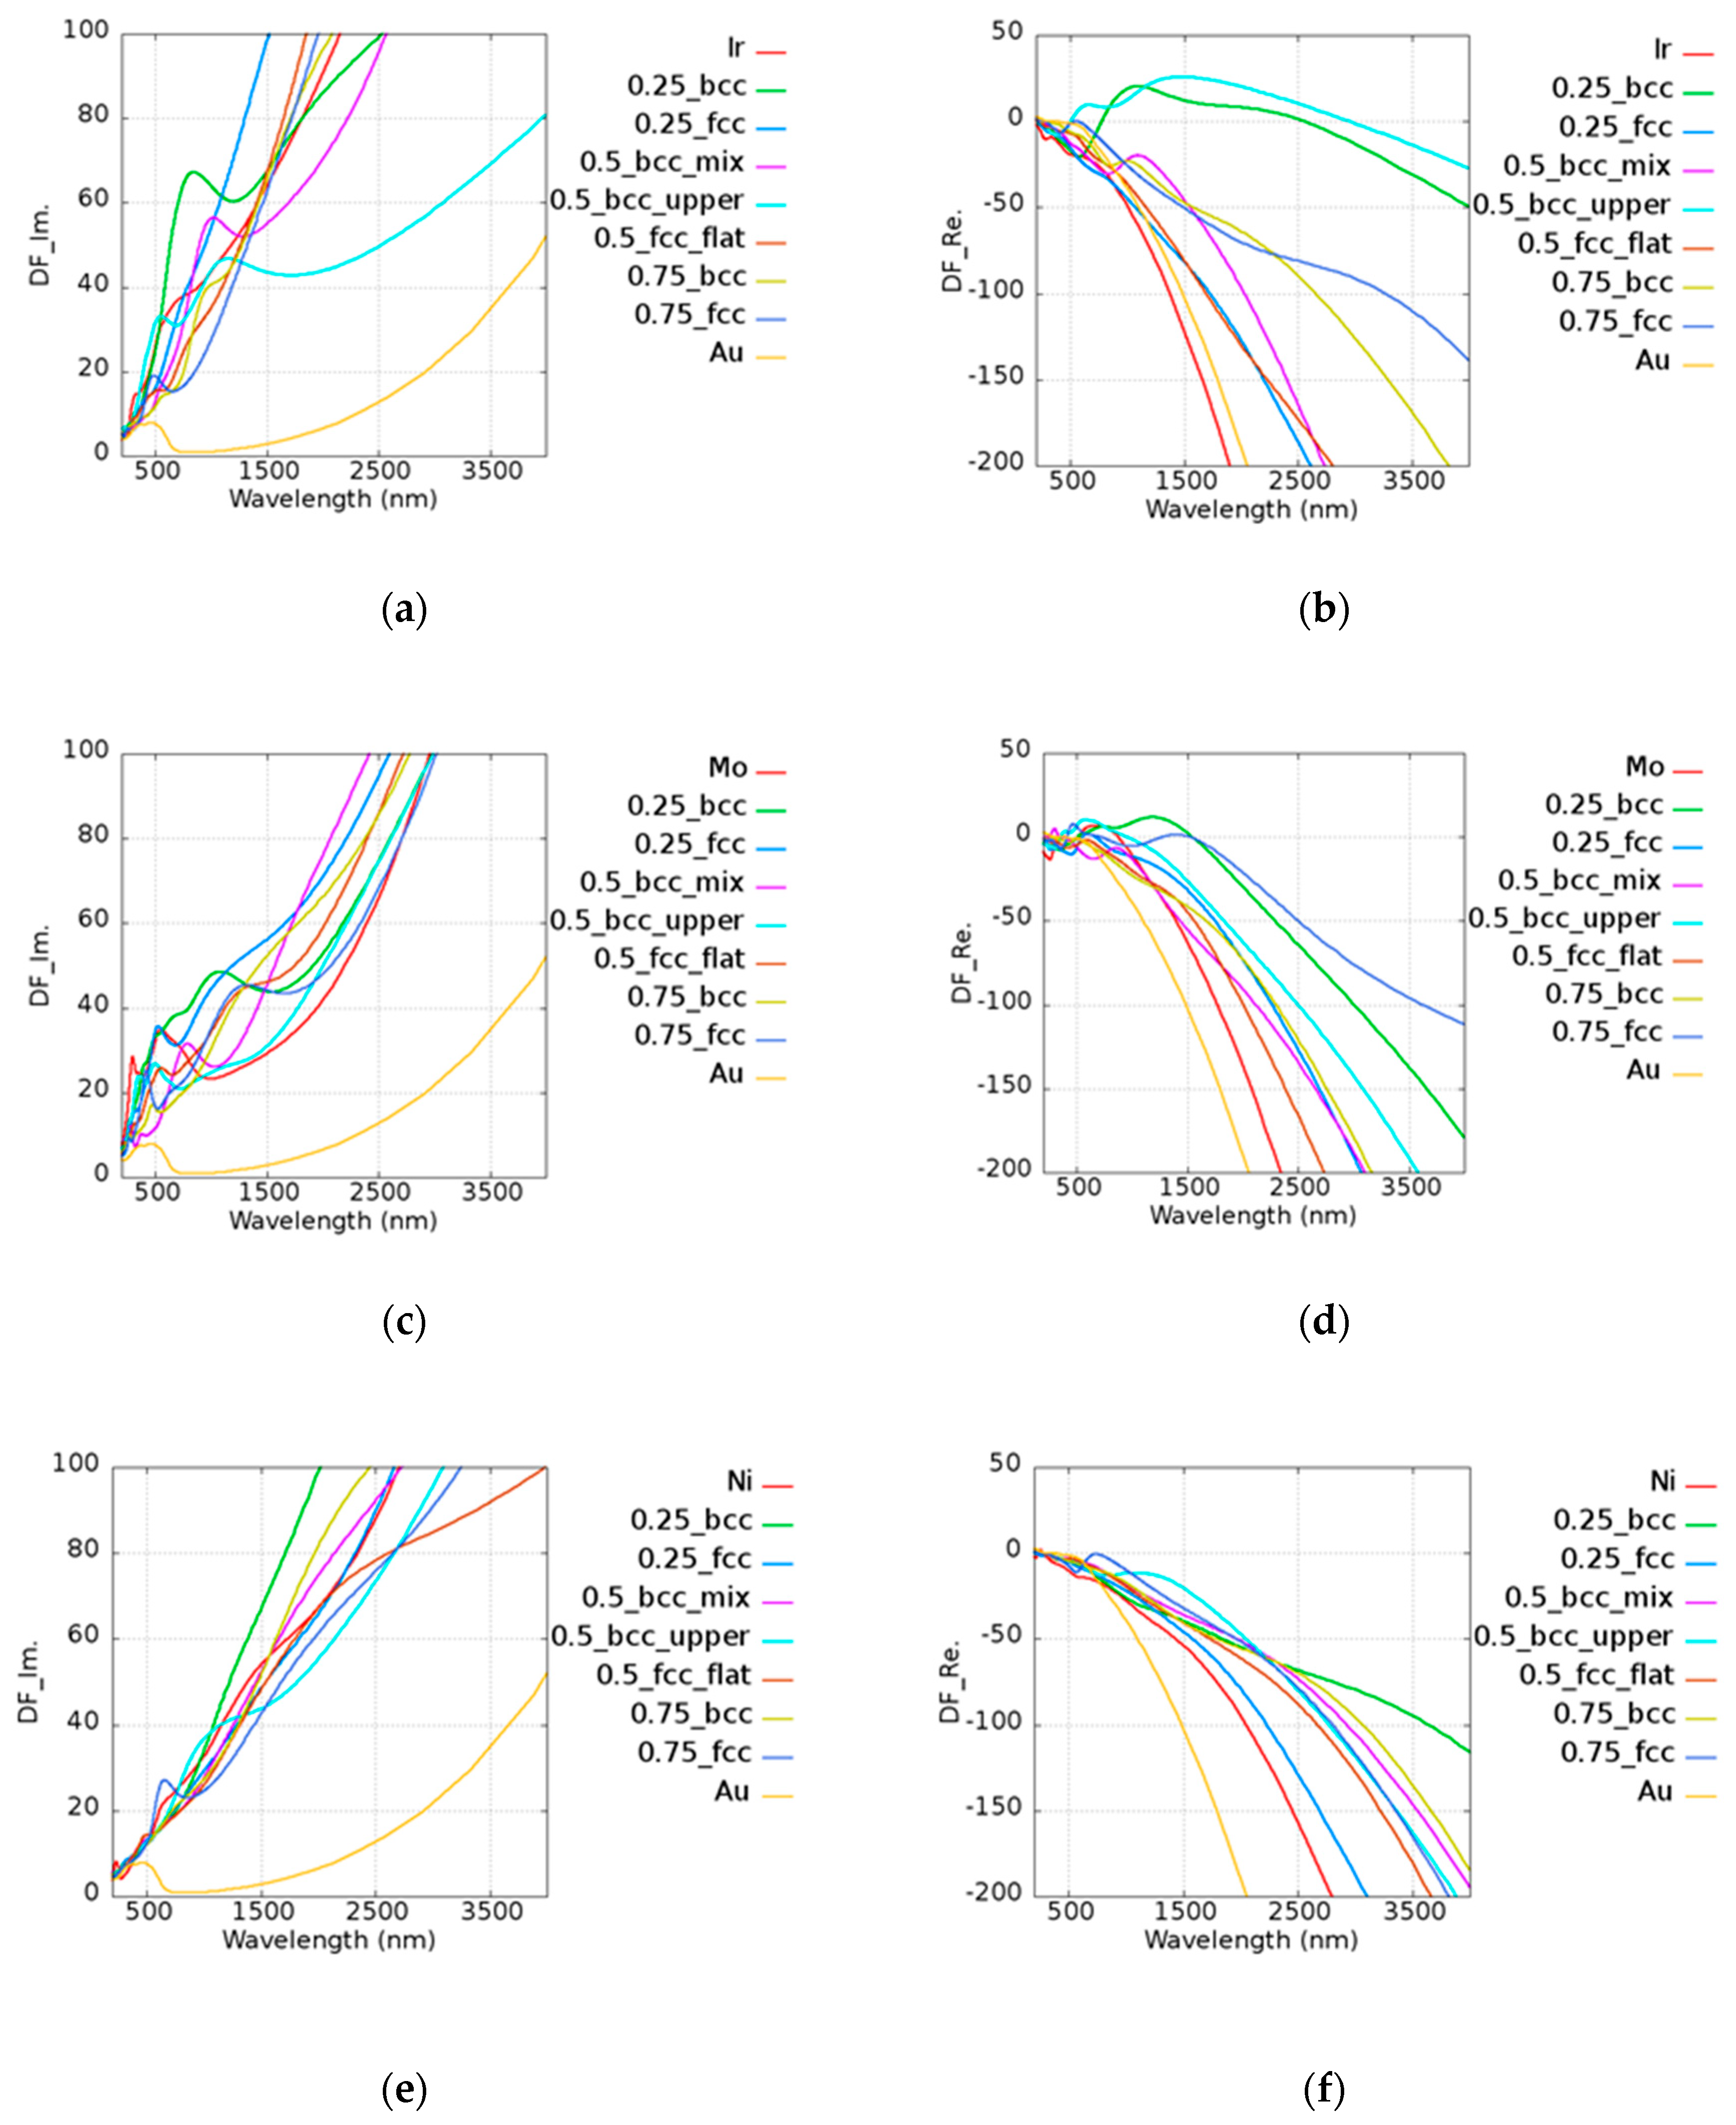
Q materials occur around the visible region in most cases, and this contributes to the relatively high real part of the permittivity and the onset of interband transition. Some cases even serve as a dielectric material; in other words, they have a positive real part of the permittivity, as shown in the
Appendix A. Although some alloys possess lower imaginary parts compared to pure metal, such as AuIr and AuNi, it was found that alloys have a larger real part of the permittivity due to the reduction of the plasma frequency. This leads to a larger intraband transition, as shown Equation (1), causing the shrinking of
Q. Most of the cases exhibited a smaller
Q than pure metal, but there are still several instances that showed a good property of
Q. For example, Au
0.25Ir
0.75 and Au
0.75Ir
0.25 had a better performance than pure metal at 600 nm and 800 nm of narrow band. The extremely low imaginary part of the permittivity of Au
0.5Ni
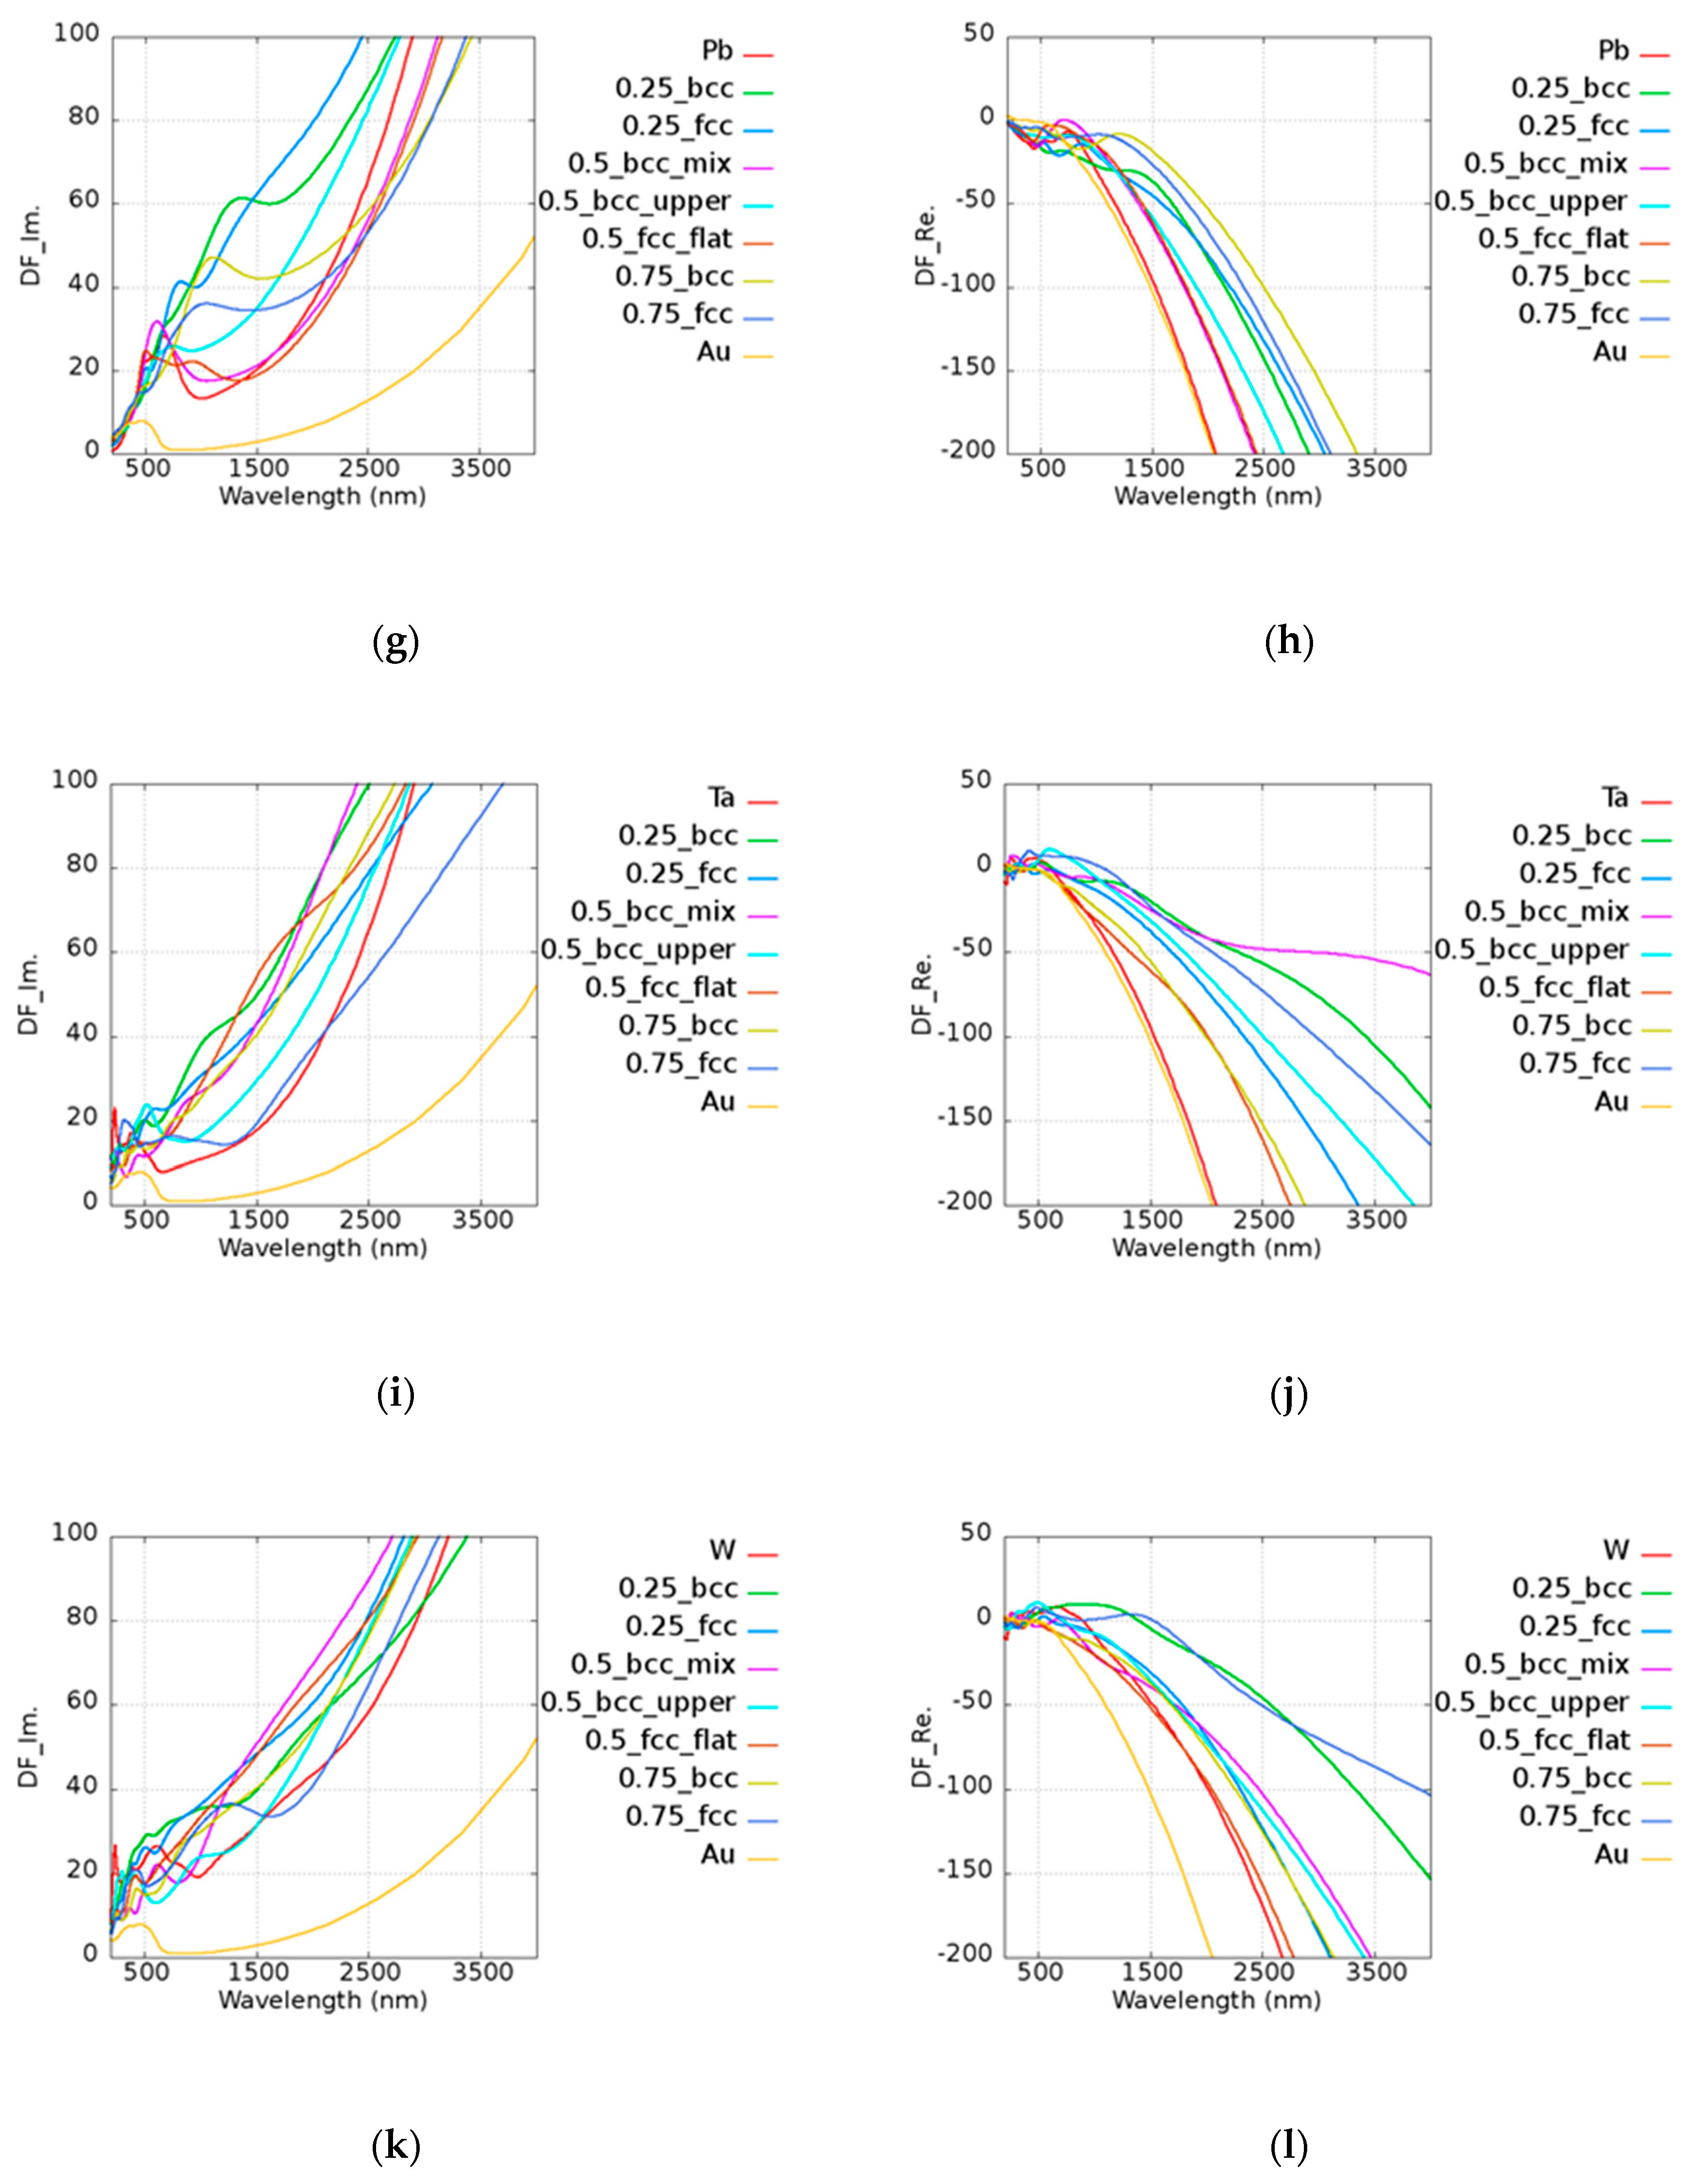
0.5 (FCC) was found even compared with other Au-based alloys and pure Ni. The real and imaginary parts of permittivities of Au-based alloy are shown in
Figure A1 of
Appendix A. It is not surprising that Au
0.5Ni
0.5 (FCC) showed a good performance above 3500–4000 nm. Au
0.5W
0.5 (BCC_mix) possessed a better
Q performance than pure W around the near-infrared region at 1000 nm. On the other hand, manufacturing costs may be reduced by using different compositions. The prices of Au, Pt, and Ir remained in same order in 2018, being more expensive than Ni, Mo, Pb, Ta, and W. The raw material cost may be an important issue affecting the mass production of devices. The
Q performance was larger than 1 in most of the Au-based alloys in the infrared region, indicating that these may be used in different applications.
5. Pt-Based Alloy
Unlike pure Au, Pt has a smaller
Q due to its high imaginary part of the permittivity. The results of
Q of Pt-based alloy are shown in
Figure 7. In the legend of the plots, the first and the last ones characterize the pure metallic elements. The number represents the atomic ratio of Au, while the text after the number denotes the structure and the morphology under the given atomic ratio condition. For example, in
Figure 7a, 0.75_fcc represents Au
0.75Ir
0.25 with an FCC structure. Pt
0.5Ir
0.5 (BCC_mix) and Pt
0.75Ir
0.25 (BCC) had stronger plasmonic responses in the visible range of 600 to 700 nm as compared to pure Pt. Pt
0.75Mo
0.25 (BCC_mix) exhibited a higher
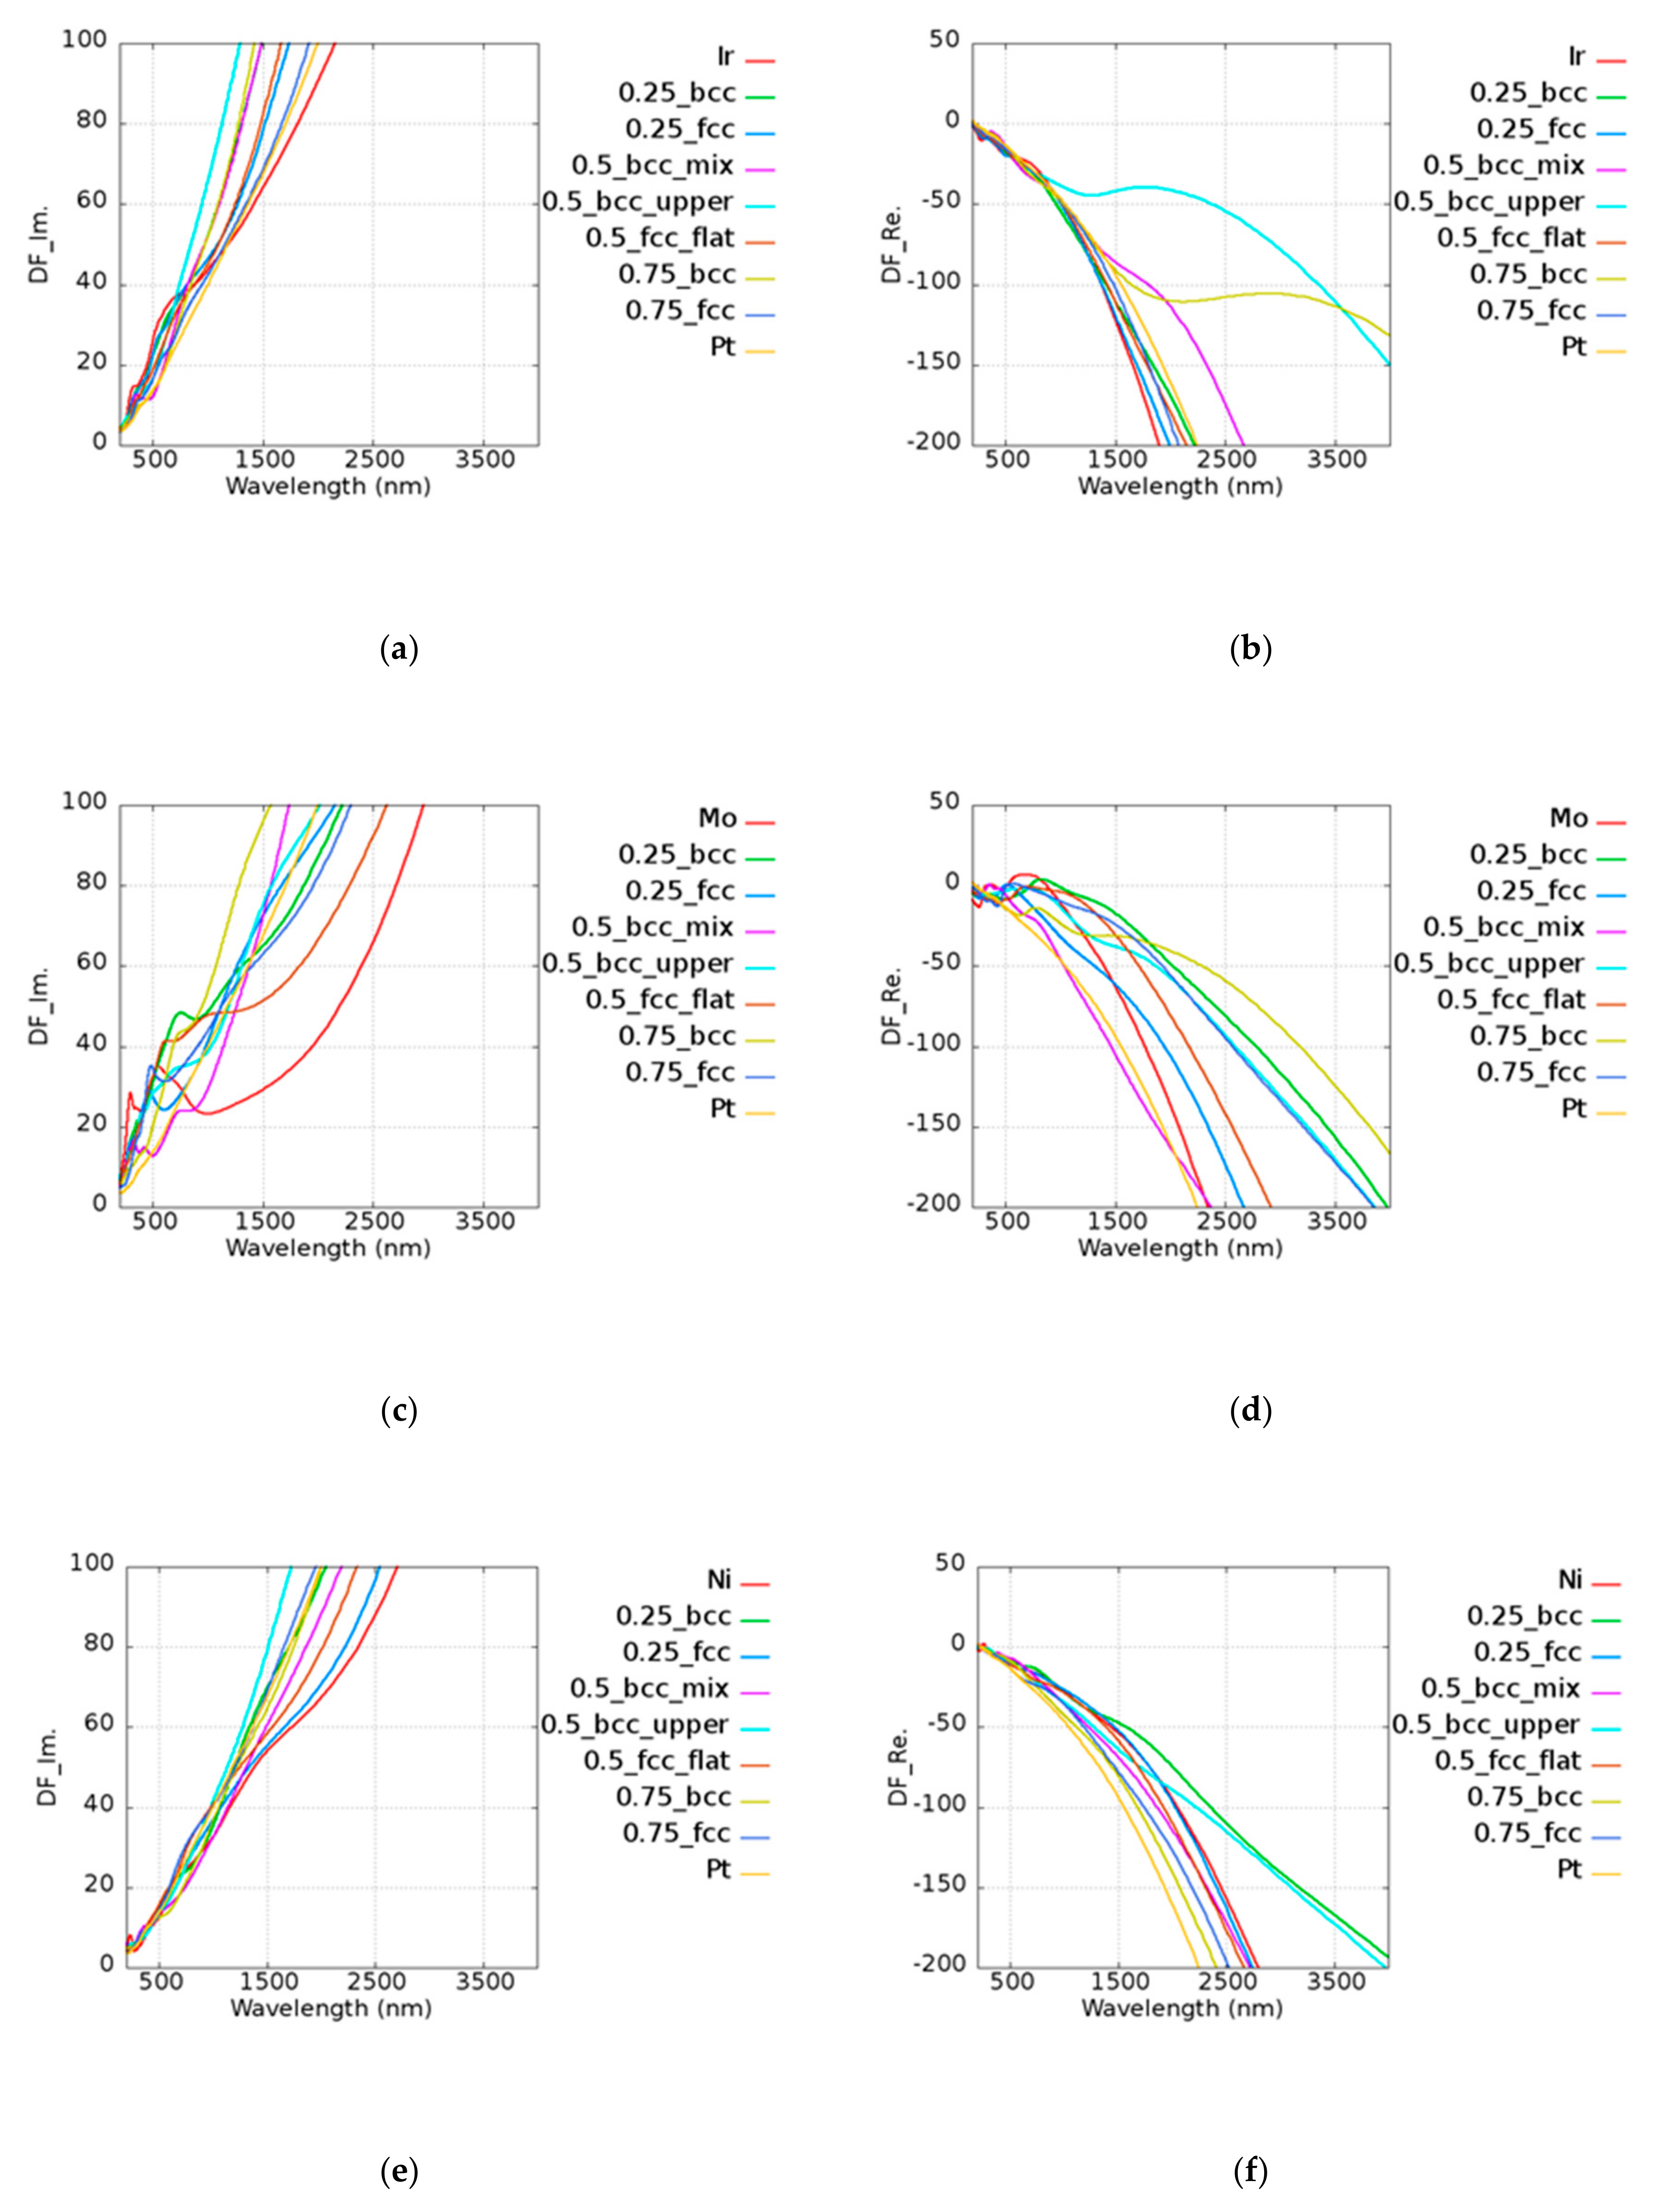
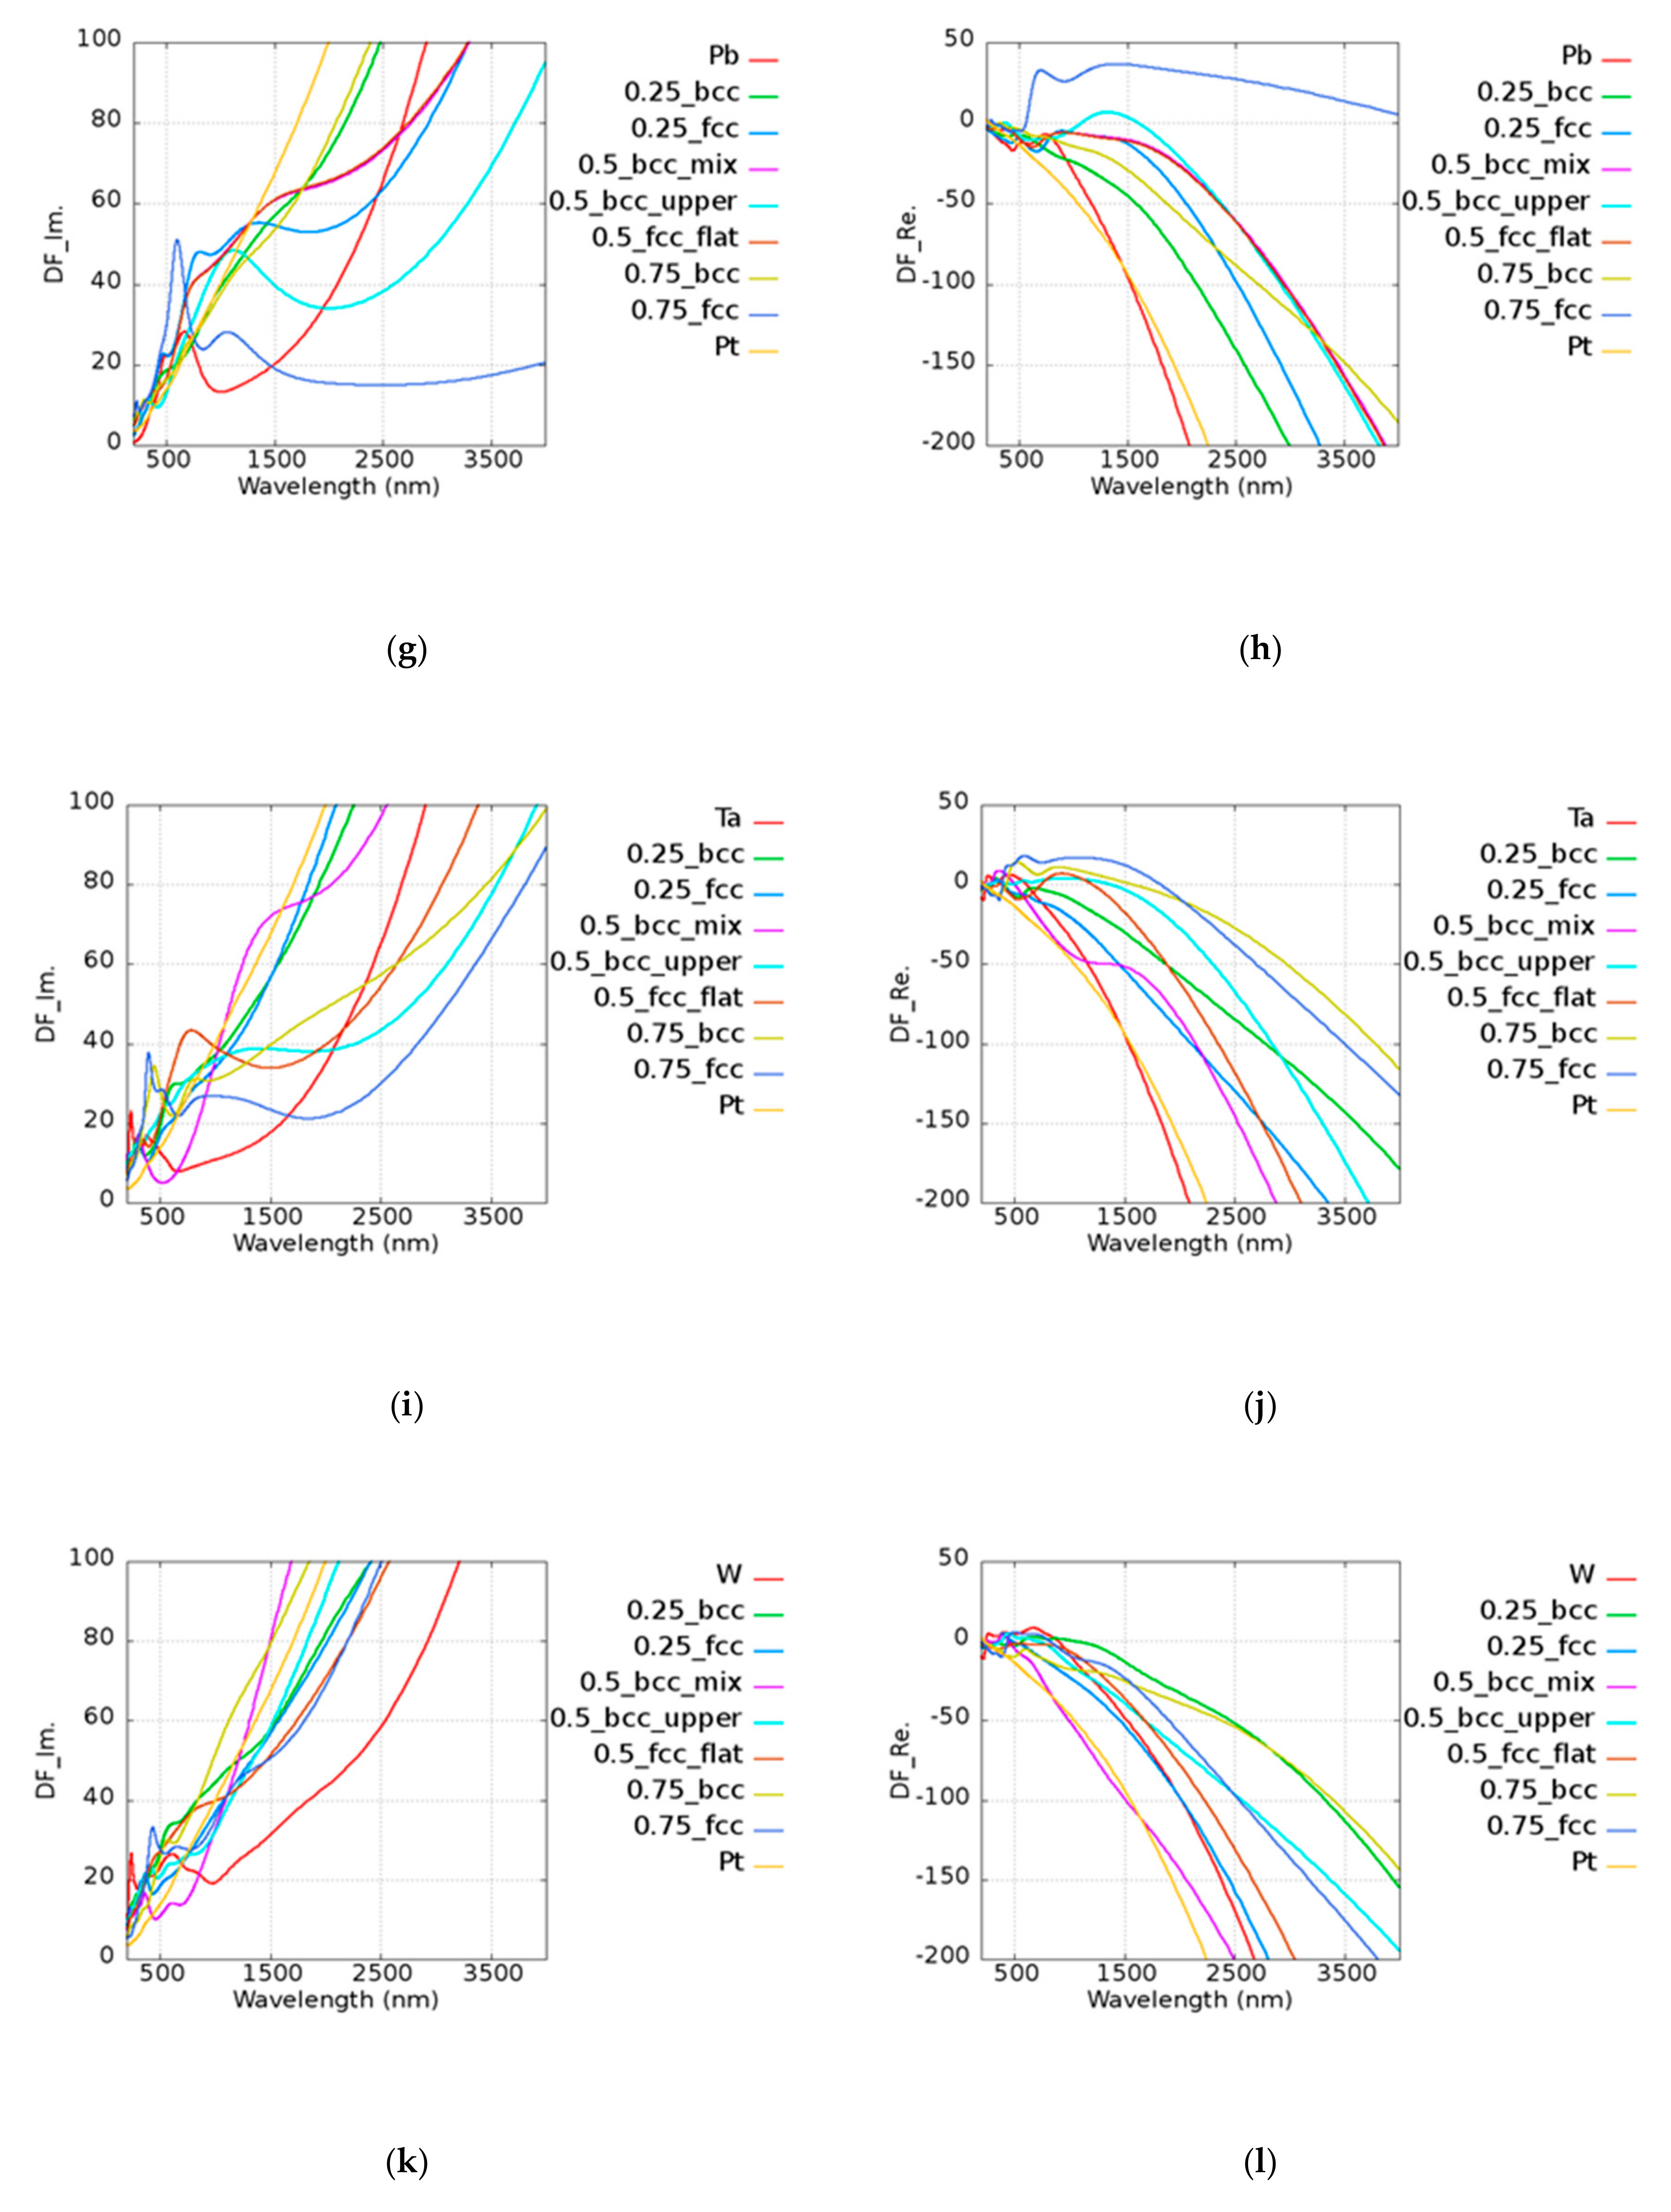
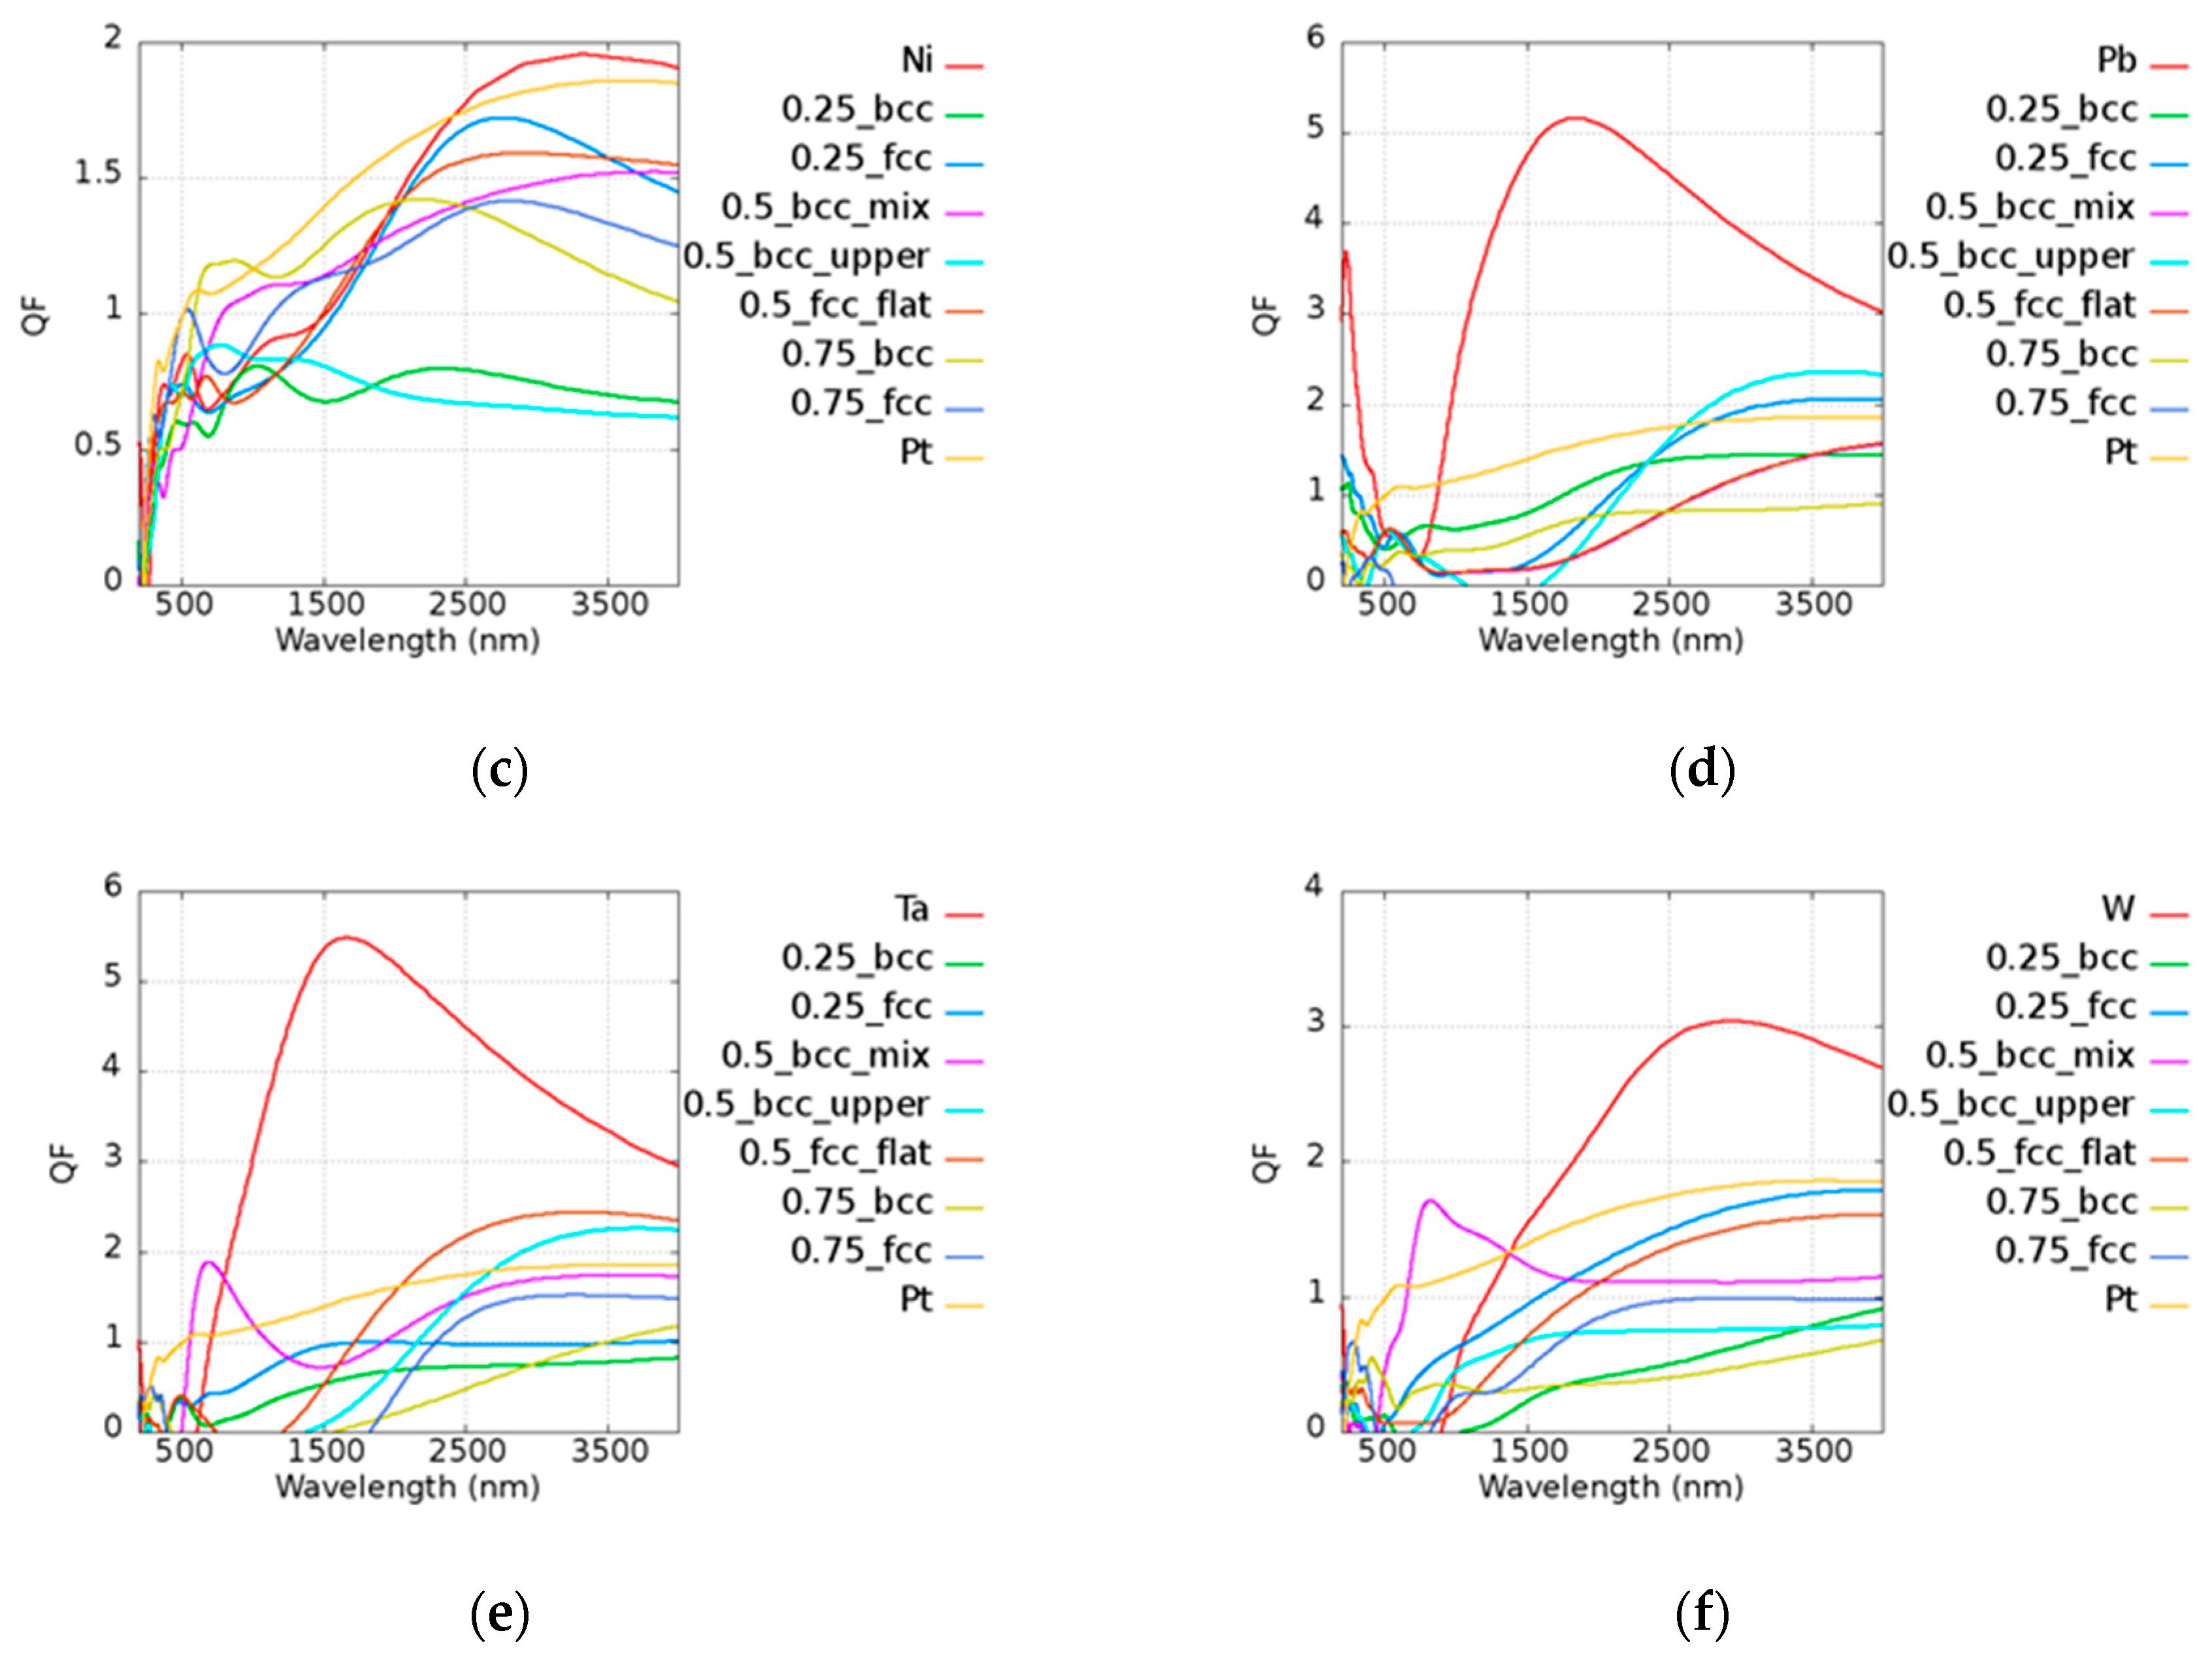
Q in the range of 900 to 1300 nm, which contributes to the lower loss and similar real part of pure Pt. The real and imaginary parts of permittivities of Pt-based alloy are shown in
Figure A2 of
Appendix A. Pt
0.75Ni
0.25 (BCC) could be applied in the range of 600 to 1000 nm and Pt
0.25Ni
0.75 (FCC) had a similar
Q to that of two pure metals in the range of 2400 to 2700 nm. Pt
0.25Pb
0.75 (FCC) and Pt
0.5Pb
0.5 (BCC_upper) exhibited better results above 2750 nm compared to pure Pt. Pt
0.5Ta
0.5 (BCC_mix) was good at visible range, and Pt
0.5Ta
0.5 (BCC_upper) and Pt
0.5Ta
0.5 (BCC_flat) could be applied above 2700 and 2000 nm, respectively. Pt
0.5Ta
0.5 (BCC_mix) had a high
Q in the broad band of 600 to 1400 nm. Pt was found to be a good candidate for catalysis, as mentioned in the previous discussions. It was shown that some alloys possess better performances than pure Pt. According to our simulation results, the design of the material used in devices may be adjusted in different applications in consideration of the cost and the performance.
6. Discussions
Most of the cases exhibited fine performances as Q > 1 in the infrared frequency, which indicated the good applicability of most alloys. It was found that Q was approximated to be inversely proportional to the frequency in the infrared frequency region because it is dominated by the motion of free electron according to the Drude model, as the incident photon energy is low in the infrared region.
For the applications of magnetic plasmonics, the ferromagnetic metal Ni was alloyed with Au and Pt. Our calculated optical property of Au
0.75Ni
0.25 has the similar trend as compared to the experimental data by using dual magnetron sputtering to deposit the metallic alloy thin film from Mcpherson et al. [
44]. Lonergan et al. [
45] studied the effect of different ratios of Pt
xNi
(1−x) on benzene hydrogenation, and it was shown that Ni in alloy strengthens the bond formation which increases the activity of catalysts. The magnetic moments of Au
xNi
(1−x) and Pt
xNi
(1−x) alloy are listed in
Table 3. As the content of Ni increases, the magnetic moment rises. However, a trade-off between plasmonic properties and magnetic properties was observed, except that FCC Au
0.5Ni
0.5 exhibited better characteristics than pure Ni around 3000 to 4000 nm, which may indicate its potential as a magnetic plasmonic material.
It has been reported that PtMo is suitable for use in fuel cells due to its greater stability compared to that of pure Pt. Pt cathodes suffer from oxidation and a loss of active surface area. It was shown that the alloy cathode had a lighter material loss when CO was present in the fuel stream. The PtMo alloy nanoparticles were reported by Liu [
46], who successfully mitigated the contamination of the anode electrocatalysts. Ehteshami et al. [
47] also showed the identical trend that PtMo had a better performance than pure Pt. It is worth mentioning that PtNi has also been reported in the literature. It was shown that the bimetallic alloy is more stable than a monometallic material in some cases, making it more suitable for catalytic and thermal applications.
7. Optical Responses of Nanorods
To further investigate the optical responses of some practical nano objects, the electromagnetic fields of nanorods made of different materials were examined. In this part, we mainly focused on the effect of the material; therefore, the nanorods were simulated. The influence of the gaps between adjacent nanoraods or the density of nanorods was neglected.
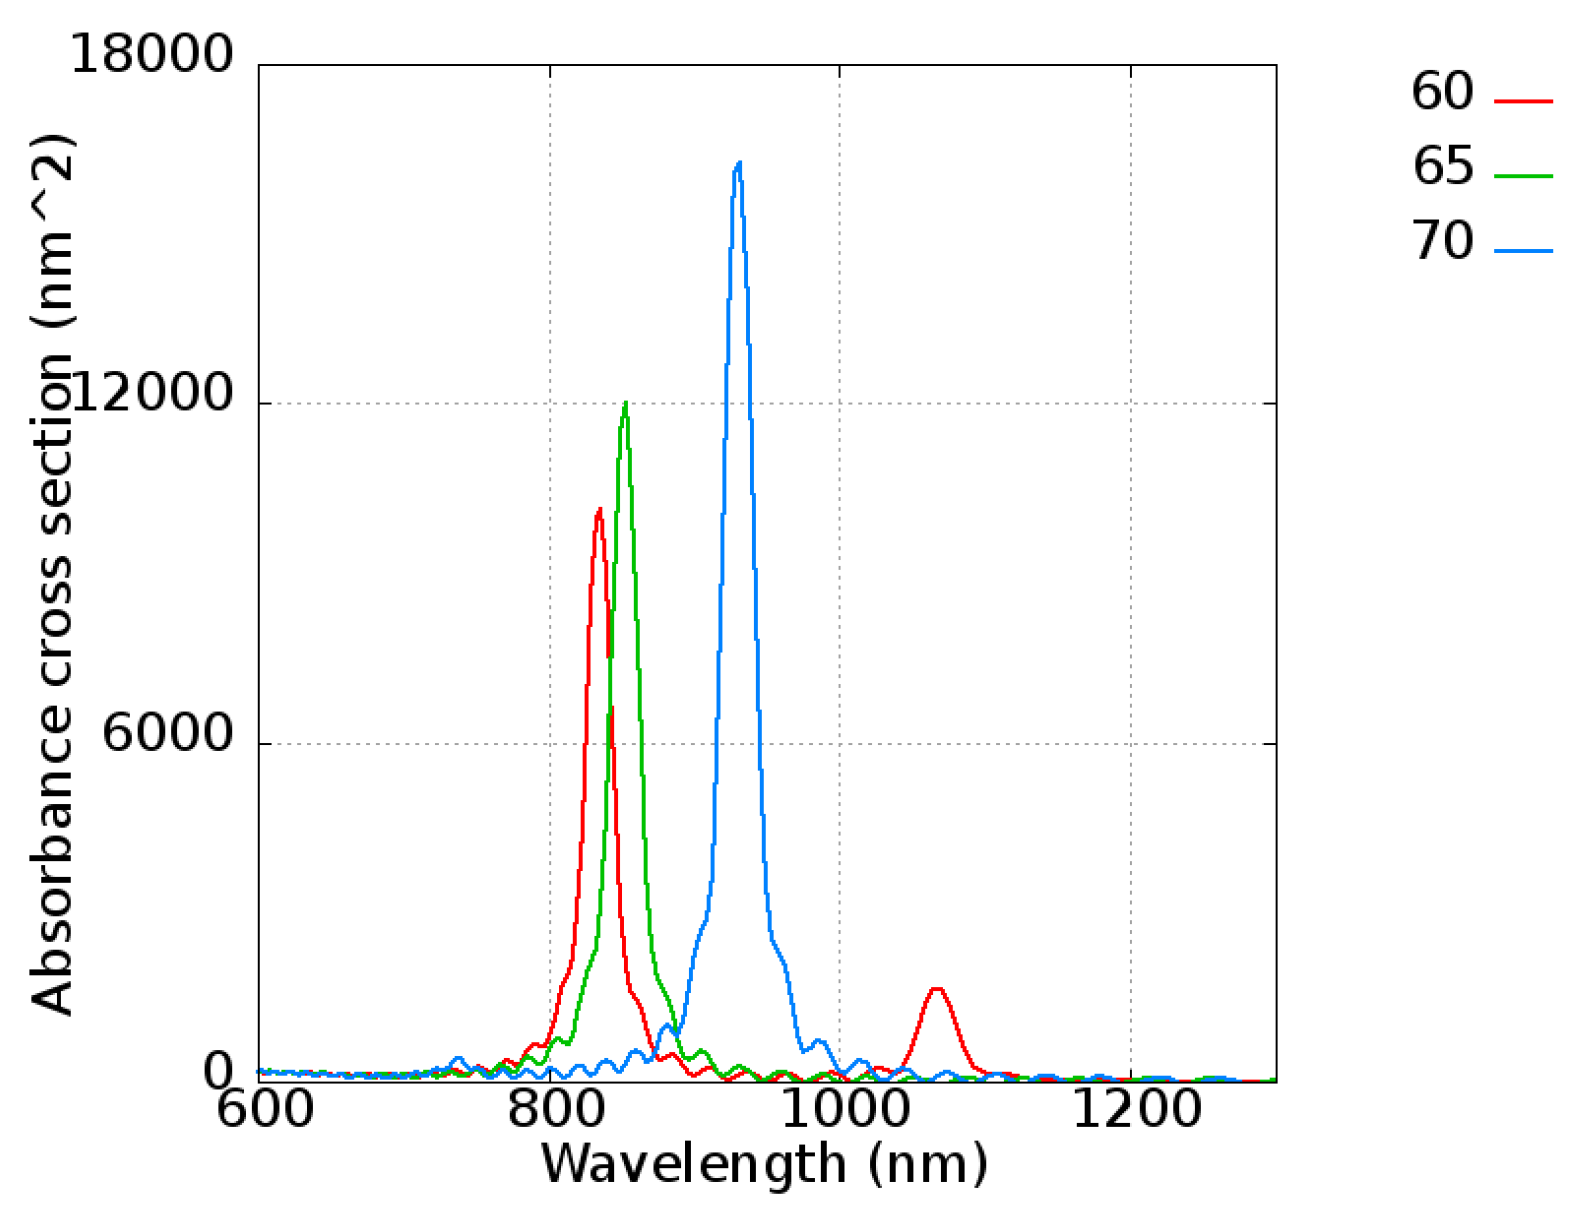
First, to confirm the results of FDTD with the experimental data from Takahashi et al. [
48], a gold nanorod with a length varying from 60 to 70 nm with an interval of 5 nm and a radius of 11 nm was simulated. The absorbance of gold nanorods is shown in
Figure 8, revealing peaks located at 830, 850, and 950 nm for nanorod lengths of 60, 65, and 70 nm, respectively. Because a single gold nanorod was considered in this simulation, the extreme narrow peak is shown, which is the ideal case of the pure gold nanorod. It is easy to explain that the broadened peak of the experimental data [
48] is simply due to the size distribution of the nanorods. On the other hand, the wavelength tunability is clearly shown, indicating that the absorbance peak increased as the nanorod length increased. The intensity was also strengthened with length, which give a quite intuitive explanation of absorbing more energy. The results were consistent with the experimental data [
48], showing an absorbance peak located at 800 to 1100 nm.
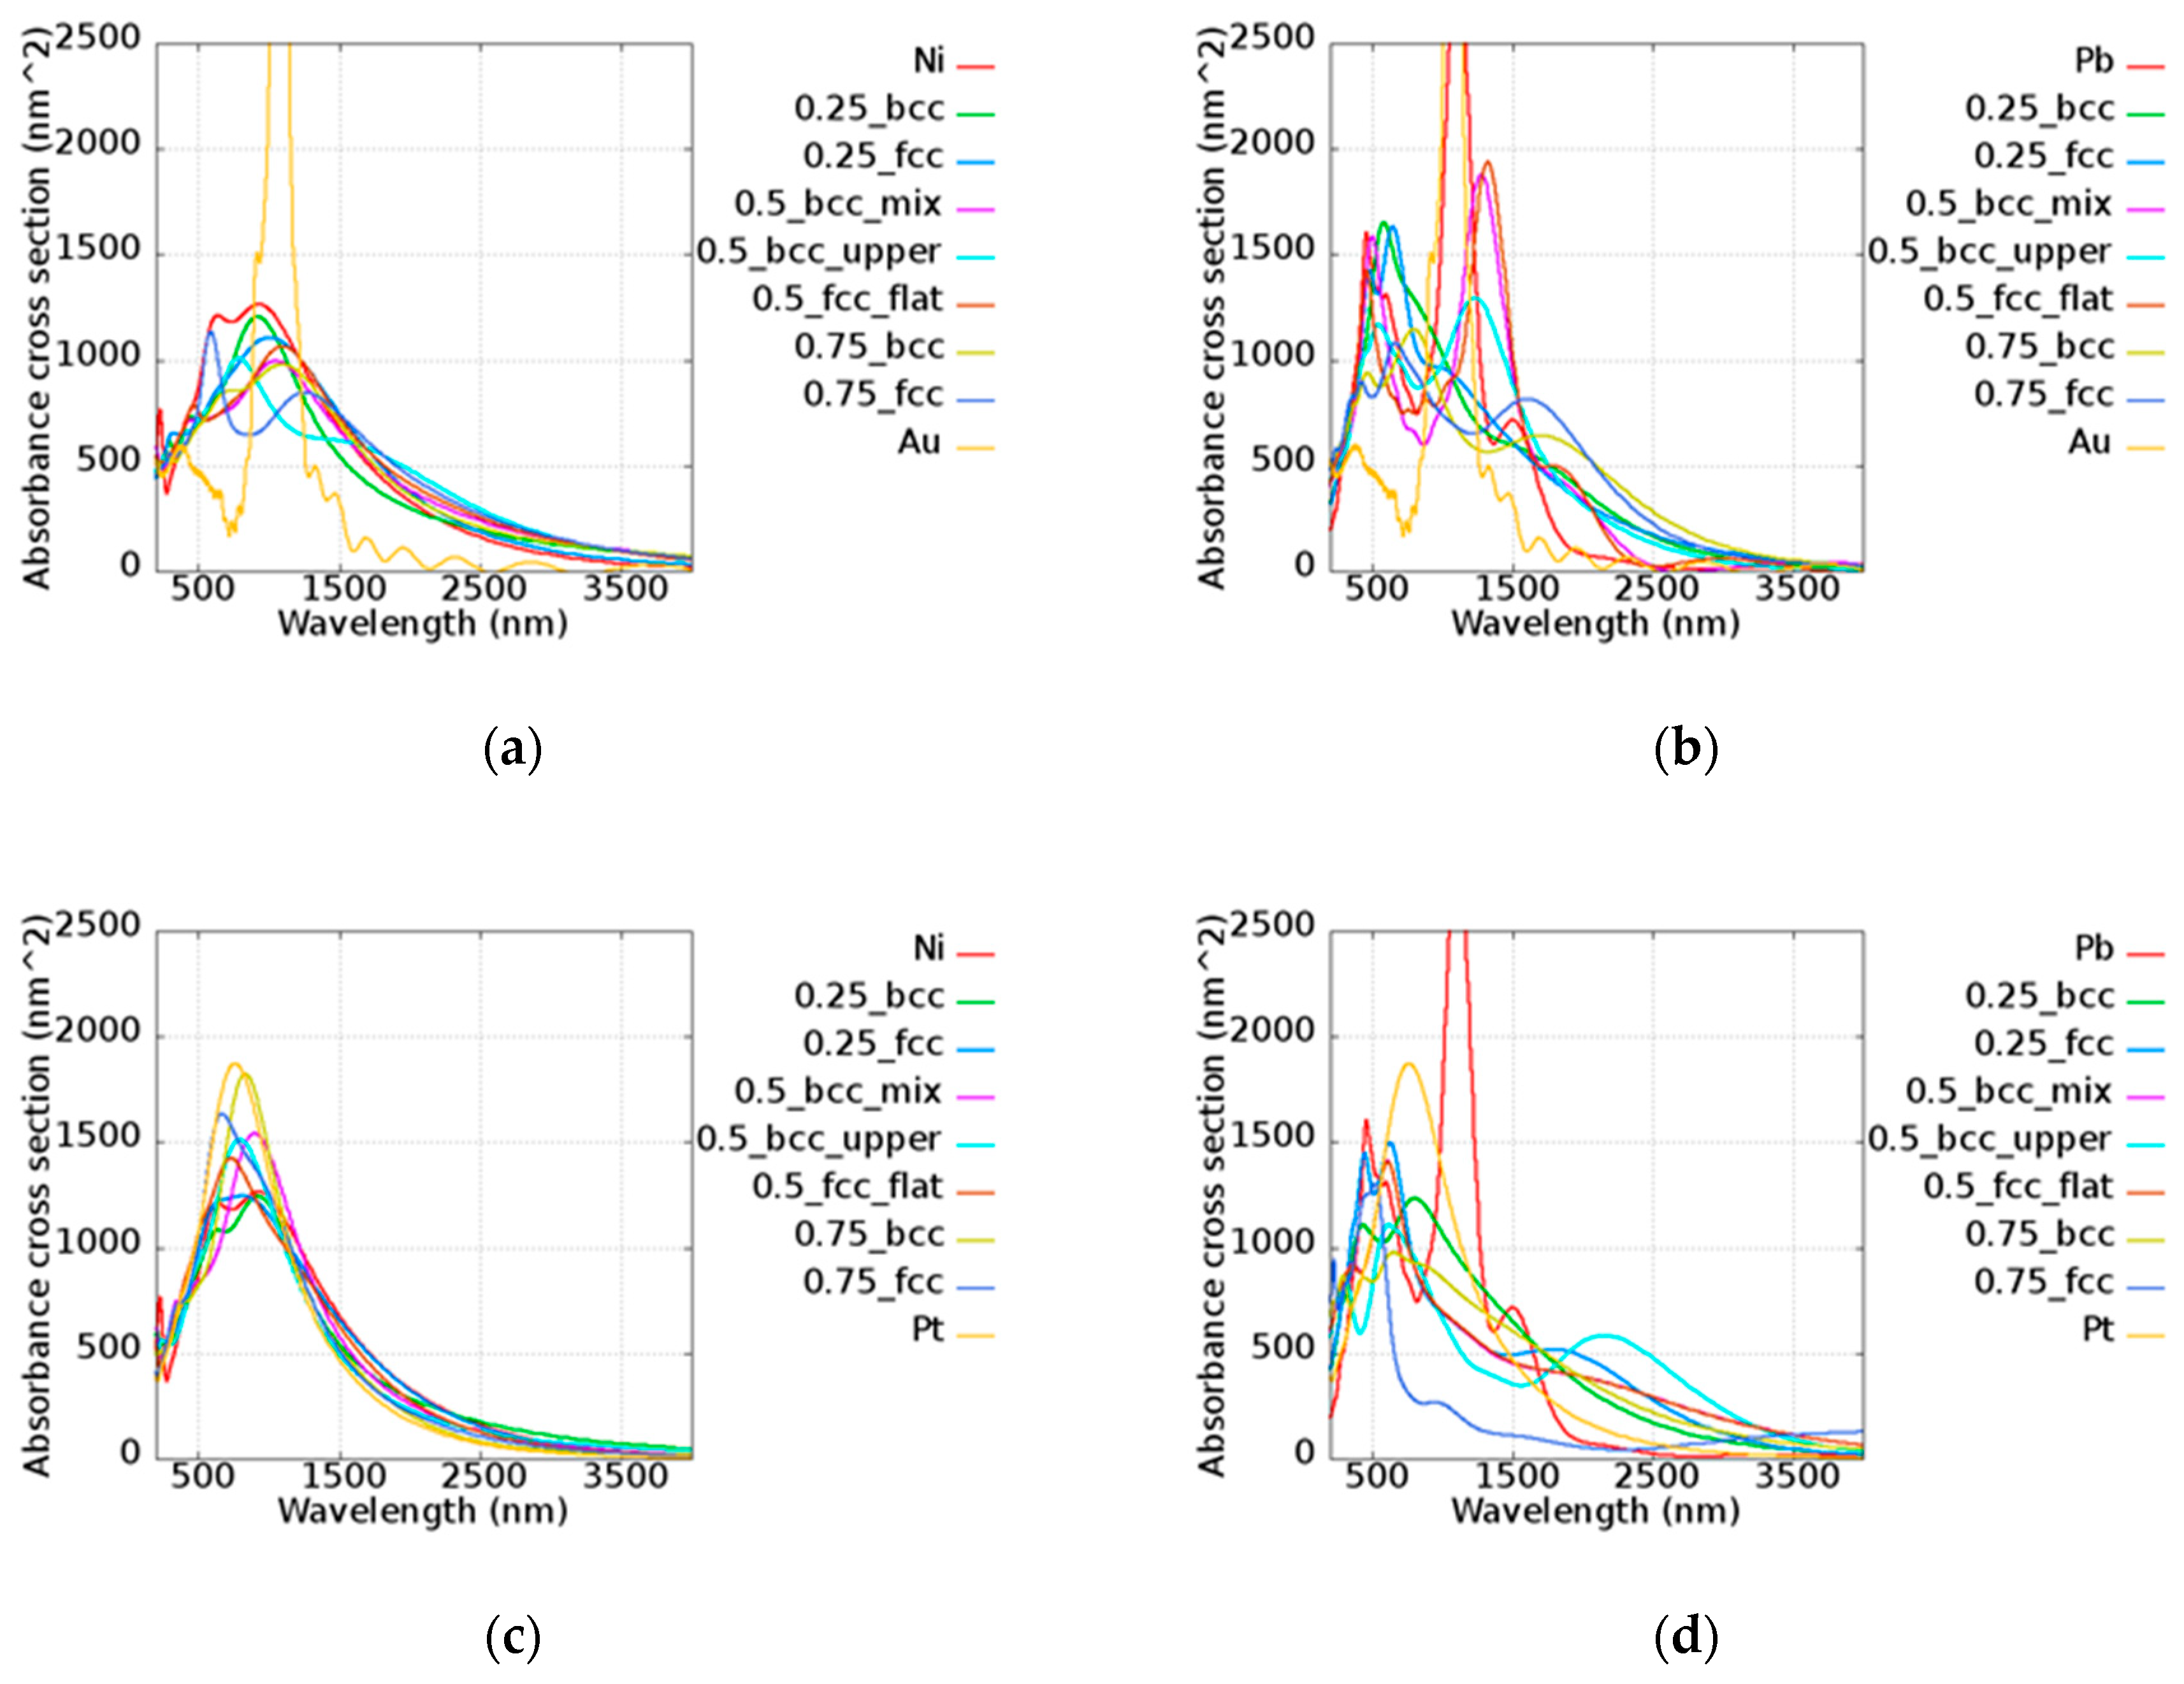
The simulated results of the alloy nanorods with a length of 100 nm and a diameter of 11 nm which have cross-section areas of approximately 1480 nm
2 are shown in
Figure 9, including AuNi, AuPb, PtNi, and PtPb. Combining the two materials, the trend of the absorbance cross-section was consistent with the
Q values. For example, in the AuPb case, the sequence of
Q intensity above 1000 nm was Au, Pb, Au
0.5Pb
0.5 (FCC_flat), and Au
0.5Pb
0.5(BCC_mix), etc. However, the nanorod peak absorbance was confined to a small region due to the structure effect of the nanorods. The extreme narrow peak of Au is shown, illustrating its high sensitivity. On the other hand, Pt had a strong absorbance in the visible and infrared light regions, Ni showed quite a broad band from 500 to 1300 nm, and Pb possessed two main peaks at around 490 and 1100 nm. The broad band absorbance of Ni and Pb contributed to the additional absorption in the alloy above 2000 nm compared to the pure metal, which may be applied in the lower energy region. In Au-based alloy nanorods, the better plasmonic performance of alloy was demonstrated compared to pure Au in the visible region. The other better performance was shown in the infrared region around 1300 to 1400 nm in all cases compared to Au. It is worth mentioning that the relative narrow bands of Au
0.5Pb
0.5 (FCC_flat), Au
0.5Pb
0.5 (FCC_upper), and Au
0.5Pb
0.5 (BCC_mix) were found and that all peaks were situated in a similar frequency This could reduce the difficulty in synthesis by allowing some ambiguity in stoichiometry. Peak shifting was shown in most cases except for PtIr and PtNi. Due to the analogous electromagnetic response of Pt, Ir, and Ni, the alloys of these metals maintain similar operation wavelengths of 700 to 1100 nm. These alloys can be well designed by tuning their structure parameters for suitable frequency. On the contrary, the wavelength selective absorbance is shown, which may be utilized for different applications in different operation frequency ranges.
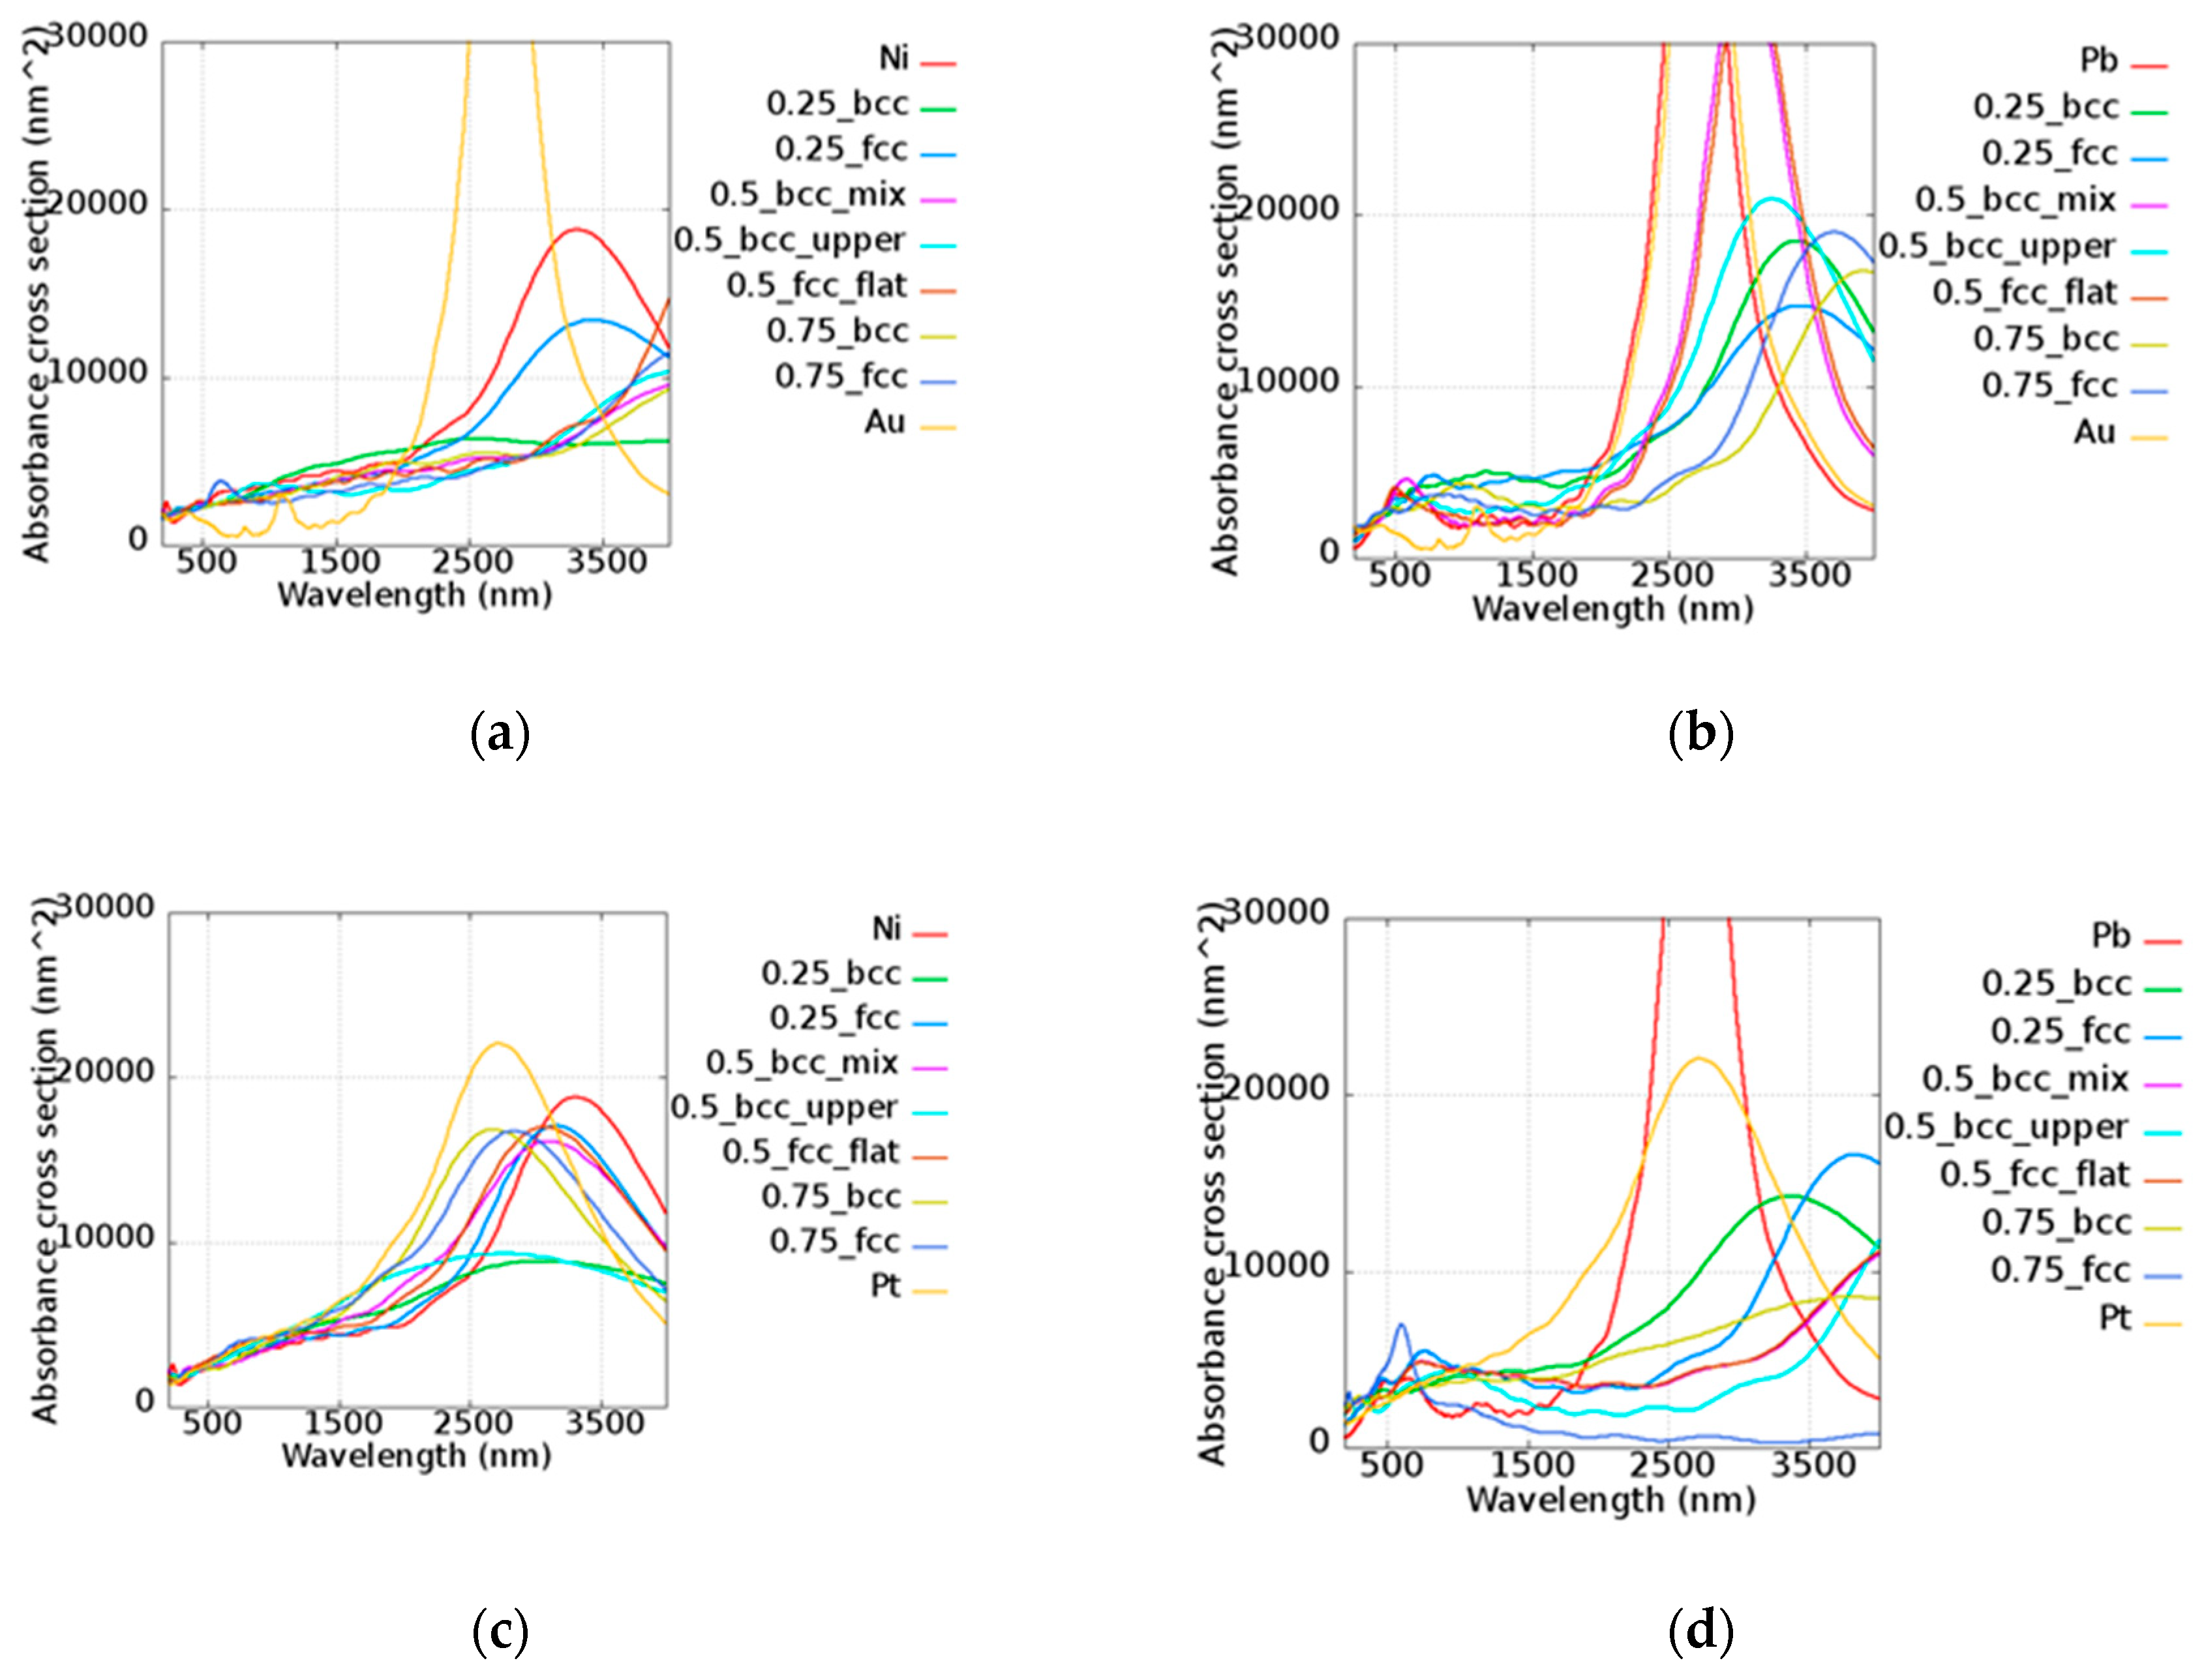
The tunable absorbances of nanorods were consisted with the aspect ratio, as demonstrated in many reports [
49,
50,
51]. The nanorod was lengthened to be 350 nm whereas the diameter was maintained at 11 nm. Upon increasing the aspect ratio to the value of 31.81, the absorbance cross-sections of AuNi, AuPb, PtNi, and PtPb varied, as shown in
Figure 10. The absorbance peak shifted to around 3000 nm. The absorbance cross-sections of all alloy nanorods possessed a much larger area than the area cross-sections of about 5329.34 nm
2 around the wavelength of 3000 nm. This indicates that these alloy nanorods are suitable for application in the infrared range. Effects of the wavelength tunability and associated amplification were found in different alloys. This illustrates that the compositions of two elements can be well adjusted to access different absorbance features.


