Article

(Bi,Sr) (Fe1−x,Mx)O3−δ (M = Co, Ni and Mn) Cathode Materials with Mixed Electro-Ionic Conductivity

Department of Materials Science and Engineering, National Taiwan University, Taipei 106, Taiwan
*
Author to whom correspondence should be addressed.
Materials 2016, 9(11), 922; https://doi.org/10.3390/ma9110922
Submission received: 20 June 2016 / Revised: 17 October 2016 / Accepted: 24 October 2016 / Published: 14 November 2016
(This article belongs to the Section Energy Materials)

Abstract

:
(Bi,Sr)FeO3−δ (BSF) cathode materials doped with either Co, Ni or Mn are synthesized by an ethylene diamine tetra-acetic acid (EDTA)-citrate complexing method, and the effects of the doping level on the mixed electronic-ionic conductivity at various temperatures are studied up to 800 °C. The phase purity and solid solution limit are investigated by X-ray diffraction (XRD). The ionic conductivity is measured by the four-probe direct current (DC) method, the valence state of Fe and Mn by X-ray photoelectron spectroscopy (XPS), and the oxygen non-stoichiometry by differential thermo-gravimetric analysis (TGA). The doped ferrites show interesting electronic conductivity dependent on the testing temperature, implying two conductive mechanisms, either controlled by double exchange at lower temperatures or small polaron (electron-oxygen vacancy) conduction at temperatures greater than 400 °C. The results of Co-doped BSF (S50C20) show the best mixed conductivity among the ferrites, and this is used to assemble cells. The cell with a S50C20 cathode in the region of 600–800 °C is improved by 15% in maximum power density greater than the cell with La0.6Sr0.4Co0.2Fe0.8O3−δ (LSCF) due to the balanced contribution from oxygen ions, vacancies and electrons.

1. Introduction

Solid oxide fuel cells (SOFCs) are power generation devices that directly convert fuels into electricity via electrochemical reactions through clean and highly efficient operations. To improve the reliability and stability of the cells, lowering the operating temperature to an intermediate-temperature range (below 800 °C) [1,2] is one of the main targets in the recent research efforts. These advantages of lower-temperature operation, including the ease of material selection, reduction in total cost and accelerating the start-up process, are generally recognized. At present, the operation of SOFCs at 650 °C to 800 °C is currently feasible for a SOFC using ultrathin yttria-doped zirconia [3]. However, a lower operating temperature results in sluggish oxygen reduction reaction (ORR) at the cathode and apparently increases the resistance of the electrolyte/cathode, potentially degrading the performance of SOFCs [4,5].
High performance cathodes based on La-perovskite (LaMO3) materials have been studied, and it was recently reported that cobalt-containing (La,Sr)CoO3 perovskites exhibit the best activity of electro-catalytic ORR at intermediate temperatures (600 °C–800 °C). Since cobalt is a good catalyst for reduction oxygen molecules to ions and flexible redox behavior via valence transition [4], the cobalt containing perovskites, e.g., La0.6Sr0.4Fe0.8Co0.2O3−δ (LSFC6482), have a good electronic conductivity, However, they have very low ionic conductivity and the high coefficient of thermal expansion (CTE) of the LSFC cathode mismatches to that of zirconia-based electrolyte, which is also unfavorable to thermal cycling of the cells [6,7,8,9,10]. Besides, an interfacial reaction might occur in various cathode/yttria-stabilized zirconia (YSZ) combinations. Amorphization of YSZ by the diffusion of the Mn from (La,Sr)MnO3−δ cathode [11], or the formation of a new Co-phase by (La,Sr)(Fe,Co)O3−δ [12] are reported in the literature.
A new cathode material based on (Bi,Sr)FeO3 (BSF) was synthesized and reported with interesting conductivity [13,14,15,16,17,18,19,20,21]. To enhance the conductivity and ORR capability, Co [18,21], Ca [19] and Mn [20] were doped in the BSF perovskite structure. Besides, a higher oxygen exchange rate of pore-free BSF was reported, even higher than that of (La,Sr)FeO3−δ. The literature [21] concludes that the BSF structure with large ionic sizes of Bi3+ and Sr2+ at A-site, and Fe3+ in B-site are basically performed favorable oxygen ion conductivity and matched CTE to the Y-doped ZrO2 electrolyte. The substitution of A and B sites in the perovskite structure also affect the oxygen stoichiometry. A controversial report on the low oxygen stoichiometry of (Bi,Sr)FeO3−δ varying over the range of 0 < δ < 0.016 [19] and δ = 0.23 [15], is noted in the literature. Besides, the measurement method of the ionic conductivity, i.e., electrochemical polarization by electric impedance spectroscopy (EIS), was used in many papers and might give over-promising conductivity values (1.4 × 10⁻²–2.6 × 10⁻¹ S·cm−1) of the BSF at 650 °C. The ionic conductivity of the ferrites with respect to oxygen deficiency needs careful verification.
A series of Sr-doped LaMnO3 cathode material likely enhances the electronic conductivity due to the charge exchange of SrLa and Mnn+ ions in the high-temperature conditions of the stoichiometry composition [11,22]. The possible reaction is shown as below:
Sr La + Mn 3 + Sr La 1 + Mn 4 +   or   Sr La + Mn 2 + Sr La 1 + Mn 3 +
This likely goes through the double-exchange of electrons between neighboring cations (M). In a more general form, the double-exchange conductive mechanism of moving electron between cations can also be shown as below when considering the presence of oxygen between the cations (M+):
M n + O 2 M ( n + 1 ) + M n + O 1 M n + M ( n + 1 ) + O 2 M n +
An additional possible conductive mechanism, small polaron, was proposed by Tuller and Nowick [23], which was mainly controlled by the existence of sufficient oxygen vacancy concentration, ≥1%. The association of electron with point defects, e.g., oxygen vacancies, inducing rapid transport of electron between the vacancies is generally accepted due to a weak polarization interaction, and is used in the interpretation of oxide conductivity at high temperature [24,25].
This study uses a molecular-scale synthesis method (termed the “EDTA-citrate method”) to fabricate homogeneous (Bi1−xSrx)(Fe1−yMy)O3−δ powders, and low temperature sintering to obtain various porous cathode materials. Therefore, we can understand the conductive mechanisms of the cathode materials. The electric conductivity, including ionic and electronic, will be measured by the two-probe and four-probe ionic DC method [26]. The mixed-ionic-electric (MIE) property of the doped ferrites is tailored in this study to optimize the electrochemical properties of the cathodes and used to improve the performance of made fuel cells.

2. Results

2.1. BSF with Co-Doping

Two series of the ferrite are reported in this section. Their abbreviations, sintering properties and other properties are reported in Table 1. The synthesized Sx-series and SxCy-series powders can be densified to a relative density better than 95% theoretical density (T.D.). Thermal expansion analysis was conducted from room temperature to 900 K (627 °C). The coefficient of thermal expansion (CTE) for Sx-series is in the range of 10 × 10−6–15.1 × 10⁻⁶ K−1, and 15.4 × 10⁻⁶–19.3 × 10⁻⁶ K−1 for co-doped SxCy series.
The X-ray diffraction (XRD) results of the powders with different SrO and CoO-doping contents calcined at 750 °C for 10 h are shown in Figure 1. Most of the BSFMx display a pure perovskite (a symmetry of Pm-3m), except the S10 sample, which shows a (110)c peak with a very minor (104)r intensity belonging to a rhombohedral structure in a symmetry of R3C. No other secondary phases are found over the composition range. The evidence reveals the substitution of Bi3+ by Sr2+ and Fe3+ by Co2+ are complete, resulting in the formation of an oxygen vacancy and multiple valence states at the Fe-site. These will be discussed in Section 3.
The ferrite samples were densified to a relative density better than 95.0% T.D. (Table 1), and then put to conductivity measurement. The total conductivities of Bi1−xSrxFeO3 and Bi0.5Sr0.5CoyFe1−yO3 are shown in Figure 2. The data depict that the electrical conductivity increases with increasing temperature. The S50 sample has the best electrical conductivity among the Sr-doped bismuth ferrites, reaching a maximum value of 1.5 S·cm−1 at 800 °C. In the S50Cy ferrites co-doped with cobalt, S50C20 shows the best electrical conductivity of 5.4 S·cm−1 at 800 °C.
The temperature dependence of the electric conductivity of the ferrites is noted changing at about 500 °C–527 °C, as shown by the dot curve in Figure 2a. The slopes of the best fitting lines are calculated to reveal the activation energy of the conductivity. The energies and transition temperatures of all SxCy are shown in Table 2. There are no such transitions in the S50C10 and S50C20 samples. The Ea(LT) of Sx samples is in the range of 0.4 eV to 0.7 eV, but Ea(HT) is in the range of 0.21 eV to 0.48 eV. The SrO-doped BSFs possibly act as a double exchange mechanism at a lower temperature range, and change to a vacancy control mechanism as the temperature goes higher than Ttr. For Co-doped cases, the electronic conduction in S50C10 and S50C20 still retains the double exchange mechanism up to 800 °C. Later, XPS/TGA results will be provided to discuss the possible conductive mechanisms.
Figure 2b shows the temperature dependence of the ionic conductivity of all SxCy ferrites. The ionic conductivity increases with testing temperature, and displays a single slope through the testing temperature range. The correspondent activation energies show a similar value of 1.24 ± 0.06 eV for all SxCy ferrites, lower than that of 1.32–1.34 eV for LSCF6428 [11]. In the series of Bi1−xSrxFeO3, the best ionic conductivity is 0.032 S·cm−1 among all samples at 800 °C which is apparently higher than that (2.2 × 10³–4 × 10⁻³ S·cm−1) of LSCF82xx at the same temperature [11].
The ionic conductivity and the CTE of SxCy shown in Table 1 and Figure 2b are plotted and compared with that of LSCF in Figure 3. The σi values of the Bi-based perovskites are in general greater than that of the La-perovskites. Besides, the Bi-ferrites show two-stage increment of ionic conductivity. The first is increased by Sr-doping, and the second is by additional Co-doping. Based on the CTE match to that of yttria-doped ZO2, three S30My series (M = Co, Ni and Mn) possibly showing a CTE of ca. 12 × 10−6 K−1 were selected for further investigation.

2.2. S30 with Co, Ni or Mn Doping

The solubility of Co, Ni and Mn performs differently in Bi0.7Sr0.3FeO3 (S30). A previous report by Chen [27] showed that only 4% of Co can form a solid solution in S30Cy ferrite as the Sr-content was reduced to 30% (i.e., S30C4). The same testing procedure of Ni and Mn was conducted and determined by XRD, as shown in Figure 4. After calcining at 900 °C, a secondary phase (the impurity phase) Bi2Fe4O9 was found in Ni-doped BSFs, i.e., S30N4 and S30N5, indicating that a 4 at % doping level of Ni was over the solubility limit of the S30Ny. Therefore, the maximum Ni soluble content in BSF was 3 at %. Similar to previous procedure, Mn was also doping in BSF, 50 at % Mn-doped S30 still appeared in a single perovskite phase (Figure 4b). The result is similar to that reported by Baek et al. [20].
The electrical conductivity of the S30My is shown in Figure 5. The samples were sintered at 1000 °C for 4 h, and achieved 92.5%, 91.6% and 95.1% relative density (R.D.) for S30, S30N3 and S30M50, respectively. The S30 data in the Figure appear to be well matched to that of the same composition reported by Niu et al. [15]. The electrical conductivity of their (Bi0.7Sr0.3)FeO3−δ at 800 °C was 1.2 S·cm−1, which was almost the same as our data.
All samples in Figure 5 showed a single perovskite phase. The conductivity of three doped S30 series displayed similar conductive behavior. The temperature dependence of the electric conductivity of all ferrites appeared two activation energy levels (Ea) either at low or high temperature separated by a transition temperature (Ttr), as summarized in Table 3. The samples had approximately two Ea(LT) values in the lower temperature region, either 0.55 ± 0.04 eV or 0.40 ± 0.03 eV (Table 3). The conduction behavior was possibly controlled by a double-exchange mechanism (Mn+-O2−M(n+1)+) along the Fe(M)O6 octahedral chains in the perovskite structure.
As the temperature increased to be greater than Ttr, the Ea(HT) either decreased to 0.25–0.36 eV or increased to 1.09 eV·mol−1. The Ea(HT) of three samples, S30, S30N3 and S30C4, at lower range possibly indicated that the oxygen site of the double-exchange mechanism replaced by the oxygen vacancy (M-VO-M), therefore, the other mechanism dominated. A small polaron ( e : V O 2 + ) offered conductivity through the exchange of electrons by the neighboring oxygen vacancies. On the other hand, the apparent increase in the conductivity of S30M10 and S30M50 at higher temperature was noted, showing the highest Ea(HT) among the Bi-ferrites. This might be caused by the multiple valence states of Mn and/or by the introduction of more oxygen vacancies than BSF and BSFN03. The evidence from the XPA and TGA results in the following Section 2.3 and Section 2.4 being presented to support the interpretations.

2.3. Valence State Analysis

To investigate the effects of different Ar+ sputtering periods (0–180 s) on the valence states of Fe in S30 were first investigated and the spectra are shown in Figure A1. The binding energy of Fe on the B-site of perovskite and the double perovskite structure have been reported and summarized in previous references [28,29,30,31,32]. Eb of Fe3+ 2p3/2 was around 709.5 eV–710.2 eV, while the Eb of Fe4+ 2p3/2 was from 711.2 eV to 712.8 eV. The peak in Figure A1 appearing at 709 eV–713 eV contained more than one emission, indicating the possible co-existence of Fe3+ and Fe4+. No Fe2+ signals in the range of 708.8–710.8 eV were indexed [33].
Note that the Fe 2p3/2 peak was significantly shifting to a lower binding energy after sputtering for 180 s. According to the report [34], both Fe3O4 and FexO samples of newly made and stabilized in air were covered with a thin layer of Fe2O3, The Ar+ bombardment could remove the covered oxide layer in 5 s and reveal the original states within the samples. Similarly, when the samples were exposed to air, the proportion of oxygen states changed, as shown in Figure A2. According to the electric neutrality, the valence state of Fe would increase. Thus, a part of Fe3+ on BSF surface would oxidize to Fe4+. After slightly sputtering for 5 s at an acceleration voltage of 3 keV, the oxidized layer on BSF surface was removed.
In this study, the samples showed similar Fe 2p3/2 spectra after etching for 5 s, 20 s and even for as long as 80 s. For a longer period than or equal to 180 s, the Fe 2p3/2 peak shifted to a lower binding energy and the spectra indicated a reduction of Fe4+ to Fe3+. Thus, it is concluded that a limited sputtering (3 keV for 5 s) can remove the surface oxide layer on the BSF surface. Therefore, all samples in the following XPS study will go through sputtering for 5 s before the analysis.
Figure 6a shows the XPS spectra of Fe 2p3/2 of the polished surfaces of three samples, S30, S30M50 and S30C4, after Ar+ etching for 5 s. the content of Fe4+ of these are 19.8%, 47.3% and 23.8%. The average valence state of Fe by calculation is 3.20, 3.47 and 3.42, respectively. Co and Mn doping all increase the Fe4+ content in the doped S30 samples.
The XPS spectra of Mn 2p of the polished BSFMn0.5 surface following Ar+ etching for 5 s are shown in Figure 6b. Mn2+, Mn3+ and Mn4+ were indexed in the spectrum of BSFMn0.5. The average valence state of Mn ions in BSFMn0.5 is 2.65. These results are similar to the work reported by Chuang et al. [35] and the presence of Mn2+ increased the oxygen vacancy concentration. As the valence state of Bi and Sr in A-site are constant, i.e., trivalent and divalent, respectively, the oxygen non-stoichiometry is mainly controlled by the valence state of the cations in the B-site. Thus, the oxygen stoichiometry of the S30, S30M50 and S30C4 equilibrium in the atmosphere and at room temperature are 2.95, 2.88, and 2.97, respectively. The S30M50 shows the greatest non-stoichiometry (Δδ = 0.12) of oxygen among the samples at room temperature.
The oxygen non-stoichiometry (Δδ) of the sample while undergoing the thermo-gravimetric analysis (TGA) test to high temperature was calculated from the mass loss, as shown below:
Δ δ =   M s m s M O Δ m
where Ms is the molar mass of the stoichiometric oxide (g·mol−1) of BSFMx, ms is the sample mass of the stoichiometric oxide of BSFMx, and MO is the molar mass of oxygen (g·mol−1), and Δm is the measured mass loss in the sample. We assume that the sample will not lose any of the cations (not vaporizing), but the oxygen may release and create a new oxygen vacancy when it is heated to 800 °C. The TGA curves of S30, S30C4 and S30M50 are shown in Figure 7. The oxygen losses from room temperature to 800 °C are 0.13%, 0.13% and 0.20%, respectively, and their correspondent Δδ from room temperature to 800 °C are 0.022, 0.022 and 0.034. Besides, the loss (as the details shown in Figure A3) was nearly complete when the temperature was greater than 400 °C. S30M50 produced a greater oxygen vacancy than S30 and S30C4 at high temperatures (400–800 °C).
Table 4 summarizes the TGA results of S30, S30C4, S30M50 and LSCF6428. Clearly, LSCF6428 experienced much greater mass loss, implying the LSCF6428 generated greater oxygen vacancy. The ionic conductivity of LSCF6428 (ca. 1.0–1 × 10⁻² S·cm−1 at 800 °C) [26,36] is higher than that (4 × 10⁻³ S·cm−1 at 800 °C) of the S30. Therefore, S50C20 was selected as the cathode to assemble SOFCs, and compared to the results from LSCF6428.

2.4. Performance of Cells

Standard half cells Ni+8YSZ/8YSZ/20SDC with different cathodes were made for comparison. One cell consisted of a porous cathode layer of 7–15 µm, a porous 5 µm SDC layer as a barrier, and a dense 15 µm electrolyte layer closely sintered on a 300 µm anode. The cathode was either made by S50C20, or LSCF6428 for comparison. The interfaces between the layers were intact. No cracks were observed.
Figure 8 is the output voltage, current density and power density of the cells. The open circuit voltage (OCV) of the made cells show a value close to 1.1 V, implying the electrolyte is leakage-free. The maximal power density of the cells is 353 mW·cm−2 and 406 mW·cm−2, respectively, at 800 °C. The power density of the cell with S50C20 cathode is 15% higher than that of the cell consisting of LSCF.

3. Discussion

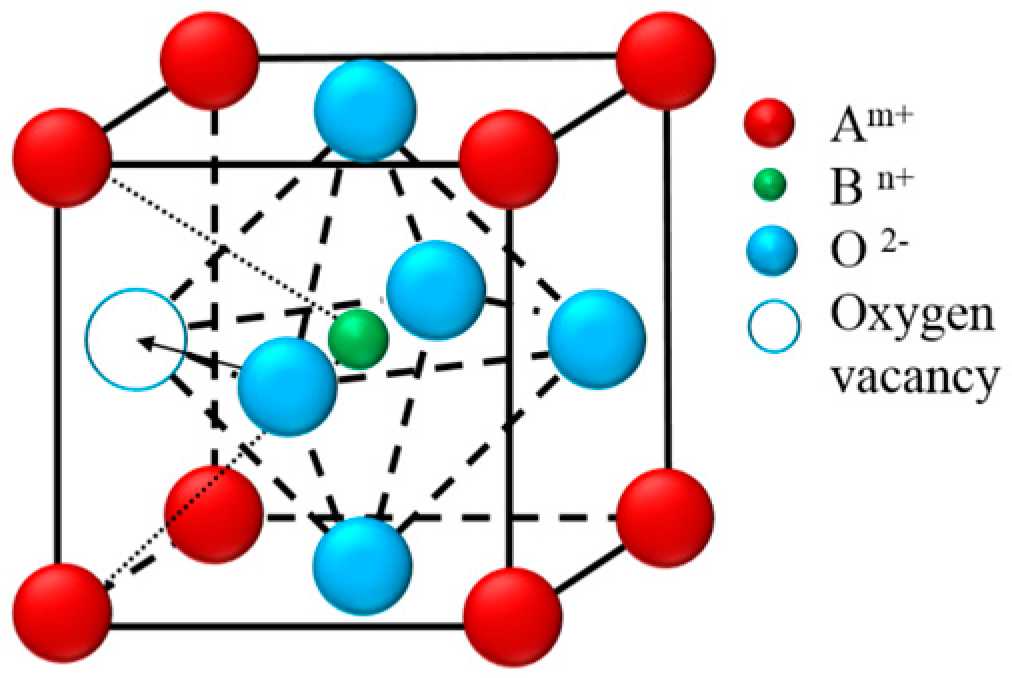
A substitution of trivalent cation (e.g., Bi3+) on the A-site of perovskite by divalent cation (e.g., Sr2+) induces two possible reactions in the materials. One is the increase in the valence state of B-site cations, and the other is the formation of oxygen vacancy. If the B-site cations are transition metals (M), the change in valence state creates Mn+/M(n+1)+ couples, which act as the hopping sites for electrons via neighboring oxygen, as shown in Equation (2). A three-dimensional MO6 octahedral network [36] in the perovskite structure acts as the double exchange media and induces electronic conduction, causing valence exchange along the MO6 octahedron, as shown in Equation (2) [
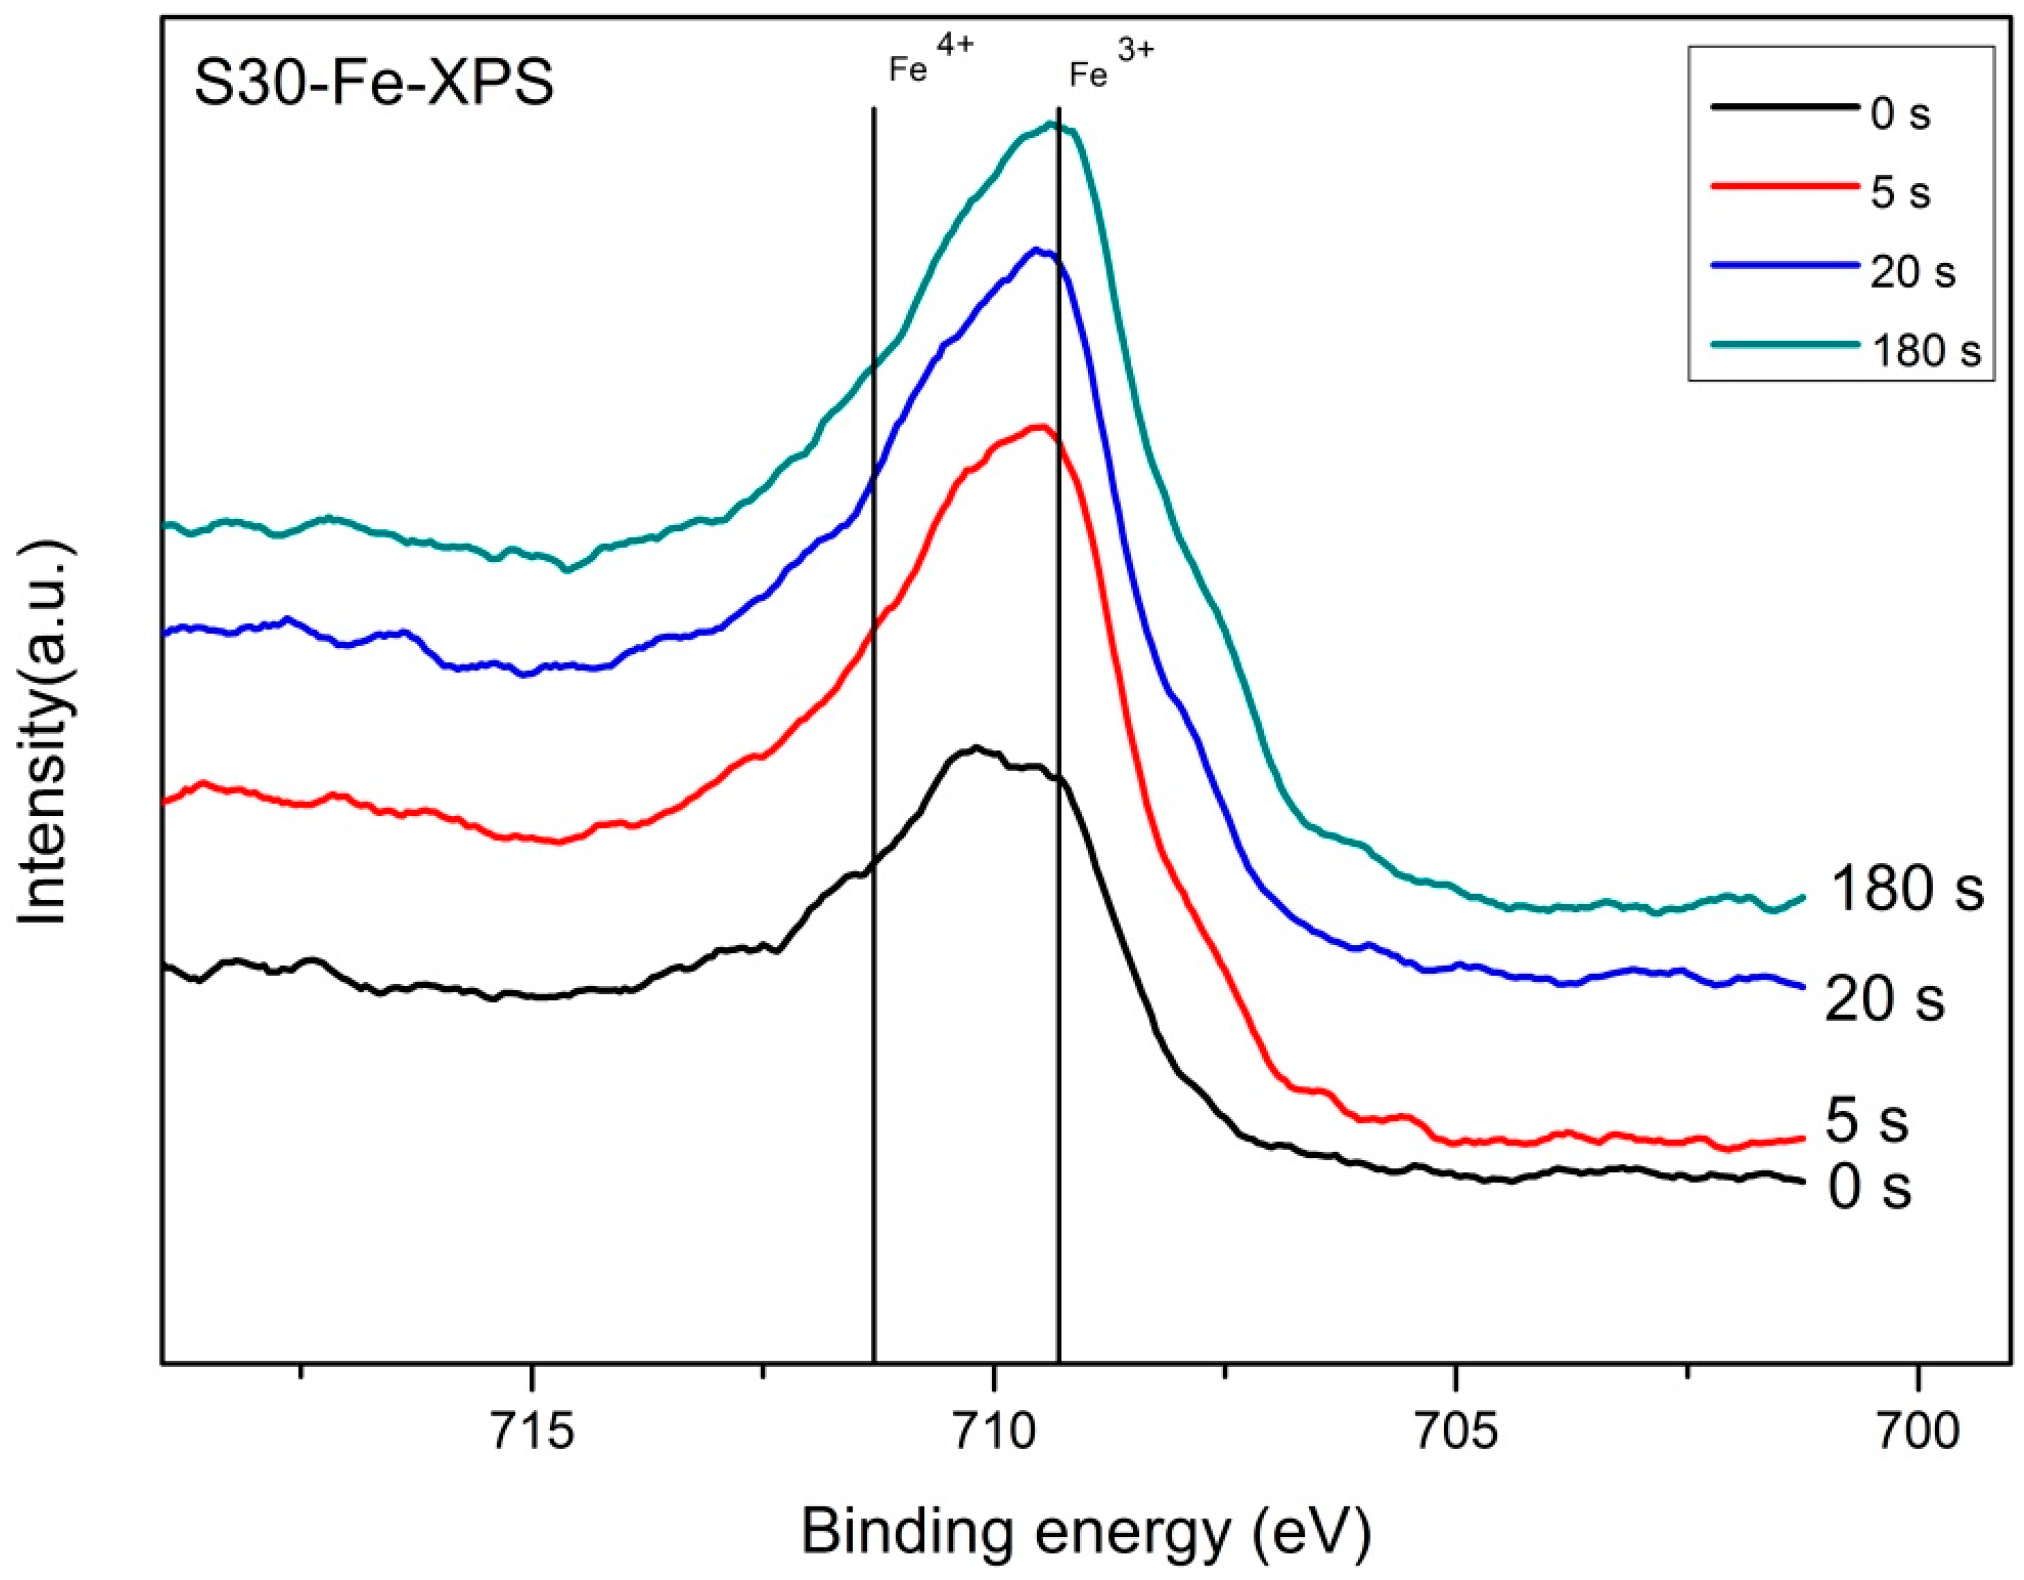
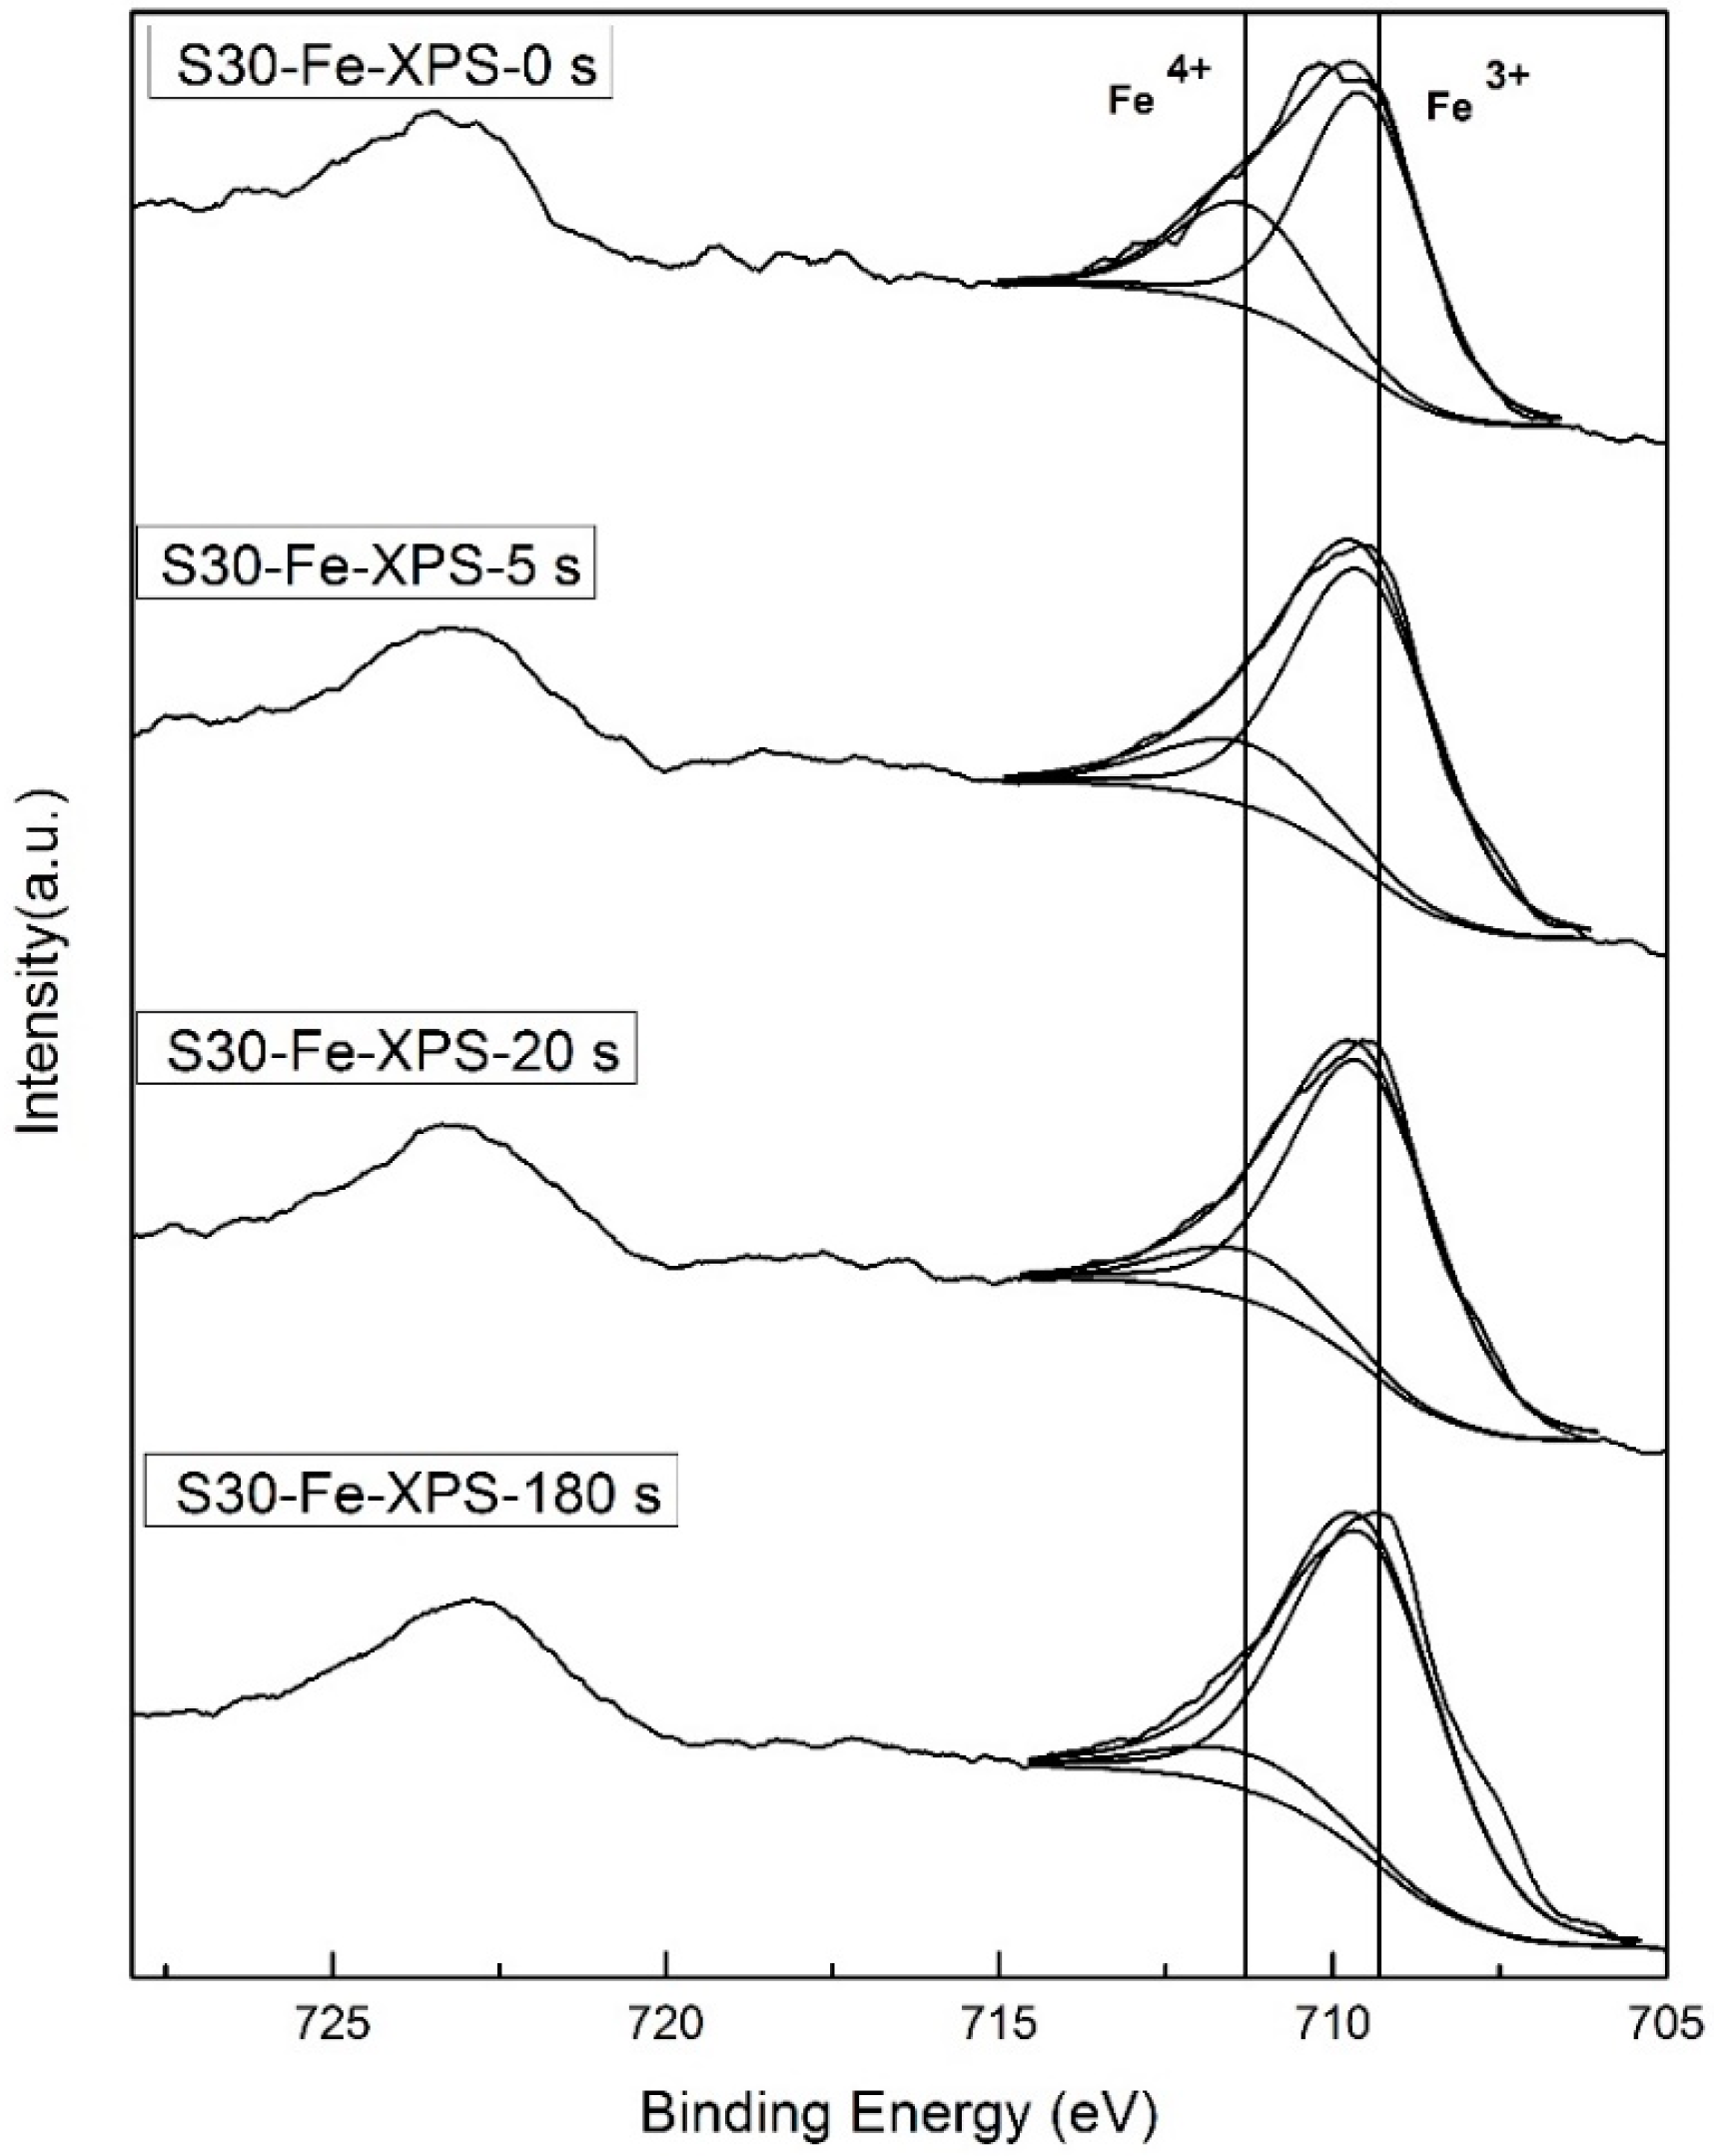
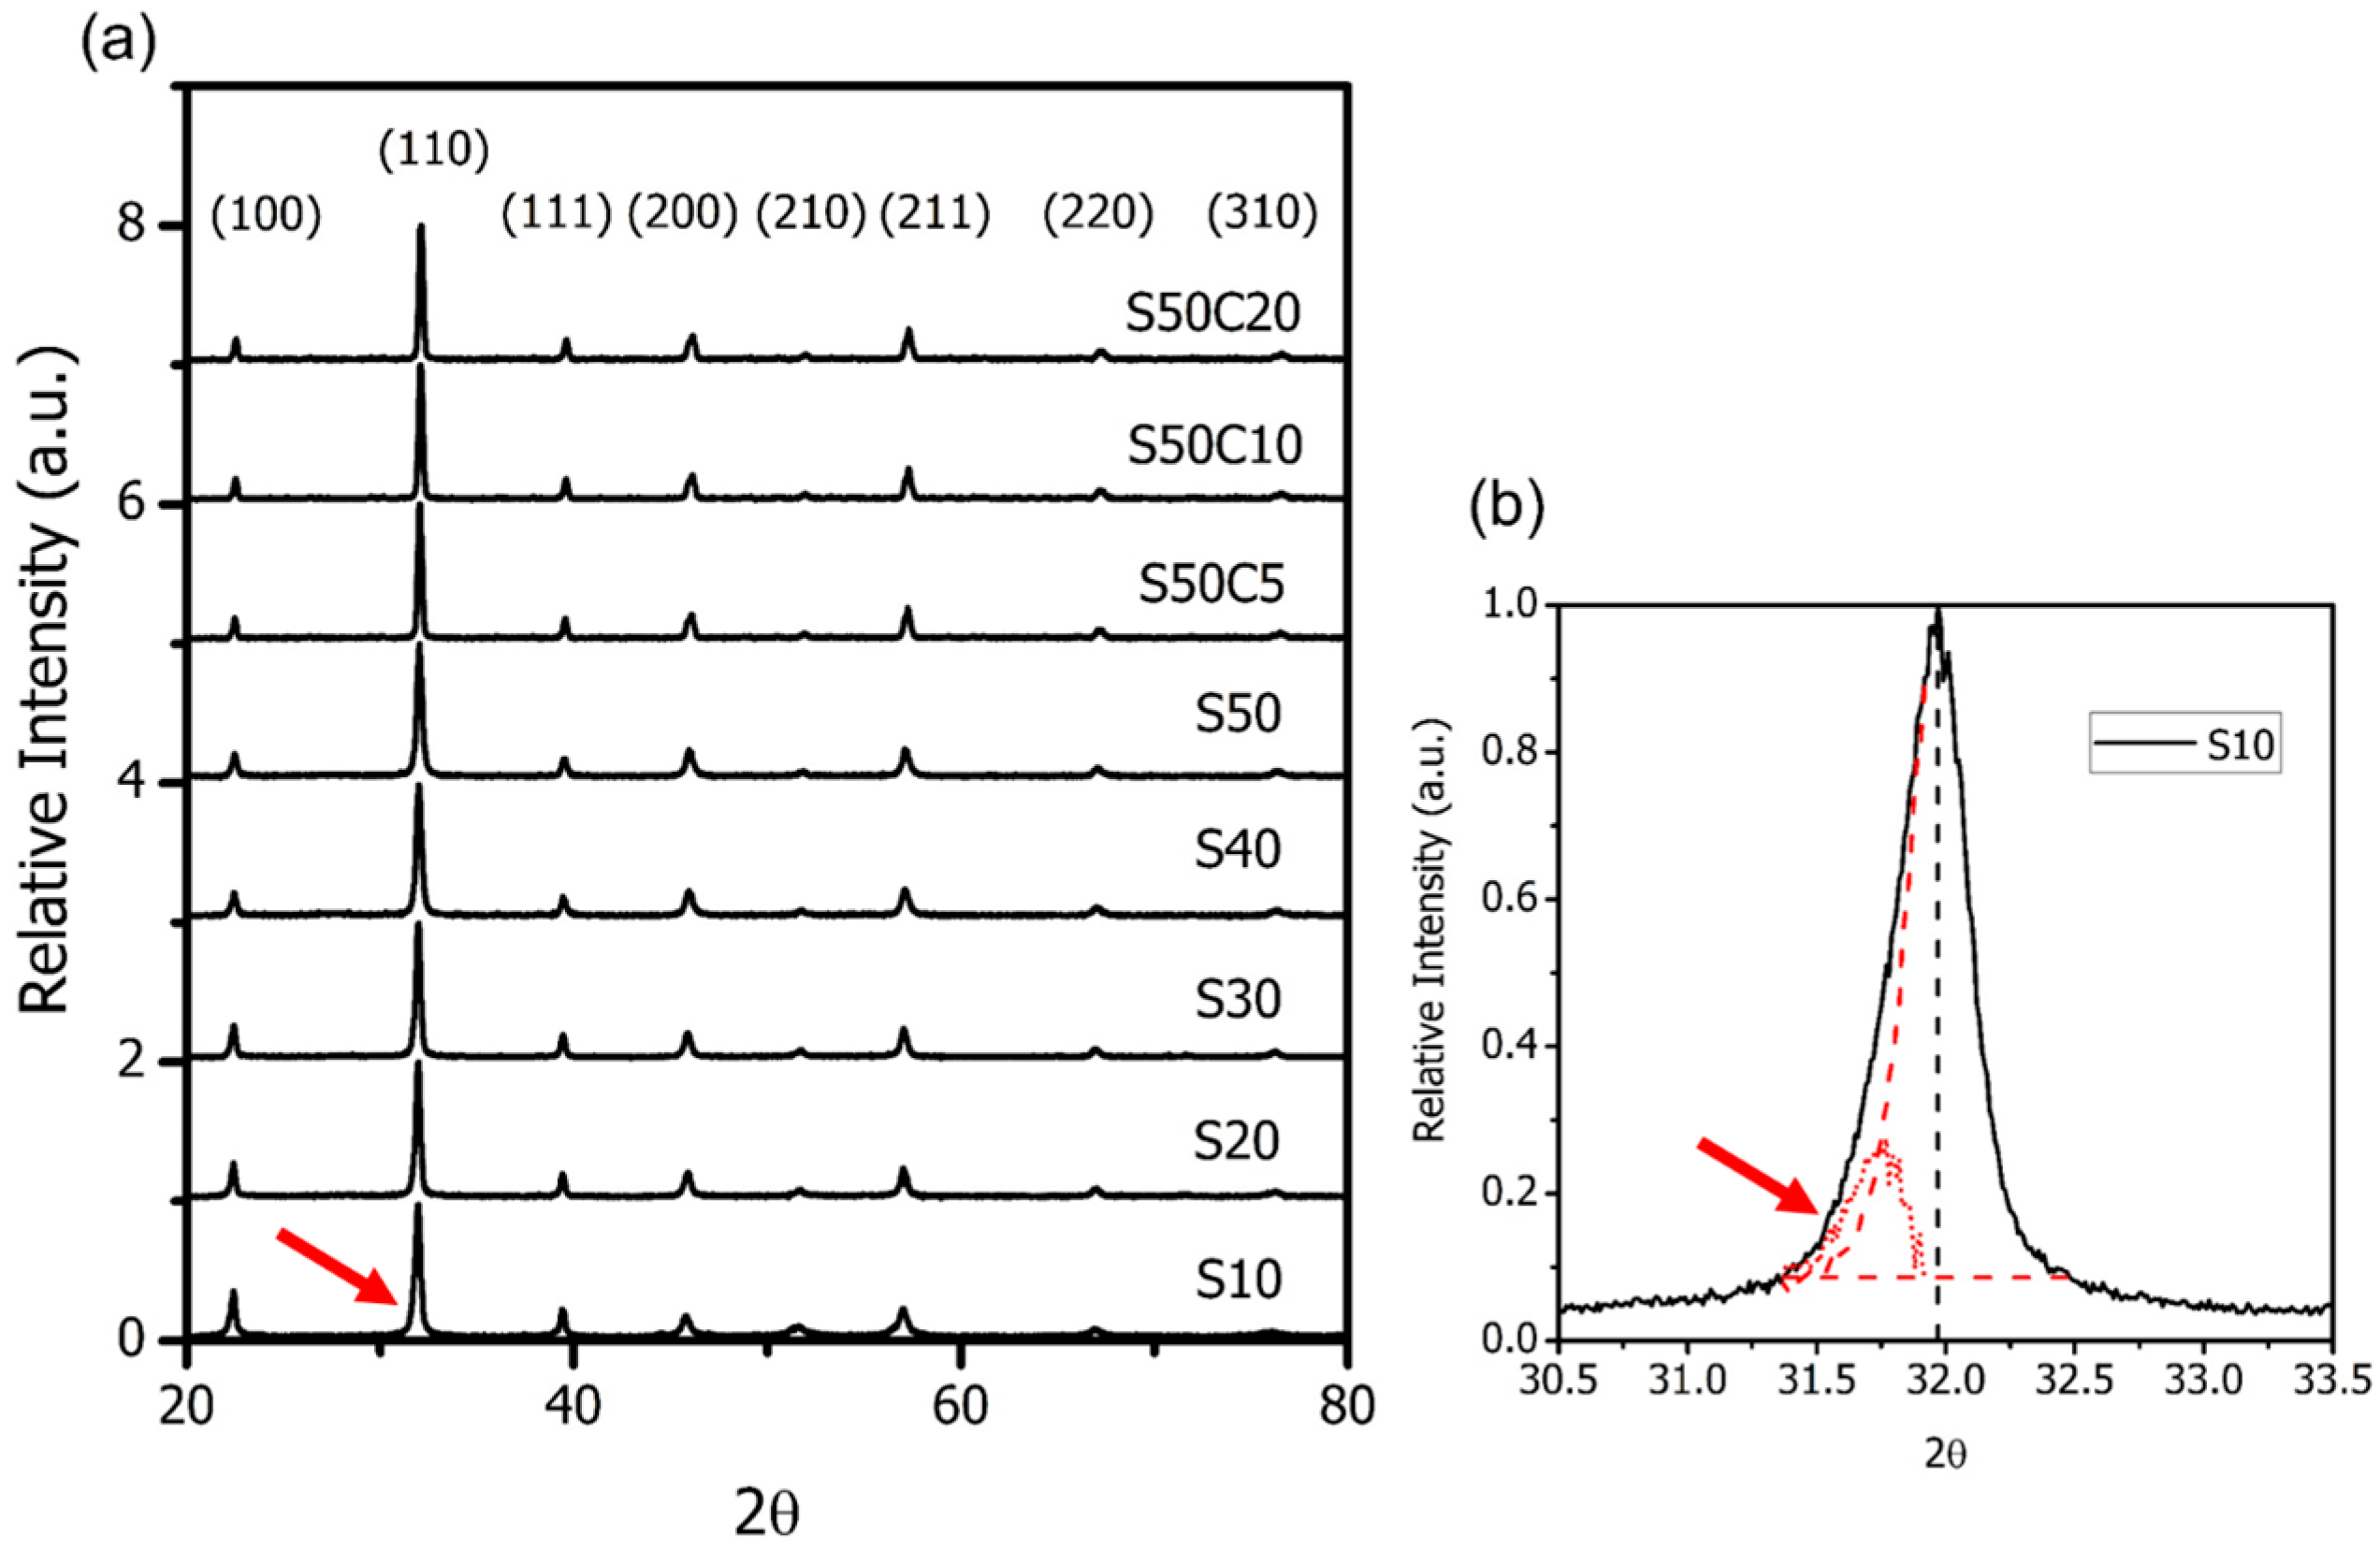
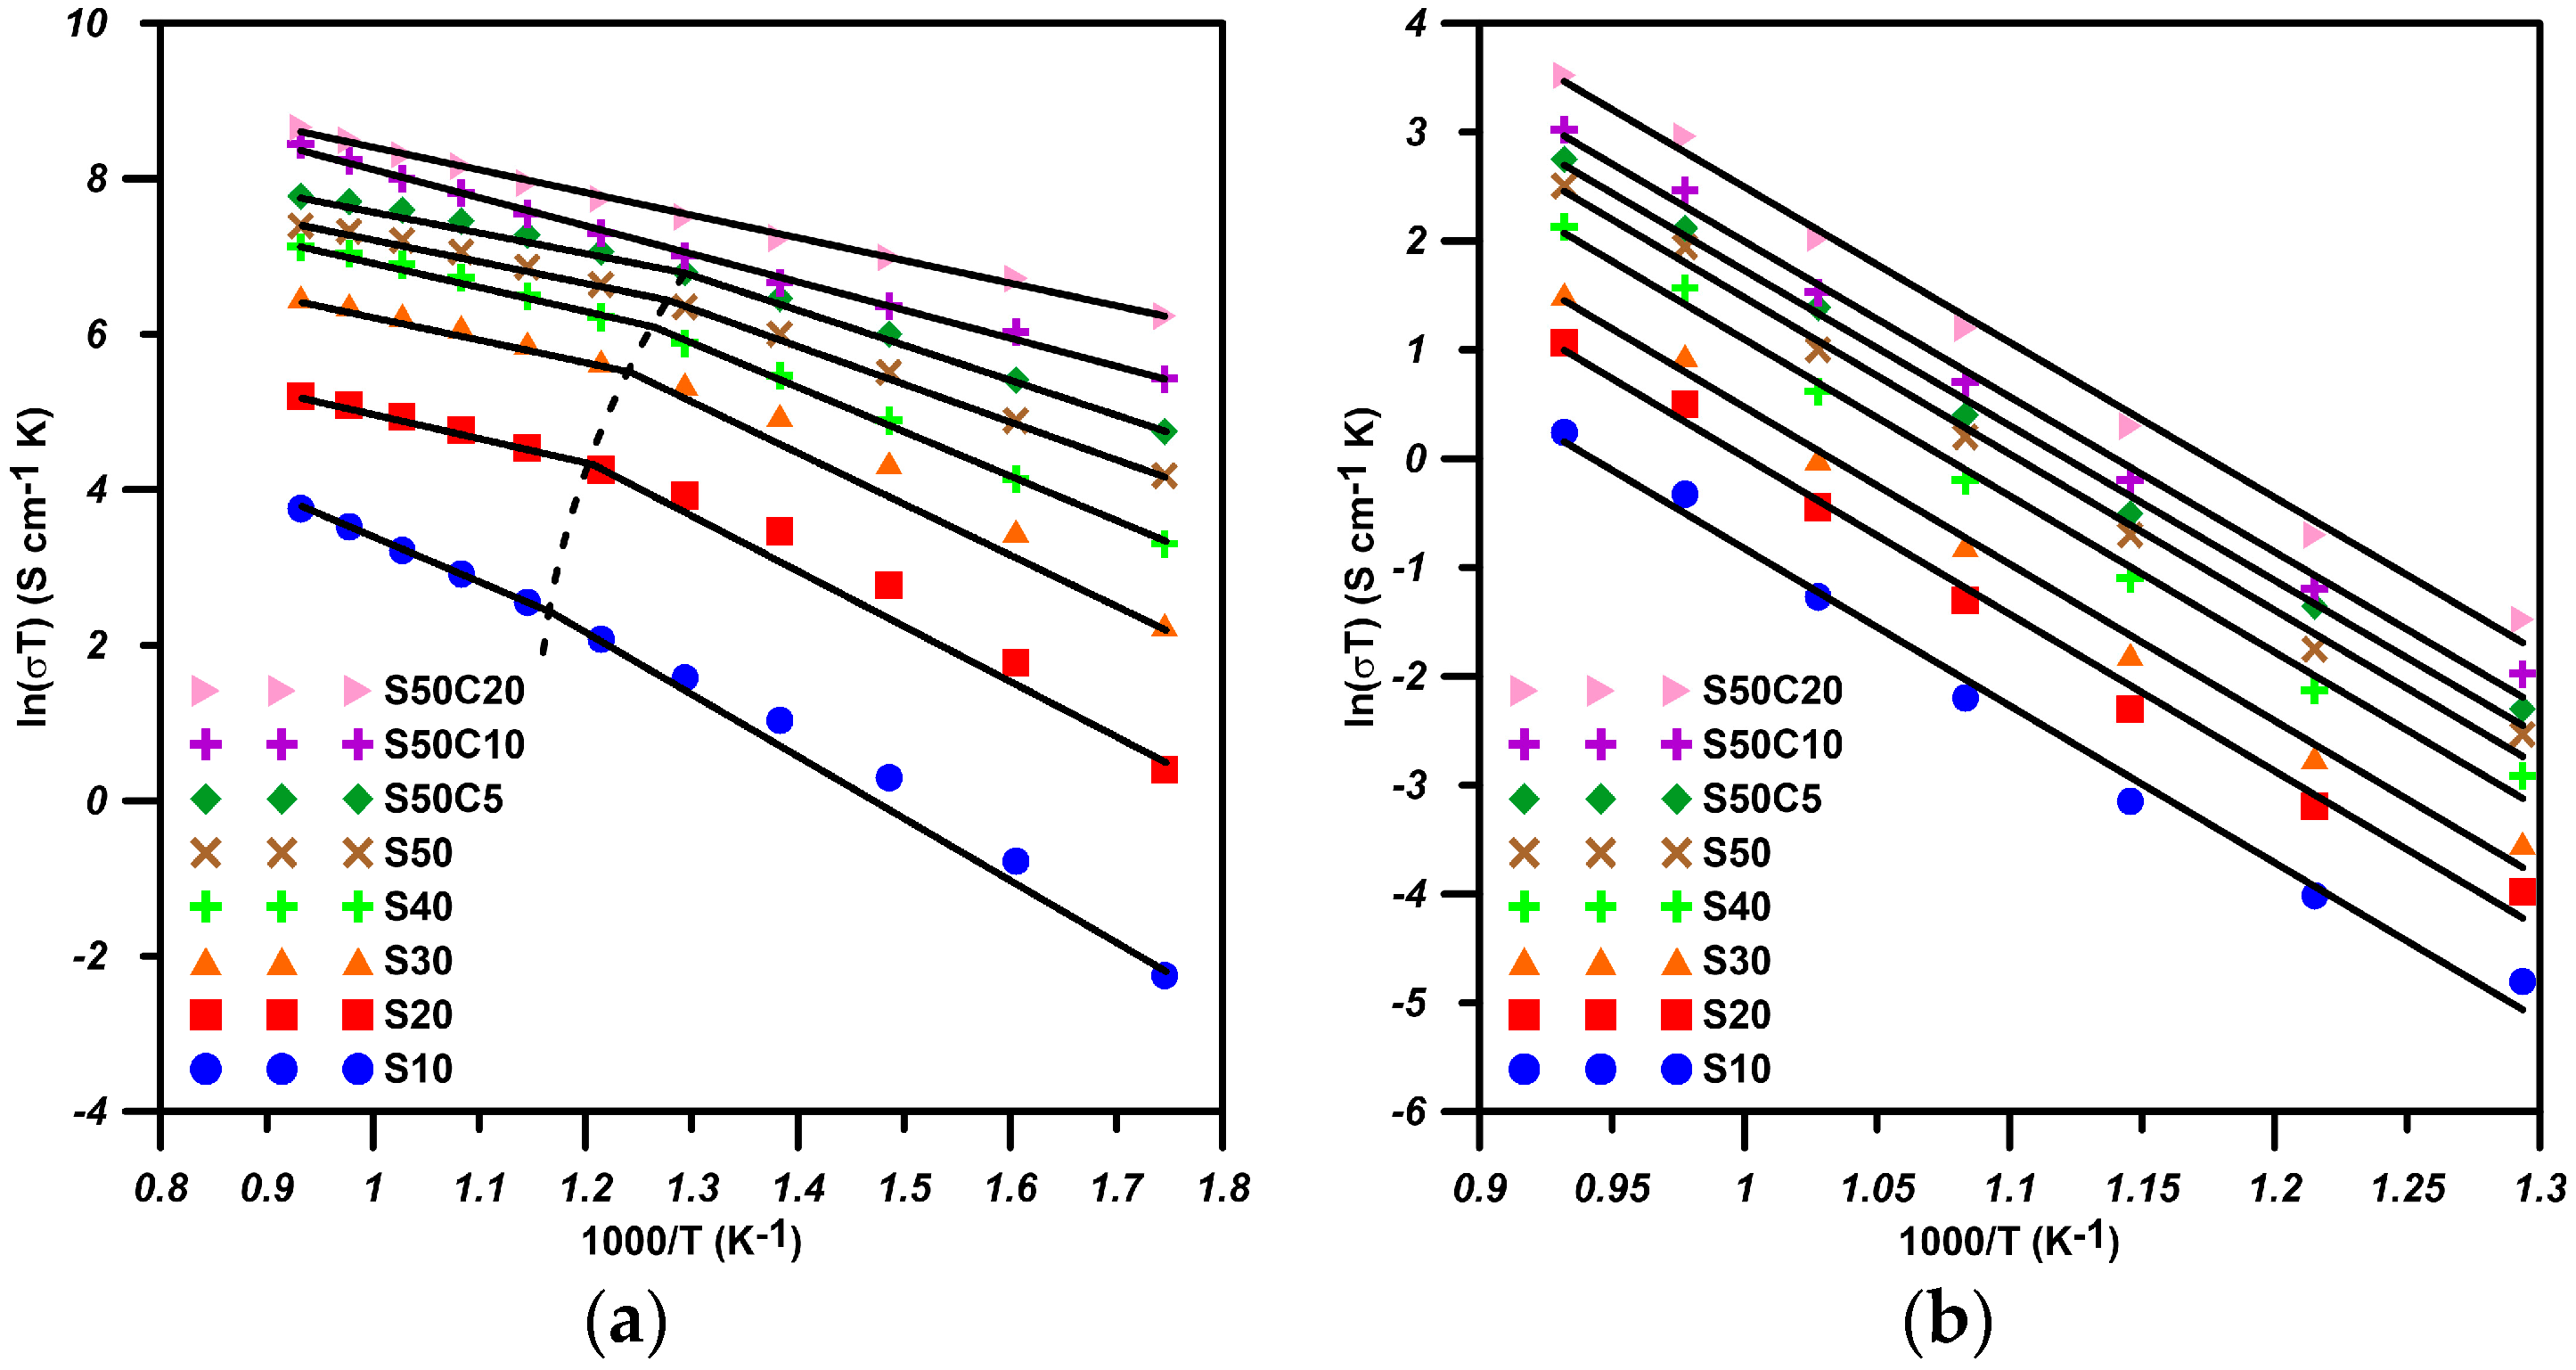
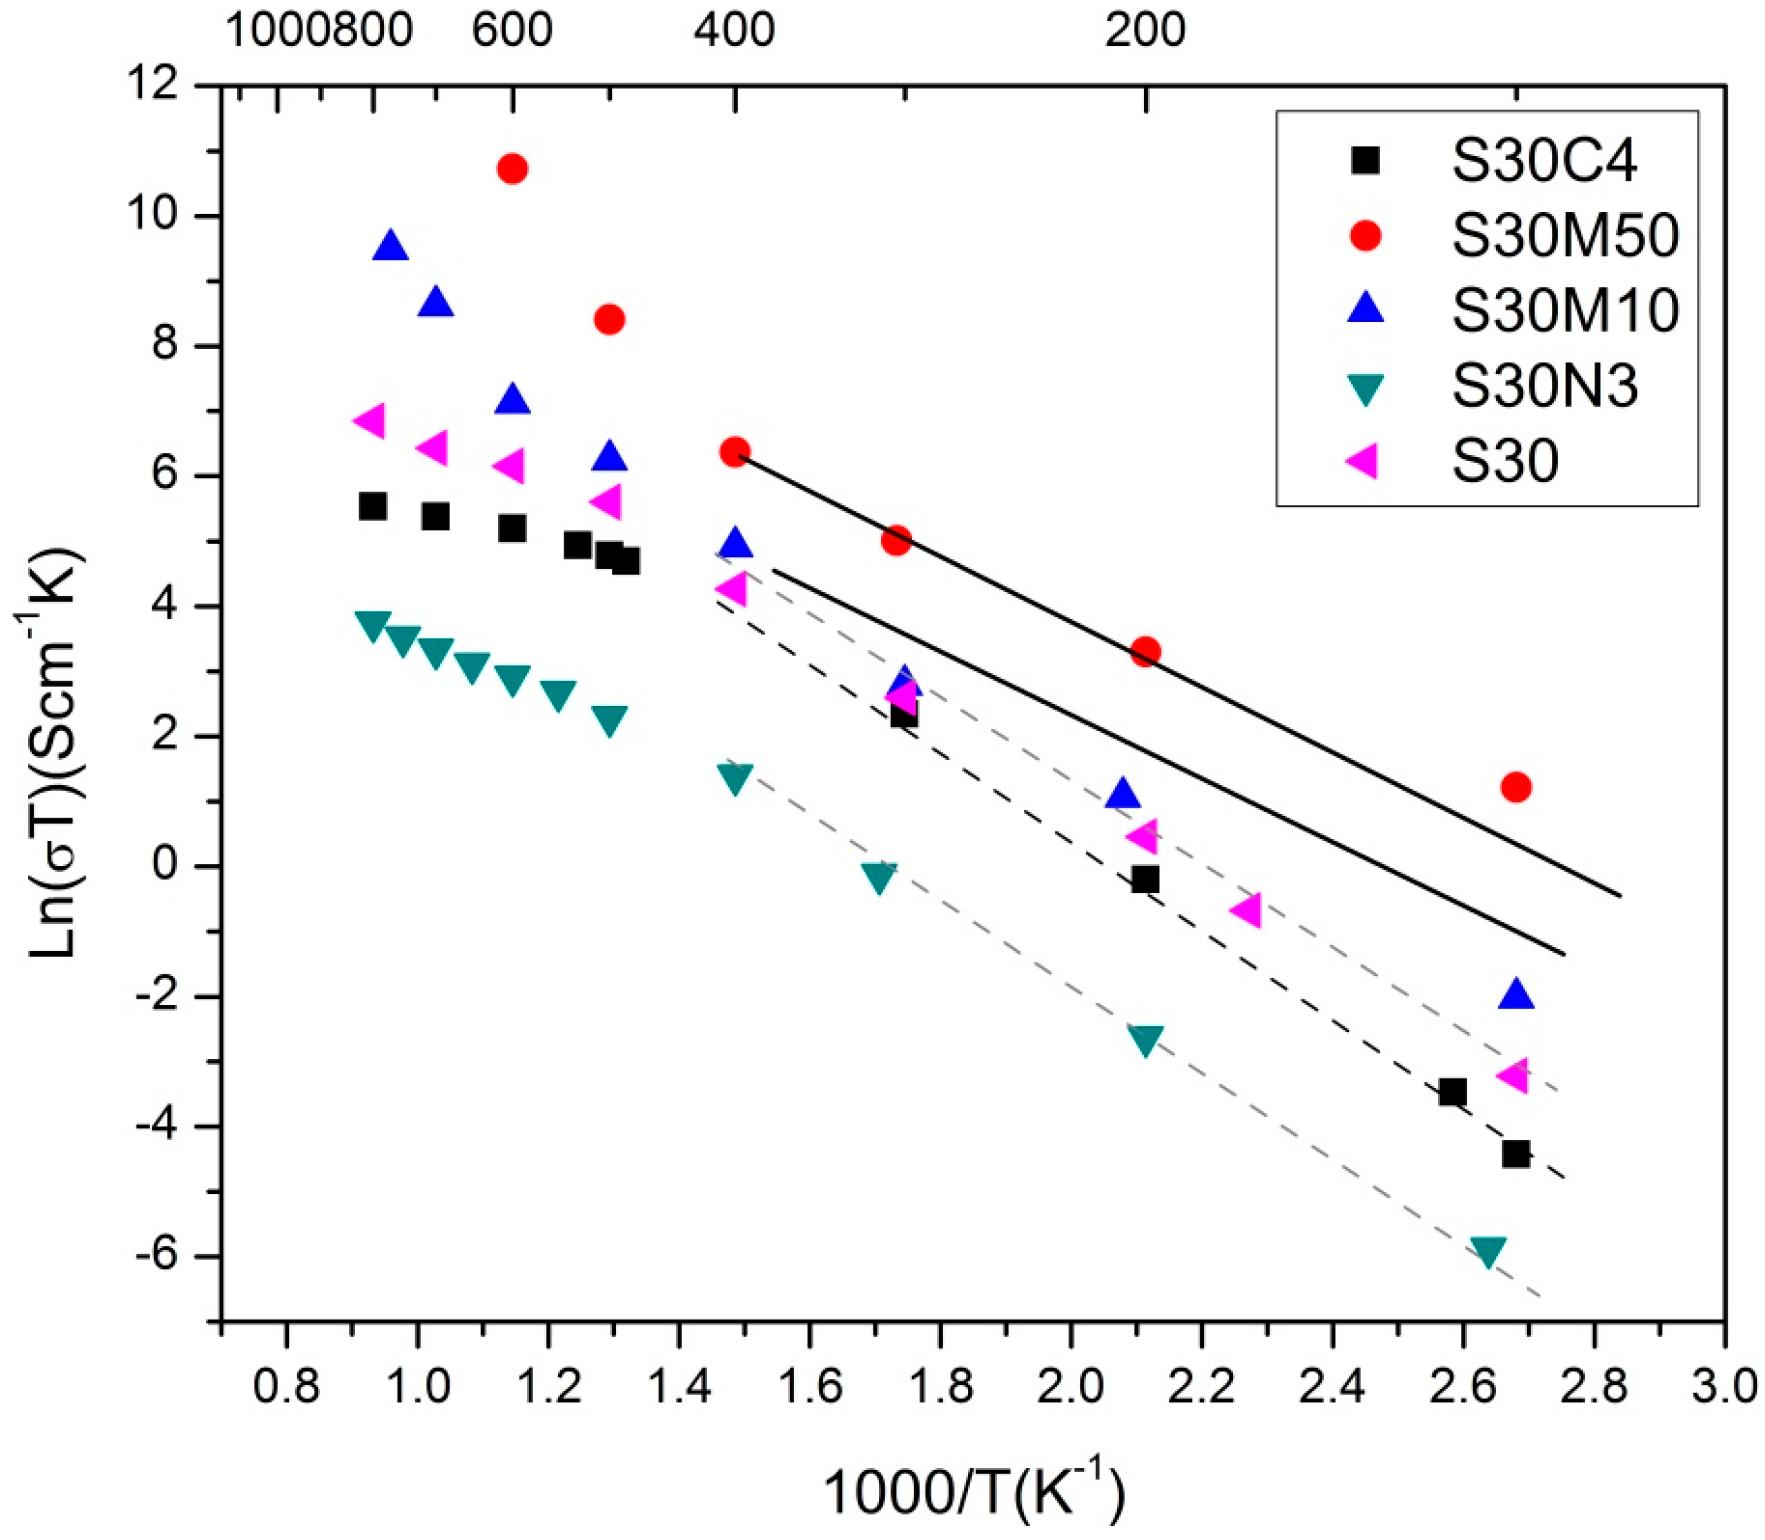
37]. The electrical conductivity of S30 (
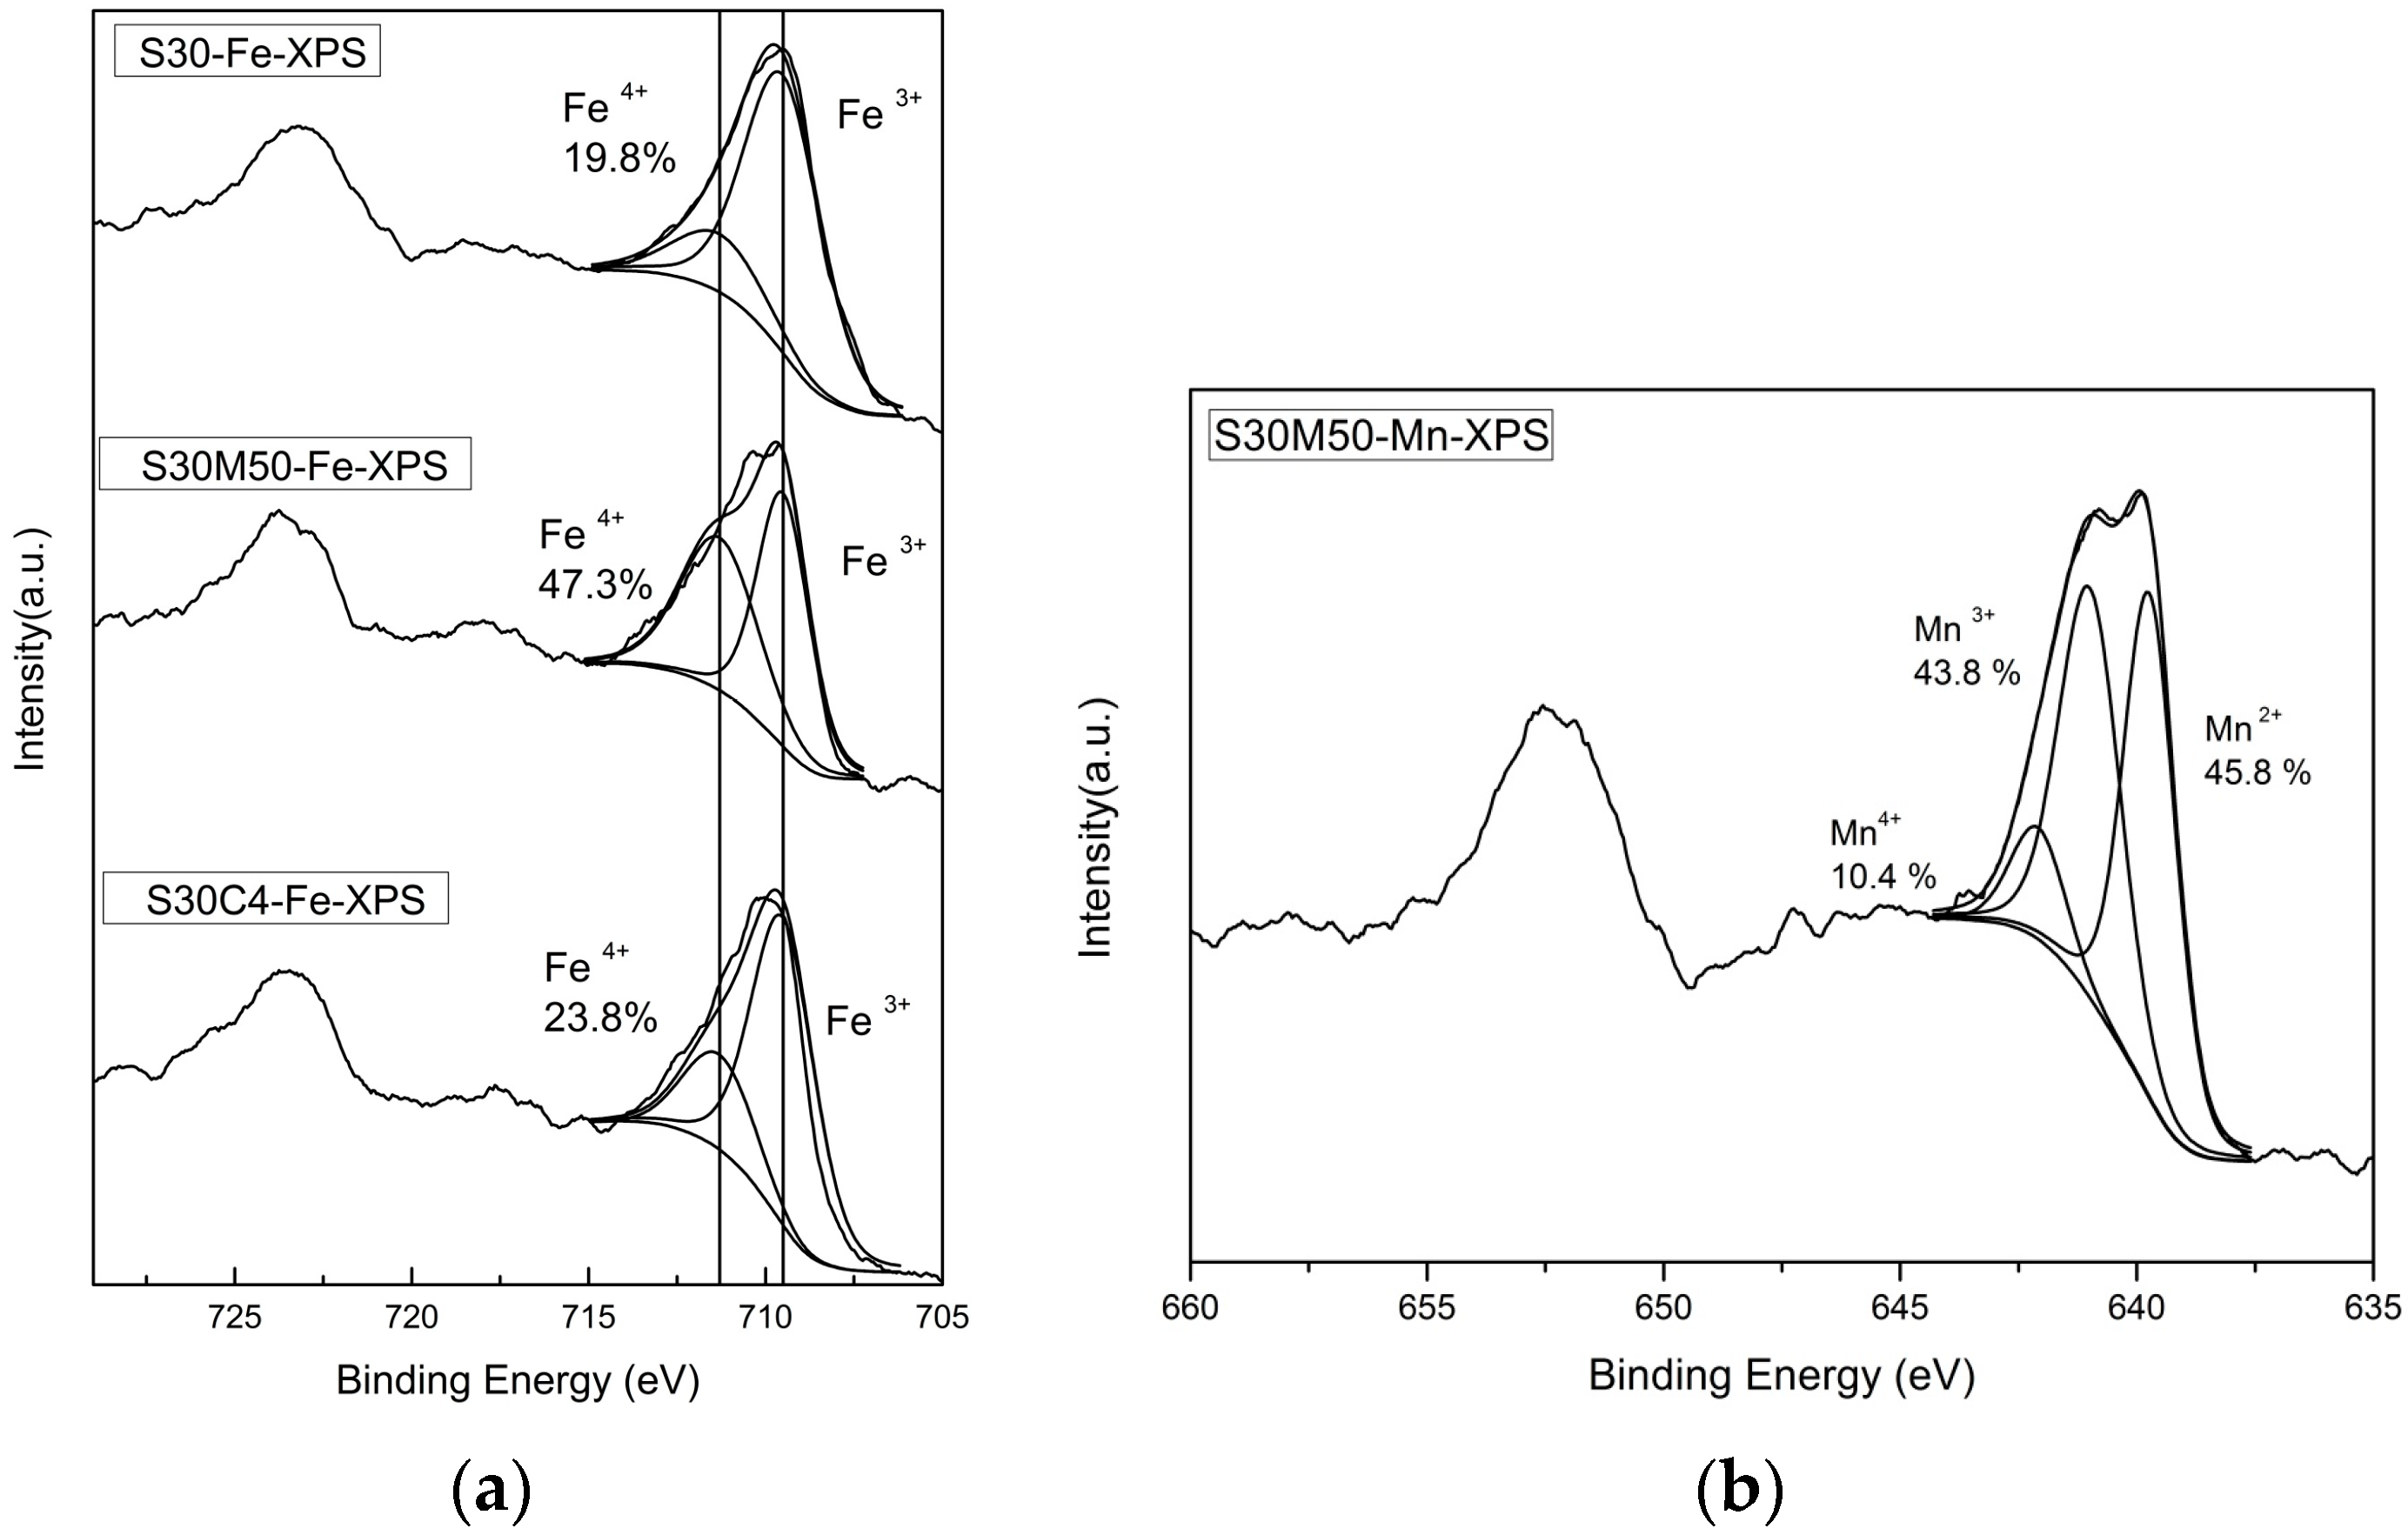
Figure 2a) and XPS results (Figure 5 and Figure 6) depicting the valence states of Fe (4+ and 3+) in nearly equal quantity at the B-sites are mostly favored as hopping sites (e.g., Fe3+/Fe 4+ and Mn3+/Mn4+) and generates electron conduction at low temperatures.
The ionic conductivity of the perovskite/fluorite structure occurs in more complex way at higher temperature via the vacancy mechanism of oxygen ion diffusion. Two factors, the concentration of the oxygen vacancy [ V O ¨ ] and the mobility µο of the oxygen vacancy are effective and affect the oxygen ionic conductivity in the perovskite structure.
σ i = Ze   [ V O ¨ ]   μ O
However, there are several factors influencing the ionic mobility, basically, to which the ions block transport of the oxygen in the perovskite structure.
Several structural factors have been proposed to explain the relationship of ionic transportation behavior with the oxygen vacancies, etc. These factors can be explained by a schematic diagram in Figure 9.
Goldschmidt et al. [38] defined a tolerance factor, S, to reveal the stability of the perovskite structure, as shown below:
S = r A + r O 2 r B + r O )  
where rA and rB are the mean ionic radii for A- and B-site cations, and rO is the radius of an oxygen ion. For a stable perovskite structure, the tolerance factor S is between 0.77 and 1.0. When S = 1.0, a perfect cubic structure is achieved, and the B–O–B bond angle is 180°; when S < 1.0, the lattice structure tends to change from cubic to rhombohedral and to orthorhombic.
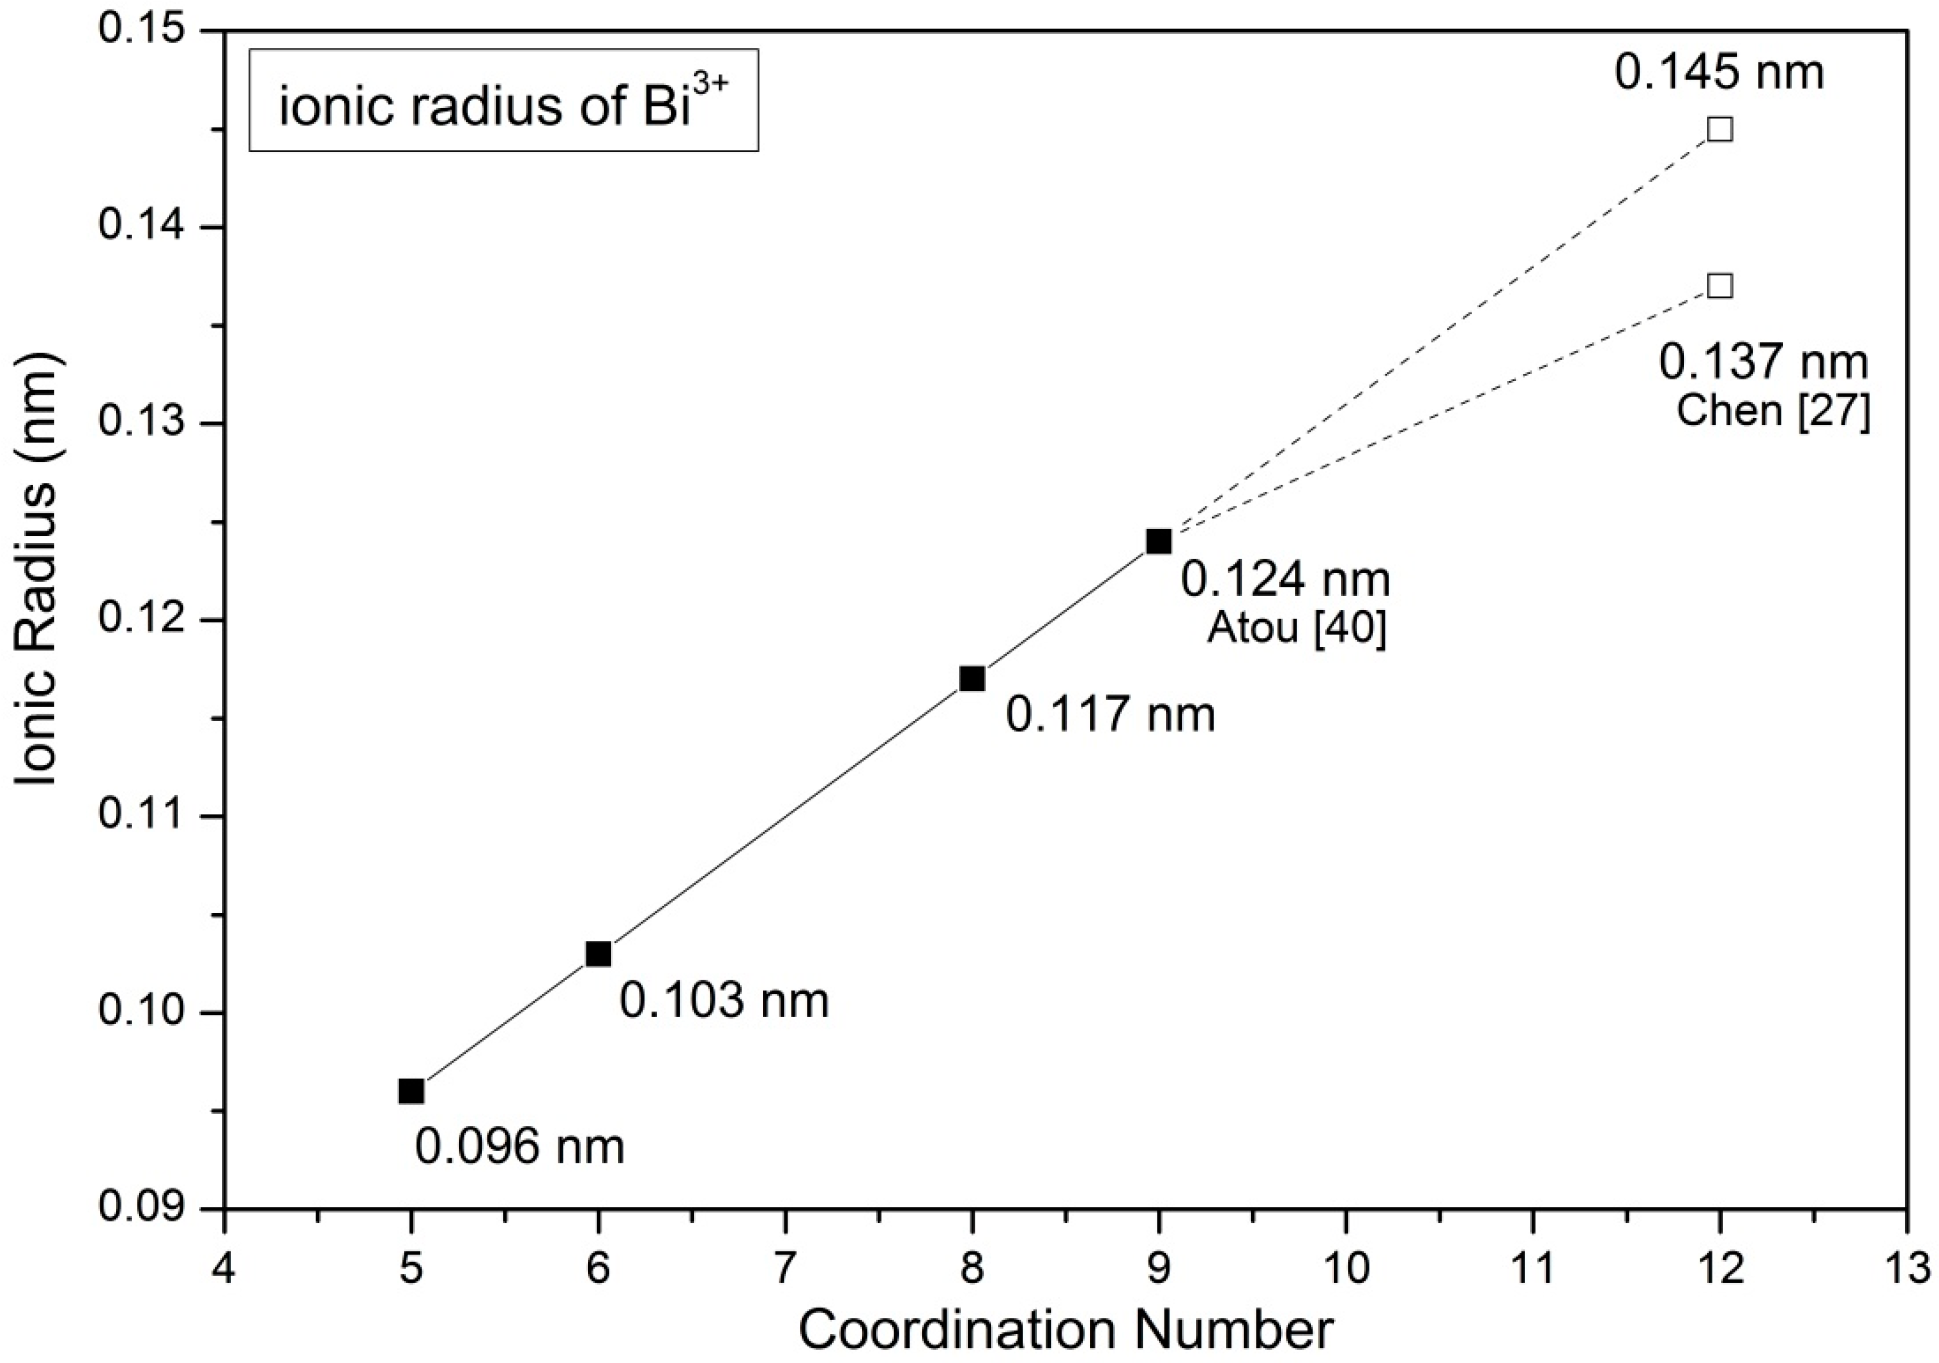
Table 5 shows the ionic radii of various cations of a specified coordination number (CN) referenced from Shannon [39]. Since the ionic radius of Bi3+ of CN = 12 is not reported in the literature, one extrapolated value was calculated from a linear relationship between the reported ionic radii and CNs, as shown in Figure 10. An ionic size 1.45 Å of Bi3+ is obtained, which is slightly greater than 1.37 Å calculated from X-ray data in our previous work [27].
If the value 1.45 Å of Bi3+ (CN = 12) was used to calculate the tolerance factor of LSCF6428, S30, S30N3 and S30M50, the results are shown in Table 6. Since the S values of all samples are less and close to 1.0, the result indicates all BSFM samples have a stable perovskite structure.
Other than the tolerance factor, Richter et al. [36] also proposed another parameter, critical radius rcr, to describe the open space of the triangle (Figure 9) allowing oxygen ion diffusion in the perovskite structure, and it could be calculated by the following equation:
r cr = a 0 ( 3 4 a 0 2 r B ) + r B 2 r A 2 2 ( r A r B ) + 2 a 0  
where a0 is the pseudo-perovskite lattice parameter, and a0 can be derived experimentally or as below [41] if the structure is nearly cubic:
a 0 V 1 / 3 = 2.37 r B + 2.47 2.00 ( S 1 1 )
In other words, the rcr describes the maximum size of the gap for a mobile oxygen ion to pass through the “saddle-point” between the triangle surround by two A-site cations and one B-site cation. The critical radii rcr of four samples are calculated and shown in Table 5. As all critical radii are close to 0.90 Å and far smaller than the oxygen ions radius (1.40 Å in six-fold coordination or 1.36 Å in three-fold coordination in the saddle-point), the oxygen ions need a strong thermal vibration of the lattice to assist the migration [36].
Sammells et al. [42] introduced another parameter, lattice free volume Vf, which was defined as equal to the difference in the unit cell volume (V = a 0 3 ) and the total volume of the constituent ions. Moreover, Hayashi et al. [43] modified the Vf and proposed the other parameter, the specific free volume (Vsf) to describe the same diffusion phenomena:
V sf = V f V ( unit _ cell _ volume )
They used the parameters, Vf and Vsf, as the bases to compare the free space in the perovskite structure of different compositions. The larger the Vsf, the lower the driving force and activation energy of the migration. Based on the calculated results shown in Table 5, the difference between the two structural factors, the tolerance factor and critical radius are not significant, having less than 1% difference. However, a 
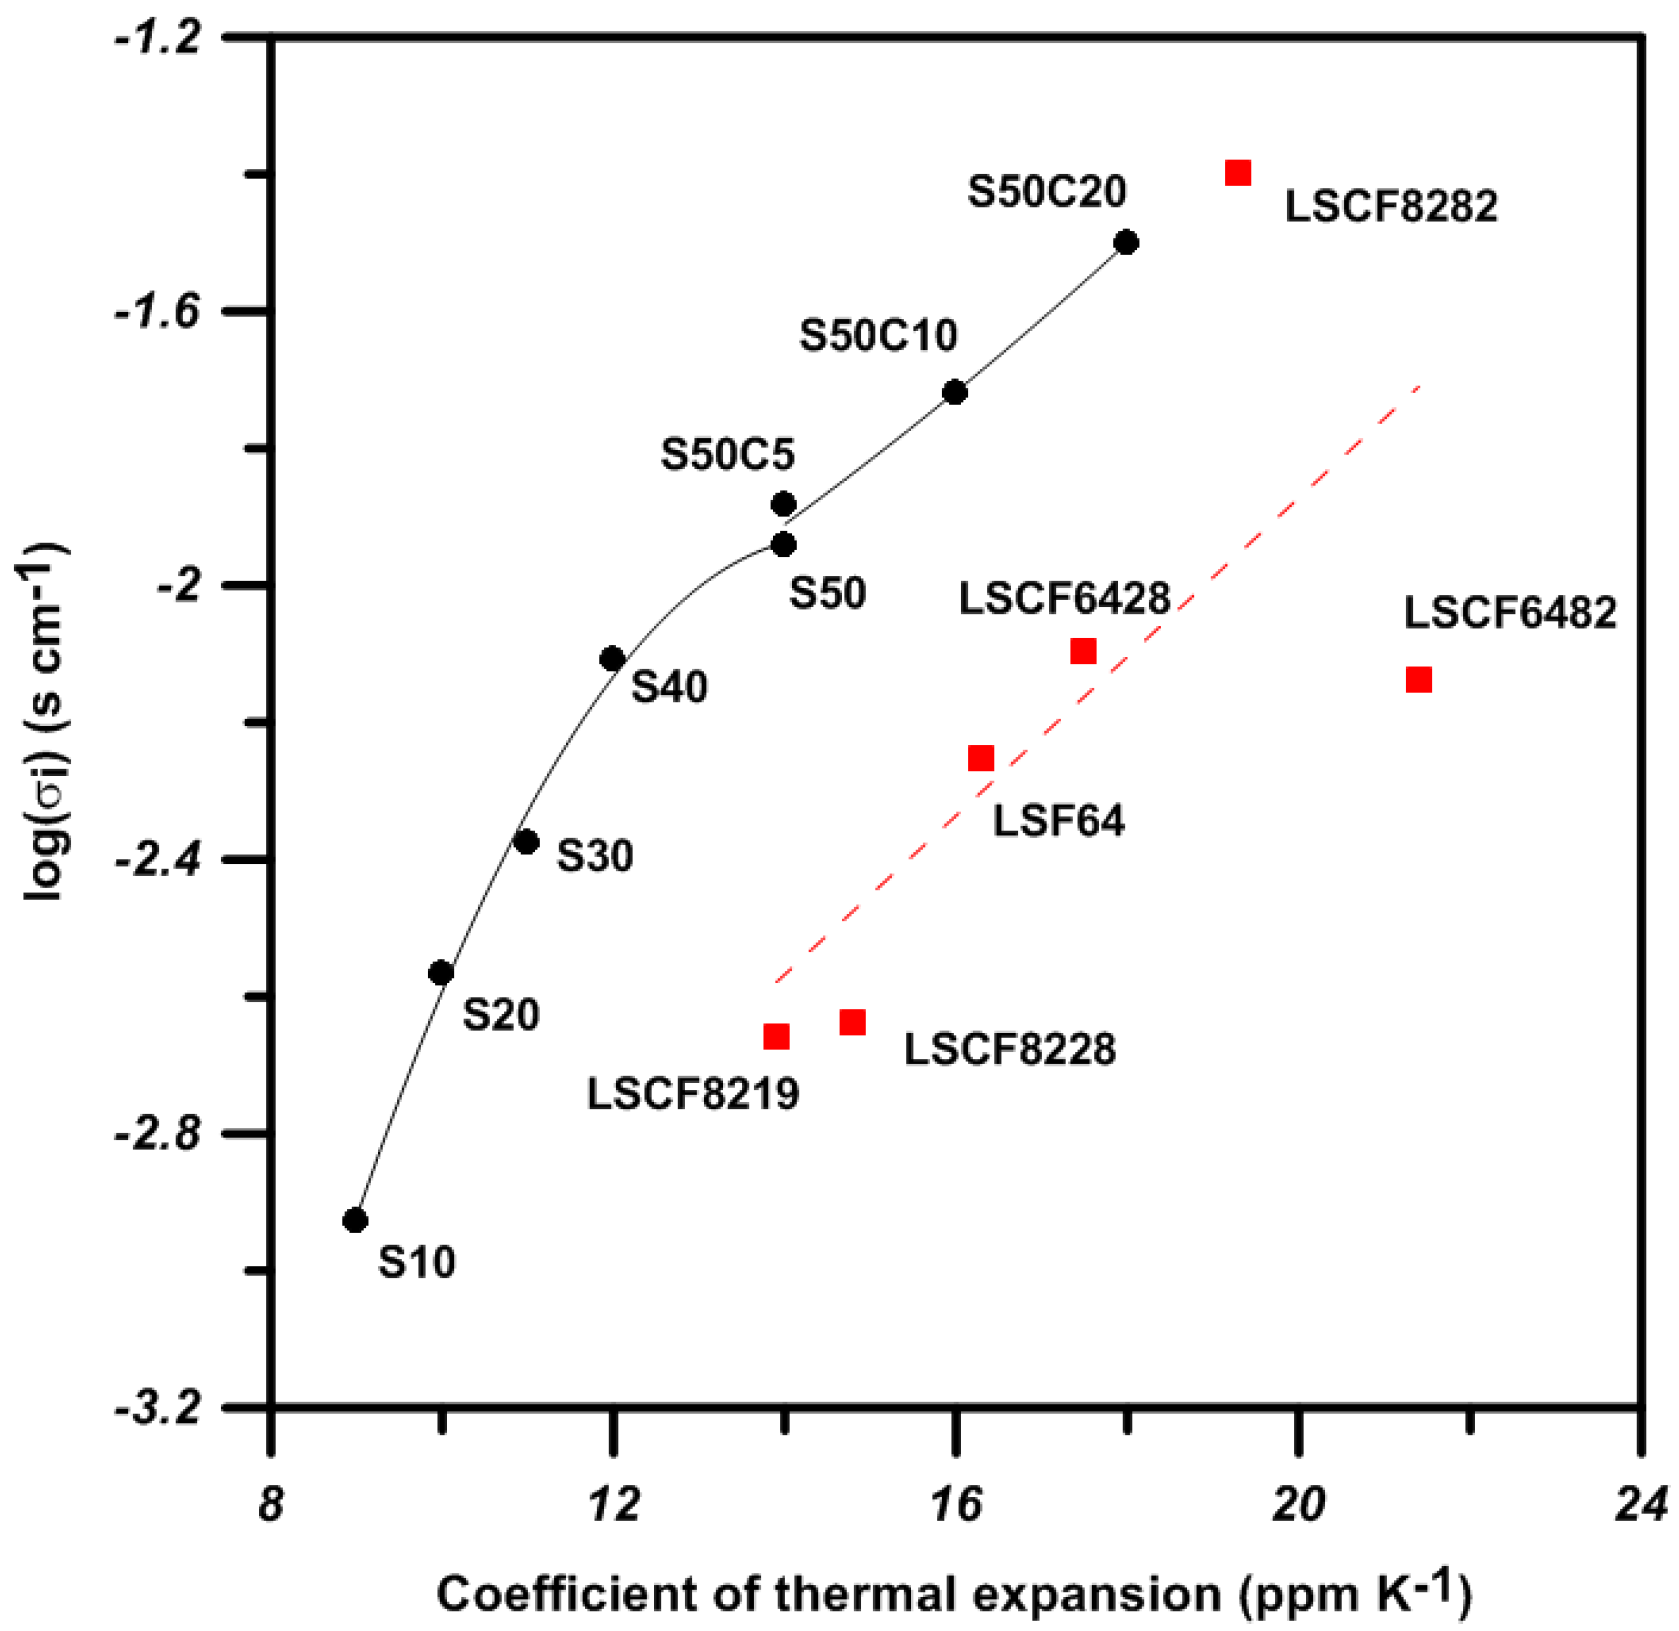
Vsf valued of S30 and S30M50 being 10% more than that of LSCF6428 provides more free space for mobile oxygen diffusing in the perovskite structure. Therefore, the structural advantage of S50C20 offering a lower activation energy (Ea) of 1.2 eV and a higher mobility (µ
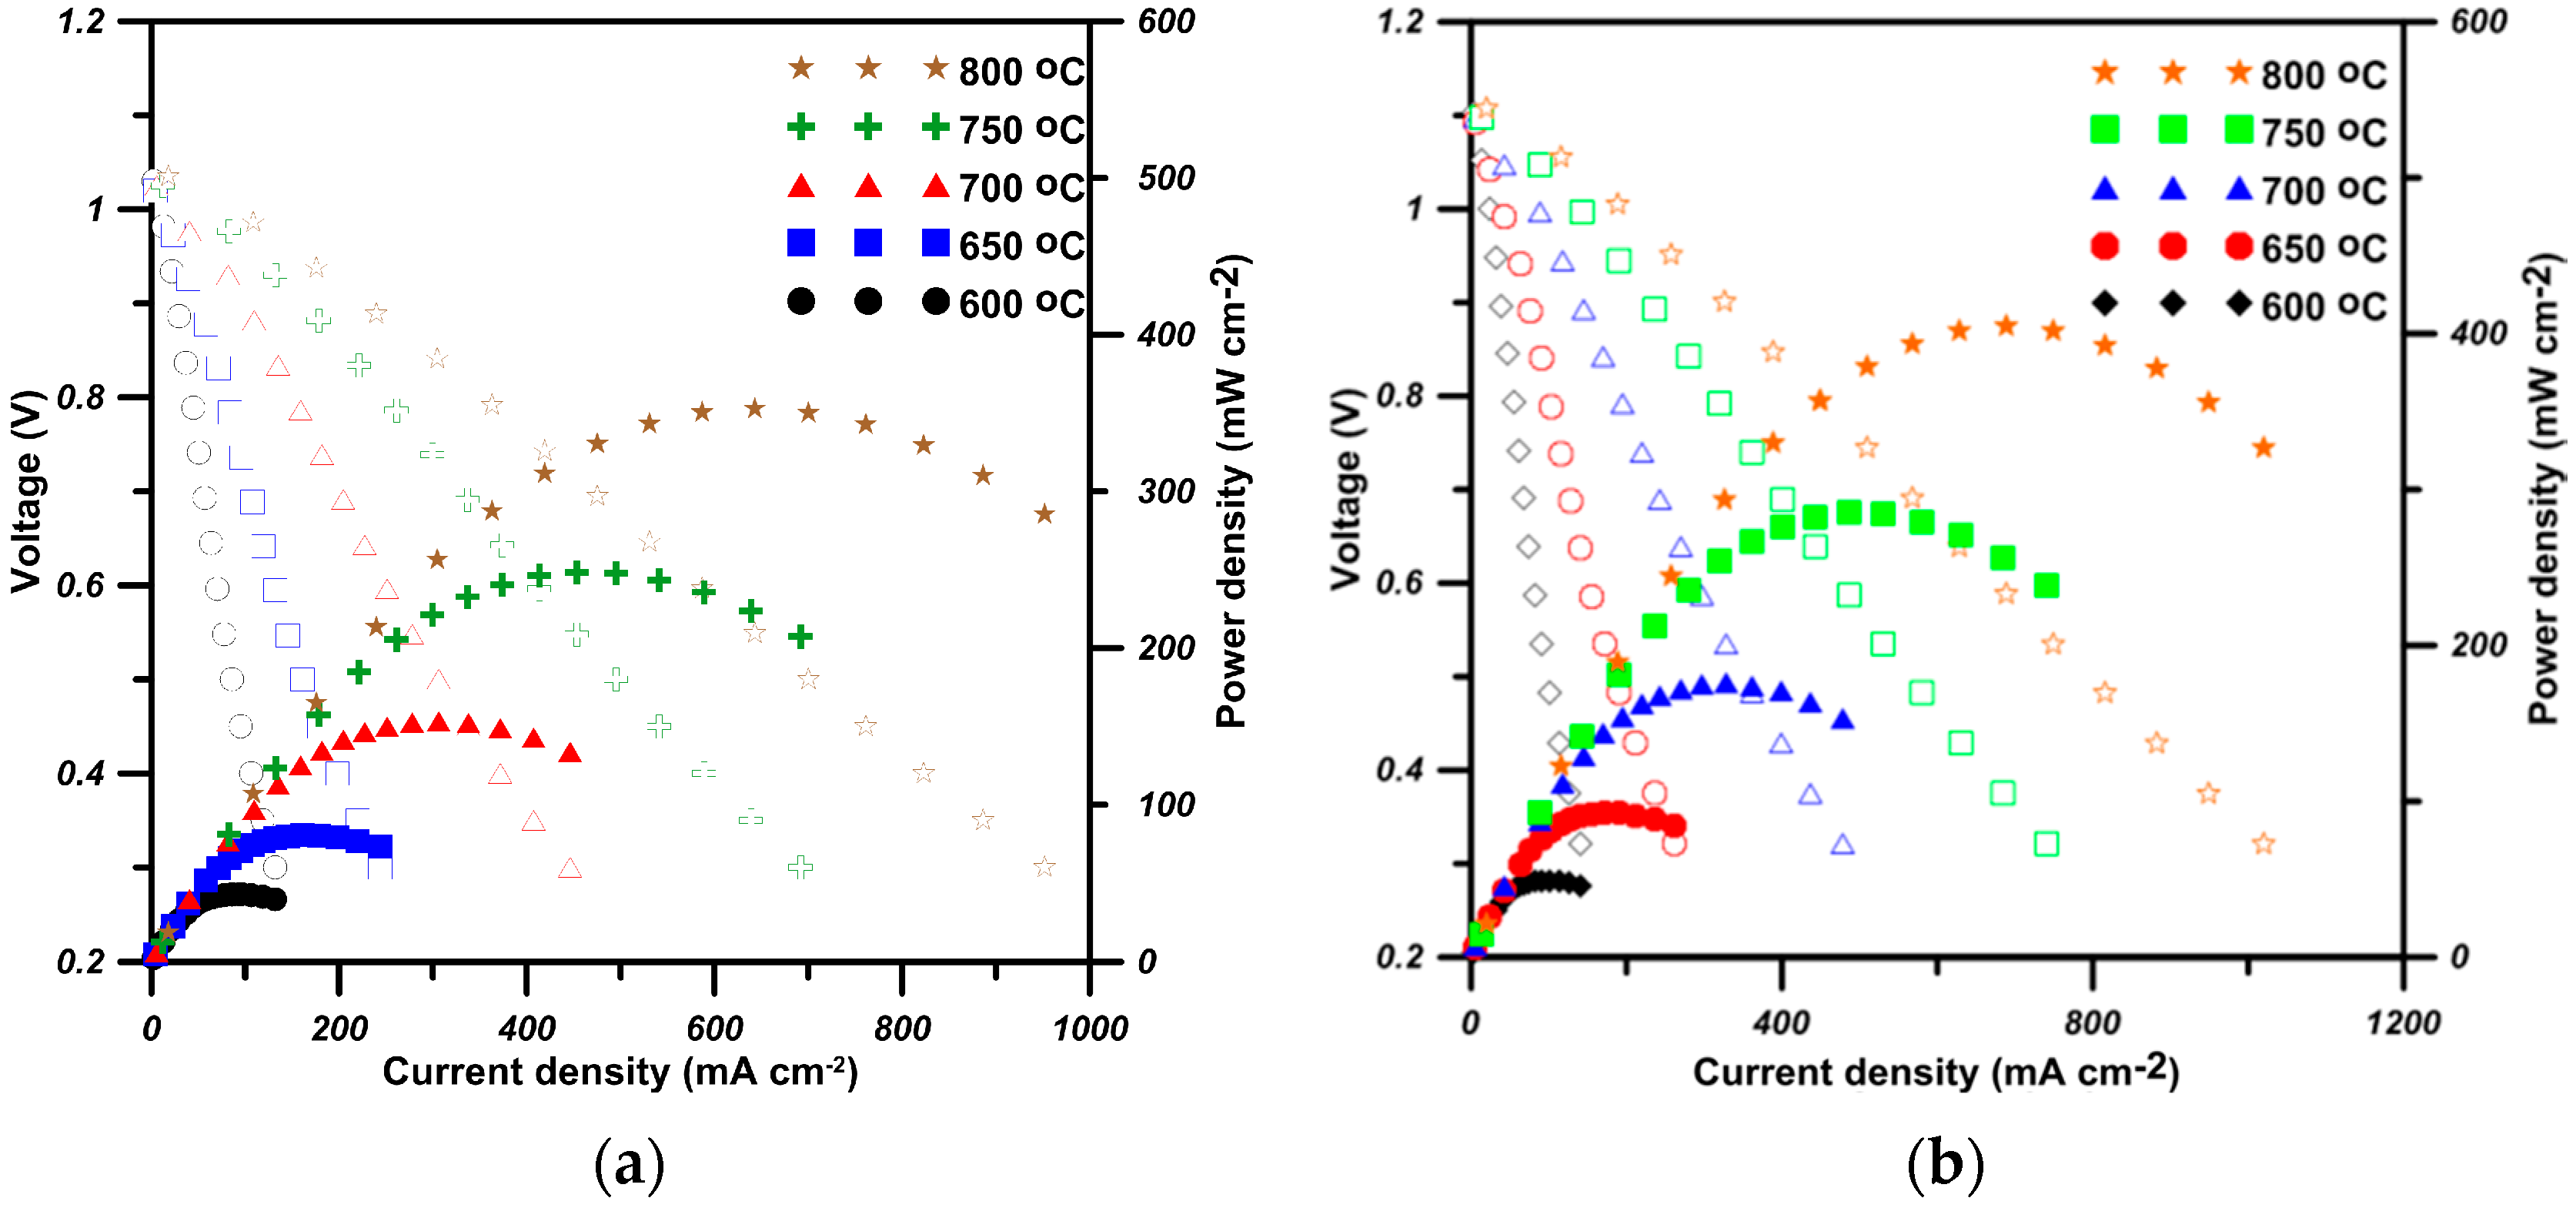
0) of oxygen migration are expected. The power density output of the cell with the S50C20 cathode is better than that with LSCM6328.

4. Materials and Experimental Procedures

4.1. Synthesis of Cathode Materials

Bi0.7Sr0.3Fe1−xMxO3−δ powders (M = Co, Ni, Mn) were synthesized by the EDTA-citric method [44]. Bi2O3 (Solar Applied Materials Technology Corp., Tainan City, Taiwan) was dissolved in a HNO3 solution (65%, Sigma-Aldrich, St. Louis, MO, USA), and Sr(NO3)2 (Showa Chemical Industry Co., Ltd., Tokyo, Japan), Fe(NO3)3·9H2O (Showa Chemical Industry Co., Ltd.), Ni(NO3)2·6H2O (Showa Chemical Industry Co., Ltd.), MnN2O6·4H2O (Alfa Aesar, Ward Hill, MA, USA) were separately dissolved in deionized (DI) water to obtain the solutions for a 0.1 M molar concentration. EDTA (ACROS, Geel, Belgium) was dissolved in the NH4OH solution (J.T. Baker Chemical, Center Valley, PA, USA) as a buffer solution. The nitrite solutions were mixed together as the formulation BSFM specified, then added drop-by-drop into the buffer solution, following the addition of citric acid (Showa Chemical Industry Co., Ltd.) in a molar ratio of EDTA/cations/citric acid = 1:1:2. After the solution was mixed and stirred, NH
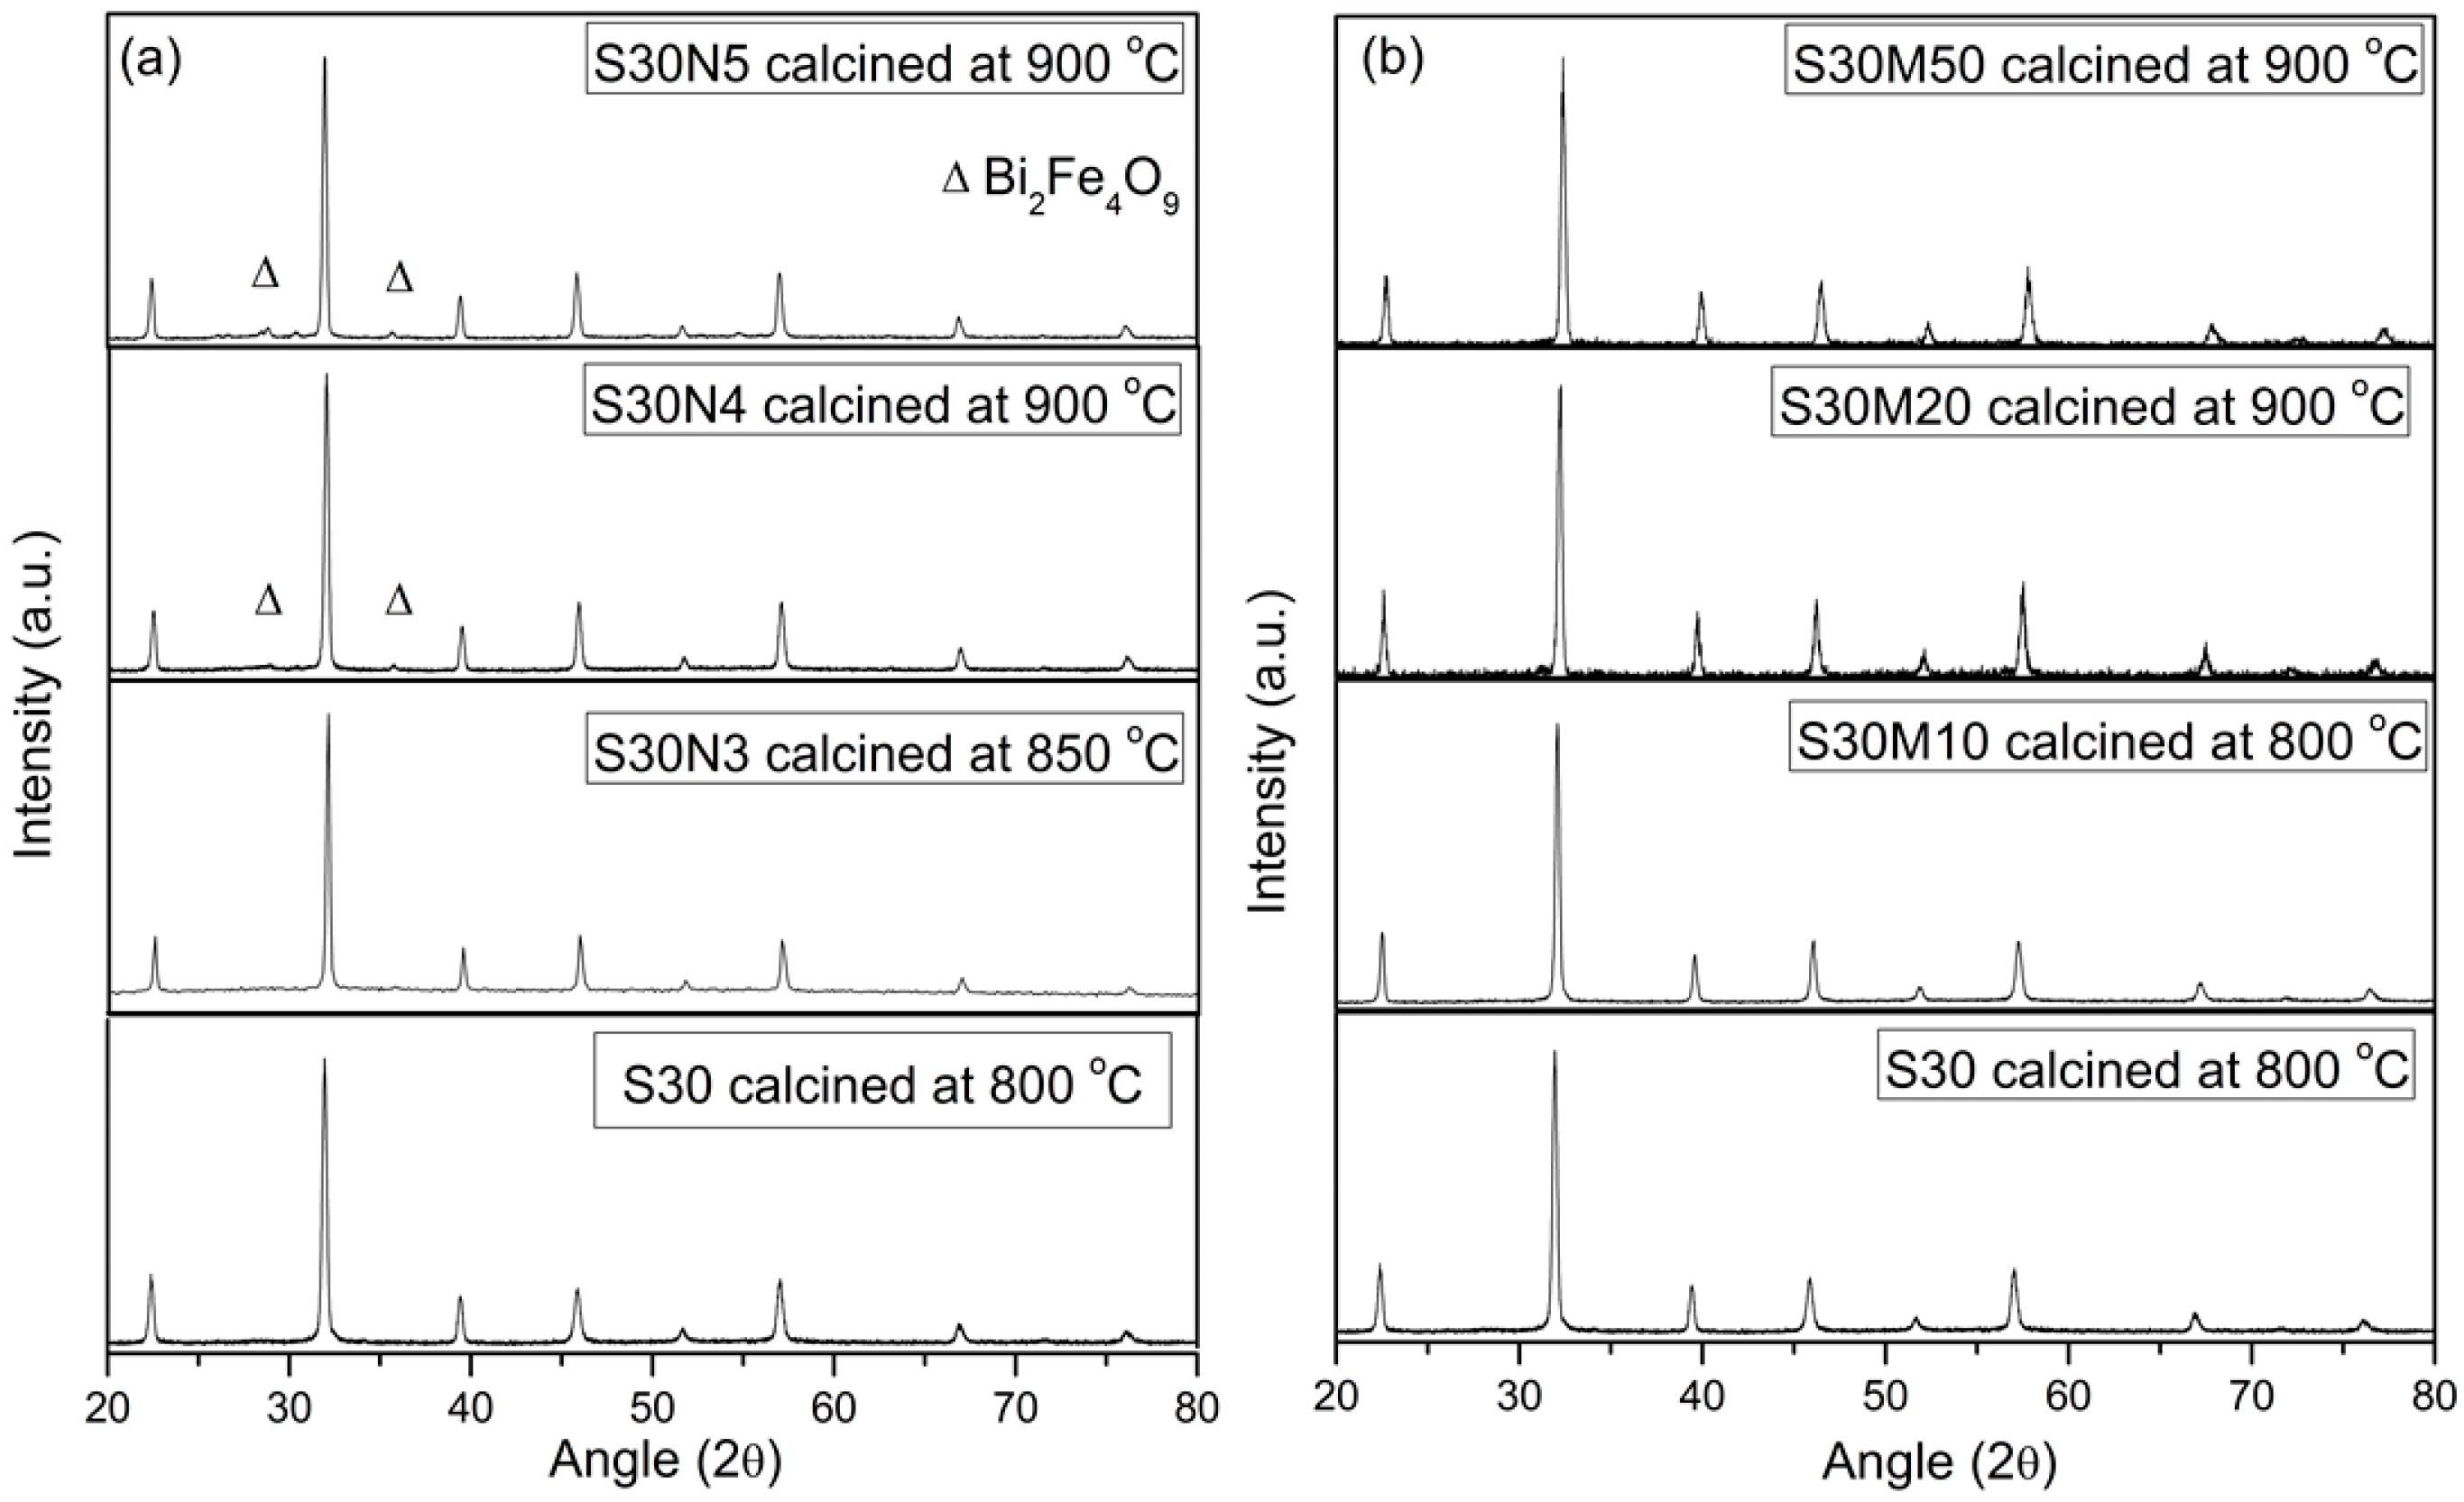
4OH was added to control pH to 7.0. Then the solution was heated on a hot plate at 200 °C until a gel solution was obtained. The dried gel was combusted at 200 °C in an oven and left overnight. The ash-like powder was obtained and calcined at 800 °C–900 °C to obtain a single-phase powder.

4.2. Preparation of Fuel Cell

SOFC was prepared by the following procedures. In brief, 8 mol % yttria stabilized zirconia (8YSZ, Tosoh Co., Tokyo, Japan), NiO (F grade, INCO Ltd., Toronto, ON, Canada), and mesophase carbon powder (MCMB, National Chung-Shan Institute of Science & Technology, Taoyuan, Taiwan) in a mass ratio of 45:45:10 were used to prepare three separated slurries in a solid loading of 28 vol %. The slurries contained de-ionized water as a liquid carrier and Darvan C (PMAA-N, Vanderbilt Co. Ltd., Norwalk, CT, USA) as dispersant. After ball-milling for 24 h, the slurries in a specified composition of the anode, were mixed for an additional 1 h, and then dried to powder form. The anode powder was pressed into the pellets of 20 mm in diameter and 1.0 mm in thickness. The pellets were calcined at 1000 °C for 2 h in air before spin-coating of the 8YSZ layer.
The slurry for spin-coating of 8YSZ electrolyte layer was prepared by mixing YSZ powder (TZ-8Y, Tosoh, Tokyo, Japan) with ethyl cellulose (E0266, TCI, Tokyo, Japan) and terpineol (regent grade, ACROS, NJ, USA) in a mass ratio of 30:2:68. The mixture was ball-milled for 24 h until the slurry was stable and homogeneous. Spin-coating of the YSZ slurry on the anode was conducted in three steps: (1) a few drops of the slurry were coated onto a spinning anode pellet in a turning rate increasing from 0 to 6000 rpm; (2) the spinning speed was kept at 6000 rpm for 60 s; and (3) after coating, the film and the substrate were co-calcined at 500 °C for 10 min. In some cases, the coating was repeated up to three times. A thick coating, made by three cycles, for example, was capable of forming a ca. 15 µm thickness 8YSZ electrolyte layer after sintering. Finally, the coated pellets (half cells) were sintered at 1400 °C for 4 h. A layer of cathode with the pastes of LSFC6482 was screen-printed on a half cell. The S50C20 cathode in an area of 1.00 cm diameter, and a thickness of ca. 10 µm was made. After drying and binder-burn-out of the printed cathode layer, the cell was sintered at 1000 °C for 2 h at a heating rate of 5 °C·min−1.

4.3. Characterization

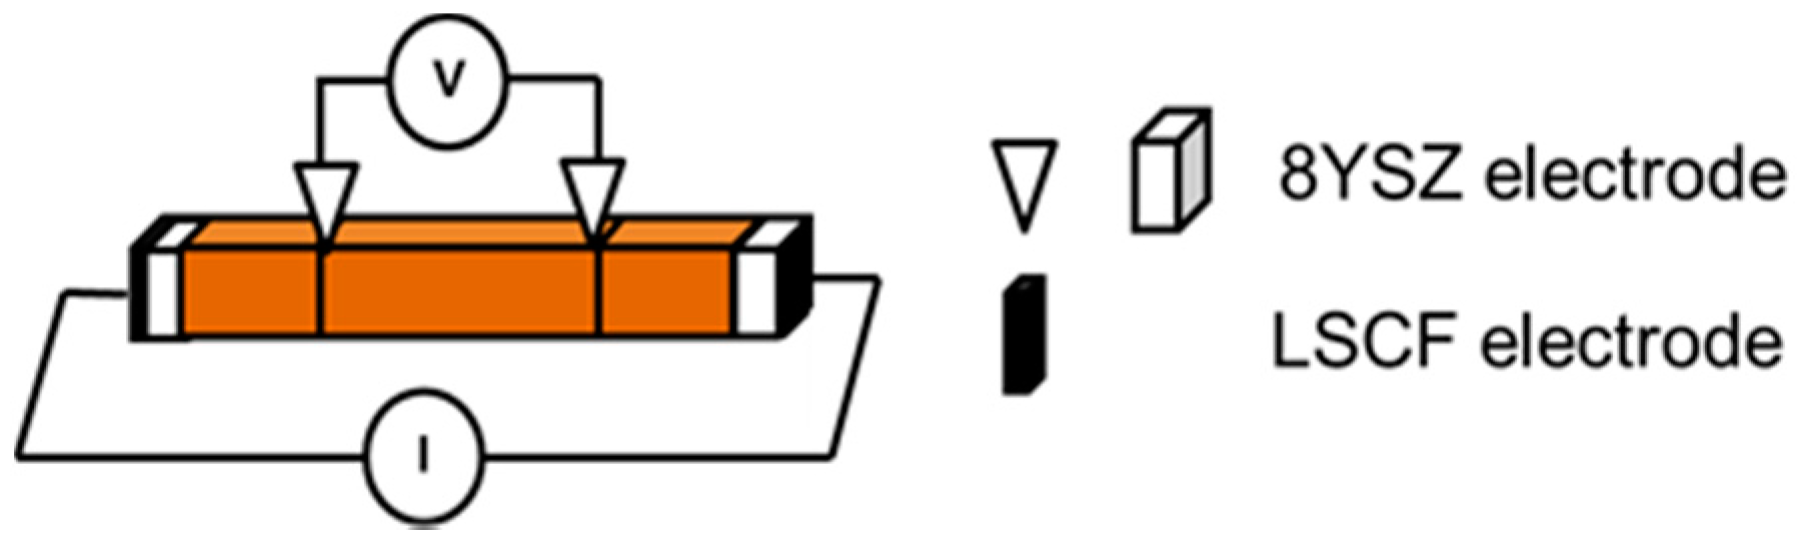
The crystal structure and phases identification of the calcined powder were determined by X-ray diffractometry (XRD, TTRAX 3, Rigaku Ltd., Tokyo, Japan). The total electrical conductivity of the sintered sample in a disk shape and the ionic conductivity of the rectangular samples were measured from 150 °C to 800 °C by a two-probe or four-probe DC technique (Figure 11), respectively [26]. The valence states of Fe and Mn in Bi0.7Sr0.3Fe1−xMxO3−δ were investigated by X-ray photoelectron spectroscopy (XPS) (Thermo Scientific, Theta Probe, Waltham, MA, USA). Spectra were recorded before and after a step of bombardment cleaning using Ar
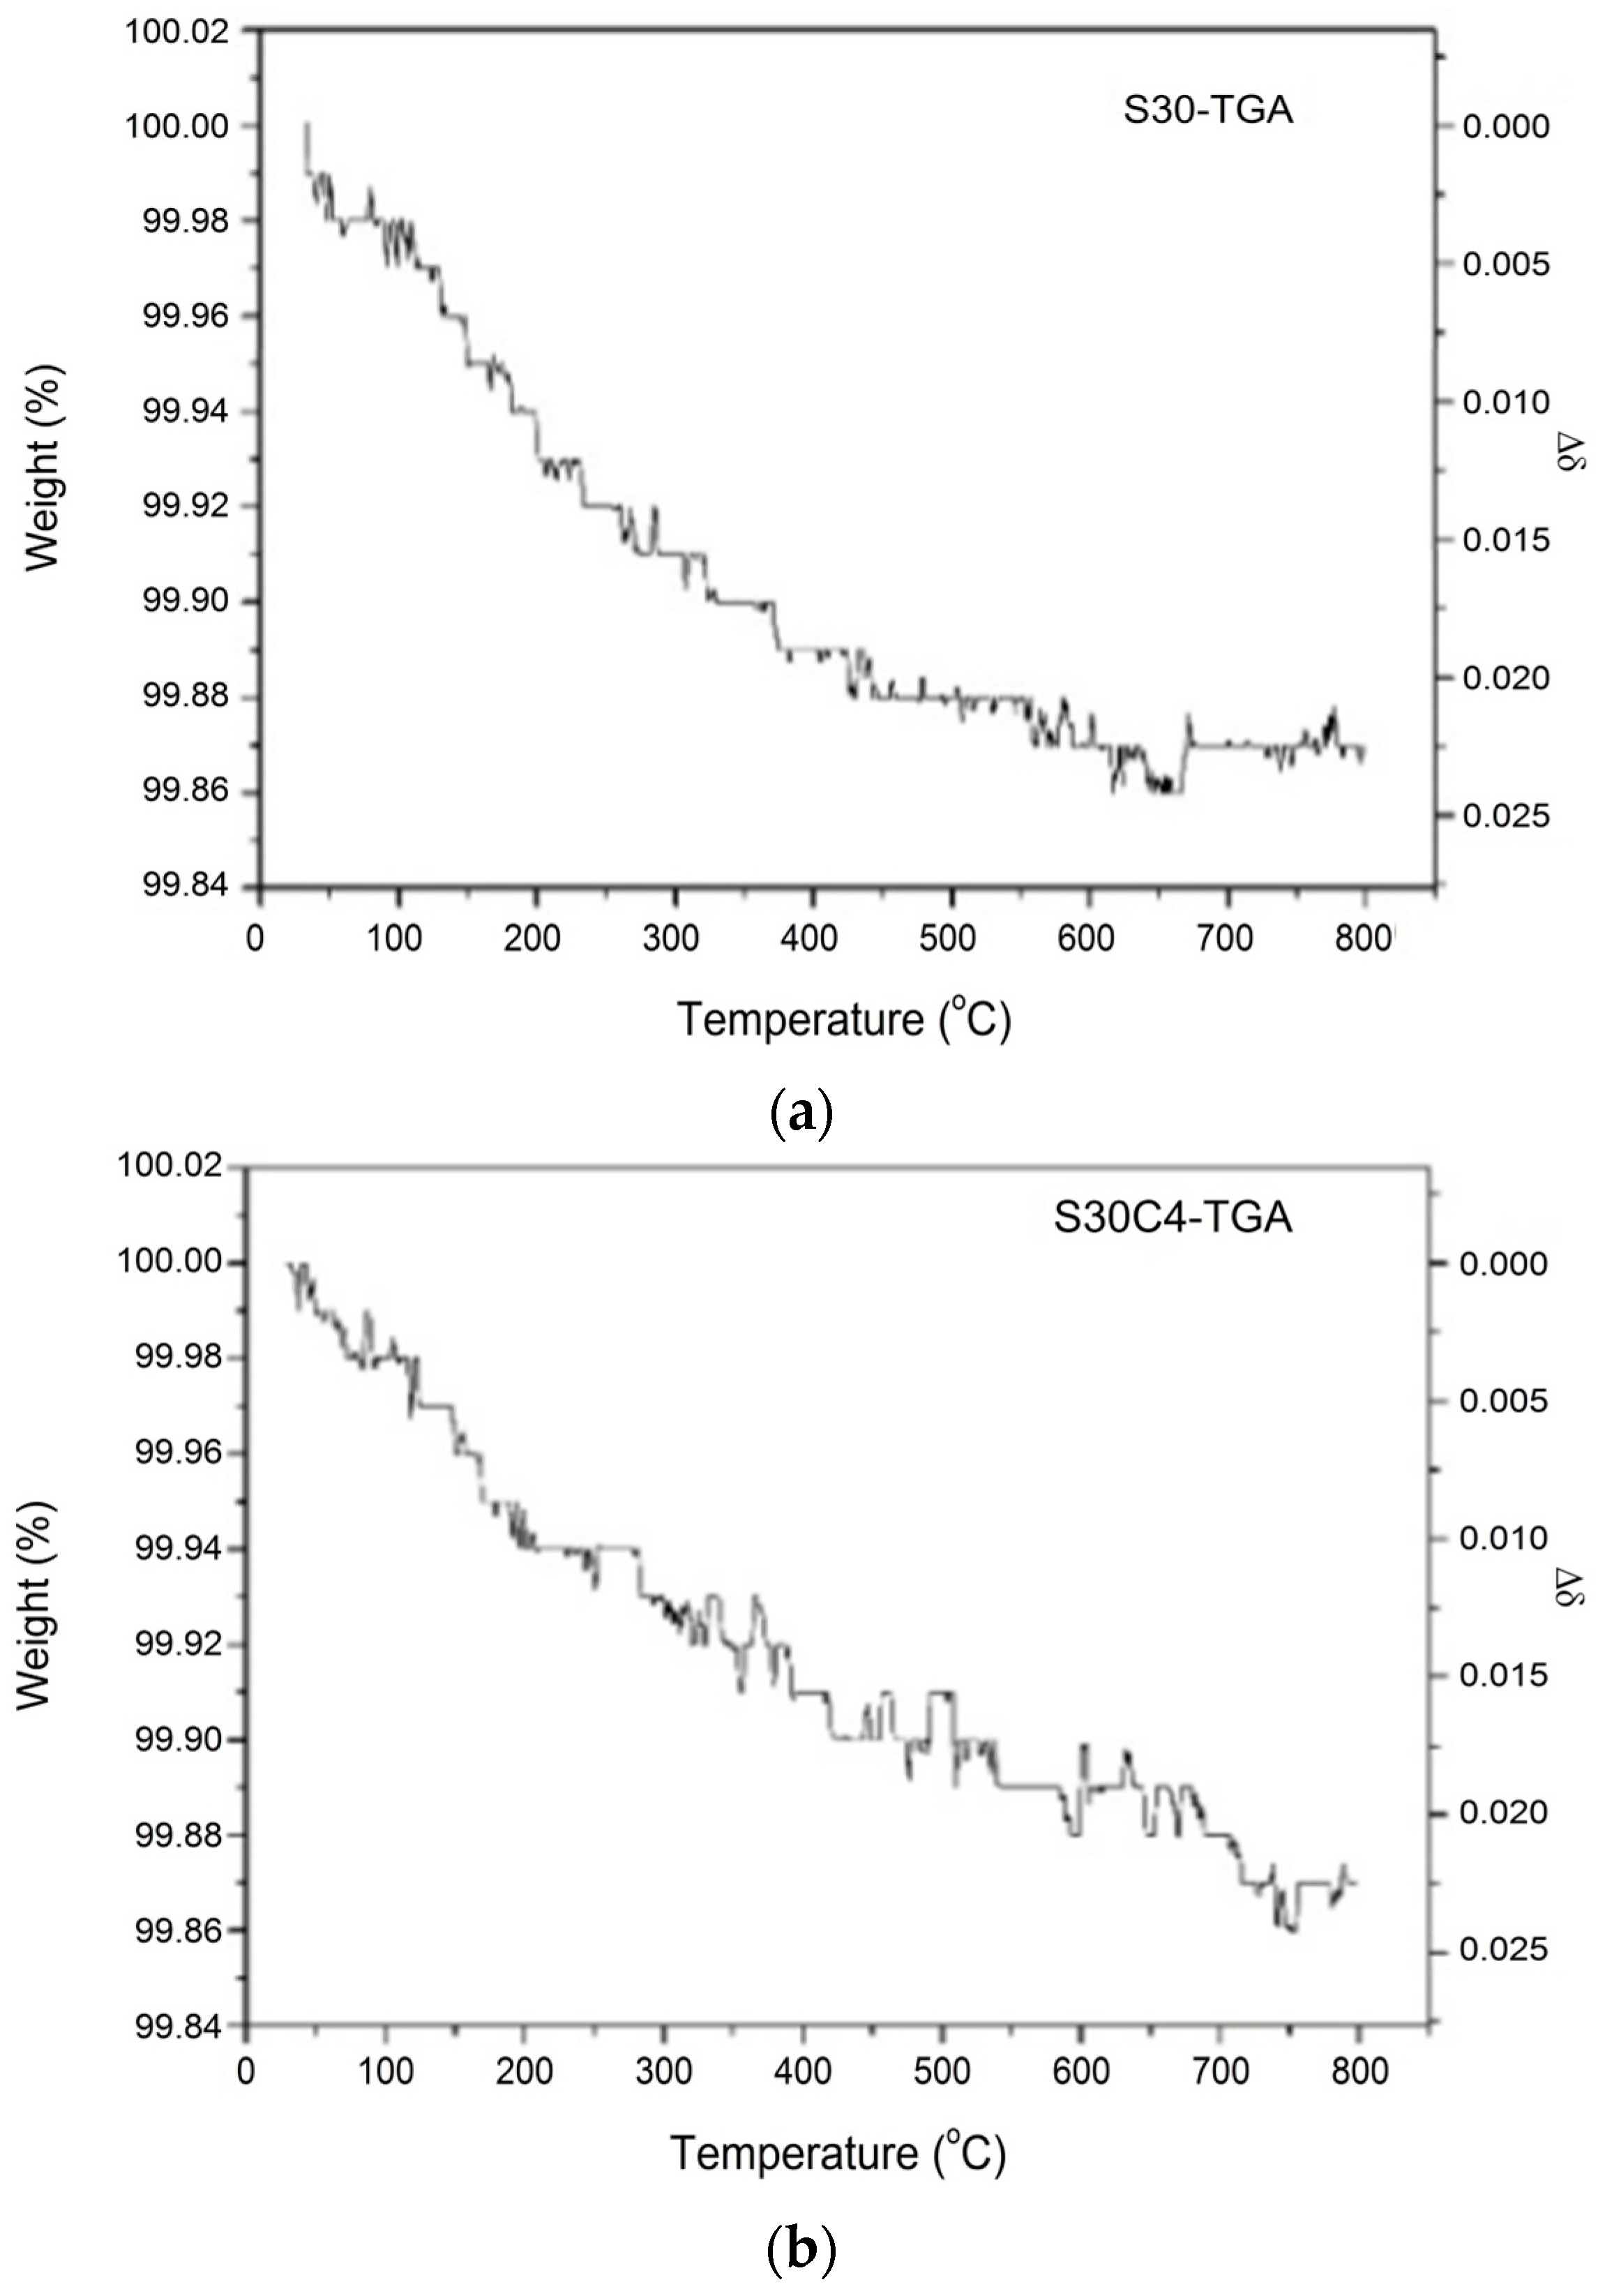
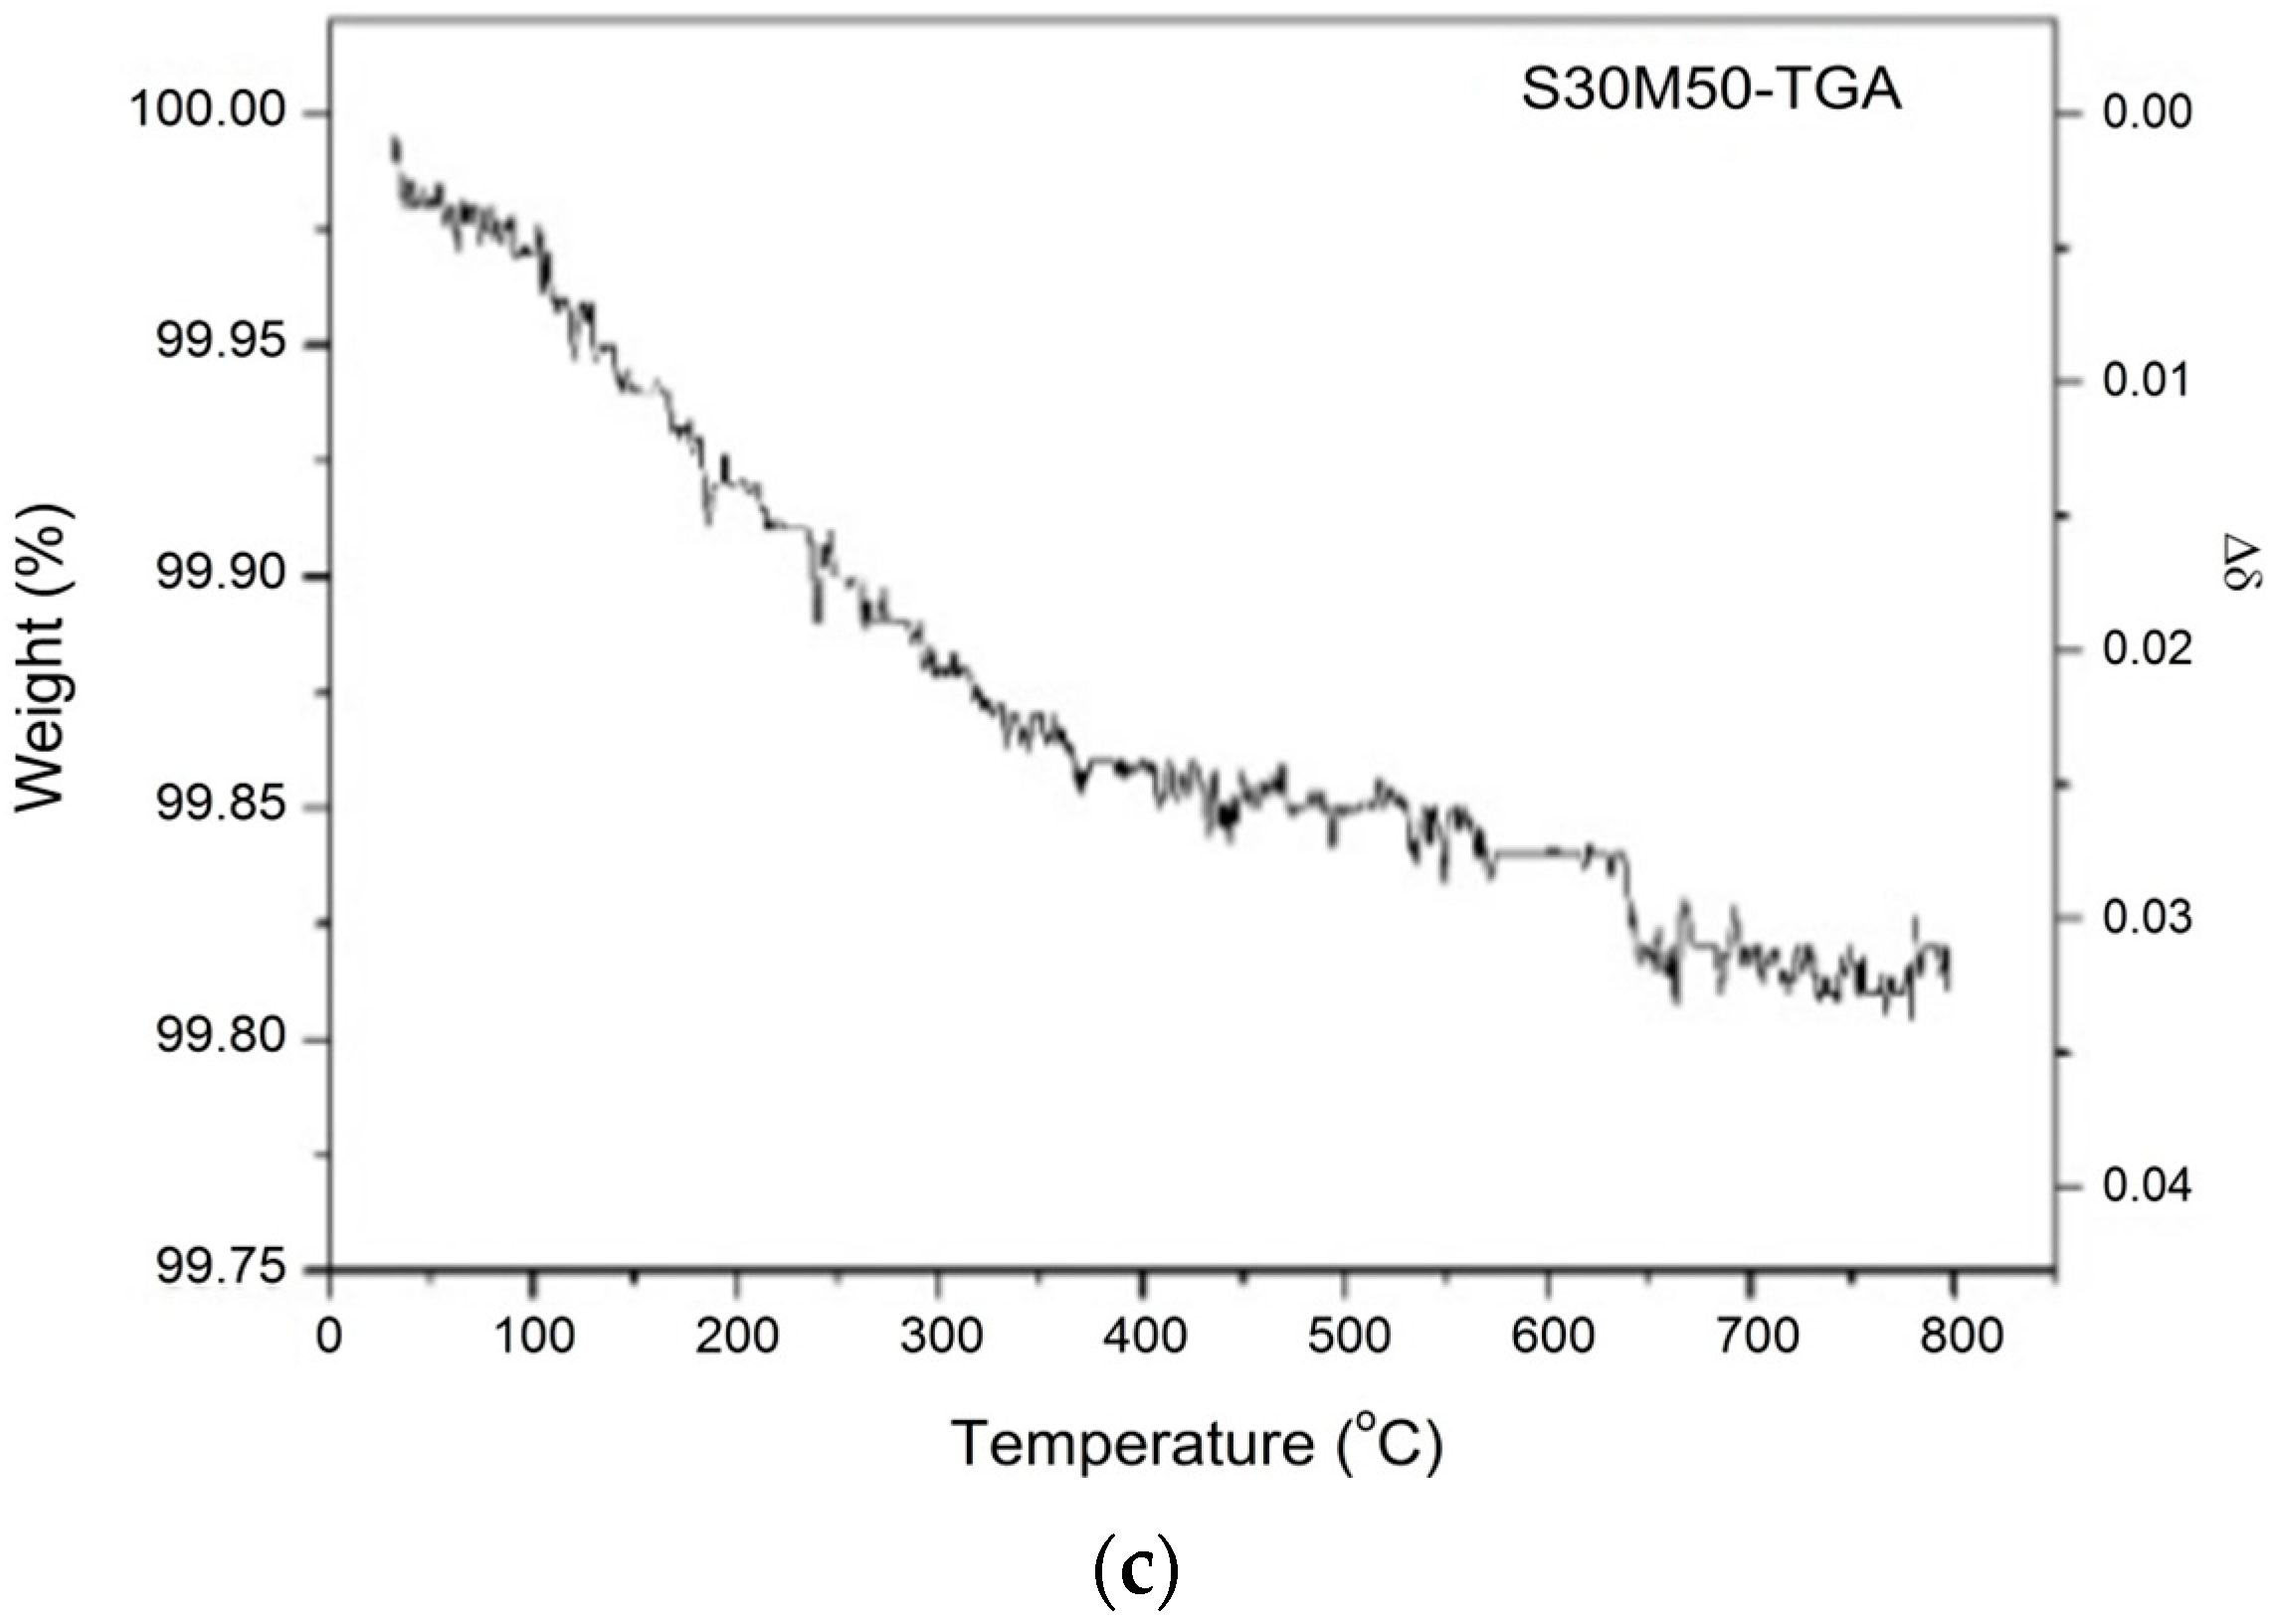
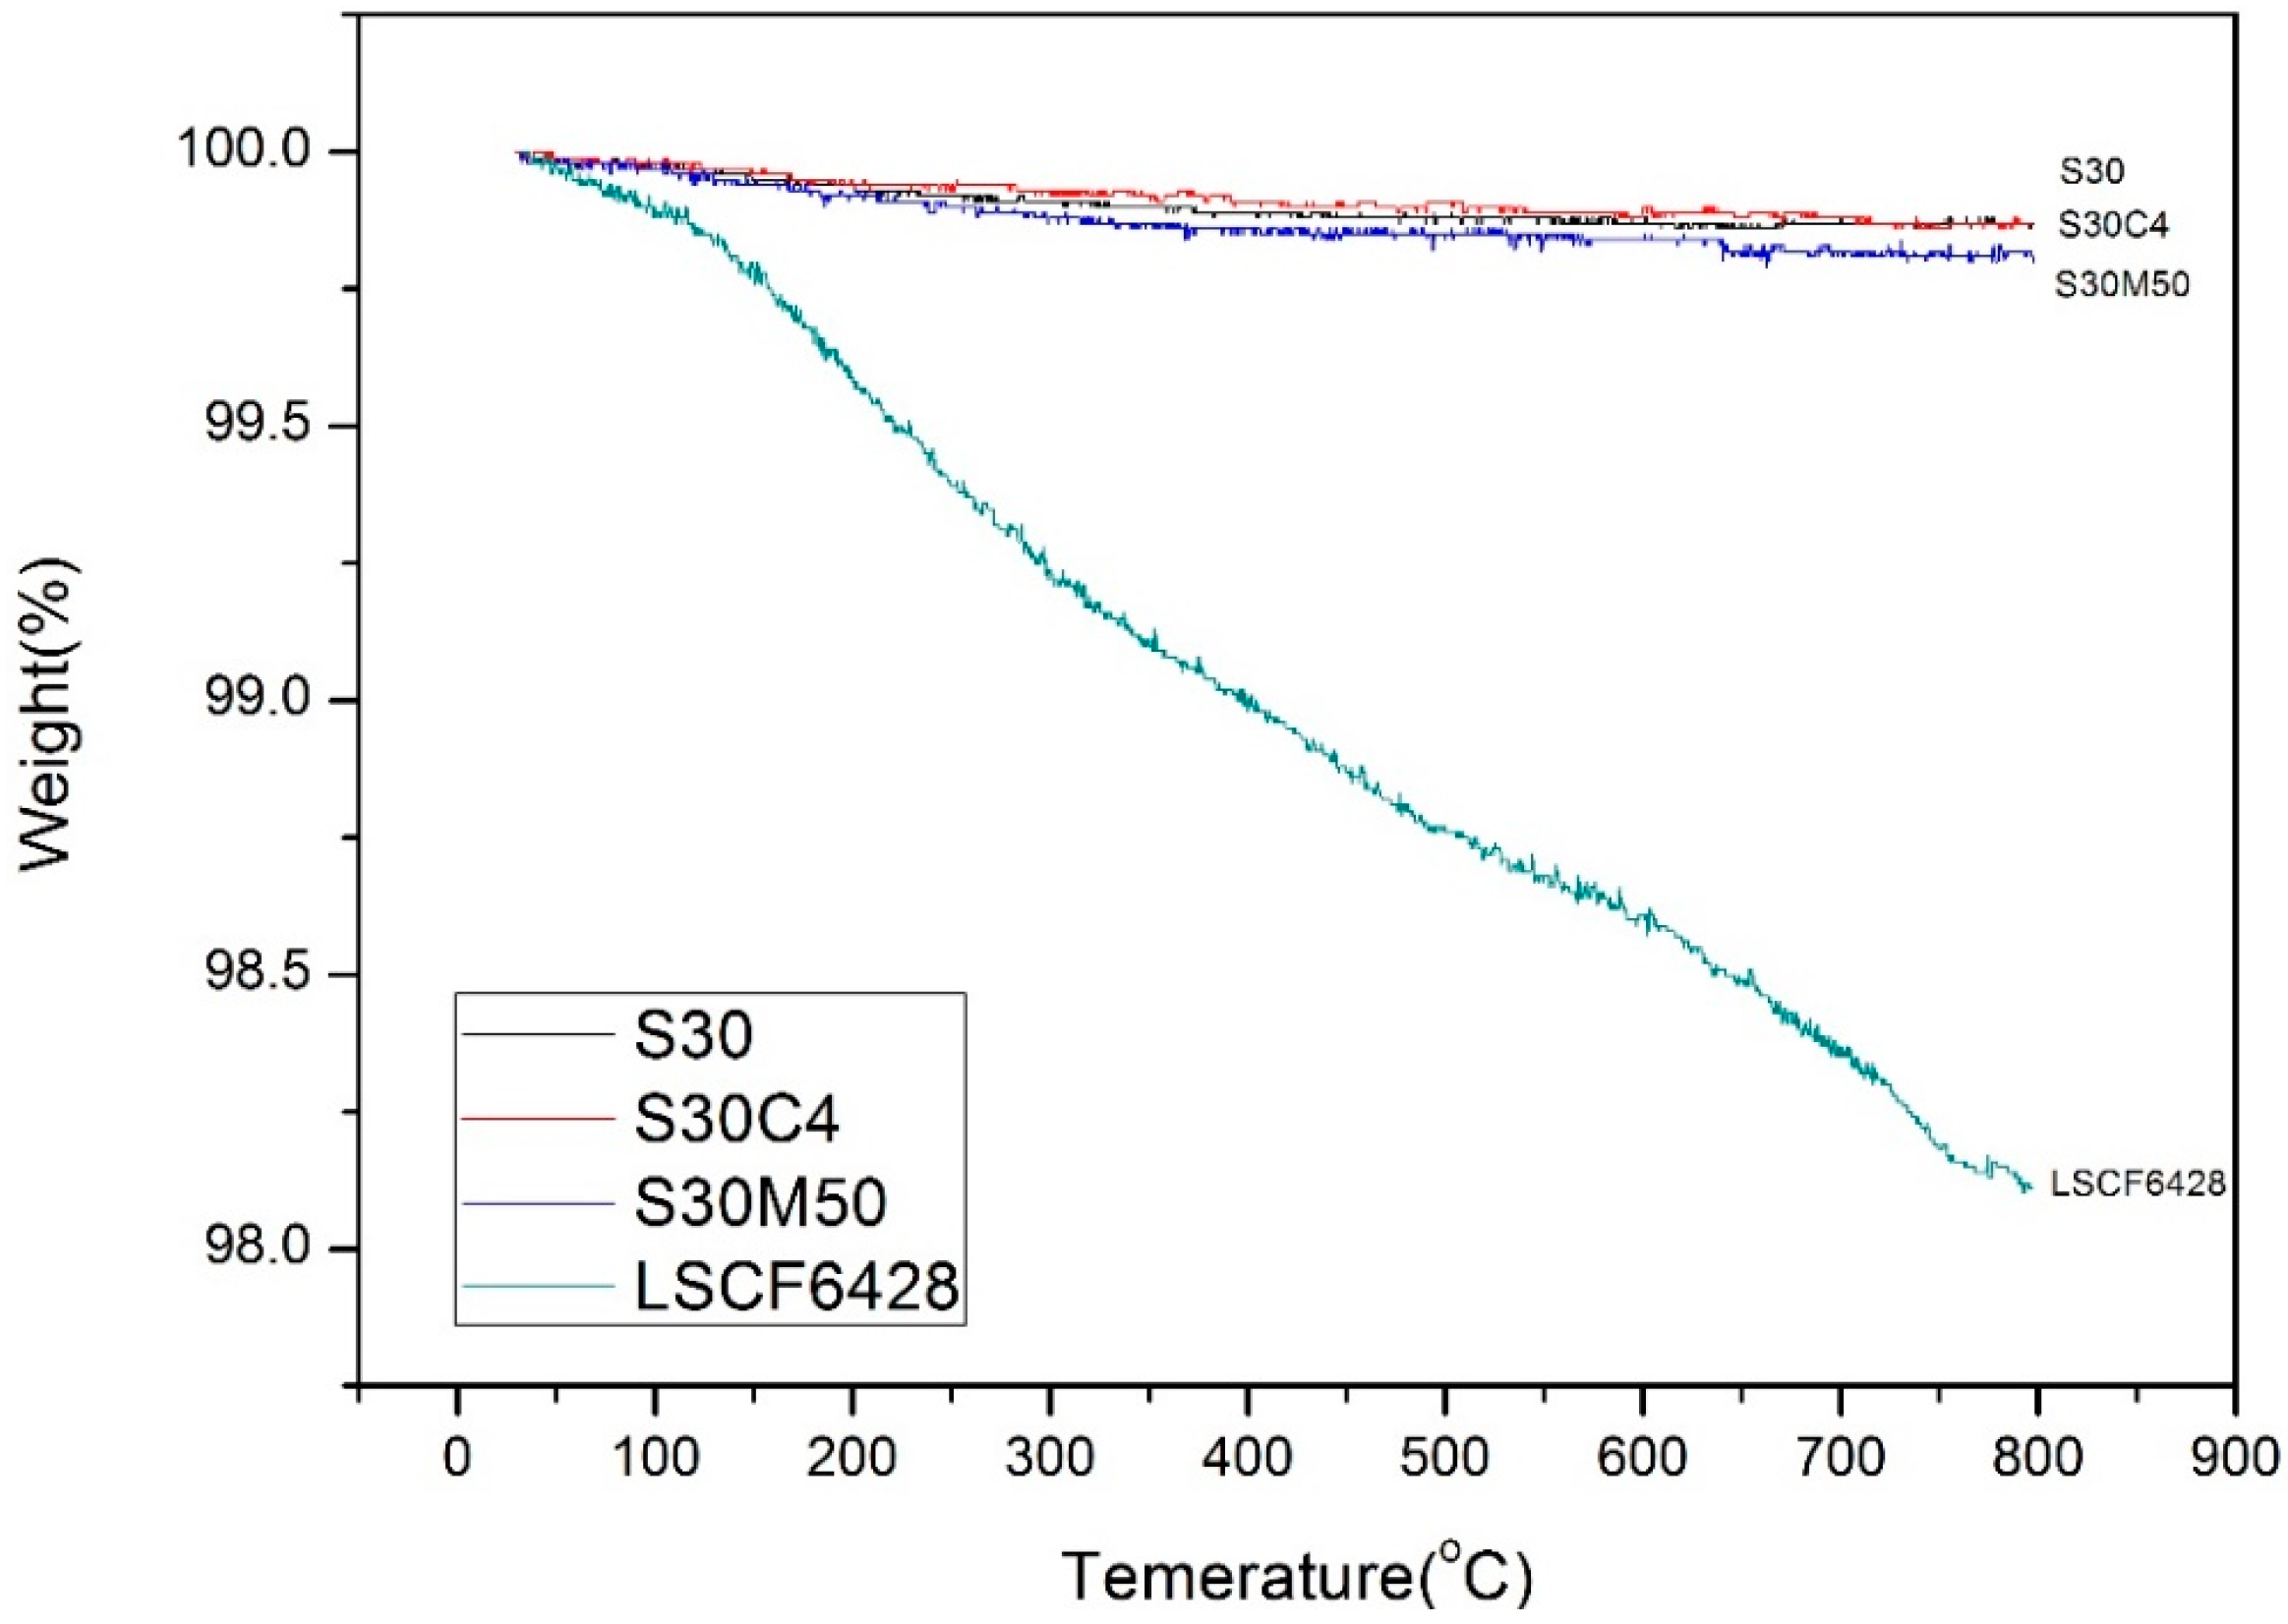
+ ion at 3 keV for a selected period (0 s–180 s). Thermo-gravimetric analysis (TGA) was conducted for estimating the oxygen non-stoichiometry of the ferrite samples using a TA Q600 instrument (SDT Q600, TA Waters LLC, New Castle, DE, USA). The samples underwent through careful drying and sintering steps before the XPS and TGA tests.

5. Conclusions

Single-phase doped (Bi,Sr)FeO3−δ materials were synthesized and displayed interesting mixed electronic and ionic conductivities at temperatures up to 800 °C. The electric conductivity of SxCy (x = 0–30, y = 0–5) shows two-stage temperature dependence, but the others (x = 40–50, y = 10–20) show only one-stage dependence. However, for the ionic conductivity of Sx and SxCy samples, the dependence follows only one Ea 1.24 ± 0.06 eV to the entire temperature region 300–800 °C, which is lower than that (1.32–1.34 eV) of LSCF cathodes [11].
The solubility limit of Ni in S30 is 0.03, but there is no limit for Mn up to 0.50 to keep the single perovskite phase. Three samples, doped S30, S30N3 and S30M50, show CTE values ranging between 12.8 × 10⁻⁶ and 13.7 × 10⁻⁶ K−1, which are close to that of zirconia- or ceria-based electrolyte.
The results of the valence state of Fe by XPS show the fraction of Fe3+ and Fe4+ are in a ratio of 0.47 vs. 0.53 in S30M50 at room temperature. Similar XPS analysis on the Mn shows divalent and trivalent Mn ions appear in nearly equal quantity (0.46 vs. 0.44). Both B-site ions in equal quantity are favored for the double-exchange conduction of electrons along the Fe(Mn)O6 octahedral chains in the perovskite structure at lower temperature. At temperatures greater than 400 °C, the oxygen vacancies in BSF samples increase by more than a few percentages, and result in not only an interruption of the double-exchange mechanism, but also enhancement of a small-polaron conduction by the help in neighboring oxygen vacancies.
One of the structural factors, specific free volume (Vsf) for BSFM materials, offers 10% more free space than LSCF6428 and may result in a better diffusive mobility of oxygen/vacancy in BSF materials at higher temperature.
All doped BSFs show similar two-stage temperature dependence of conductivity: when lower than the transition temperature (Ttr), all samples show similar double-exchange conductive mechanism with an activation energy of 0.54–0.59 eV·mol−1 or 0.37–0.44 eV·mol−1. At temperatures higher than Ttr, the conductive mechanism relies on a few percent concentration of oxygen vacancies, offering the exchange media to electrons to hop between small polarons ( e : V O 2 + ). This allows the cells with Co-doped S50C20 to reach a maximum power density of 406 mW·cm−2, with 15% being better than the cell with LSCF6428 testing at 800 °C.

Acknowledgments

The authors like to thank the funding from Ministry of Science and Technology (MOST) in Taiwan by contract No. NSC101-2221-E-090-MY2 and MOST 104-2221-E-002-104. The work on the Cobalt-solubility limit prepared by Yu-Han Chen and re-drawing of several figures by Chieh Chiu is also appreciated.

Author Contributions

Wen-Cheng J. Wei conceived, conducted and supervised the research work; Dan Wang performed the experiments on Mn and Ni-doped system; and Der-Rong Huang conducted the work on Co-doped BSFC system and helped the analysis of the data.

Conflicts of Interest

The authors declare no conflicts of interest. The founding sponsor (MOST) had no role in the design of the study; in the collection, analyses, or interpretation of data; in the writing of the manuscript, and in the decision to publish the results.

Appendix A

Figure A1. XPS Fe 2p3/2 spectra of the S30 surface been pre-etched by Ar+ for specified period, where 0 s means no Ar+ etching.
Materials 09 00922 g012
Figure A2. XPS spectra of Fe 2p3/2 of the polished surface of S30 after Ar+ been etched for 0 s, 5 s, 20 s, and 180 s.
Materials 09 00922 g013
Figure A3. TGA and oxygen deficient (Δδ) curve of: (a) S30; (b) S30C4; and (c) S30M50 measured from room temperature to 800 °C.
Materials 09 00922 g014aMaterials 09 00922 g014b

References

  1. Wachsman, E.D.; Lee, K.T. Lower the temperature of solid oxide fuel cells. Science 2011, 334, 935–939. [Google Scholar] [CrossRef] [PubMed]
  2. Ralph, J.M.; Rossignol, C.; Kumar, R. Cathode materials for reduced- temperature SOFCs. J. Electrochem. Soc. 2003, 150, A1518–A1522. [Google Scholar] [CrossRef]
  3. Chen, Y.Y.; Wei, W.C.J. Processing and characterization of ultra-thin yttria stabilized zirconia (YSZ) electrolytic film for SOFC. Solid State Ion. 2006, 177, 351–357. [Google Scholar] [CrossRef]
  4. Zhou, W.; Ran, R.; Shao, Z.P. Progress in understanding and development of Ba0.5Sr0.5Co0.2Fe0.8O3−δ–based cathode for intermediate-temperature solid oxide fuel cells: A review. J. Power Sources 2009, 192, 231–246. [Google Scholar] [CrossRef]
  5. Shao, Z.P.; Haile, S.M. A high-performance cathode for the next generation of solid oxide fuel cells. Nature 2004, 431, 170–173. [Google Scholar] [CrossRef] [PubMed]
  6. Lee, K.T.; Manthiram, A. A comparison of Ln0.6Sr0.4CoO3−δ (Ln = La, Pr, Nd, Sm, and Gd) as cathode materials for intermediate temperature solid oxide fuel cells. J. Electrochem. Soc. 2006, 153, A794–A798. [Google Scholar] [CrossRef]
  7. Kim, J.H.; Manthiram, A. LnBaCo2O5 oxides as cathodes for intermediate- temperature solid oxide fuel cells. J. Electrochem. Soc. 2008, 155, B358–B390. [Google Scholar]
  8. Tai, L.W.; Nasrallah, M.M.; Anderson, H.U.; Sparlin, D.M.; Sehlin, S.R. Structure and electrical-properties of La1−xSrxCo1−yFeyO3. Part 2. The system La1−xSrxCo0.2Fe0.8O3. Solid State Ion. 1995, 76, 273–283. [Google Scholar] [CrossRef]
  9. Petric, A.; Huang, P.; Tietz, F. Evaluation of La-Sr-Co-Fe-O perovskites for SOFC and gas separation membranes. Solid State Ion. 2000, 135, 719–725. [Google Scholar] [CrossRef]
  10. Tsipis, E.V.; Kharton, V.V. Electrode materials and reaction mechanisms in SOFCS: A brief review. J. Solid State Electron. 2008, 12, 1367–1391. [Google Scholar] [CrossRef]
  11. Ullmann, H.; Trofimenko, N.; Tietz, F.; Stove, D.; Ahmad-Khanlou, A. Correlation between thermal expansion and oxide ion transport in mixed conducting perovskite-type oxides for SOFC cathodes. Solid State Ion. 2000, 138, 79–90. [Google Scholar] [CrossRef]
  12. Shao, J.P.; Tao, Y.; Wang, J.X.; Xu, C.; Wang, W.G. Investigation of precursors in the preparation of nanostructured LSCF6428 via a modified combined complexing method. J. Alloys Compd. 2009, 484, 263–267. [Google Scholar] [CrossRef]
  13. Brinkman, K.; Iijima, T.; Takamura, H. The oxygen permeation characteristics of Bi1−xSrxFeO3 mixed ionic and electronic conducting ceramics. Solid State Ion. 2010, 181, 53–58. [Google Scholar] [CrossRef]
  14. Niu, Y.J.; Zhou, W.; Sunarso, J.; Ge, L.; Zhu, Z.H.; Shao, Z.P. High performance cobalt-free perovskite cathode for intermediate temperature SOFCs. J. Mater. Chem. 2010, 20, 9619–9622. [Google Scholar] [CrossRef]
  15. Niu, Y.J.; Sunarso, J.; Zhou, W.; Liang, F.L.; Ge, L.; Zhu, Z.H.; Shao, Z.P. Evaluation and optimization of Bi1−xSrxFeO3−δ perovskites as cathodes of solid oxide fuel cells. Int. J. Hydrogen Energy 2011, 36, 3179–3186. [Google Scholar] [CrossRef]
  16. Niu, Y.J.; Sunarso, J.; Liang, F.L.; Zhou, W.; Zhu, Z.H.; Shao, Z.P. A comparative study of oxygen reduction on Bi- and La-doped SrFeO3−δ perovskite cathodes. J. Electrochem. Soc. 2011, 158, B132–B138. [Google Scholar] [CrossRef]
  17. Wedig, A.; Merkle, R.; Stuhlhofer, B.; Habermeier, H.-U.; Maier, J.; Heifets, E. Fast oxygen exchange kinetics of pore-free Bi1−xSrxFeO3−δ thin film. Phys. Chem. Chem. Phys. 2011, 13, 16530–16533. [Google Scholar] [CrossRef] [PubMed]
  18. Wedig, A.; Merkle, R.; Stuhlhofer, B.; Habermeier, H.-U.; Heifets, E.; Maier, J. Searching for fast oxygen exchange kinetics: (Bi,Sr)(Fe,Co)O3−δ perovskite. J. Electrochem. Soc. 2012, 45, 213–214. [Google Scholar]
  19. Maso, N.; West, A.R. Electrical properties of Ca-doped BiFeO3 ceramics: From p-type semiconduction to oxide-ion conduction. Chem. Mater. 2012, 24, 2127–2131. [Google Scholar] [CrossRef]
  20. Baek, D.; Kamegawa, A.; Takamura, H. Mixed conductivity and electrode properties of Mn-doped Bi-Fr-Fe-based perovskite-type oxides. Solid State Ion. 2013, 253, 211–216. [Google Scholar] [CrossRef]
  21. Wedig, A.; Merkle, R.; Maier, J. Oxygen exchange kinetics of (Bi,Sr)(Co,Fe)O3−δ thin-film microelectrodes. J. Electrochem. Soc. 2014, 161, F23–F32. [Google Scholar] [CrossRef]
  22. Mizusaki, J.; Yonemura, Y.; Kamata, H.; Ohyama, K.; Mori, N.; Takai, H.; Tagawa, H.; Doyiya, M.; Naraya, K.; Sasamoto, T.; et al. Electronic conductivity, Seebeck coefficient, defect and electronic structure of non-stoichiometric La1−xSrxMnO3. Solid State Ion. 2000, 132, 167–180. [Google Scholar] [CrossRef]
  23. Tuller, H.L.; Nowick, A.S. Small polaron electron transport in reduced CeO2 single crystals. J. Phys. Solid 1977, 38, 859–867. [Google Scholar] [CrossRef]
  24. Duran, A.; Verdin, E.; Escamilla, R.; Morales, F.; Escudero, R. Mechanism of small-polaron formation in the biferroic YCrO3 doped with cacium. Mater. Chem. Phys. 2012, 133, 1011–1017. [Google Scholar] [CrossRef]
  25. Taguchi, H.; Hirata, K.; Kido, H.; Takeda, Y.; Kato, M.; Hirota, K. Hopping conductivity of distorted K2NiF4-type (Ca1+x)Nd1−x)CrO4. Solid State Ion. 2009, 11, 1222–1225. [Google Scholar]
  26. Taraoka, Y.; Zhang, H.M.; Okamoto, K.; Yamazoe, N. Mixed ionic-electronic conductivity of La1−xSrxCo1−yFeyO3−δ perovskite-type oxides. Mater. Res. Bull. 1988, 23, 51–58. [Google Scholar] [CrossRef]
  27. Chen, Y.H. Synthesis, Material and Electrical Conductivity Properties of Bi-Based Cathode for IT-SOFC. Master’s Thesis, National Taiwan University, Taipei, Taiwan, 2015. [Google Scholar]
  28. Jin, F.; Shen, Y.; Wang, R.; He, T. Double-perovskite PrBaCo2/3Fe2/3Cu2/3O5+δ as cathode material for intermediate-temperature solid-oxide fuel cells. J. Power Sources 2013, 234, 244–251. [Google Scholar] [CrossRef]
  29. Ghaffari, M.; Shannon, M.; Hui, H.; Tan, O.K.; Irannejad, A. Preparation, surface state and band structure studies of SrTi(1−x)Fe(x)O(3−δ) (x = 0–1) perovskite-type nano structure by X-ray and ultraviolet photoelectron spectroscopy. Surf. Sci. 2012, 606, 670–677. [Google Scholar] [CrossRef]
  30. Shi, C.; Qin, H.; Zhao, M.; Wang, X.; Li, L.; Hu, J. Investigation on electrical transport, CO sensing characteristics and mechanism for nanocrystalline La1−xCaxFeO3 sensors. Sens. Actuators B Chem. 2014, 190, 25–31. [Google Scholar] [CrossRef]
  31. Jin, F.; Xu, H.; Long, W.; Shen, Y.; He, T. Characterization and evaluation of double perovskites LnBaCoFeO5+δ (Ln = Pr and Nd) as intermediate-temperature solid oxide fuel cell cathodes. J. Power Sources 2013, 243, 10–18. [Google Scholar] [CrossRef]
  32. Chen, T.; Pang, S.; Shen, X.; Jiang, X.; Wang, W. Evaluation of Ba-deficient PrBa1−xFe2O5+δ oxides as cathode materials for intermediate-temperature solid oxide fuel cells. RSC Adv. 2016, 6, 13829–13836. [Google Scholar] [CrossRef]
  33. Zhang, L.; Zhou, Q.; He, Q.; He, T. Double-perovskites A2FeMoO6−δ (A = Ca, Sr, Ba) as anodes for solid oxide fuel cells. J. Power Sources 2010, 195, 6356–6366. [Google Scholar] [CrossRef]
  34. Brundle, C.R.; Chuang, T.J.; Wandelt, K. Core and valence level photoemission studies of iron oxide surfaces and the oxidation of iron. Surf. Sci. 1977, 68, 459–468. [Google Scholar] [CrossRef]
  35. Chung, C.F.; Lin, J.P.; Wu, J.M. Influence of Mn and Nb dopants on electric properties of chemical-solution-deposited BiFeO3 films. Appl. Phys. Lett. 2006, 88, 242909. [Google Scholar] [CrossRef]
  36. Richter, J.; Holtappels, P.; Graule, T.; Nakamura, T.; Gauckler, L.J. Materials design for perovskite SOFC cathodes. Monatsh. Chem. 2009, 140, 985–999. [Google Scholar] [CrossRef]
  37. Huang, T.-J. Bismuth-Based Perovskite as Cathode Materials for Intermediate-Temperature Solid Oxide Fuel Cells. Master’s Thesis, National Taiwan University, Taipei, Taiwan, 2013. [Google Scholar]
  38. Goldschmidt, V.; Barth, T.; Lunde, G.; Zachariasen, W.H. Geochemical distribution law of the elements. VII Summary of the Chemistry of Crystals. Skr. Nor. Vidensk. Akad. 1926, 1, 1–117. [Google Scholar]
  39. Shannon, R.D. Revised effective ionic radii and systematic studies of interatomic distances in halides and chalcogenides. Acta Crystallogr. Sect. A 1976, 32. [Google Scholar] [CrossRef]
  40. Atou, T.; Chiba, H.; Ohoyama, K.; Yamaguchi, Y.; Syono, Y. Structure determination of ferromagnetic perovskite BiMnO3. J. Solid State Chem. 1999, 145, 639–642. [Google Scholar] [CrossRef]
  41. Fukunaga, O.; Fujita, T. The relation between ionic radii and cell volumes in the perovskite compounds. J. Solid State Chem. 1973, 8, 331–338. [Google Scholar] [CrossRef]
  42. Sammells, A.F.; Cook, R.L.; White, J.H.; Osborne, J.J.; Macduff, R.C. Rational selection of advanced solid electrolytes for intermediate temperature fuel-cells. Solid State Ion. 1992, 52, 111–123. [Google Scholar] [CrossRef]
  43. Hayashi, H.; Inaba, H.; Matsuyama, M.; Lan, N.G.; Dokiya, M.; Tagawa, H. Structural consideration on the ionic conductivity of perovskite-type oxides. Solid State Ion. 1999, 122, 1–15. [Google Scholar] [CrossRef]
  44. Patra, H.; Rout, S.K.; Pratihar, S.K.; Bhattacharya, S. Effect of process parameters on combined EDTA–citrate synthesis of Ba0.5Sr0.5Co0.8Fe0.2O3−δ perovskite. Powder Technol. 2011, 209, 98–104. [Google Scholar] [CrossRef]
Figure 1. XRD patterns of bismuth ferrites with different Sr-doping and Co-doping contents in the range of 2θ: (a) from 20° to 80°; and (b) from 30.5° to 33.5°. Note the (110)c peak of S10 sample after de-convoluted to two. The smaller one may belong to (104)r of a rhombohedral structure.
Materials 09 00922 g001
Figure 2. Arrhenius plot of: (a) electrical conductivity; and (b) ionic conductivity of SxCy bismuth ferrites with different Sr- and Co-doping.
Materials 09 00922 g002
Figure 3. Ionic conductivity at 800 °C of (Bi,Sr)FeO3 and (Bi,Sr)(CoFe)O3 plotted against CTE (room to 800 °C) and the data (dot line) of La-perovskites [11]. Note the numbers following LSCF are the proportion of the La, Sr, Co, Fe elements.
Materials 09 00922 g003
Figure 4. XRD patterns of: (a) Bi0.7Sr0.3Fe1−xNixO3 (S30Nx) with the impurity phase Bi2Fe4O9 powder (PDF#20-836); and (b) Bi0.7Sr0.3Fe1−xMnxO3 (S30Mx) calcined at 800–900 °C.
Materials 09 00922 g004
Figure 5. Arrhenius plot of electric conductivity of doped S30 as a function of the reverse of the testing temperature (1/T). The S30C4 results reported by Chen [27] are plotted in the diagram.
Materials 09 00922 g005
Figure 6. XPS spectra of: (a) Fe 2p3/2 of the polished surfaces of three S30, S30M50 and S30C4 samples; and (b) Mn 2p of the polished surface of the S30Mn50 after Ar+ etching for 5 s.
Materials 09 00922 g006
Figure 7. TGA curves of the S30, S30C4, S30M50 and LSCF6428 tested in air.
Materials 09 00922 g007
Figure 8. Output voltage and power density of the cells: (a) with the LSFC; and (b) with S50C20 cathode as a function of current density.
Materials 09 00922 g008
Figure 9. Schematic diagram of a perovskite structure and the triangle consisted of two A/one B atoms showing the vacancy-oxygen ion exchange vector perpendicular to the triangular plane.
Materials 09 00922 g009
Figure 10. Ionic radius of Bi3+ with different coordination number (the solid points were obtained from Shannon [39] while the holly-square point is calculated from a linear relationship). Two data points (Atou [40] and Chen [27]) are plotted as well.
Materials 09 00922 g010
Figure 11. Schematic diagram of the four-probe DC method used for ionic conductivity measurement.
Materials 09 00922 g011
Table 1. Abbreviations and properties of Bi1−xSrxFeO3 (x = 0.1 to 0.5) and Bi0.5Sr0.5CoyFe1−yO3 (y = 0 to 0.2).
SrO-Doping (Sx-Series)AbbreviationSintering Temperature (°C) for 5 hSintered Density (% T.D.)CTE
Bi0.9Sr0.1FeO3S1095096.410.0
Bi0.8Sr0.2FeO3S20100095.911.5
Bi0.7Sr0.3FeO3S30100095.513.6
Bi0.6Sr0.4FeO3S40105095.314.3
Bi0.5Sr0.5FeO3S50105095.115.1
SrO- and CoO-Doping (SxCy-Series)AbbreviationSintering Temperature (°C) for 5 hSintered Density (% T.D.)CTE
Bi0.5Sr0.5Fe0.95 Co0.05O3S50C5100095.115.4
Bi0.5Sr0.5Fe0.9 Co0.1O3S50C1095095.316.9
Bi0.5Sr0.5Fe0.8 Co0.2O3S50C2095096.019.3
Table 2. Activation energy of electrical conductivity calculated from Arrhenius plots of electrical conductivity of Bi1−xSrxFeO3 (x = 0.1 to 0.5) and Bi0.5Sr0.5CoyFe1−yO3 (y = 0 to 0.2).
CompositionEa(HT) (eV)Ea(LT) (eV)Ttr (°C)
S100.480.70527
S200.270.65523
S300.240.57516
S400.220.48506
S500.210.40502
S50C50.200.38497
S50C100.31-NA
S50C200.25-NA
Table 3. Activation energies at LT and HT, and the temperature of turning-point of doped S30.
CompositionEa(LT) (eV)Ea(HT) (eV)Ttr (°C)
S300.570.24516
S30N030.540.36431
S30C4 [27]0.590.25496
S30M100.441.09489
S30M500.371.09396
Note LT: low temperature region; HT: high temperature region.
Table 4. Molecular weight, mass loss and oxygen non-stoichiometry (Δδ) of S30, S30C4, S30M50 and LSCF6428 at 800 °C.
Formula of the Doped S30 at 25 °CMsampleMoxygenΔm/msΔδ
Bi0.7Sr0.3FeO2.95275.61716.00.13%0.022
Bi0.7Sr0.3Fe0.96Co0.04O2.97276.06016.00.13%0.022
Bi0.7Sr0.3Fe0.5Mn0.5O2.88274.04716.00.20%0.034
La0.4Sr0.4Co0.2Fe0.8O3−δ222.86216.01.89%0.26
Table 5. Ionic radii of cation used for calculation of the geometry factors [39].
PropertiesA SiteB SiteO2−
La3+Sr2+Bi3+Mn3+ aFe3+ aCo3+Ni3+
Ionic radius unit: Å1.361.441.45 b0.6450.6450.5450.561.40
1.37 c
CN12121266666
Atomic mass138.9087.62209.054.9455.8558.9358.6916.0
Note a High spin; b Calculated from Figure 10; c Referenced from Chen [27].
Table 6. Calculated tolerance factor, critical radius and specific free volume of LSCF6428, S30, S30N3, and S30M50 cathode materials.
CompositionTolerance Factor, SCritical Radius, rcr (Å)Specific Free Volume, Vsf (%)
La0.6Sr0.4Co0.2Fe0.8O30.9750.91020.1
Bi0.7Sr0.3FeO30.9840.90222.6
Bi0.7Sr0.3Fe0.97Ni0.03O30.9860.90122.5
Bi0.7Sr0.3Fe0.5Mn0.5O30.9840.90222.6

