
Characterization of a Polyacrylamide Solution Used for Remediation of Petroleum Contaminated Soils


Abstract
:1. Introduction
2. Literature Review
2.1. Remediation of Petroleum Contaminated Soil
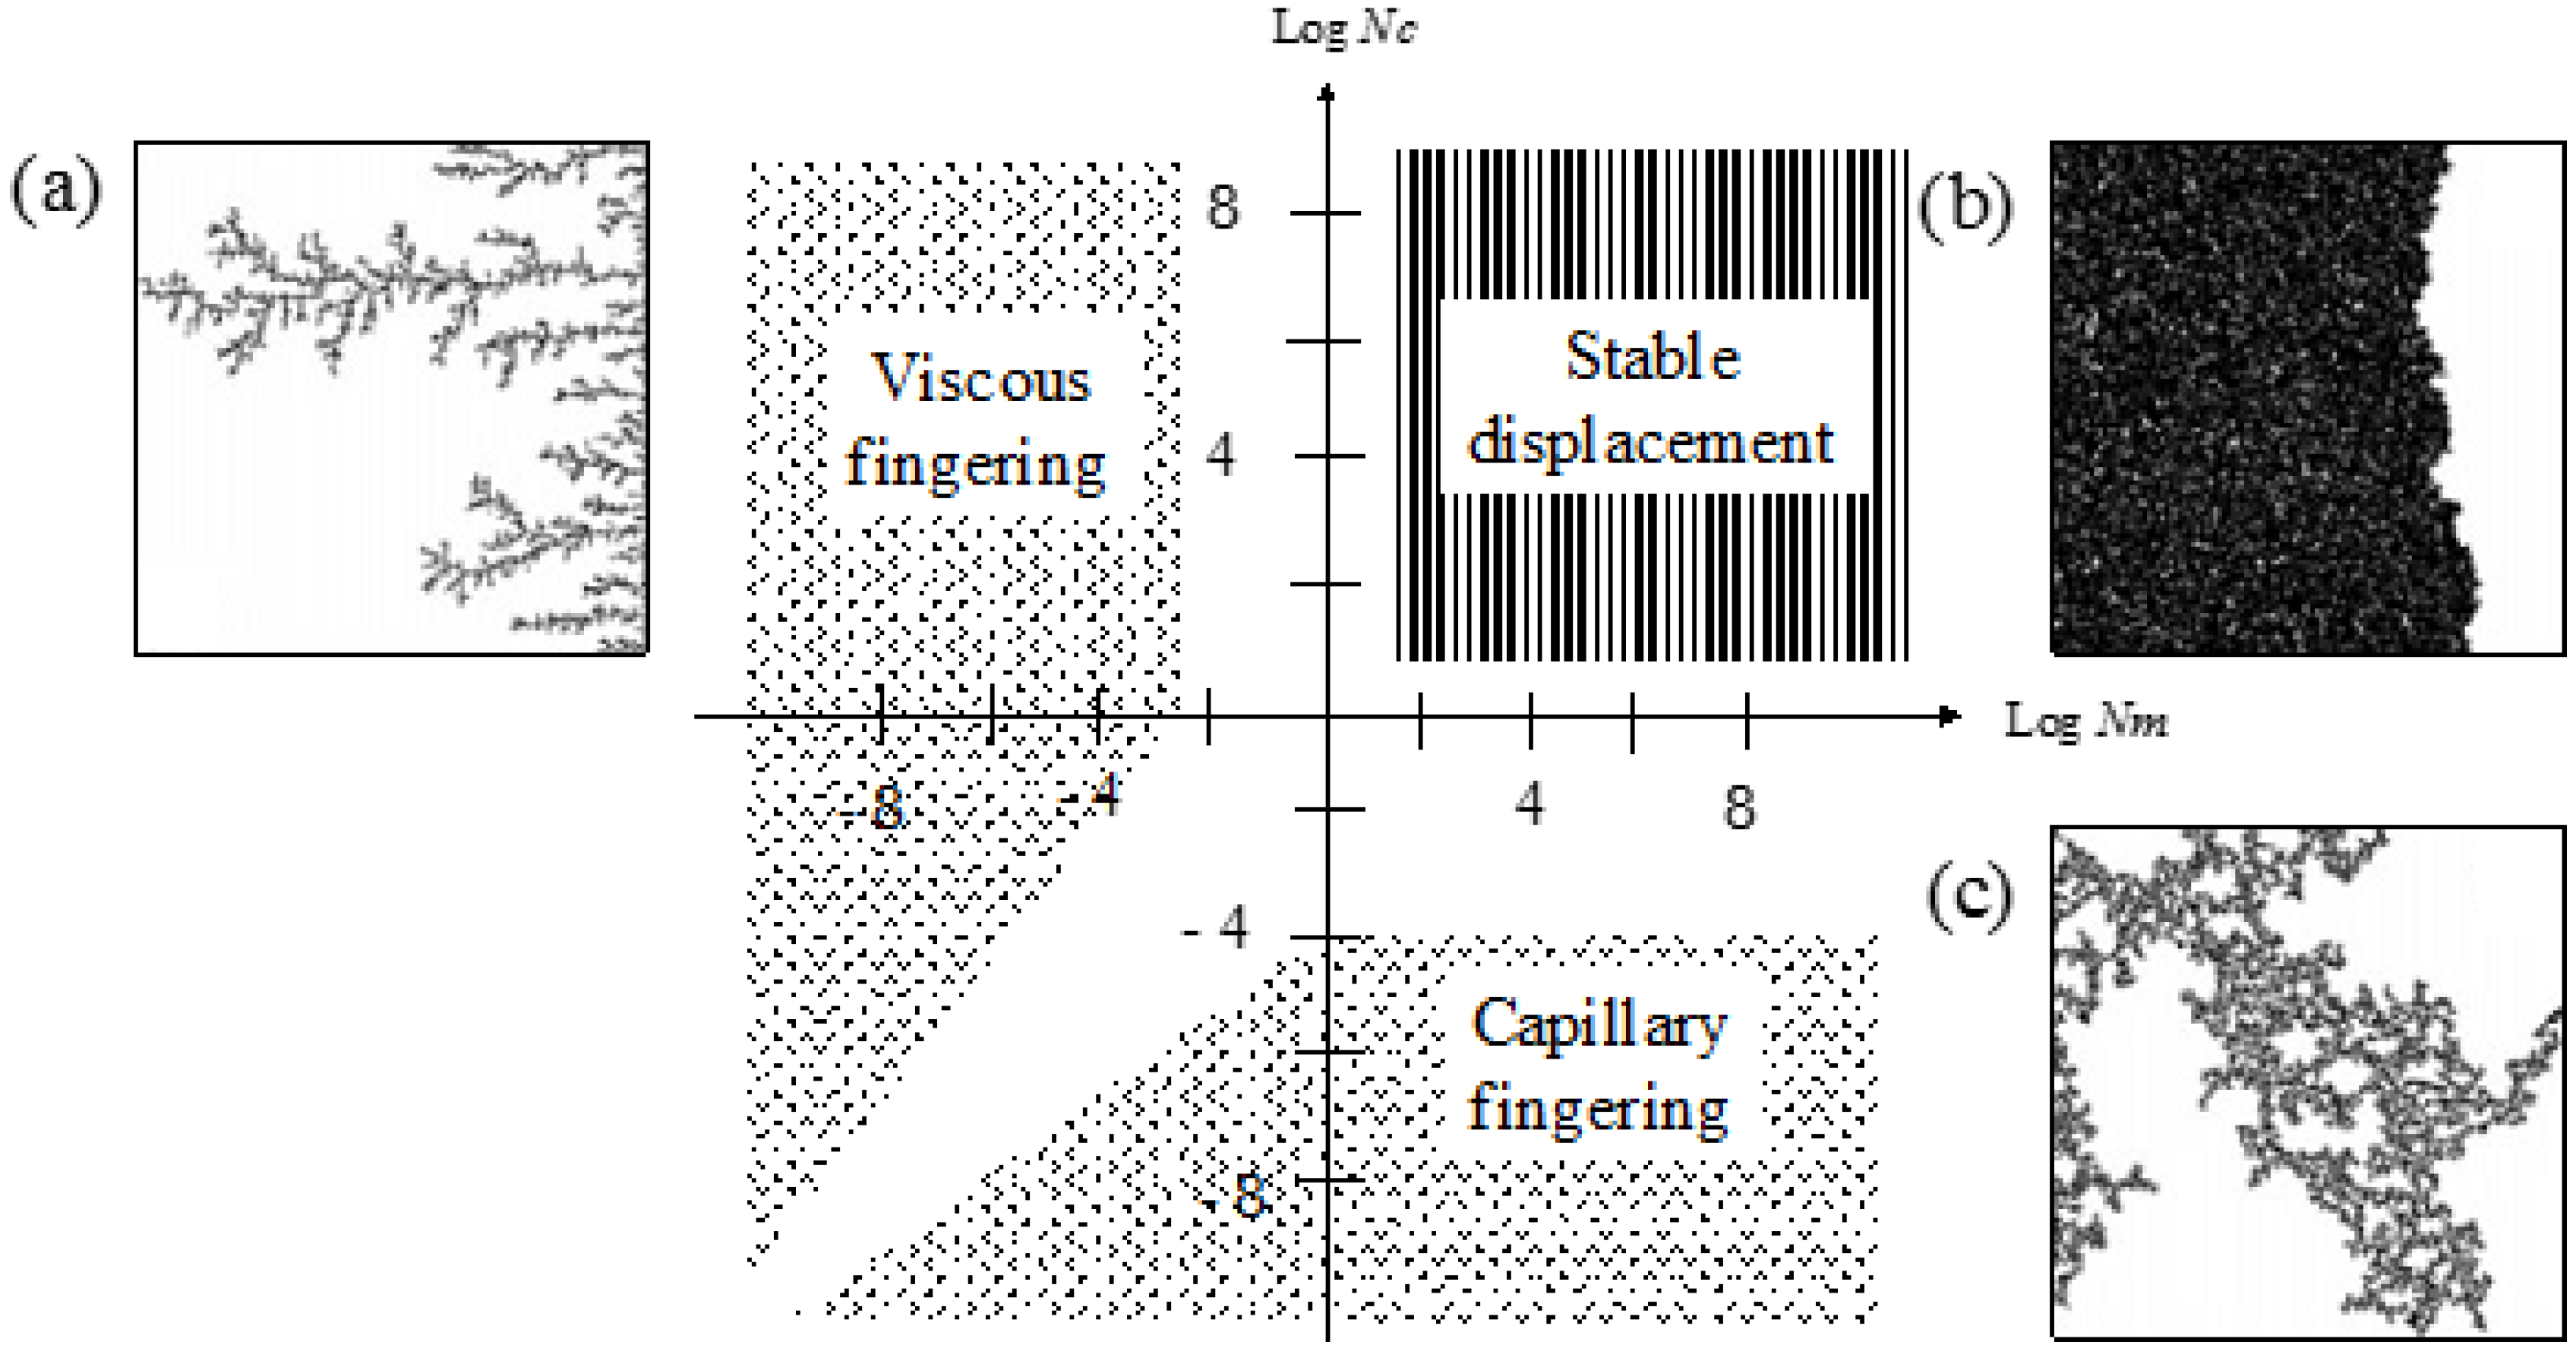
2.2. Multiphase Fluid Flow
3. Experimental Program


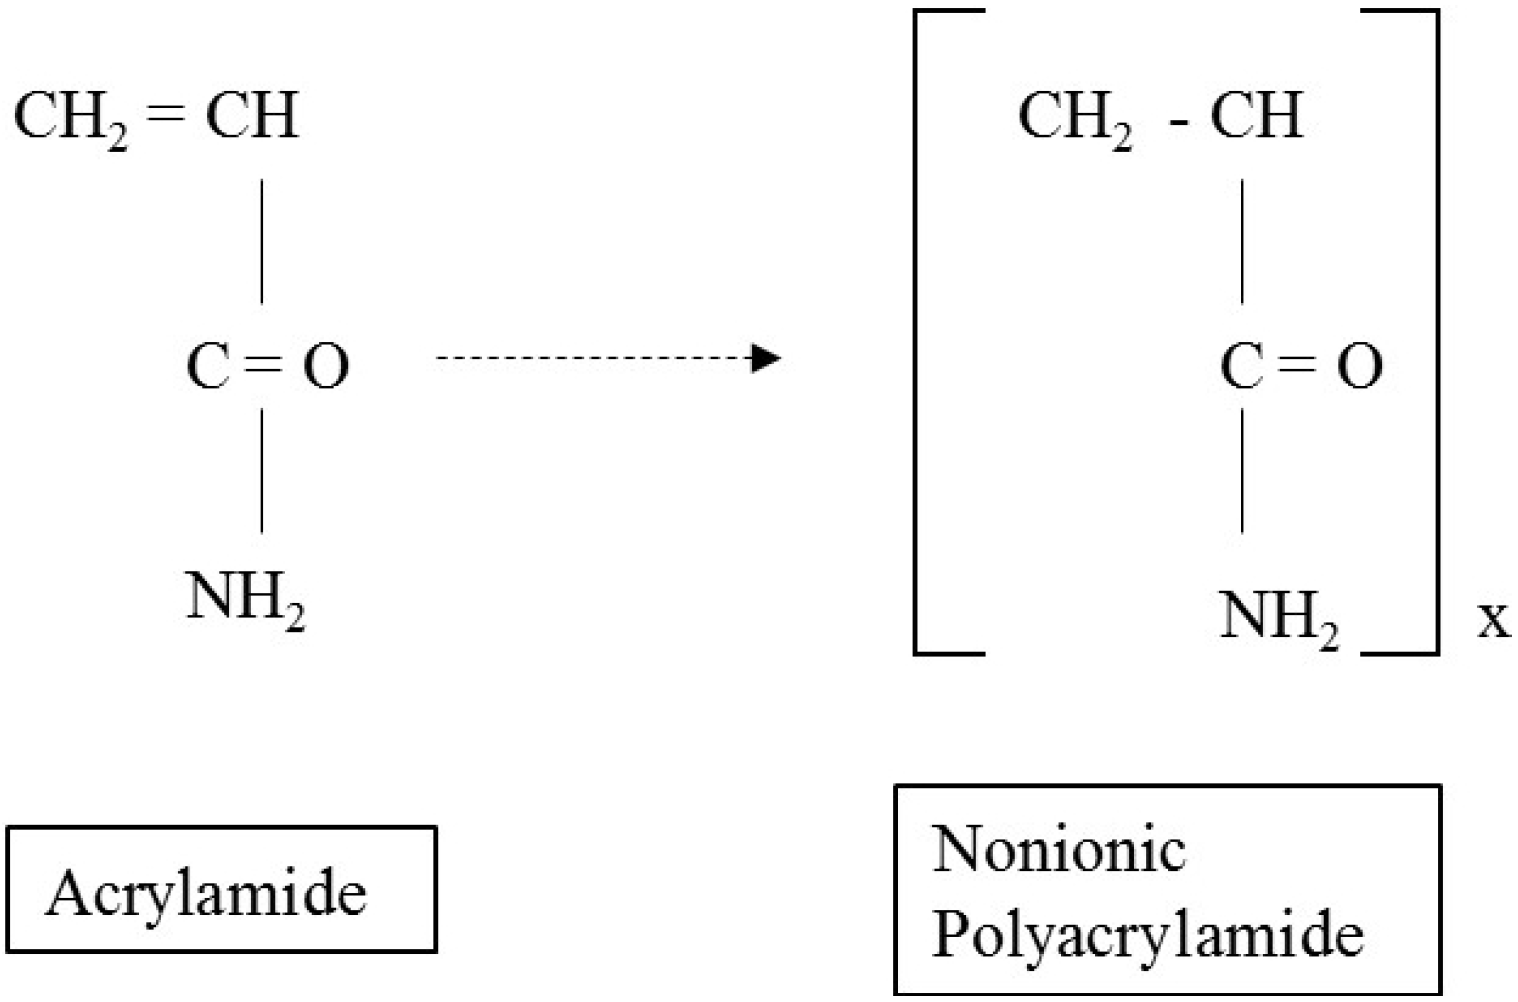
| Label | Name | Chemical Composition |
|---|---|---|
| PAM | Polyacrylamide | (C3H5NO)n |
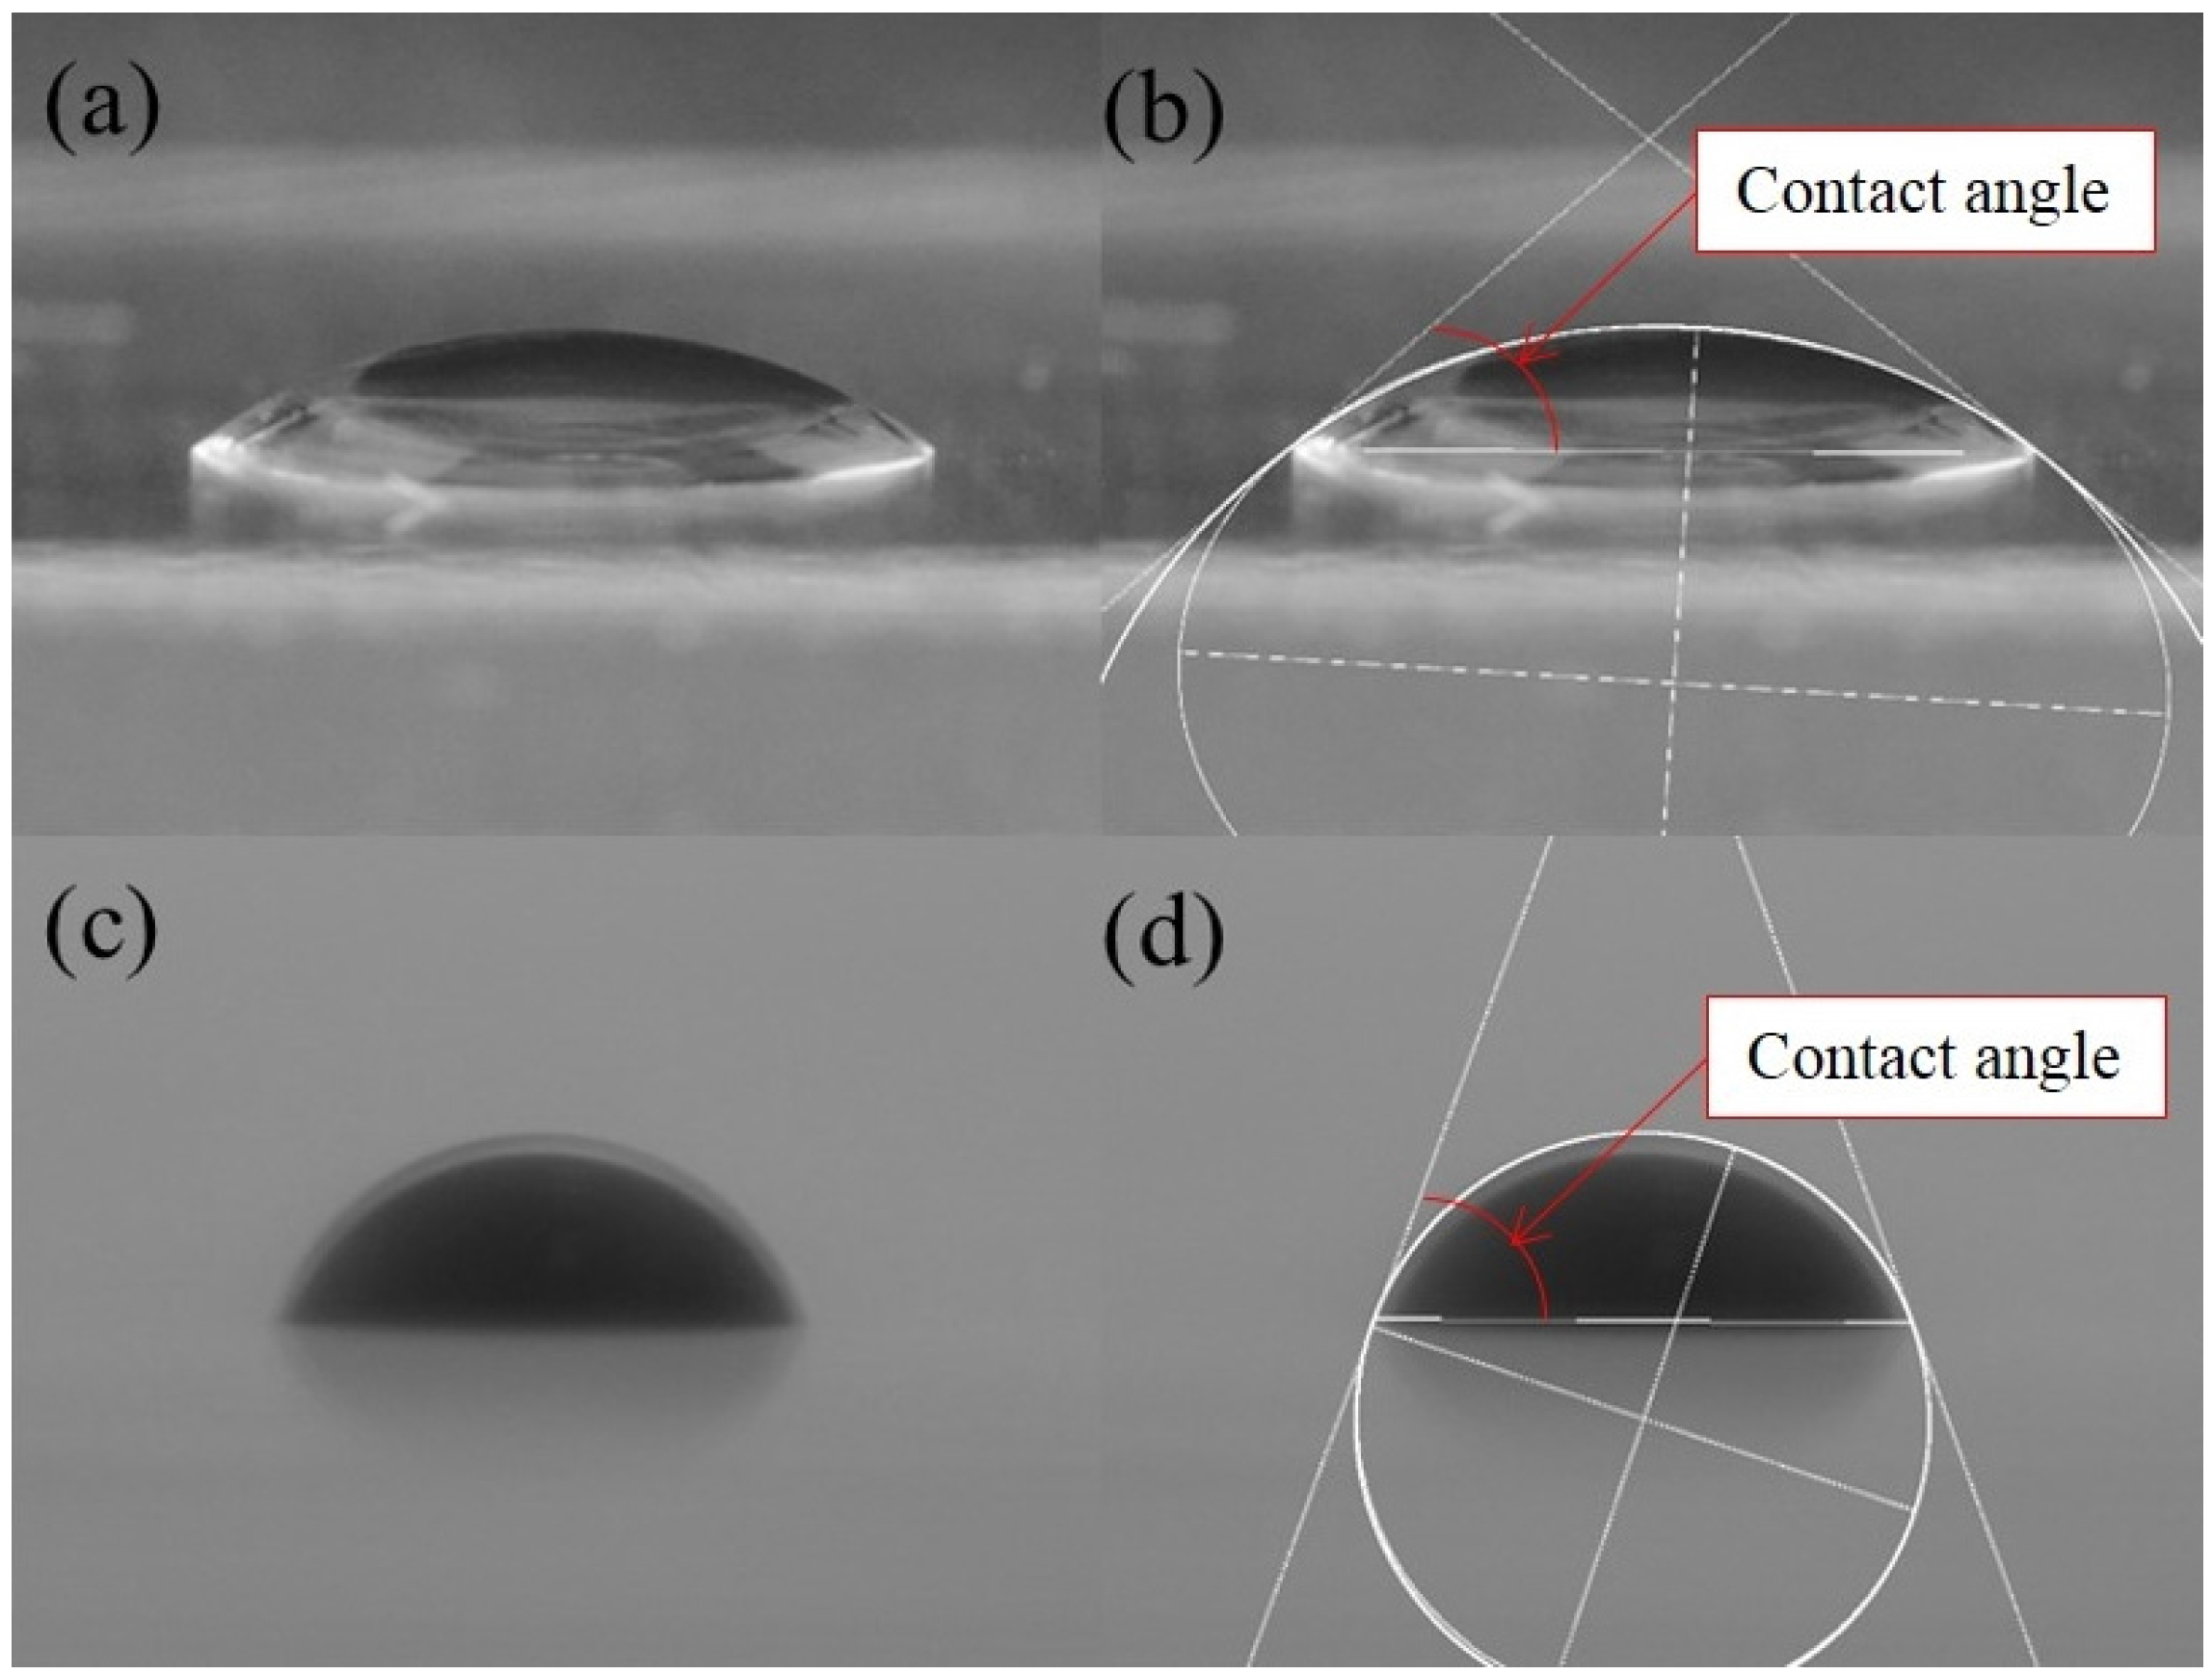
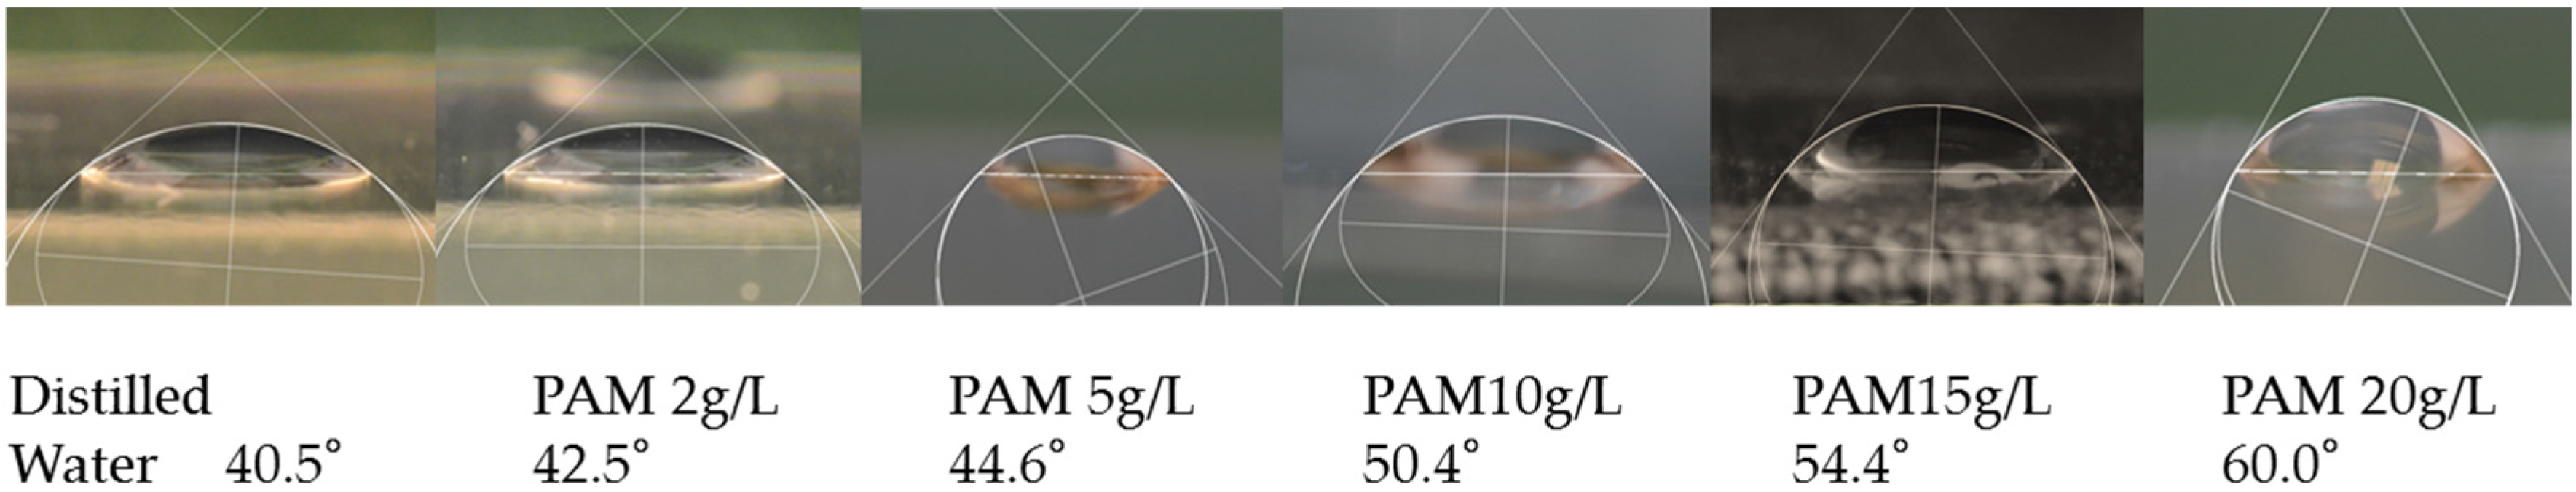
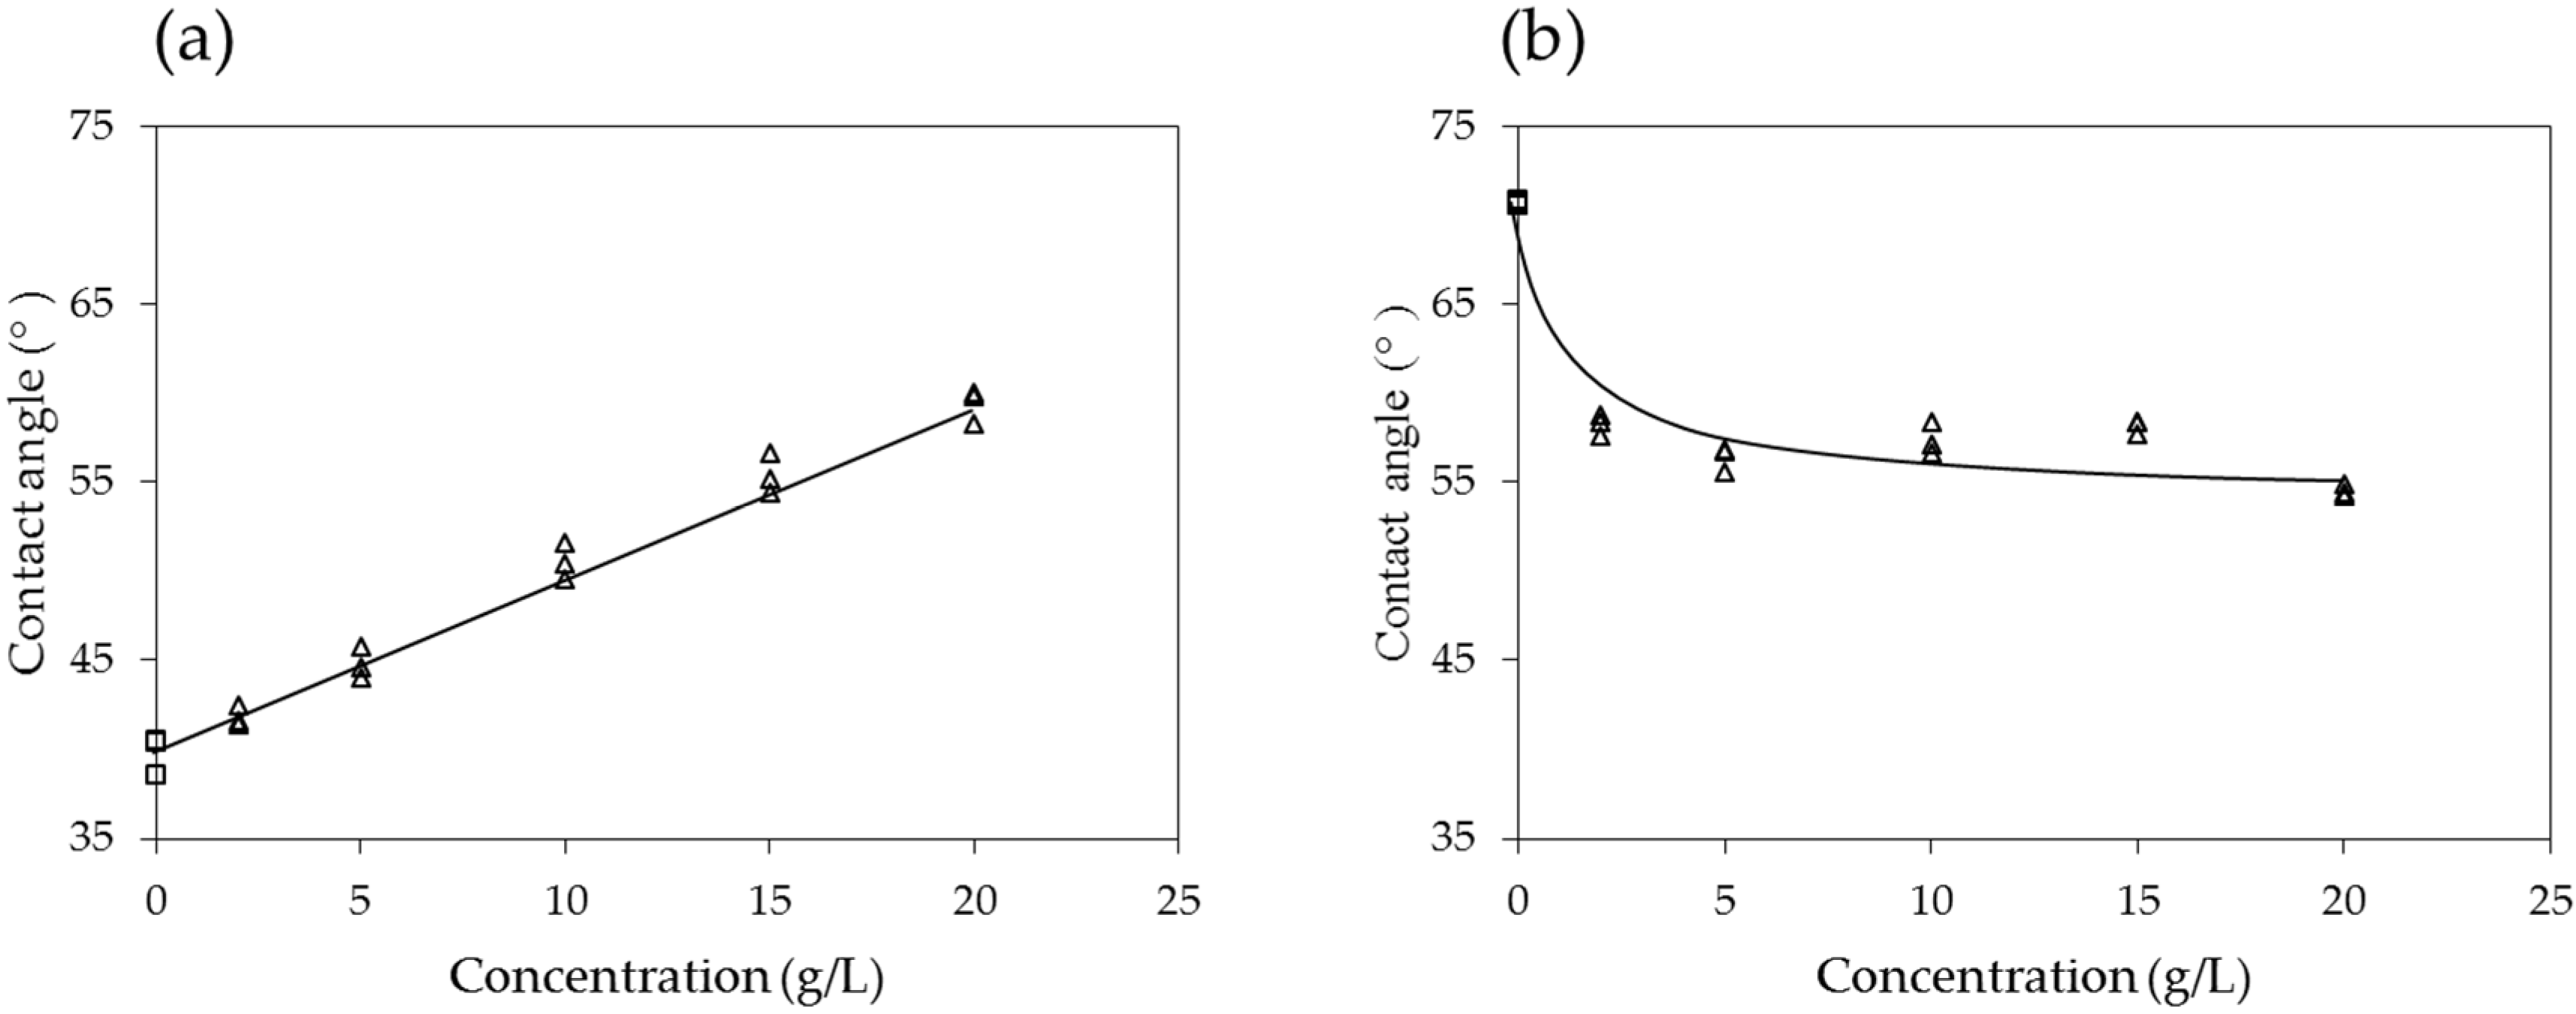
3.1. Contact Angle

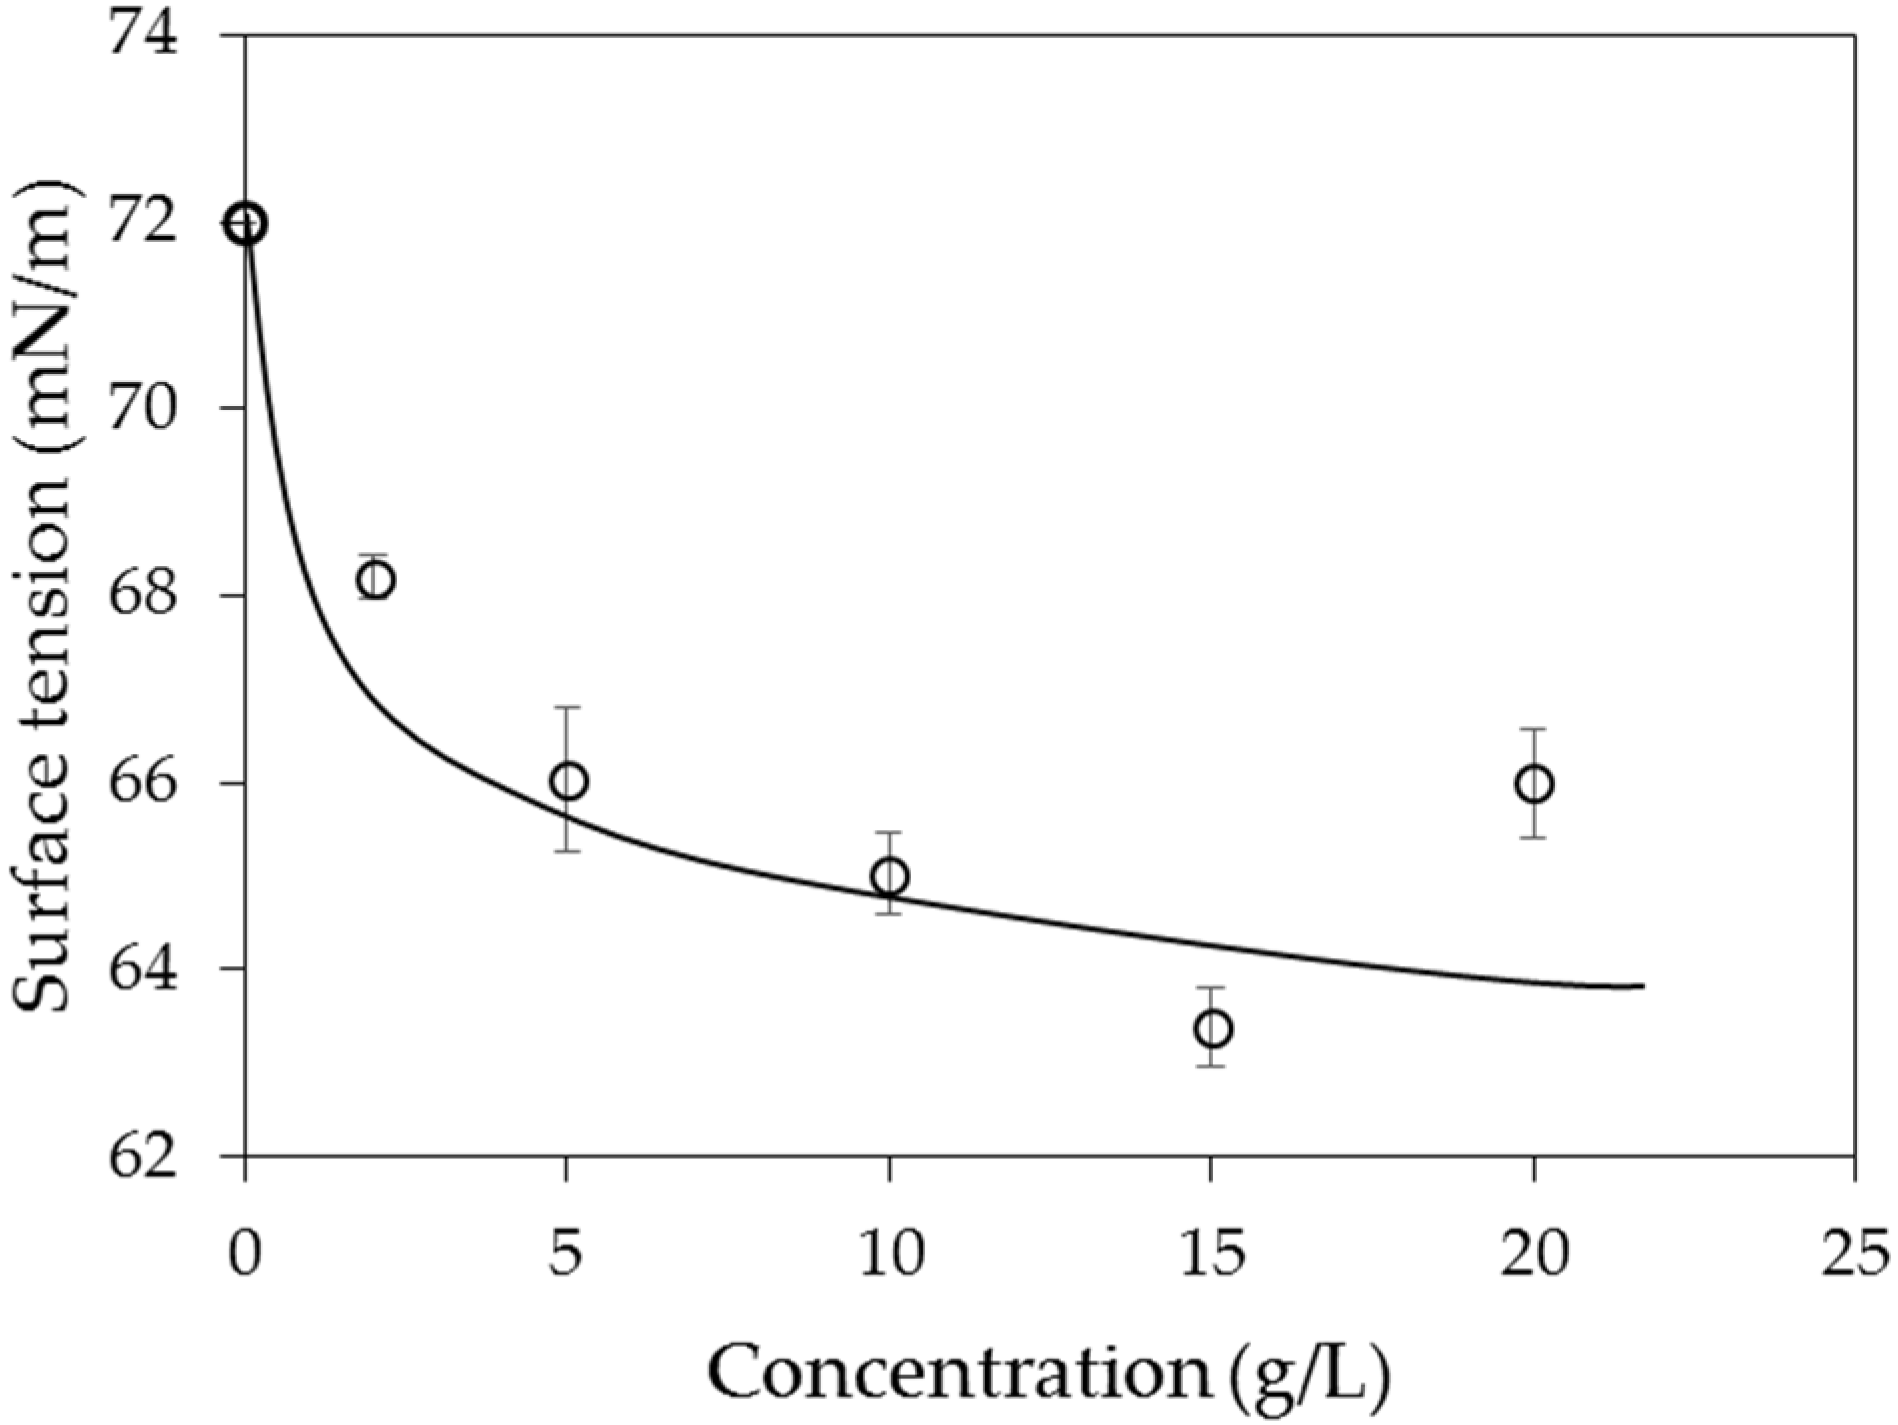
3.2. Surface Tension
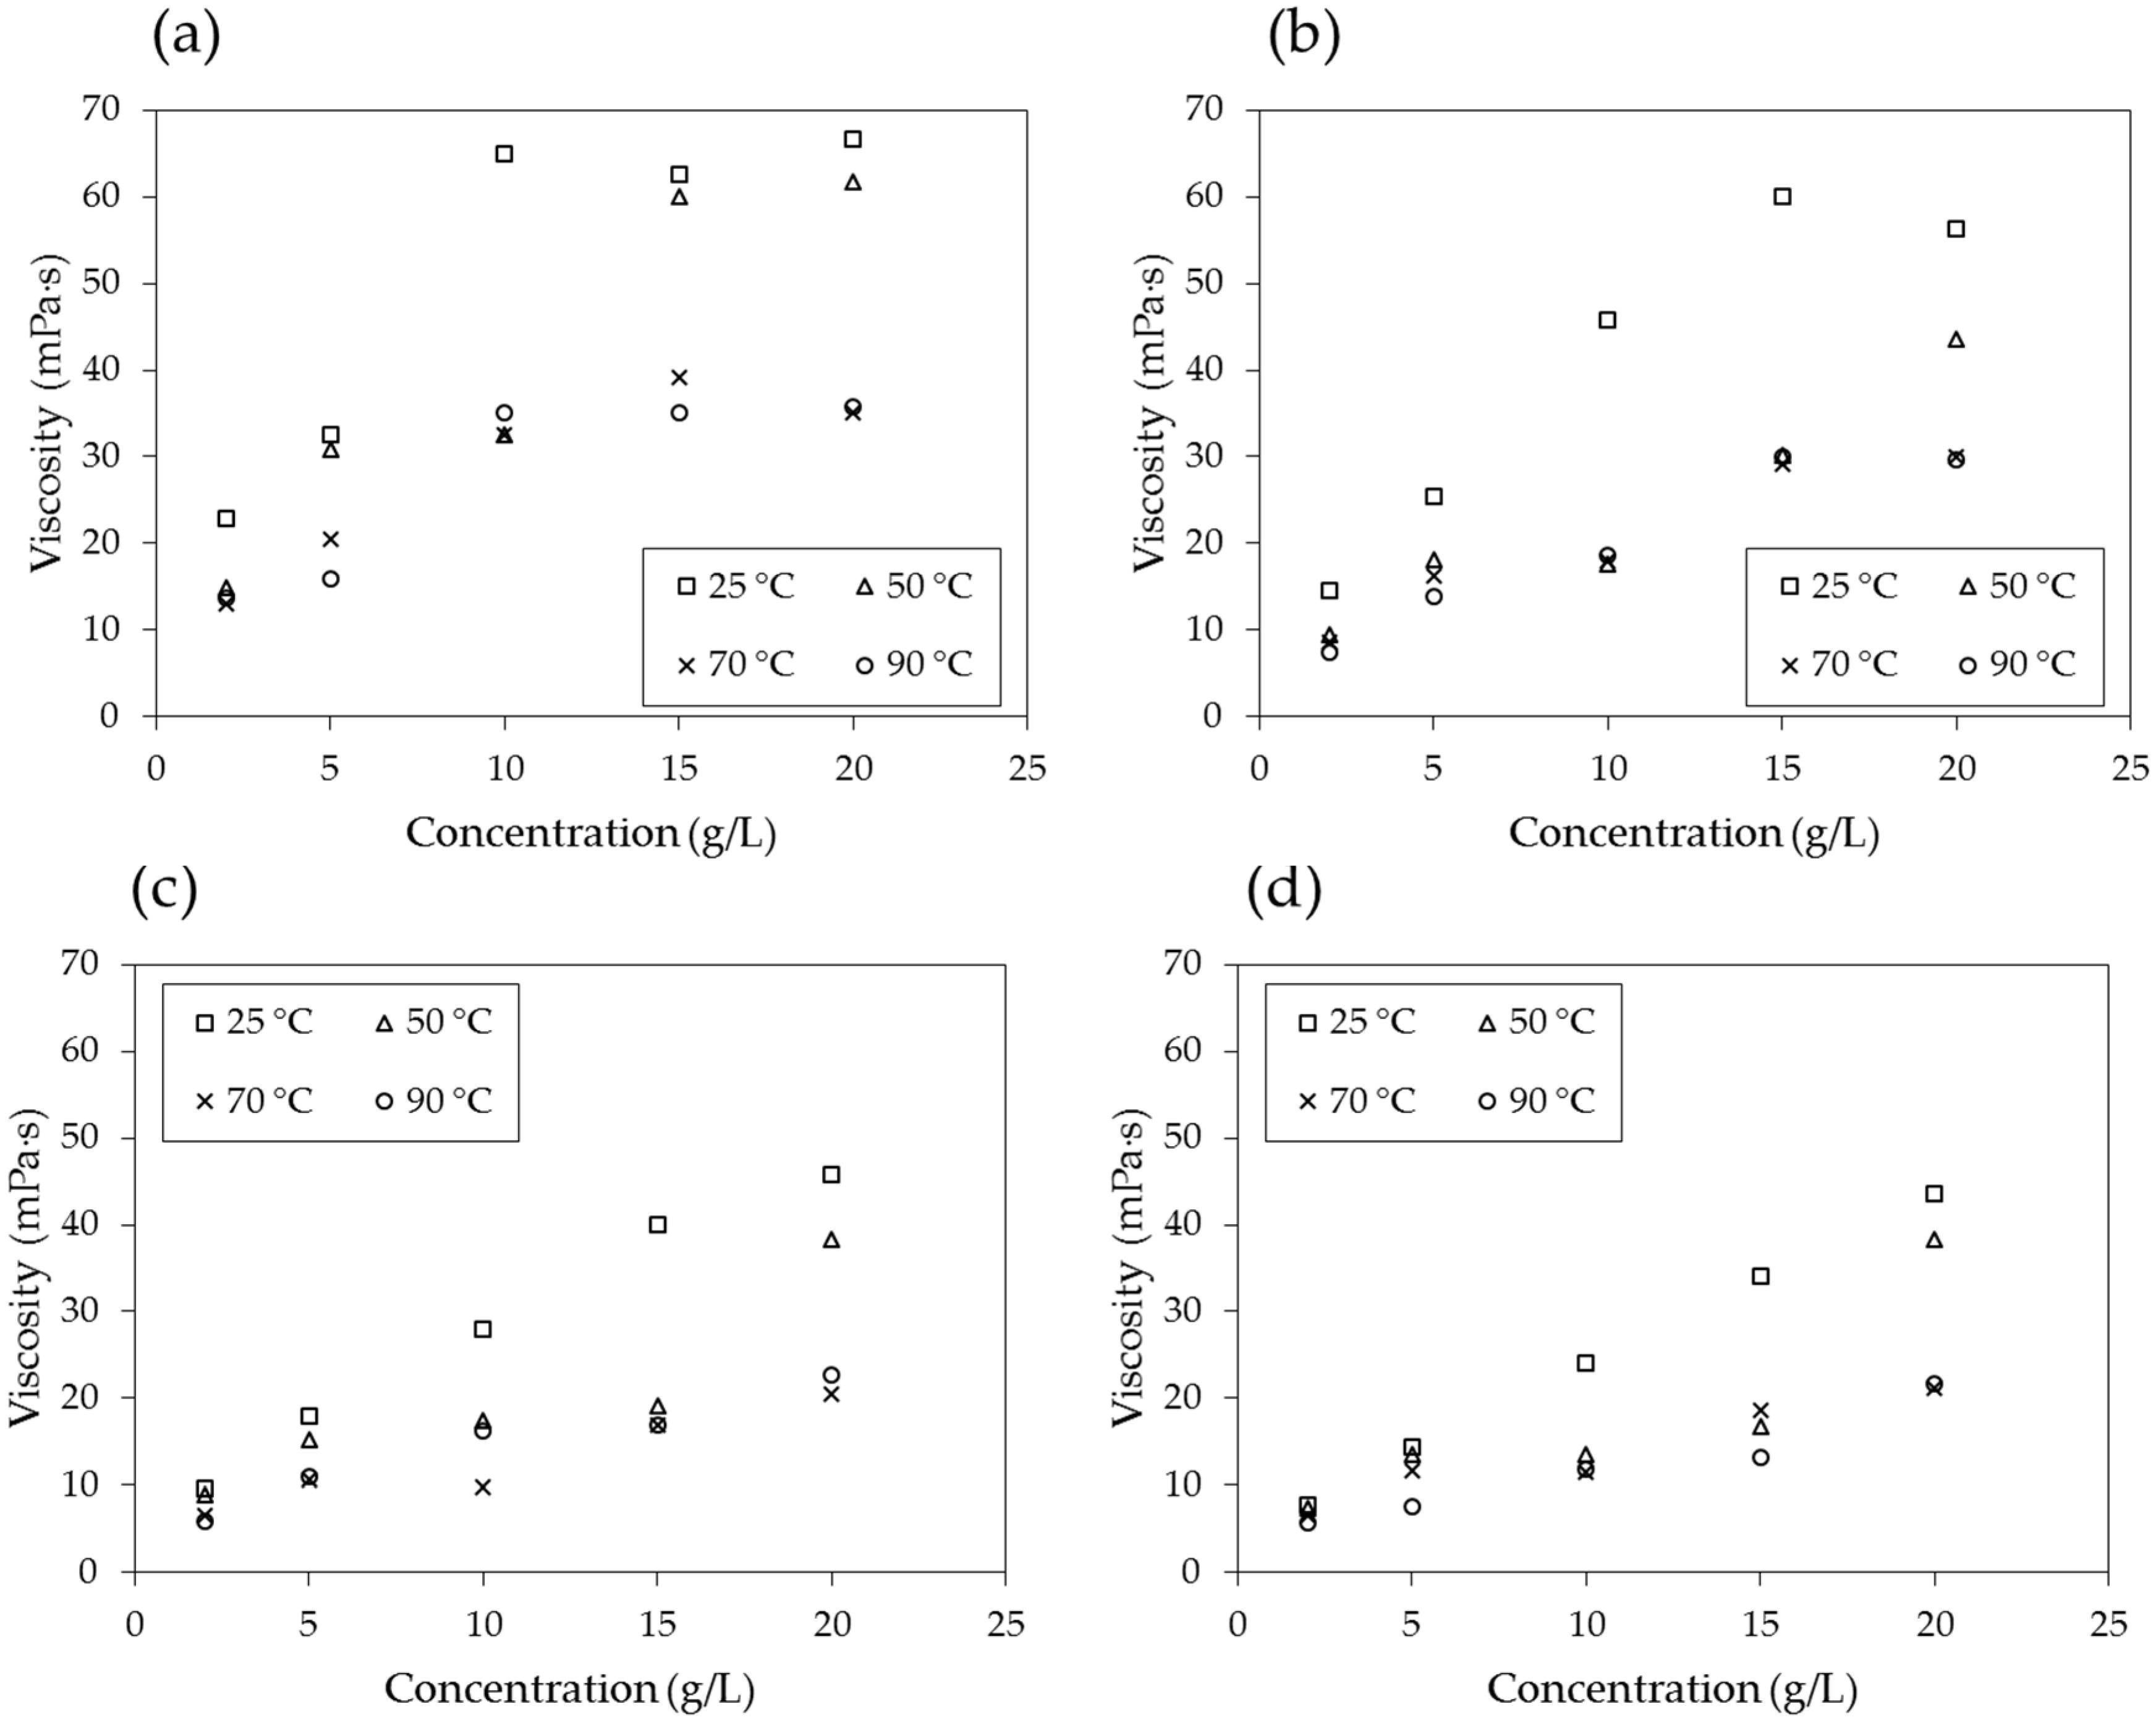
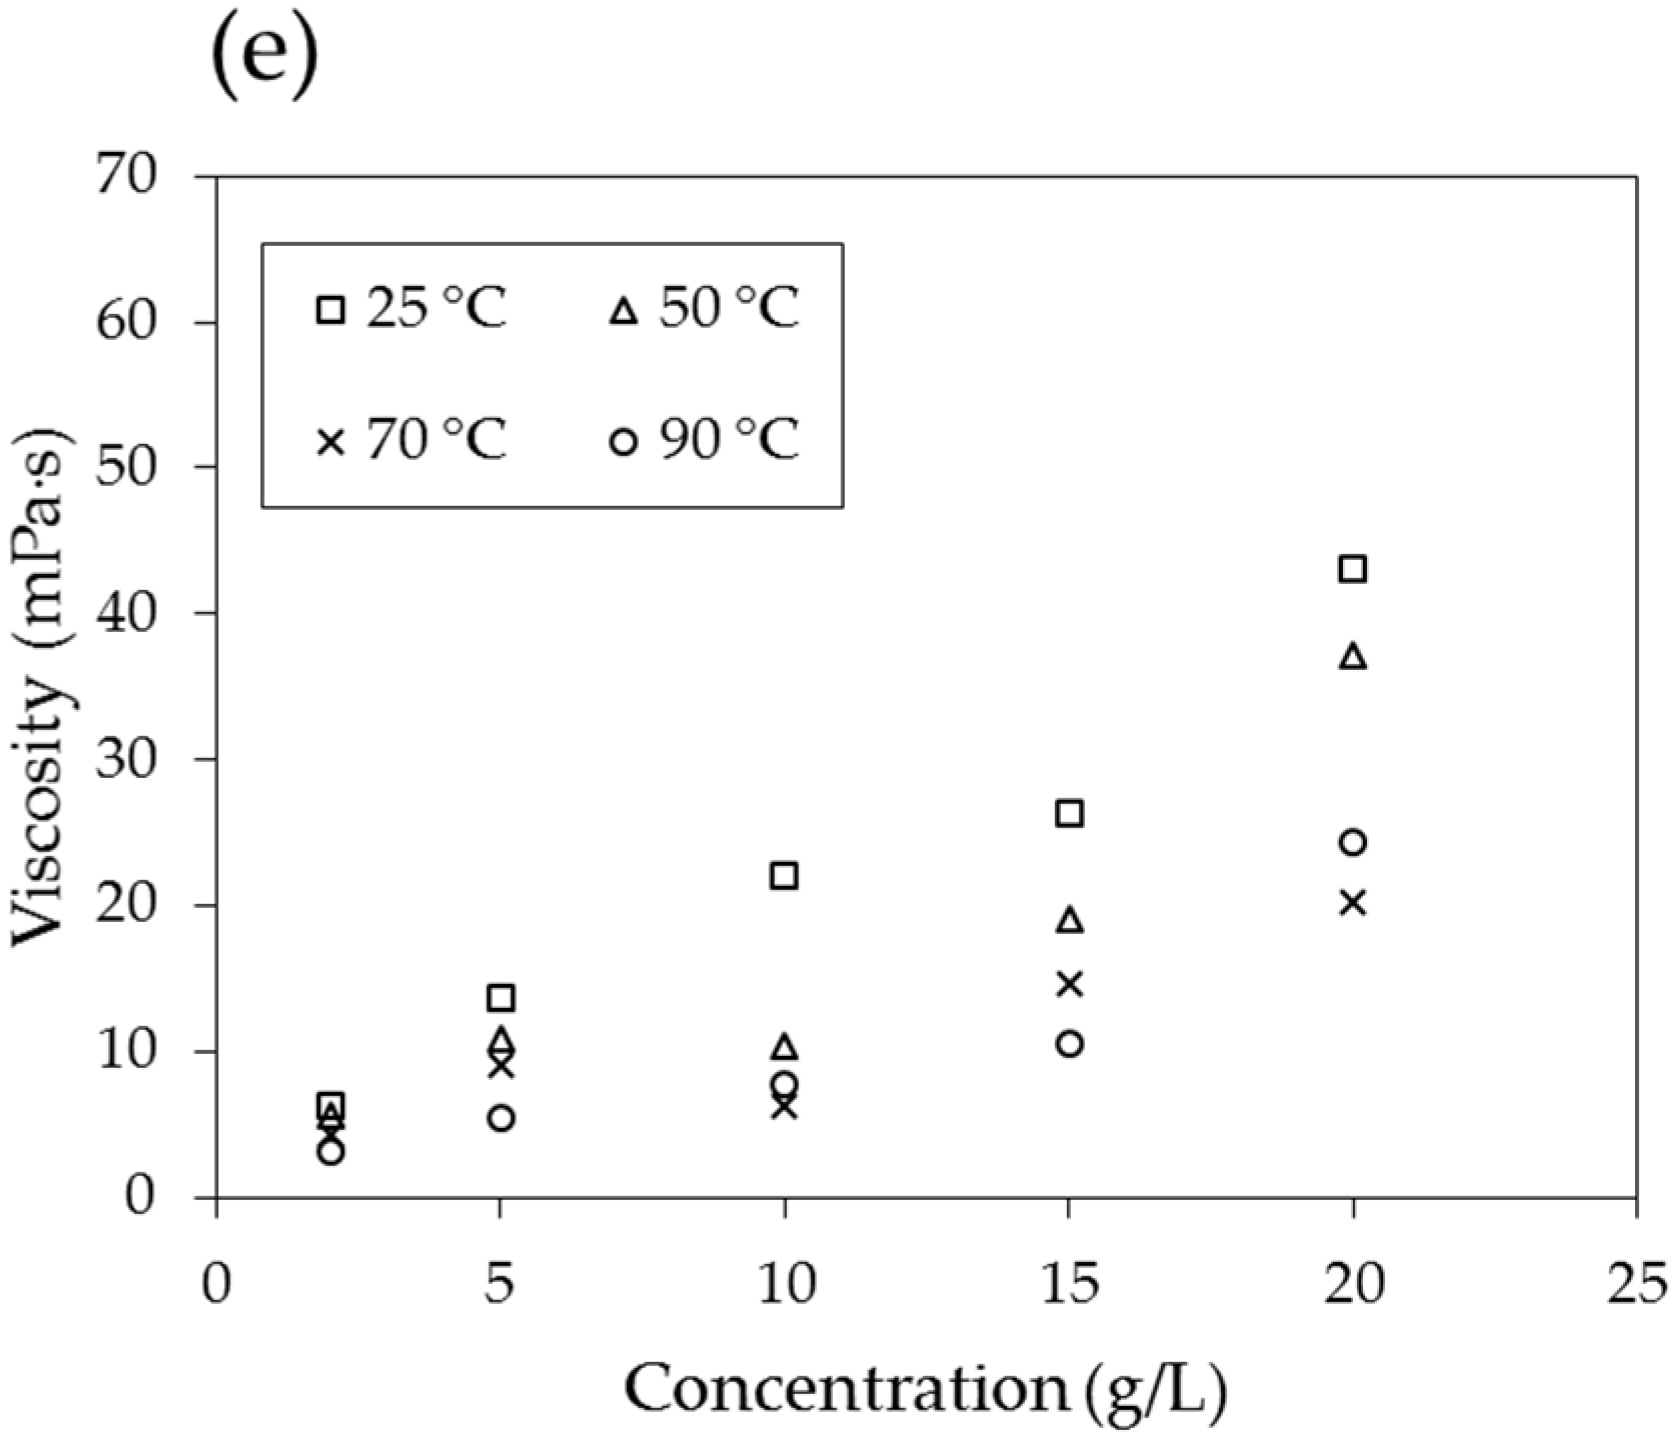
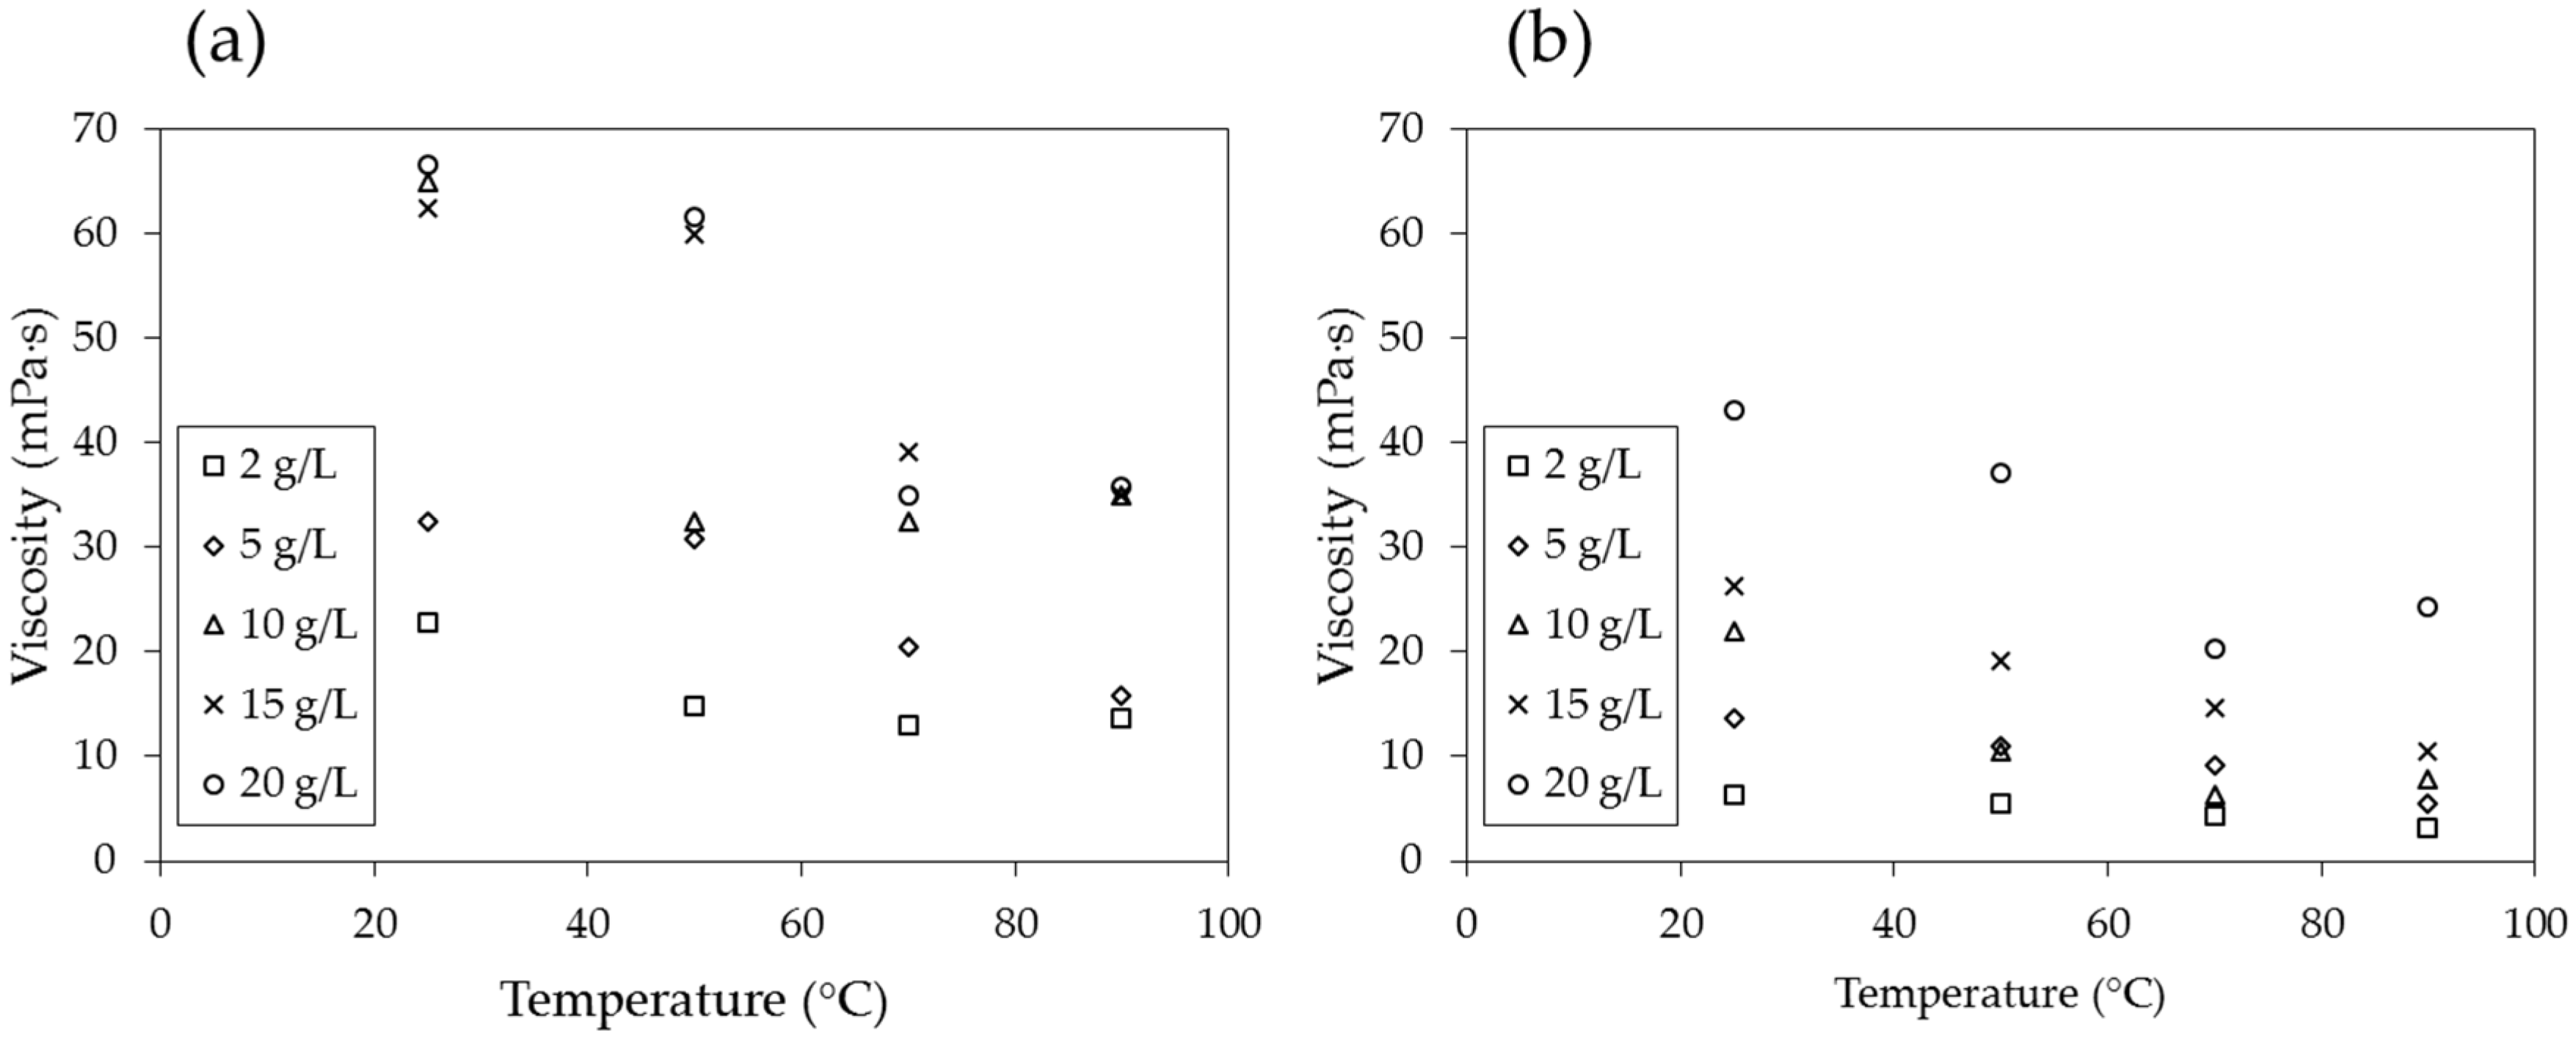
3.3. Viscosity
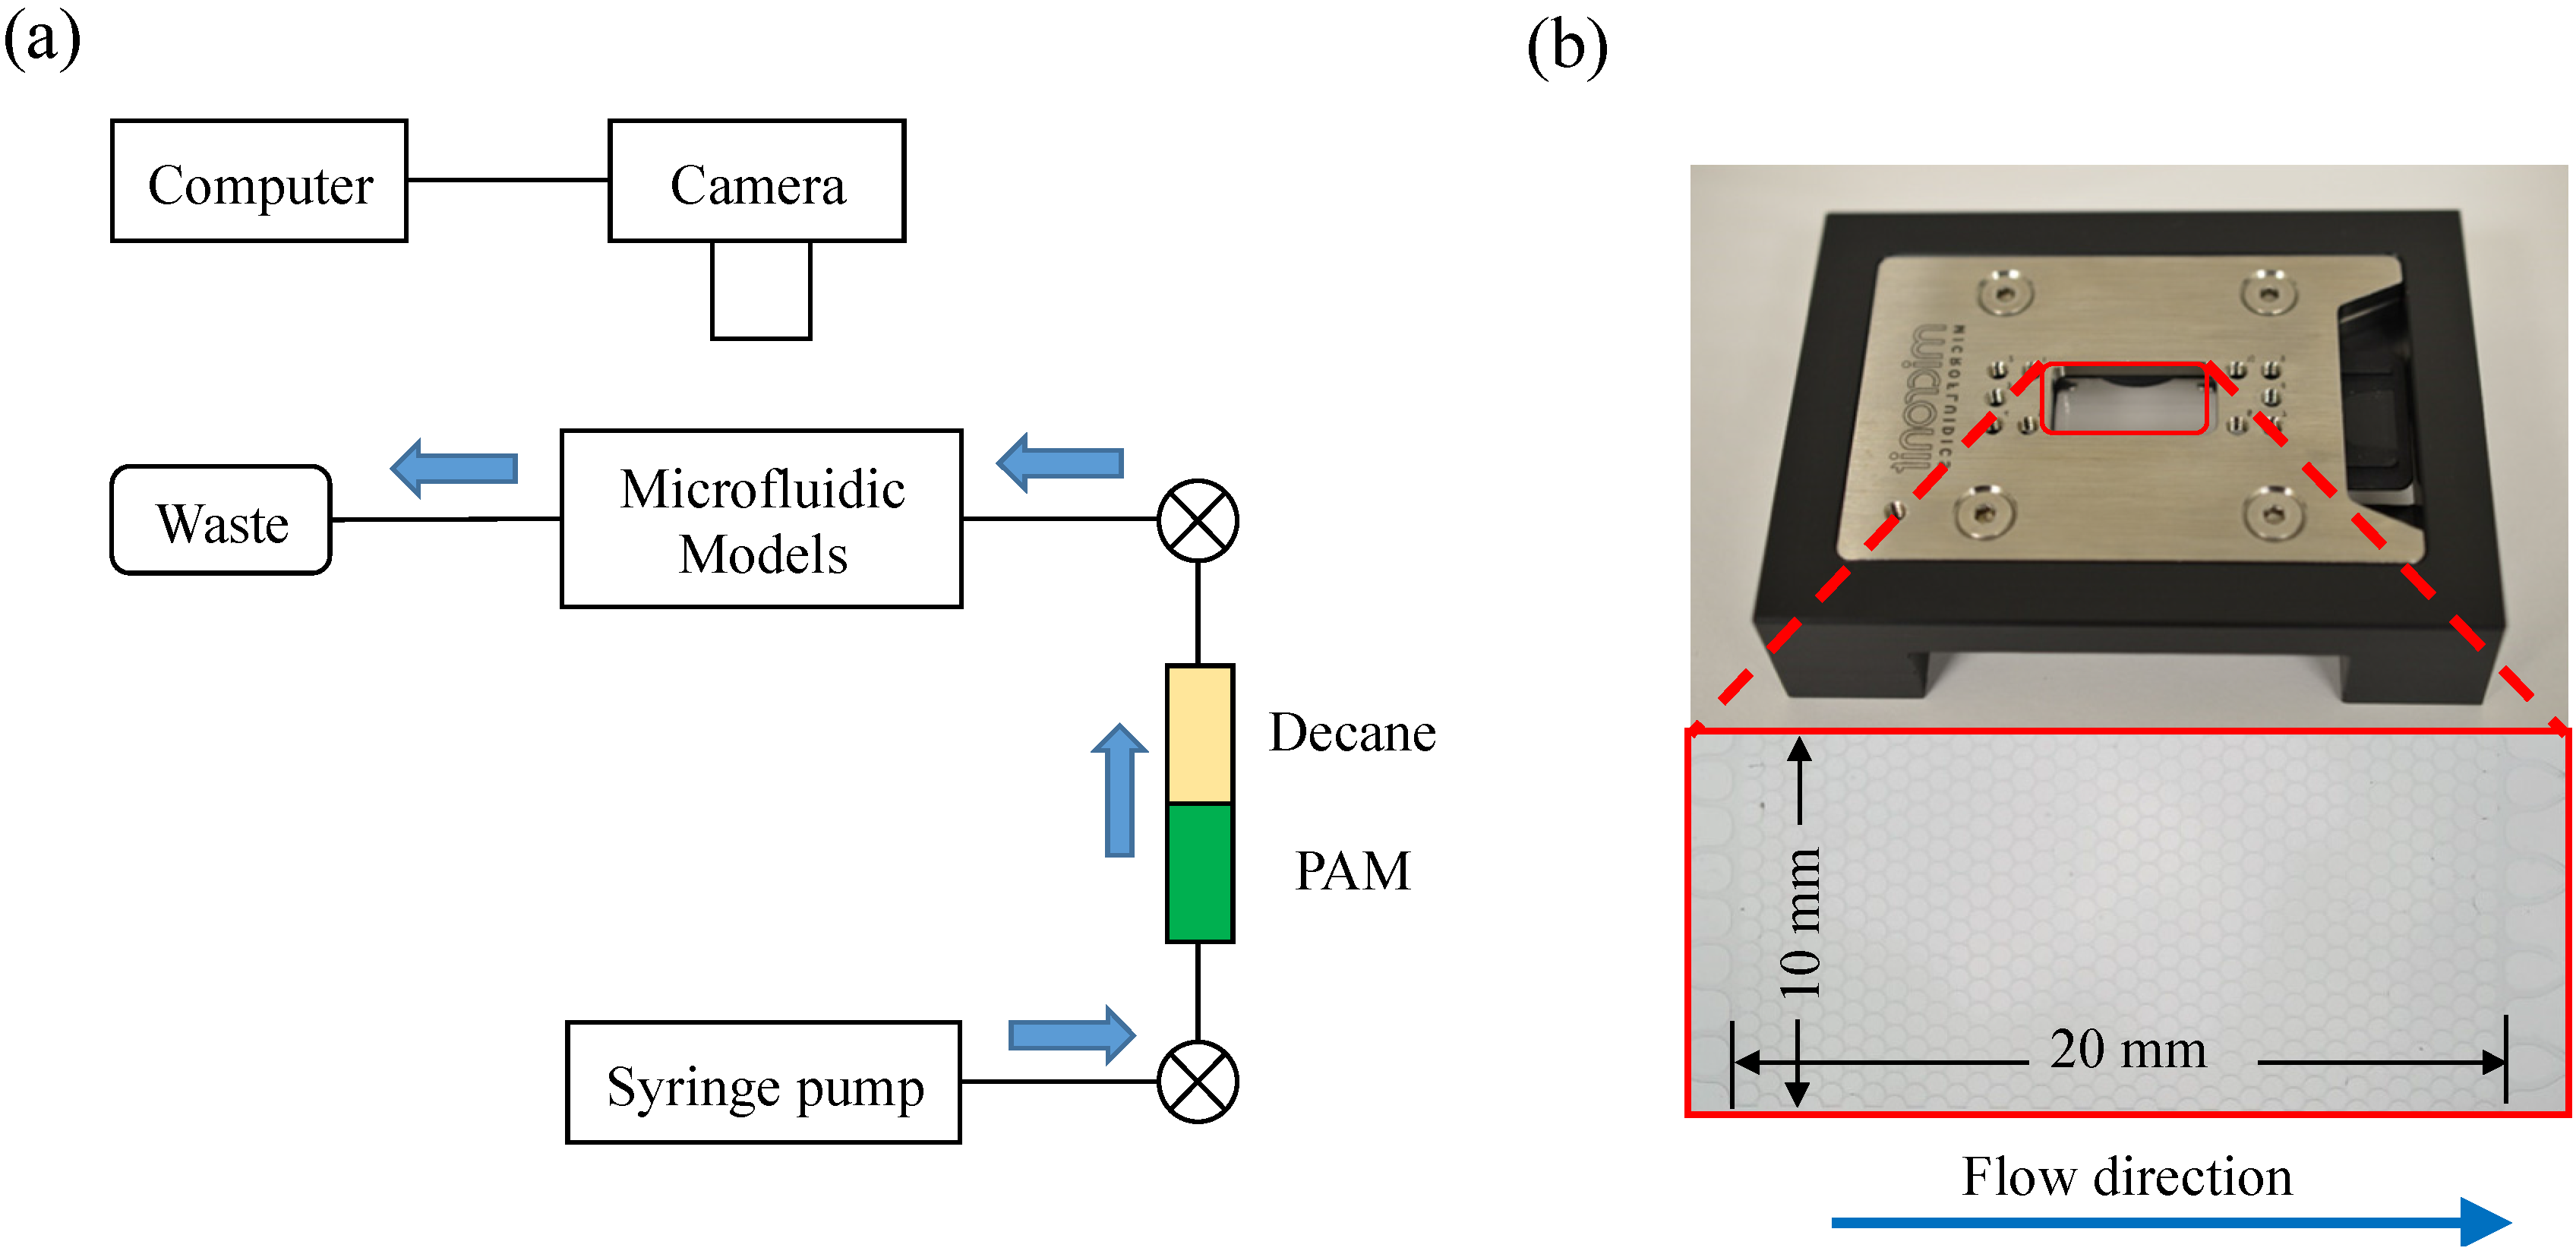
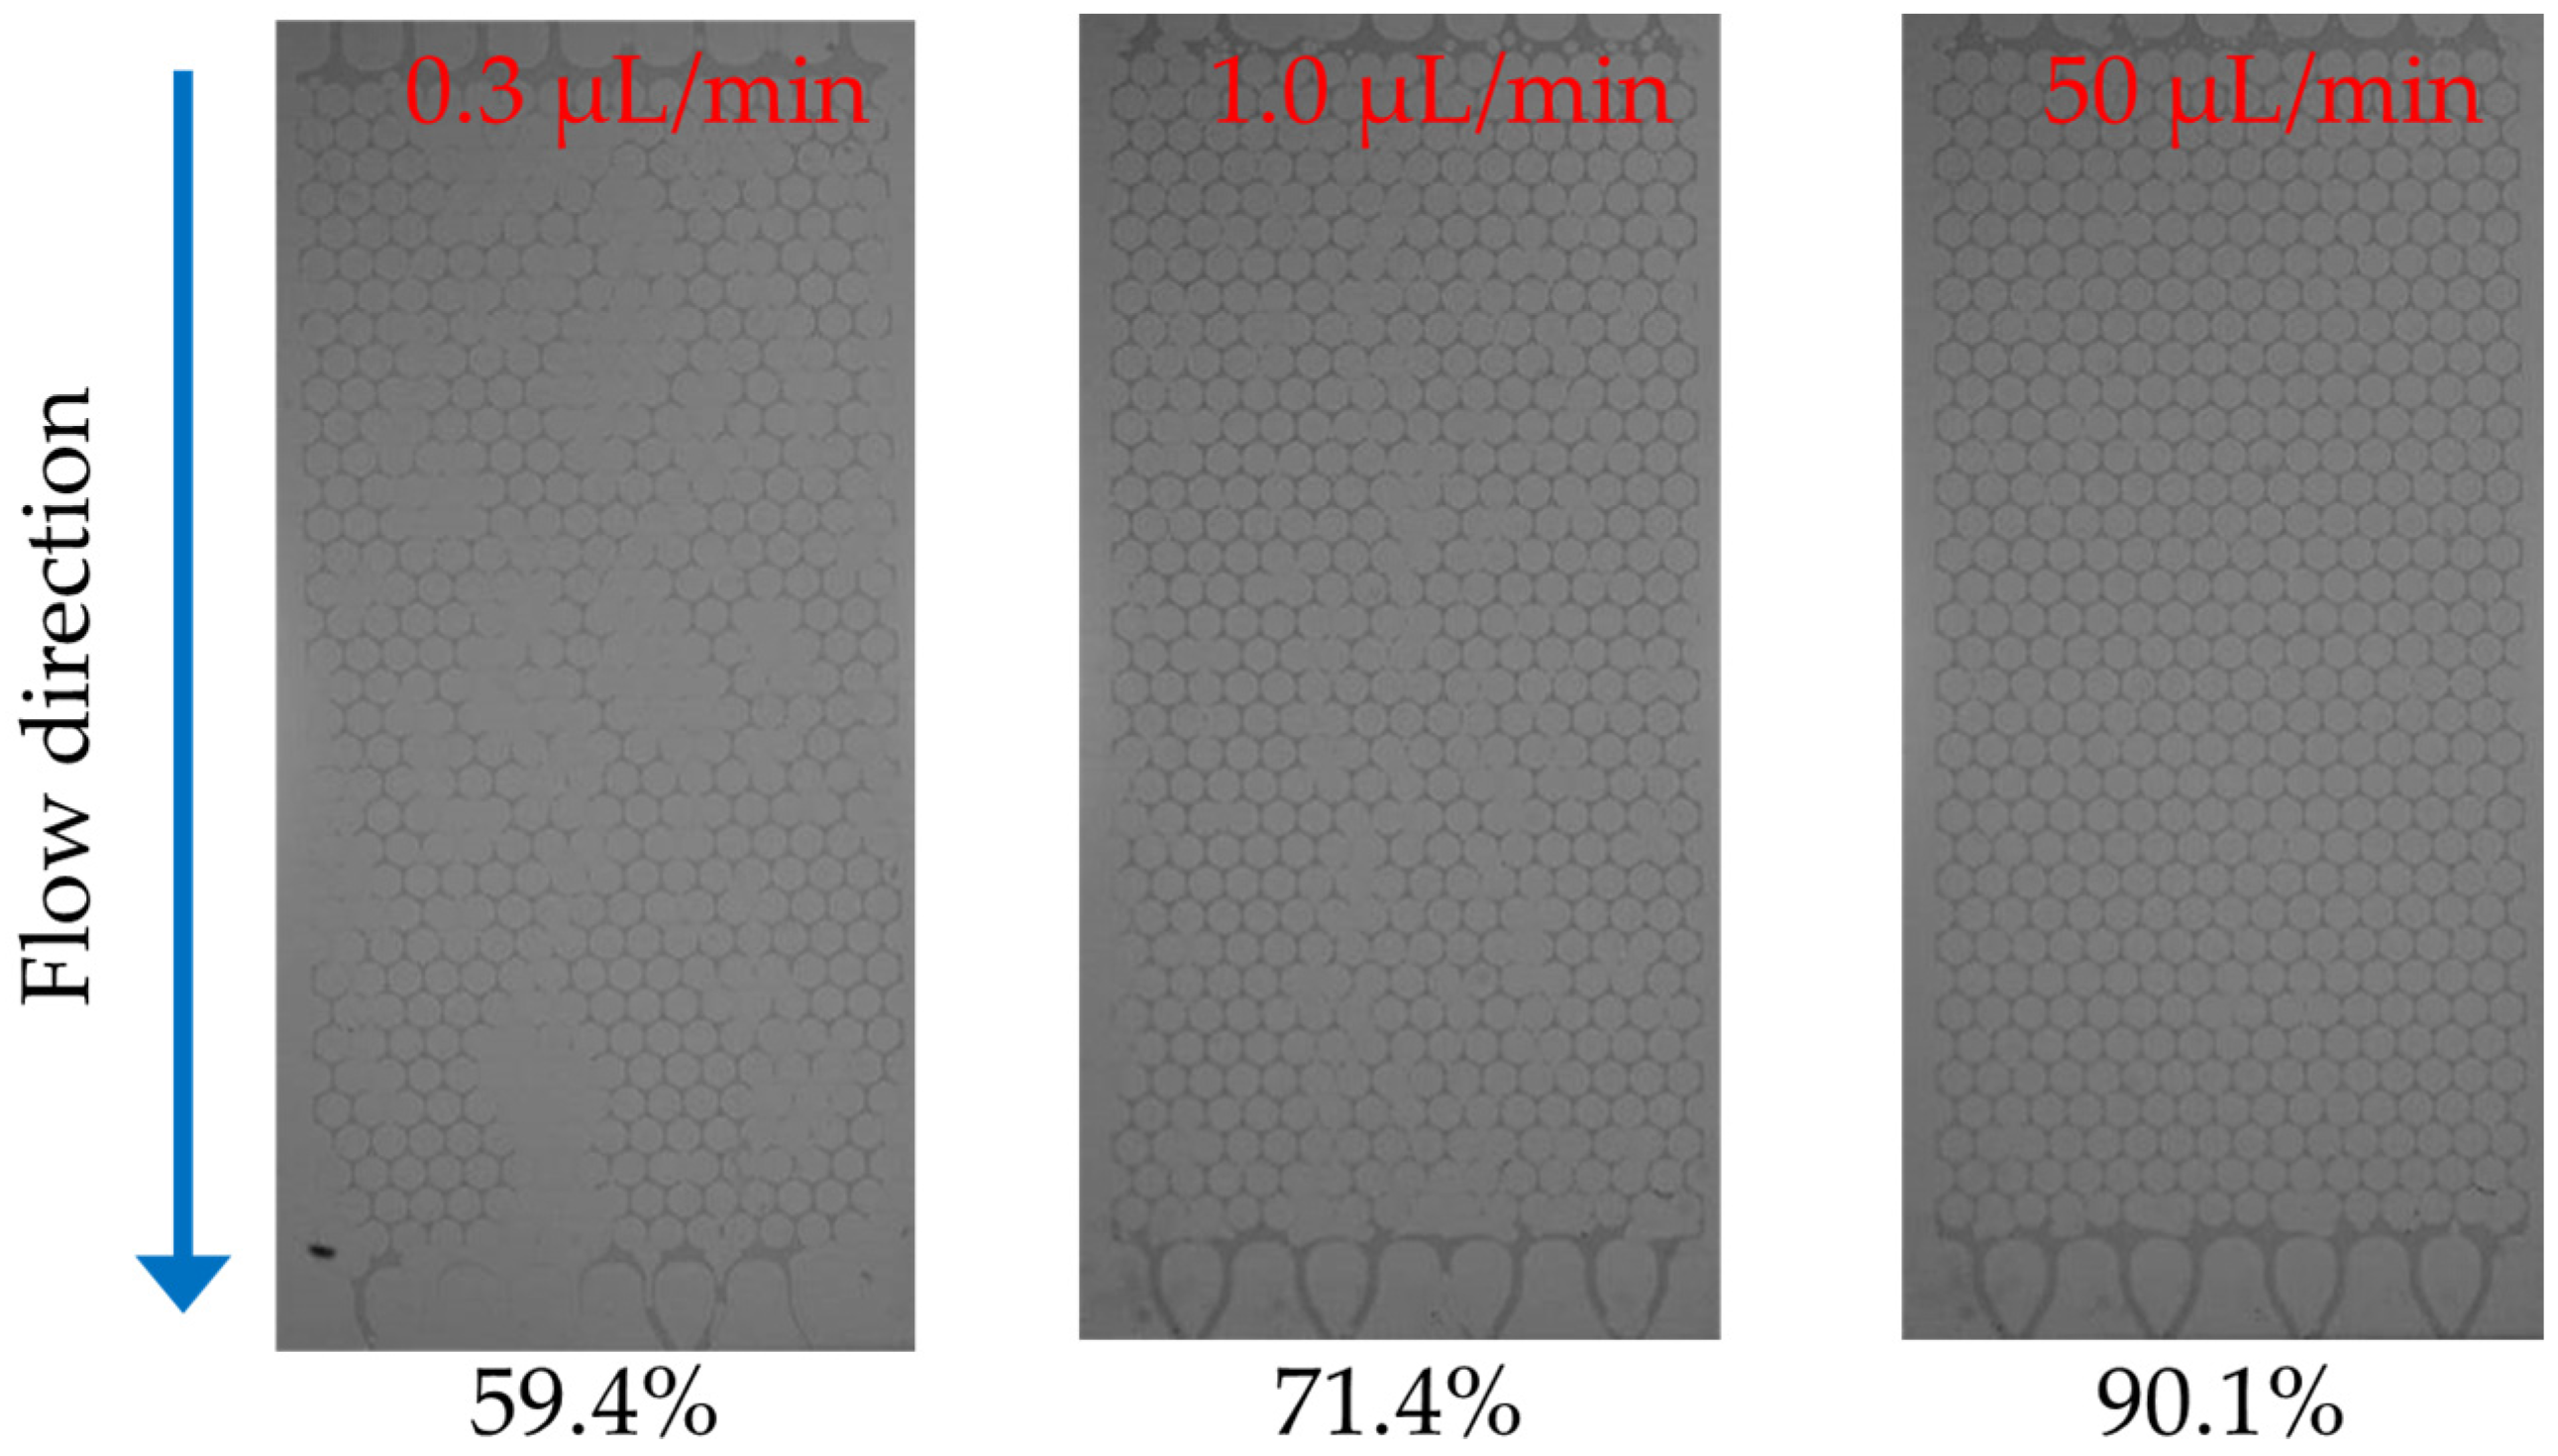
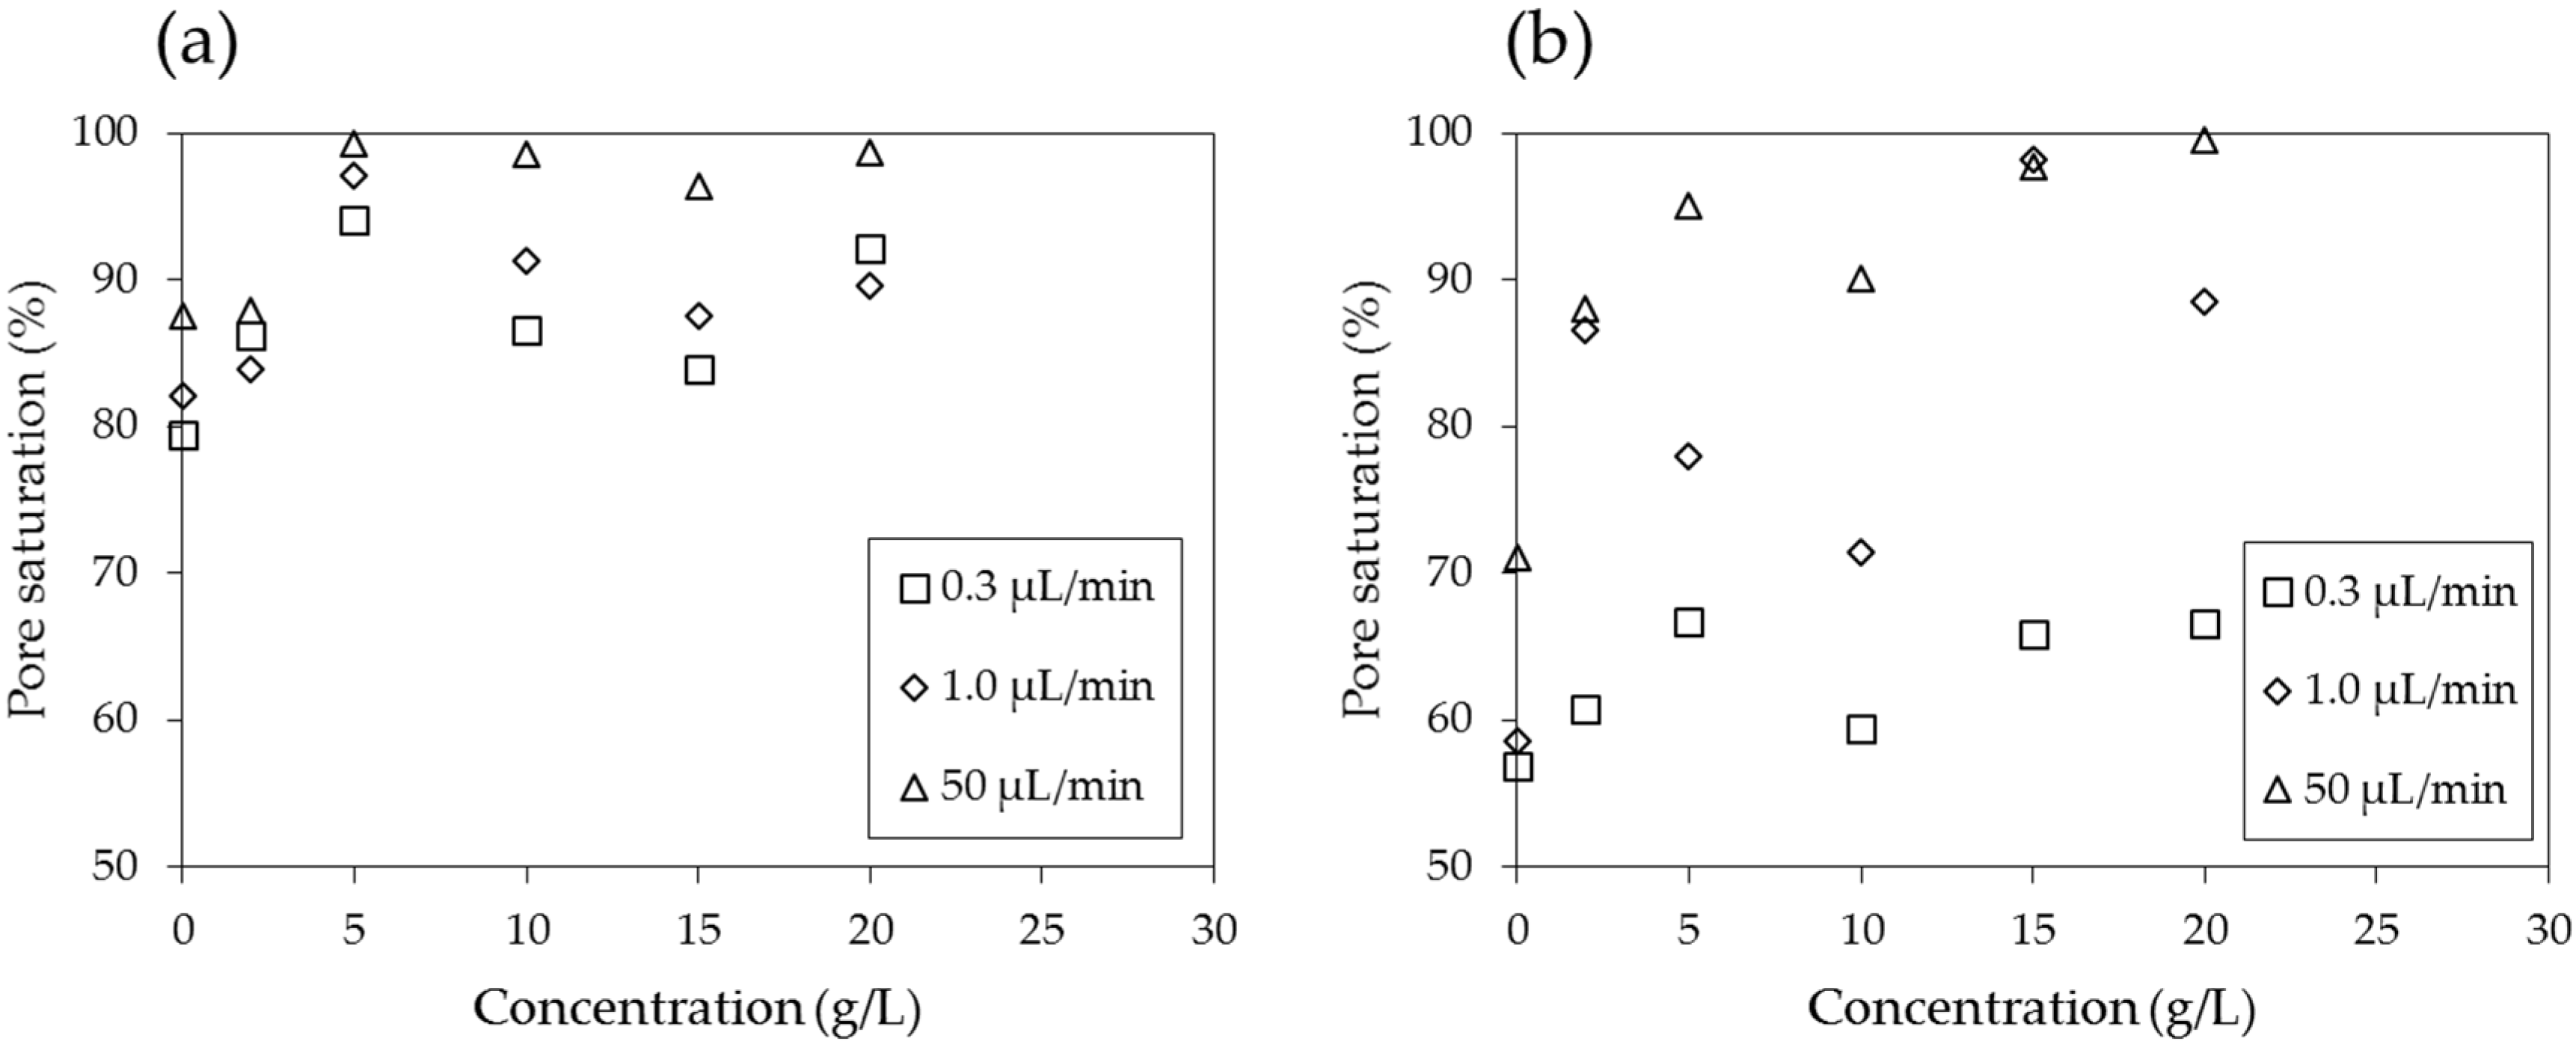
3.4. Flow Characteristics (Micromodel Test)
3.4.1. Experimental Setup

3.4.2. Experimental Procedure
4. Results
4.1. Contact Angle


4.2. Surface Tension

4.3. Viscosity


4.4. Micromodel Tests


4.5. Implication to Soil Remediation
5. Conclusions
Acknowledgments
Author Contributions
Conflicts of Interest
References
- Bate, B.; Zhao, Q.; Burns, S. Impact of organic coatings on frictional strength of organically modified clay. J. Geotech. Geoenviron. Eng. 2013, 140, 228–236. [Google Scholar] [CrossRef]
- Briscoe, W.H.; Klein, J. Friction and adhesion hysteresis between surfactant monolayers in water. J. Adhes. 2007, 83, 705–722. [Google Scholar] [CrossRef]
- Cabalar, A.; Canakci, H. Ground Improvement by Bacteria. In Proceedings of the 3rd Biot Conference on Poromechanics, Norman, OK, USA, 24–27 May 2005; pp. 707–712.
- Kang, J.; Sowers, T.D.; Duckworth, O.W.; Amoozegar, A.; Heitman, J.L.; McLaughlin, R.A. Turbidimetric determination of anionic polyacrylamide in low carbon soil extracts. J. Environ. Qual. 2013, 42, 1902–1907. [Google Scholar] [CrossRef] [PubMed]
- Kavazanjian, E., Jr.; Iglesias, E.; Karatas, I. Biopolymer soil stabilization for wind erosion control. In Proceedings of the 17th International Conference on Soil Mechanics and Geotechnical Engineering, Alexandria, Egypt, 5–9 October 2009; pp. 881–884.
- Martin, G.; Yen, T.; Karimi, S. Application of Biopolymer Technology in Silty Soil Matrices to form Impervious Barriers. In Proceedings of the 7th Australia-New Zealand Geomechanics Conference, Adelaide, Australia, 1–5 July 1996.
- Nugent, P.E.; Sullivan, M.; Cenko, S.B.; Thomas, R.C.; Kasen, D.; Howell, D.A.; Bersier, D.; Bloom, J.S.; Kulkarni, S.; Kandrashoff, M.T. Supernova sn 2011fe from an exploding carbon-oxygen white dwarf star. Nature 2011, 480, 344–347. [Google Scholar] [CrossRef] [PubMed]
- Yoshizawa, H.; Chen, Y.L.; Israelachvili, J. Fundamental mechanisms of interfacial friction. 1. Relation between adhesion and friction. J. Phys. Chem. 1993, 97, 4128–4140. [Google Scholar] [CrossRef]
- Blokker, N. Analysis of Alginate-Like Exopolysaccharides for the Application in Enhanced Oil Recovery. Master Thesis, Delft University of Technology, Delft, The Netherlands, 18 September 2014. [Google Scholar]
- Hove, K.; Pedersen, O.; Garmo, T.H.; Hansen, H.S.; Staaland, H. Fungi: A major source of radiocesium contamination of grazing ruminants in Norway. Health Phys. 1990, 59, 189–192. [Google Scholar] [CrossRef] [PubMed]
- Pollock, T.J.; Thorne, L.; Yamazaki, M.; Mikolajczak, M.J.; Armentrout, R.W. Mechanism of bacitracin resistance in gram-negative bacteria that synthesize exopolysaccharides. J. Bacteriol. 1994, 176, 6229–6237. [Google Scholar] [PubMed]
- Kosaric, N. Biosurfactants and their application for soil bioremediation. Food Technol. Biotechnol. 2001, 39, 295–304. [Google Scholar]
- Meuser, H. Contaminated Urban Soils; Springer Science & Business Media: Berlin/Heidelberg, Germany, 2010; Volume 18. [Google Scholar]
- Daripa, P.; Paşa, G. On capillary slowdown of viscous fingering in immiscible displacement in porous media. Transp. Porous Media 2008, 75, 1–16. [Google Scholar] [CrossRef]
- Mulligan, C.N. Environmental applications for biosurfactants. Environ. Pollut. 2005, 133, 183–198. [Google Scholar] [CrossRef] [PubMed]
- Chai, J.C.; Miura, N. Field vapor extraction test and long-term monitoring at a PCE contaminated site. J. Hazard. Mater. 2004, 110, 85–92. [Google Scholar] [CrossRef] [PubMed]
- Cho, J.S.; Wilson, J.T.; DiGiulio, D.C.; Vardy, J.A.; Choi, W. Implementation of natural attenuation at a jp-4 jet fuel release after active remediation. Biodegradation 1997, 8, 265–273. [Google Scholar] [CrossRef] [PubMed]
- Tse, K.K.; Lo, S.L.; Wang, J.W. Pilot study of in-situ thermal treatment for the remediation of pentachlorophenol-contaminated aquifers. Environ. Sci. Technol. 2001, 35, 4910–4915. [Google Scholar] [CrossRef] [PubMed]
- Mulligan, C.N.; Eftekhari, F. Remediation with surfactant foam of PCP-contaminated soil. Eng. Geol. 2003, 70, 269–279. [Google Scholar] [CrossRef]
- Knox, R.C.; Sabatini, D.A. Transport and Remediation of Subsurface Contaminants; American Chemical Society: Washington, DC, USA, 1992. [Google Scholar]
- Lee, M.; Kim, J.; Kim, I. In-situ biosurfactant flushing, coupled with a highly pressurized air injection, to remediate the bunker oil contaminated site. Geosci. J. 2011, 15, 313–321. [Google Scholar] [CrossRef]
- Khatami, H.R.; O’Kelly, B.C. Improving mechanical properties of sand using biopolymers. J. Geotech. Geoenviron. Eng. 2012, 139, 1402–1406. [Google Scholar] [CrossRef]
- Jafvert, C.T. Surfactants/Cosolvents; Ground-Water Remediation Technologies Analysis Center: Pittsburgh, PA, USA, 1996. [Google Scholar]
- Jawitz, J.W.; Annable, M.D.; Rao, P. Miscible fluid displacement stability in unconfined porous media: Two-dimensional flow experiments and simulations. J. Contam. Hydrol. 1998, 31, 211–230. [Google Scholar] [CrossRef]
- Lee, M.; Kang, H.; Do, W. Application of nonionic surfactant-enhanced in situ flushing to a diesel contaminated site. Water Res. 2005, 39, 139–146. [Google Scholar] [CrossRef] [PubMed]
- Mulligan, C.; Yong, R.; Gibbs, B. Remediation technologies for metal-contaminated soils and groundwater: An evaluation. Eng. Geol. 2001, 60, 193–207. [Google Scholar] [CrossRef]
- Park, J.Y.; Kim, S.J.; Lee, Y.J.; Baek, K.; Yang, J.W. Ek-fenton process for removal of phenanthrene in a two-dimensional soil system. Eng. Geol. 2005, 77, 217–224. [Google Scholar] [CrossRef]
- Tsai, T.T.; Kao, C.M.; Yeh, T.Y.; Liang, S.H.; Chien, H.Y. Remediation of fuel oil-contaminated soils by a three-stage treatment system. Environ. Eng. Sci. 2009, 26, 651–659. [Google Scholar] [CrossRef]
- Zhou, W.; Fu, H.; Pan, K.; Tian, C.; Qu, Y.; Lu, P.; Sun, C.C. Mesoporous TiO2/α-Fe2O3: Bifunctional composites for effective elimination of arsenite contamination through simultaneous photocatalytic oxidation and adsorption. J. Phys. Chem. C 2008, 112, 19584–19589. [Google Scholar] [CrossRef]
- Lake, P.S. Flow-Generated disturbances and Ecological Responses: Floods and Droughts. In Hydroecology and Ecohydrology: Past, Present and Future; Wiley Press: New York, NY, USA, 2008; pp. 75–92. [Google Scholar]
- Sorbie, K. Polymer-Improved Oil Recovery; Springer Science+Business Media: Berlin, Germany, 1991; Chapter 1; pp. 1–5. [Google Scholar]
- Lenormand, R. Liquids in porous media. J. Phys. Condens. Matter 1990, 2, SA79. [Google Scholar] [CrossRef]
- Lenormand, R.; Touboul, E.; Zarcone, C. Numerical models and experiments on immiscible displacements in porous media. J. Fluid Mech. 1988, 189, 165–187. [Google Scholar] [CrossRef]
- Buchgraber, M. An enhanced oil recovery micromodel study with associative and conventional polymers. Master Thesis, University of Leoben, Leoben, Austria, September 2008. [Google Scholar]
- Hayden, M.K.; Bonten, M.J.; Blom, D.W.; Lyle, E.A.; van de Vijver, D.A.; Weinstein, R.A. Reduction in acquisition of vancomycin-resistant enterococcus after enforcement of routine environmental cleaning measures. Clin. Infect. Dis. 2006, 42, 1552–1560. [Google Scholar] [CrossRef] [PubMed]
- Lenormand, R.; Zarcone, C.; Sarr, A. Mechanisms of the displacement of one fluid by another in a network of capillary ducts. J. Fluid Mech. 1983, 135, 337–353. [Google Scholar] [CrossRef]
- Bruun, J.; Hicks-Bruun, M. Isolation of n-decane from petroleum by distillation and equilibrium melting. J. Res. Nat. Bur. Stand. 1932, 8, 583–589. [Google Scholar] [CrossRef]
- Fan, R.; Guo, S.; Li, T.; Li, F.; Yang, X.; Wu, B. Contributions of electrokinetics and bioremediation in the treatment of different petroleum components. Clean Soil Air Water 2015, 43, 251–259. [Google Scholar] [CrossRef]
- Fu, W.J.; Chi, Z.; Ma, Z.C.; Zhou, H.X.; Liu, G.L.; Lee, C.F.; Chi, Z.M. Hydrocarbons, the advanced biofuels produced by different organisms, the evidence that alkanes in petroleum can be renewable. Appl. Microbiol. Biotechnol. 2015, 99, 7481–7494. [Google Scholar] [CrossRef] [PubMed]
- Margesin, R.; Moertelmaier, C.; Mair, J. Low-temperature biodegradation of petroleum hydrocarbons (n-alkanes, phenol, anthracene, pyrene) by four actinobacterial strains. Int. Biodeterior. Biodegrad. 2013, 84, 185–191. [Google Scholar] [CrossRef]
- Bertrand, E.M.; Keddis, R.; Groves, J.T.; Vetriani, C.; Austin, R.N. Identity and mechanisms of alkane-oxidizing metalloenzymes from deep-sea hydrothermal vents. Front. Microbiol. 2013, 4. [Google Scholar] [CrossRef] [PubMed]
- Zemo, D.A.; Bruya, J.E.; Graf, T.E. The application of petroleum hydrocarbon fingerprint characterization in site investigation and remediation. Ground Water Monit. Remediat. 1995, 15, 147–156. [Google Scholar] [CrossRef]
- Rayner, J.L.; Snape, I.; Walworth, J.L.; Harvey, P.M.; Ferguson, S.H. Petroleum-hydrocarbon contamination and remediation by microbioventing at sub-antarctic macquarie island. Cold Reg. Sci. Technol. 2007, 48, 139–153. [Google Scholar] [CrossRef]
- Nadim, F.; Hoag, G.E.; Liu, S.; Carley, R.J.; Zack, P. Detection and remediation of soil and aquifer systems contaminated with petroleum products: An overview. J. Pet. Sci. Eng. 2000, 26, 169–178. [Google Scholar] [CrossRef]
- Zyakun, A.; Nii-Annang, S.; Franke, G.; Fischer, T.; Buegger, F.; Dilly, O. Microbial activity and 13c/12c ratio as evidence of n-hexadecane and n-hexadecanoic acid biodegradation in agricultural and forest soils. Geomicrobiol. J. 2012, 29, 570–584. [Google Scholar] [CrossRef]
- Sinha, P.K.; Wang, C.Y. Pore-network modeling of liquid water transport in gas diffusion layer of a polymer electrolyte fuel cell. Electrochim. Acta 2007, 52, 7936–7945. [Google Scholar] [CrossRef]
- Barvenik, F.W. Polyacrylamide characteristics related to soil applications. Soil Sci. 1994, 158, 235–243. [Google Scholar] [CrossRef]
- Kuo, C.W.; Perrin, J.C.; Benson, S.M. Simulation studies of effect of flow rate and small scale heterogeneity on multiphase flow of CO2 and brine. Energy Procedia 2011, 4, 4516–4523. [Google Scholar] [CrossRef]
- Picout, D.R.; Ross-Murphy, S.B. Rheology of biopolymer solutions and gels. Sci. World J. 2003, 3, 105–121. [Google Scholar] [CrossRef] [PubMed]
© 2016 by the authors; licensee MDPI, Basel, Switzerland. This article is an open access article distributed under the terms and conditions of the Creative Commons by Attribution (CC-BY) license (http://creativecommons.org/licenses/by/4.0/).
Share and Cite
Jung, J.; Jang, J.; Ahn, J. Characterization of a Polyacrylamide Solution Used for Remediation of Petroleum Contaminated Soils. Materials 2016, 9, 16. https://doi.org/10.3390/ma9010016
Jung J, Jang J, Ahn J. Characterization of a Polyacrylamide Solution Used for Remediation of Petroleum Contaminated Soils. Materials. 2016; 9(1):16. https://doi.org/10.3390/ma9010016
Chicago/Turabian StyleJung, Jongwon, Jungyeon Jang, and Jaehun Ahn. 2016. "Characterization of a Polyacrylamide Solution Used for Remediation of Petroleum Contaminated Soils" Materials 9, no. 1: 16. https://doi.org/10.3390/ma9010016