1. Introduction
Two billion people suffer from micronutrient deficiency, with nearly one billion being calorie deficient [
1]. There is a gap between food supply and nutritional requirements, which has been attributed to a lack of nutritional considerations in crop production [
2]. There is a need for a paradigm shift in current food production to consider nutrition outcomes [
3]. Increasing food production and productivity should be tied to increasing nutrient density. In this regard, agriculture could simultaneously address the challenge of increasing food production and improving nutrition under limited resource availability. However, there are often challenges to linking disciplines as there are often no appropriate metrics for evaluating such linkages. In the case of quantifying the water-food-nutrition nexus, nutritional water productivity (NWP) has been proposed as a useful metric [
4].
Nutritional water productivity is a measure of yield and nutrition outcome per unit of water consumed and would be applicable for sustainable food production given the limited water resources and modified diets [
4,
5] .To date, increasing food production under water scarcity has been evaluated using different metrics such as “water use efficiency” and “water productivity” [
6,
7,
8,
9,
10]. On the other hand, nutritionists have quantified nutritional content of different foodstuffs and suggested diets for improving nutritional status of people. These efforts have been parallel and needed to be merged to address the challenge of producing more nutritious food under water scarcity. Nutritional water productivity would be a useful metric in the semi- and arid tropics (South Asia and sub-Saharan Africa) where water scarcity and food and nutrition insecurity are prevalent [
3].
The high prevalence of food and nutrition insecurity has been attributed to dominance of starch in diets leading to poor dietary diversity. Diets lack in protein, micro nutrients and minerals [
11,
12,
13,
14]. This leads to various forms of malnutrition, including but not limited to, stunting, wasting and underweight in children under five, anaemia in women of the reproductive age, obesity and type 2 diabetes [
1]. Dietary diversity has been recommended to alleviate malnutrition. Dietary diversity is defined as the number of different foods or food groups consumed over a given reference period [
15]. Increasing the variety of foods across and within food groups ensures adequate intake of essential nutrients to promote good health. Grain legumes are being promoted in the semi- and arid tropics, as part of dietary diversity efforts. They are rich in proteins and some micronutrients [
16,
17,
18], hence have the potential to alleviate malnutrition. The nutritional properties of grain legumes have been associated with reduction of environmental enteric dysfunction (EED) [
19]—an incompletely defined syndrome of inflammation, reduced absorptive capacity, and reduced barrier function in the small intestine which is common among the rural poor in the semi- and arid tropics [
20]. Crop diversification through inclusion of indigenous grain legumes in food and nutrition agendas has been proposed by several authors [
3,
21,
22,
23]. A study on nutrient content and NWP of indigenous and exotic vegetables observed that crops differed in their nutrient content and NWP [
24]. For some micro nutrients, indigenous vegetables were more nutrient dense compared to the reference exotic vegetable swiss chard (
Beta vulgaris).
In the semi- and arid tropics, water is one of the main limiting factors in agriculture. Yield of grain legumes has been observed to decrease with decreasing water availability [
25,
26,
27]. Grain legumes have also been associated with yield instability across environments. There is not much information on how water availability and different environments affect nutritional content of grain legumes. Moreover, there is need to link yield, water use and nutritional content of grain legumes to establish the best yielding crops that use less water and are nutritionally dense. This should include indigenous grain legumes as they form part of crop diversification efforts. This information will be useful for promotion of grain legumes across different environments. It is hypothesised that nutrient content and NWP of crops will not vary with varying water availability and across environments. The aim of the study was therefore to determine the effect of production environment on NWP of selected indigenous and major grain legumes that share the same ecological niche and are usually consumed as whole grains by the rural population. The specific objectives were to determine nutrient content and NWP of selected indigenous [bambara groundnut (
Vigna subterranea) and cowpea (
Vigna unguiculata)] and major grain legumes [groundnut (
Arachis hypogaea) and dry bean (
Phaseolus vulgaris)] in response to (i) water regimes and (ii) environments.
2. Materials and Methods
2.1. Plant Material
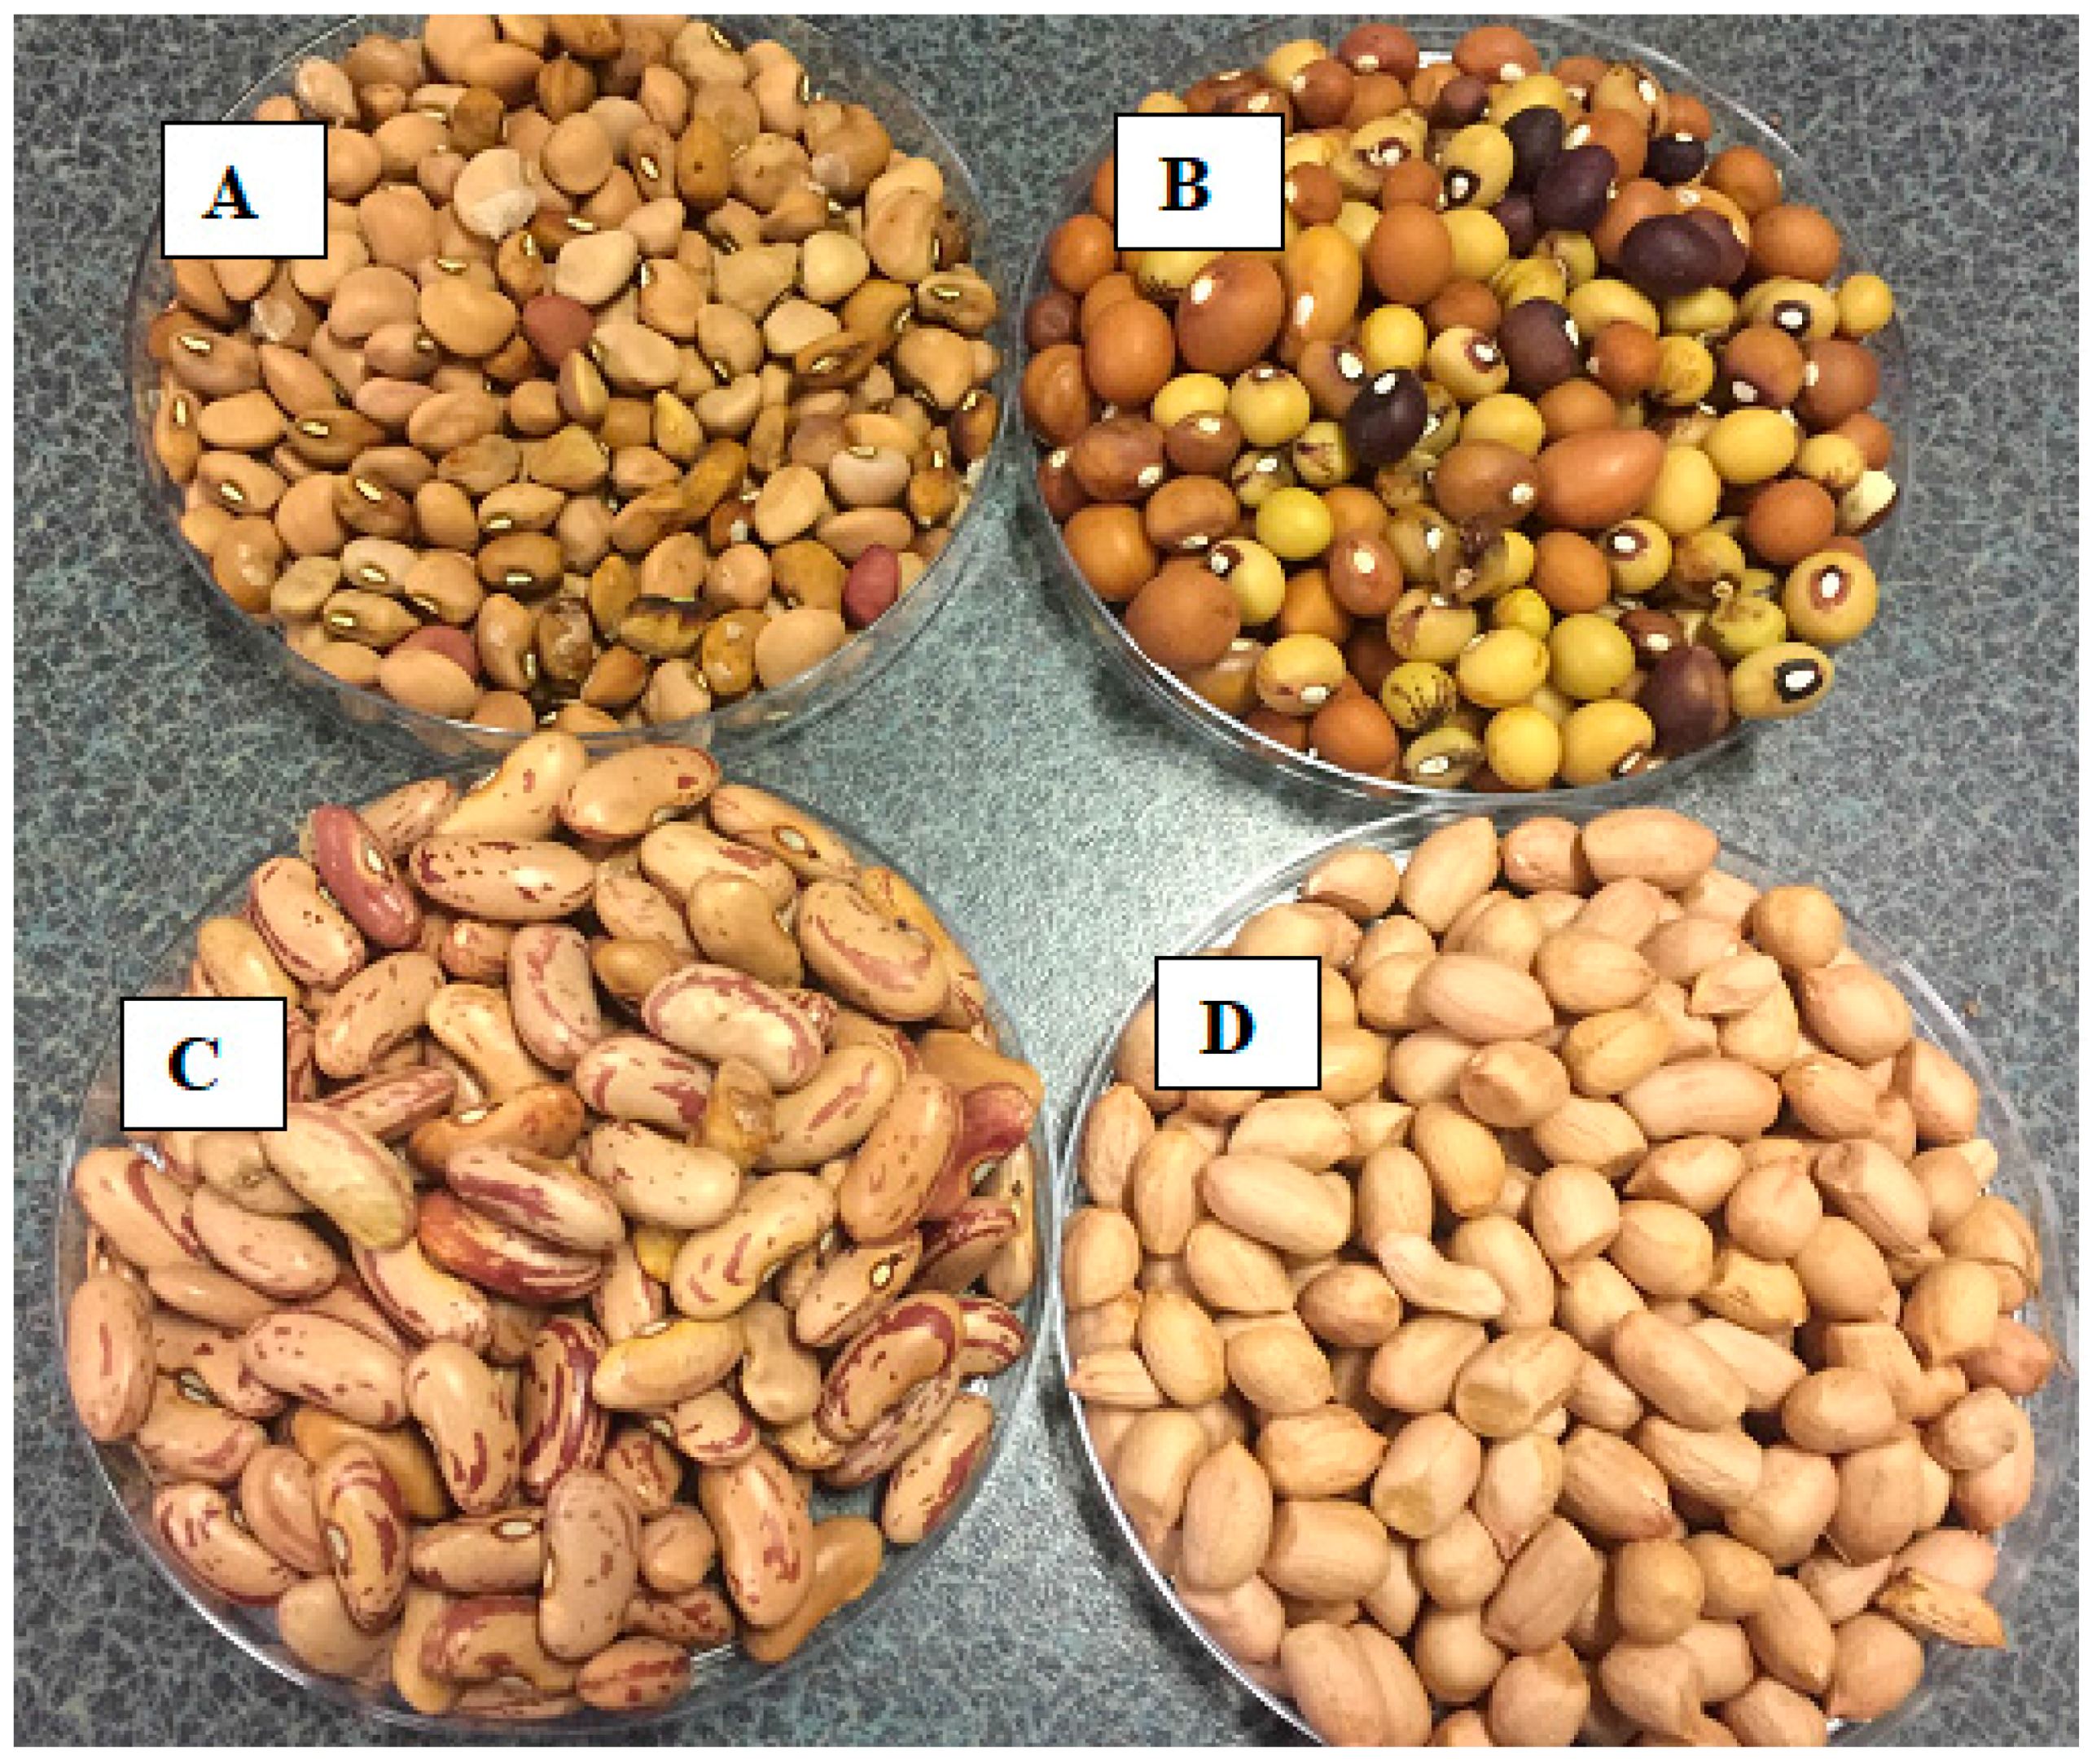
Two major grain legumes that are recognised internationally (groundnut and dry bean) and two African indigenous grain legumes that are being promoted as healthy alternatives (bambara groundnut and cowpea) were selected for the study (
Figure 1). Groundnut has high oil content and is usually consumed as a snack or processed to peanut butter or groundnut oil. Bambara groundnut, cowpea and dry bean, are normally harvested as dry grain and consumed after boiling them. Bambara groundnut and groundnut, form pods below ground while dry bean and cowpea form pods above ground. For the study, popular South African varieties of groundnut (Kwarts), dry bean (Ukulinga) and cowpea (mixed brown) were used for the study. For bambara groundnut, a mixed colour landrace from Jozini, South Africa was used. Kwarts is a variety suitable for warm dry areas [
28]. Ukulinga is a high yielding variety of dry bean that is well adapted to most dry bean producing areas [
29]. Mixed brown is a drought tolerant variety that is well adapted to most soils [
30]. There was no information on the bambara groundnut landrace.
2.2. Site Description
Three sites (one on-station and two on-farm) were selected from KwaZulu-Natal Province, South Africa (
Table 1). Ukulinga, which was the on-station farm, is a Research Farm, belonging to the University of KwaZulu-Natal. Ukulinga has access to irrigation. Umbumbulu and Fountanhill were on farm trials and did not have access to irrigation. Umbumbulu is a rural district in the eThekwini district of KwaZulu-Natal. Fountainhill is an Estate 2 km outside of Wartburg, KwaZulu-Natal.
2.3. Experimental Design and Trial Management
The experimental design at Ukulinga Research Farm, where there was access to irrigation, was a split-plot design arranged in randomised complete blocks with three replications. The main plots were irrigation regimes (optimum irrigation, deficit irrigation and rainfed) while the subplots were the grain legume crops (dry bean, groundnut and bambara groundnut). Irrigation scheduling in the optimum irrigation was based on 80% management allowable depletion (MAD), where water was maintained above 80% of total available water (TAW). The DI treatment was irrigated (MAD: 80% TAW) at the most sensitive to water stress growth stages (flowering and pod-filling stages). To determine the effect of environment, an experiment was conducted at the three sites (Fountainhill Estate, Ukulinga Research Farm and Umbumbulu Rural District) under rainfed conditions. At all sites, the experimental design was a randomised complete block design with three replications. There was no cowpea at Ukulinga. At Umbumbulu, trials only established during the 2016/17 season.
At all the sites, plot size (sub-plot at Ukulinga) was 18.75 m2. Plant population was 26,667 plants hectare−1 for cowpea, 66,667 plants hectare−1 for bambara groundnut and 88,889 plants hectare−1 for dry bean and groundnut. During 2015/16, trials were planted on 17 November 2015 at Ukulinga and 4 December 2015 at Fountainhill. During 2016/17, trials were planted on 30 November, 14 December and 16 January 2016 at Umbumbulu, Fountainhill and Ukulinga, respectively. At planting, a slow release organic fertiliser [Gromor accelerator (0.3% N, 0.15% P and 0.15% K)] was applied at a rate of 4000 kg·ha−1 using the band placement method. Rate of fertilizer application was based on results of fertility analysis conducted prior to the experiment. Results showed that to meet the nutrient requirements of the grain legumes under study, there was need to add 120 and 50 kg·ha−1 of N and P at Ukulinga and Fountainhill, while at Umbumbulu deficient N, P and K was 120, 50 and 10 kg·ha−1, respectively. For the duration of the trials, recommended best management practices (weeding, ridging and pest and disease control) for each crop were applied.
2.4. Measurements
2.4.1. Yield and Yield Components
At harvest, six representative plants were randomly selected from each plot. Thereafter, the plants were air dried in a controlled environment situated at the UKZN Phytosanitary Unit until there was no change in total biomass. Pods were dehulled and grain mass was determined.
2.4.2. Determination of Evapotranspiration (ET)
Evapotranspiration for each treatment was calculated as the residual of a soil water balance [
31]:
where ET = evapotranspiration (mm), P = precipitation (mm), I = irrigation (mm), D = drainage (mm), R = runoff (mm), and ΔSWC = changes in soil water content (mm).
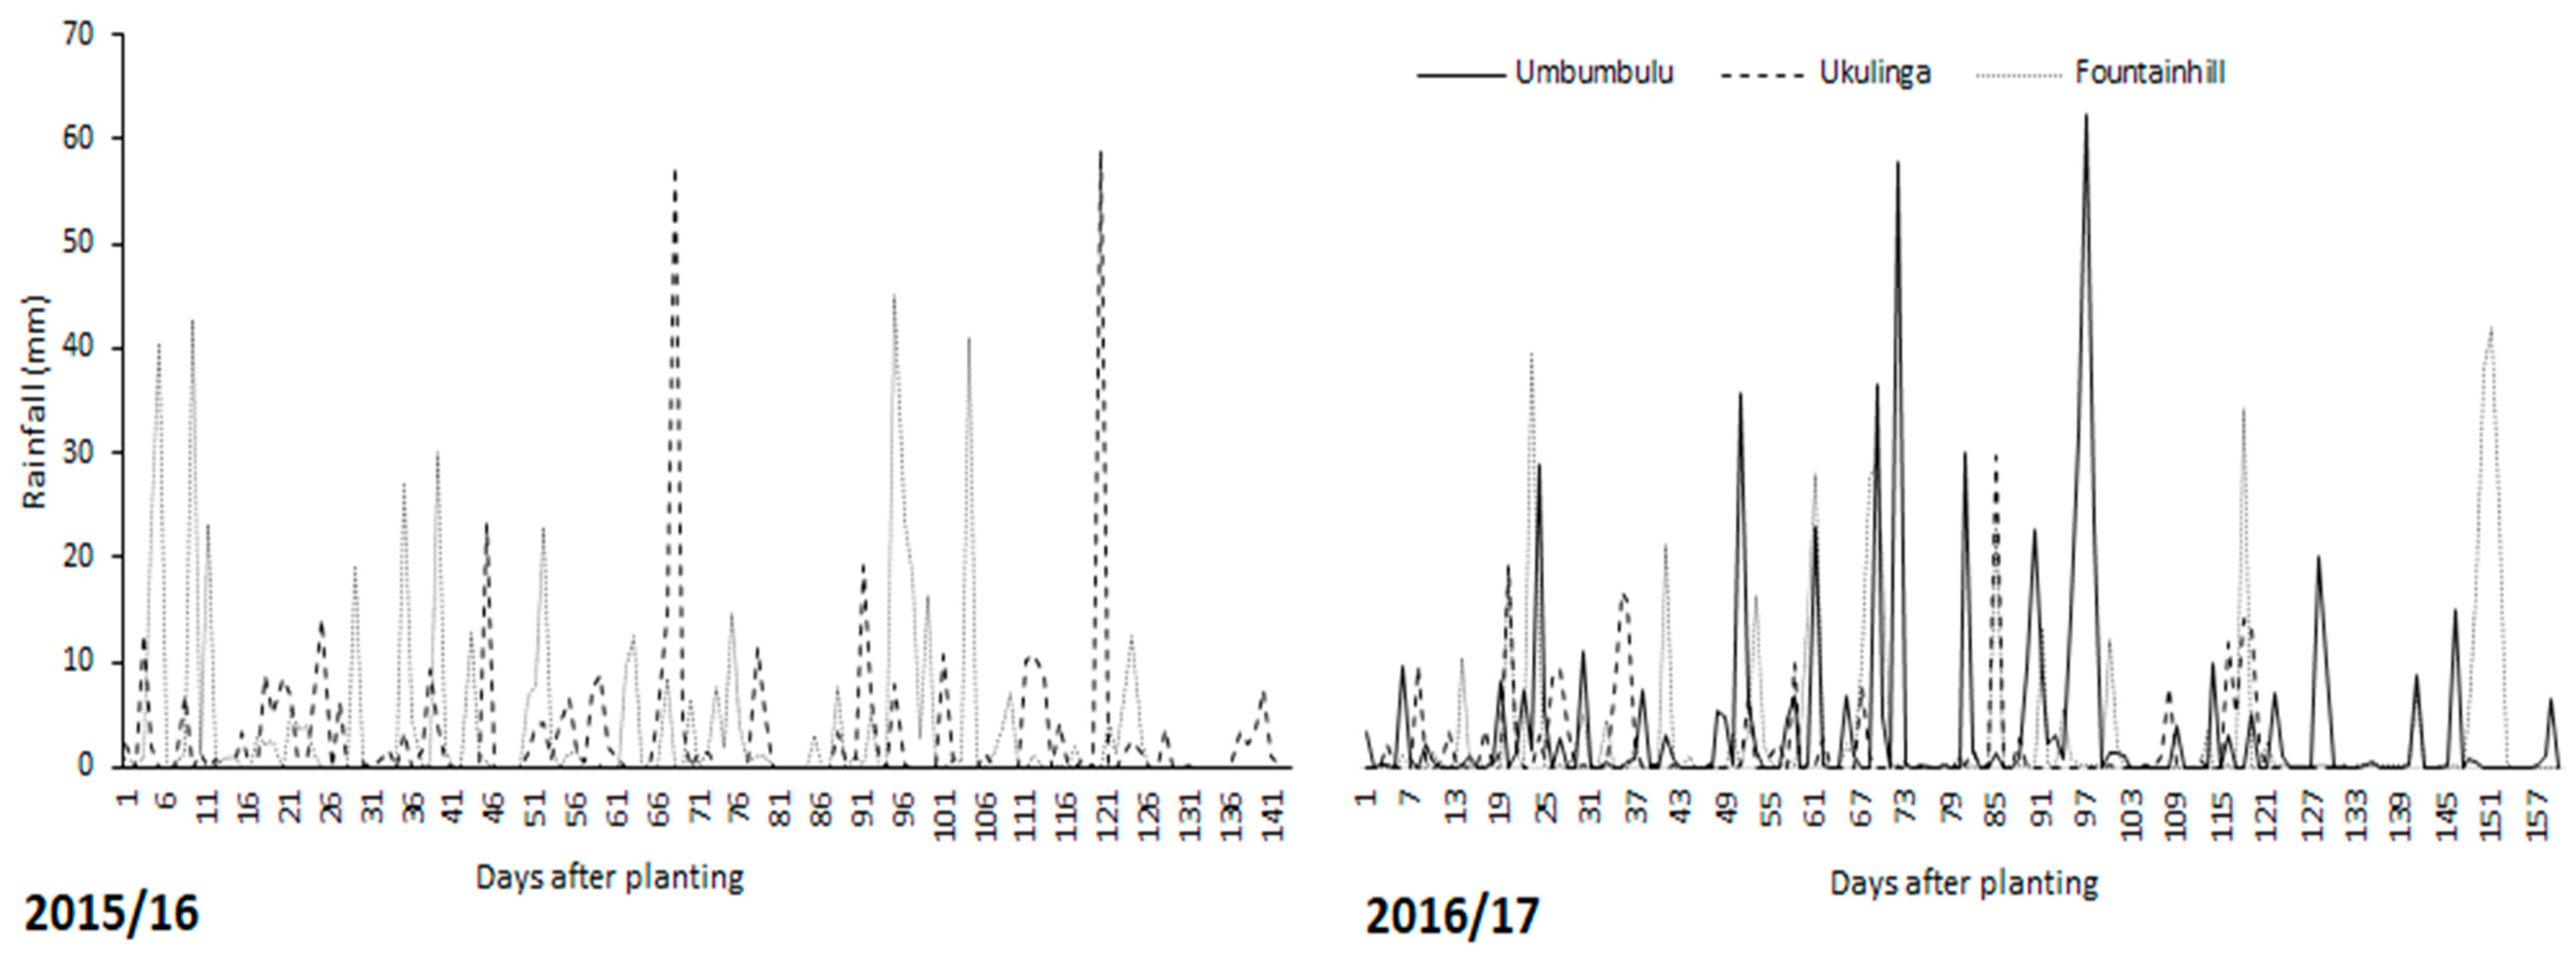
Daily rainfall (mm) was obtained from weather stations within a 10 km radius from the sites. At Fountainhill and Umbumbulu, daily rainfall data was obtained from the South African Sugar Association (SASA) weather web portal (
http://portal.sasa.org.za/weatherweb). At Ukulinga, daily rainfall data was obtained from an automatic weather station (AWS), which is part of the Agricultural Research Council – Institute for Soil, Climate and Water (ARC-ISCW) network of automatic weather stations. Changes in soil water content (SWC) were measured using a PR2/6 profile probe connected to an HH2 handheld moisture meter (Delta-T, Burwell, UK). The sensors of the PR2/6 profile probe are positioned to measure volumetric water content at six depths (0.10, 0.20, 0.30, 0.40, 0.60 and 1.00 m along the probe). The effective depth at Ukulinga was 0.40 m, hence the sensors positioned at 0.60 and 1.00 m were considered during analyses.
Drainage was considered as negligible. At Ukulinga, there was an impeding layer at 0.4 m which restricted downward movement of water beyond the root zone. At Fountainhill and Umbumbulu, drainage was considered negligible based on Dancette and Hall [
32] where in semi- and arid environments drainage is negligible if the profile is not periodically saturated to drain excess water. Runoff (R) was not quantified during the trials. However, to account for its effect the United States Department of Agriculture–Soil Conservation Service (USDA-SCS) procedure was used to estimate the monthly effective rainfall that is stored in the root zone after subtracting the amount of rainfall lost to runoff [
33]. The soil water balance was therefore simplified to;
where: ET = evapotranspiration = water use (mm), ER = effective rainfall (mm), I = irrigation (mm), and ΔSWC = changes in soil water content (mm). Values of ET in mm (depth) were then converted to m
3 (volume) using the formula;
2.4.3. Determination of Nutritional Content (NC)
To preserve nutrients and avoid further metabolic reactions, grain was freeze-dried using a model RV3 vacuum freeze drier (Edwards, Hampton, NH, USA) after yield determination. Thereafter, samples were ground using a coffee grinder (Mellerware, Durban, South Africa) and sent to the KZN Department of Agriculture and Rural Development Plant Nutrition Lab. The nutrients analysed per dry matter basis included macro-nutrients (fat and protein) and micro-nutrients [calcium (Ca), zinc (Zn), iron (Fe)].
Determination of macro nutrients (fat and protein) followed the Association of Official Analytical Chemists (AOAC) standard procedures for nutrient analysis [
34]. Dry matter was determined by drying samples in a fanned oven at 100 °C for 24 h. Nitrogen (N) was determined by the micro-Kjeldahl method. Thereafter, crude protein was calculated as:
Crude fat was determined according to the soxhlett procedure. Ash was determined by igniting fibre samples in a furnace at 550 °C overnight. The carbohydrate content was then determined as the difference between 100% and addition of the percentages of moisture, fat, crude protein, and crude fibre. The mineral composition (Ca, Zn, Fe) were determined using the dry ashing (DA) technique [
34]. An aliquot of 25 mL was placed in crucibles. Thereafter, samples were placed in an oven set at 50 °C to heat overnight. Following this, crucibles with residues obtained after vaporisation of water and most organic compounds were introduced in a high temperature muffle furnace and ashed at 450 °C for 24 h. Thereafter, samples were cooled and residues treated with nitric acid while on warm hot plate. Samples were then transferred back to the muffle furnace for 24 h. White ashes obtained were dissolved in a beaker with 20 mL 5% (v/v) nitric acid. The solution was then transferred to a 25 mL volumetric flask by rinsing with 5% v/v nitric acid. The solution then was used to determine Ca, Zn, Fe using an atomic absorption spectrophotometer (AAS) (Analytikjena AG, Jena, Germany).
2.4.4. Determination of Nutritional Water Productivity (NWP)
Nutritional water productivity was calculated based on the formula by Renault and Wallender [
4]:
where NWP is the nutritional water productivity (nutrition m
−3 of water evapotranspired), Ya is the actual harvested grain yield (kg·ha
−1), ET is the actual evapotranspiration (m
3·ha
−1), and NC is the nutritional content per kg of product (nutrition unit·kg
−1).
2.5. Data Analysis
Several factors affected the final data collection. In particular, data for cowpea were missing at Ukulinga due to animal attacks, hence no cowpea data are reported for both 2015/16 and 2016/17 season. At Umbumbulu, there was a hailstorm during 2015/16 which damaged plants. This occurred after the planting window and experiments could not be replanted, hence no data are reported for Umbumbulu during 2015/16. These considerations were taken into account as part of data analyses. Data from Ukulinga (the irrigation treatments) and from the three sites (rainfed trials) were analysed separately. For both data sets, data of the two seasons (2015/16 and 2016/17) were subjected to Bartlett’s test for homogeneity of variance in GenStat® 18th Edition (VSN International, London, UK). Results of both data sets showed evidence of non-homogeneity between the two seasons hence a separate analysis of the seasons was conducted. The data sets (the irrigation treatments) and (the three sites) were subjected to analysis of variances (ANOVA) using GenStat® version 18 (VSN International, London, UK). Least significance difference (LSD) was used to separate means at the 5% level of significance.
4. Discussion
The objectives of the study were to determine the nutrient content and NWP of selected indigenous and major grain legumes in response to water regimes and production environments. To the best of our knowledge, this is the first study providing a comparative study of nutritional content and NWP of indigenous and major grain legumes grown under the same conditions. Previous studies that have compared nutritional content and NWP of grain legumes have relied on information obtained from a range of studies that were conducted under different environmental conditions [
4,
35].
Crops differed in their nutritional content. Groundnut had higher fat content relative to the other crops; a 100 g serving of groundnut can supply the Recommended Dietary Allowance (RDA) of fat (40–78 g). A gram of fat contains ≈37.6 kJ of energy, hence fat rich foods are good sources of energy. The high fat content of groundnut has been explored through processing into peanut butter and extraction of oil for household use. This makes groundnut a multi-purpose grain legume, and partly explains the reason why groundnut is an important and major grain legume. However, over consumption of groundnut poses risk associated with excess fat consumption, which is one of the major causes of obesity [
36,
37]. In semi- and arid regions, 30% of the population is overweight and obese [
1], hence the promotion of groundnut needs to be accompanied with proper consumption recommendations. This also supports the need to diversify grain legumes to avoid over reliance on a few major legumes such as soybean and groundnut that have high fat content.
For all the grain legumes, protein content was between 205 and 325 g·kg
−1, implying that a 100 g portion of legume supplies 40–60% of protein RDA (50 g). This confirms arguments that legumes can be promoted as alternatives to meat, to avoid protein energy malnutrition [
22,
23]. Legumes have also been associated with containing appreciable amounts of micronutrients [
38,
39,
40]. In the semi- and arid regions, Fe, Ca and Zn are among the problematic micronutrients as their deficiency has devastating consequences such as anaemia in women of reproductive age and birth defects in children [
37]. For Fe, Ca, Zn, the RDA for an adult is 18 mg, 1000 mg and 11 mg, respectively [
41]. Fruits and vegetables are the major sources of micronutrients, but they are not always available due to price and seasonality. Dry bean and cowpea have the potential to supply 40 to 60% of Fe and Zn RDA. In the case of Zn, this study showed that cowpea and dry bean contained ≈500% more Zn than leafy vegetables that have been observed to contain 2.9 to 15.1 mg·kg
−1 [
24]. While vegetables such as spider flower contain more Fe than grain legumes (200 mg·kg
−1), Fe content of grain legumes is comparable to those observed for vegetables such as Swiss chard and cabbage (38.80–98.40 mg·kg
−1) [
24]. This study brings a new perspective that vegetables are not the only major source of micronutrients but legumes’ micronutrient value is comparable to that of leafy vegetables. This supports the role of legumes in increasing dietary diversity as they can complement cereals and vegetables in diets to meet the required nutrients for a healthy life [
23].
Among the grain legumes under study, bambara groundnut had the lowest macro- and micro nutrient content. Nutrient content of bambara groundnut observed in this study were in the same range of those observed in other studies [
42,
43,
44]. Amarteifio et al. [
43] assessed micronutrient content of various landraces from Botswana, Namibia and Swaziland. They observed large variability within landraces and interestingly landraces from Swaziland had higher micronutrient content than landraces from Namibia and Botswana. This demonstrates that some bambara groundnut landraces are more nutrient dense than others. Findings of this study are a first, as they suggest that non - uniformity in nutrient content of bambara groundnut is not limited to different landraces but may also occur within the same landrace. During 2016/17, bambara groundnut had ≈100% more Ca under DI compared to the other treatments. This non-uniformity in nutrient content within and across bambara groundnut landraces may hamper its promotion in the semi- and arid tropics. This calls for breeding efforts to select for nutrient dense landraces that can be used in breeding for high and uniform nutrient content.
Nutrient content of crops differed across water treatments and environments. When rainfall was low (Ukulinga during 2016/17), protein content for all the crops was also low. The low protein content under water limited conditions is attributed to low nitrogen (N) uptake by the plant. Nitrogen is correlated to protein content because it is important for synthesis of amino acids which are building blocks of proteins. Under water limited conditions, the activity of the enzyme that converts nitrogen to a form that is readily available to plants (nitrate reductase) is reduced [
45]. This ultimately reduced N availability to the plant [
45], and consequently protein synthesis was reduced. This implies that water stress does not only affect yield, but can also affect protein content of crops. Fe content was higher at Ukulinga compared to the other sites. Fe is not readily mobile to different plant organs and its delivery to seeds depends on a continuous Fe transport system [
45,
46].The moisture of soil affects Fe availability. Wet soils have greater Fe availability for plants due to higher Fe
2+/Fe
3+ ratio [
45,
46]. Ukulinga was characterised by shallow soil profile and clay soil hence good water holding capacity. This could have enhanced Fe mobility from roots to seeds. Inherent environmental conditions influenced grain nutrient content but there is still a dearth of information on how inherent environmental conditions and plant nutrient availability affects grain nutrient content in different crops.
To the best of our knowledge, this is the first study to determine the NWP of grain legumes based on in situ measurements and not estimates, hence results are more reliable. Nutritional water productivity varied significantly among the crops. With respect to fat productivity, groundnut was the most productive producing up to 400 g·m
−3, respectively. This was because of high fat content. For NWP
Fe, Zn and Ca, dry bean was the most productive followed by cowpea. For groundnut, despite the high grain yield, NWP
Fe, Zn and Ca was low due to poor nutrient content. This highlights the need for crop diversification to maximise nutritional productivity as crops showed different qualities. Fe, Zn and Ca contents of dry bean and cowpea observed in this study were comparable to those observed for leafy vegetables. However, NWP
Fe, Zn and Ca observed for leafy vegetables by Nyathi et al. [
24] were higher (≈200%) than those observed by this study for grain legumes. This could be because leafy vegetables relatively used less water (1210–3260 m
−3) and had higher yield (600–9500 kg·ha
−1) than the grain legumes under study. For maximum benefit of Fe, Zn and Ca under water limited conditions, vegetables would be the recommended option as they are more productive. This highlights the importance of merging aspects of water use, yield and nutritional content for effective recommendations on tackling food and nutritional security.
The major legumes (groundnut and dry bean), had the highest protein water productivity, relative to the indigenous grain legumes. In the case of groundnut, it was mostly as a result of high protein content and high yield observed for the crop. For dry bean, high protein water productivity was as a result of low ET and high protein content. For the indigenous grain legumes (cowpea and bambara groundnut), protein water productivity was low due to low protein content, high ET and low grain yield for bambara groundnut and low yield for cowpea. If indigenous grain legumes are to be promoted for crop diversification, there is need for yield and nutritional content improvements, to improve protein water productivity. When comparing protein water productivity values of grain legumes (100–300 g·m
−3) to that estimated for meat products (12–60 g·m
−3) [
35], it is interesting to note that despite meat being the highest protein source, legumes are more productive. This is because water consumption in legume production is less than water consumption for production of meat. This further supports the promotion of legumes as protein alternatives in water scarce areas as they relatively use less water compared to production of meat [
35].
Environments had a significant effect on NWP. This was mostly as a result of yield instability across environments. Fluctuations in NWP followed fluctuations in grain yield. Low grain yield caused low NWP. There has been emphasis on improving yield stability in the context of food security. This study highlights a new insight that yield stability also affects NWP and improving yield stability not only ensures continuous availability of grain but also ensures continuous nutritional gain. Water regimes did not have a significant effect on NWP. Grain yield was also not significantly affected by water regimes. This implies that there is scope to tackle the challenge of food and nutritional security in the semi- and arid tropics under rainfed conditions.


