
Surface and Optical Properties of Gd-Doped ZrO2 Nano Films †
by
Ognian Dimitrov
1,*, 
Irina Stambolova
2,
Sasho Vassilev
1,
Katerina Lazarova
3 and
Silvia Simeonova
4 1
Institute of Electrochemistry and Energy Systems, Bulgarian Academy of Sciences, Akad. G. Bonchev str, bl. 10, 1113 Sofia, Bulgaria
2
Institute of General and Inorganic Chemistry, Bulgarian Academy of Sciences, Akad. G. Bonchev str, bl. 11, 1113 Sofia, Bulgaria
3
Institute of Optical Materials and Technologies, Bulgarian Academy of Sciences, Akad. G. Bonchev str, bl. 109, 1113 Sofia, Bulgaria
4
Faculty of Chemistry and Pharmacy, Sofia University, 1 James Bourchier blvd, 1164 Sofia, Bulgaria
*
Author to whom correspondence should be addressed.
†
Presented at the 2nd International Online-Conference on Nanomaterials, 15–30 November 2020; Available online: https://iocn2020.sciforum.net/ .
Mater. Proc. 2021, 4(1), 4; https://doi.org/10.3390/IOCN2020-07841
Published: 15 November 2020
(This article belongs to the Proceedings of The 2nd International Online-Conference on Nanomaterials)
Abstract
:Nanosized coatings of ZrO2 were deposited on silicon substrates using sol-gel and spin coating techniques. The precursor solutions were prepared from ZrOCl2.8H2O with the addition of different percentage (0.5–5%) of rare earth Gd3+ ions as dopant. The thin films were homogeneous, with average thickness of 115 nm and refractive index (n) of 1.83. The X-ray diffraction analysis (XRD) revealed the presence of a varying mixture of monoclinic and tetragonal ZrO2 polycrystalline phases, depending on the dopant, all of which with nanosized crystallites. Scanning electron microscopy (SEM) as well as atomic force microscopy (AFM) methods were deployed to investigate the surface morphology and roughness of the thin films, respectively. They revealed a smooth, well uniform and crack-free surface with average roughness of 0.8 nm. It was established that the dopant concentration affects the photoluminescence (PL) properties of the samples. The undoped films exhibited broad violet-blue PL emission, while the addition of Gd3+ ions resulted in new narrow bands in both UV-B and visible light regions, characteristic of the rare earth metal. The intensive emission located at 313 nm can find useful application in medical lamps for treatment of different skin conditions.
1. Introduction
Zirconium dioxide thin films have been investigated for a long time as nano coatings suitable for wear resistance and corrosion protection layers, sensors and bio implants due to their thermal and chemical stability, high hardness, corrosion resistance and biocompatibility [1,2,3,4]. Recently, they attract attention as candidates for applications in the optical fields as well because of their high refractive index, large optical band gap, low optical loss and high transparency in the visible and near infrared region [5]. The Zr4+ ion itself do not exhibit photoluminescence properties, but this could be affected strongly by the local defects. Typically, they include different types of impurities, oxygen vacancies, free radicals, etc. that can facilitate broad band PL emission [6]. The sol-gel deposition technique is known to promote the formation of these types of defects in the thin films. Another approach to activate the PL emission is incorporation of luminescent materials, including transition metals and lanthanide ions into the host lattice of ZrO2. The low-phonon energy of ZrO2 opens up the possibility of more efficient luminescence from the activator ions incorporated in it [7]. This is due to the fact that the lower the phonon energy of the host, the higher the probability of radiative transitions of rare earth 3+ ions [8]. In the present work, we incorporated different amounts of Gd3+ ions in sol-gel deposited ZrO2 thin films and monitored the changes in the PL emission as well as the surface morphology, optical properties and phase composition of the films.
2. Materials and Methods
The different sols used for spin coating deposition of the ZrO2 nano films were prepared using ZrOCl2·8H2O which was dissolved in ethanol under vigorous stirring. The zirconium concentration was fixed to 0.25 M in all of them. Small amounts of HNO3 and acetyl acetone were also added to serve as catalyst and complexing agent respectively in molar ratios as follows: ZrOCl2:HNO3:AcAc = 6:1:1. The source of Gd3+ ions used as a doping agent was Gd(NO3)3.6H2O which was added in different concentrations to form four new precursor solutions: with 0.5, 1, 2 and 5% Gd with respect to the zirconium.
The sol-gel deposition was carried out with a commercial spin coating apparatus (Ossila Spin Coater L2001A3) on silicon substrates, which were cleaned previously in ethanol. The deposition program was set to 5000 rpm with spinning duration of 3 s. After each layer the films were dried at 150 °C for 10 min in air and then annealed at 600 °C for 1 h in air to achieve better crystallinity. This procedure was repeated three times until the films thickness reached about 115 nm.
The phase composition of the samples was studied by X-ray diffraction with CuKα-radiation (Philips PW 1050, Eindhoven, The Netherlands). The size of crystallites was calculated using Scherrer’s formula. A scanning electron microscope JEM-200CX (JEOL, Tokyo, Japan) was used for morphology observation of the films. The images were taken in secondary electrons mode (SE) at accelerating voltage of 80 keV. The surface topography of the samples was studied with NanoScopeV atomic force microscope (Bruker Inc., Billerica, MA, USA), operating in a tapping mode in air. The scanning rate was set at 1 Hz and all images were subsequently smoothed by means of the Nanoscope software. The optical reflectance spectra of the samples were measured using UV-VIS-NIR spectrophotometer Cary 5E (Varian) in the spectral range 320–800 nm. The photoluminescence measurements were performed at room temperature at an excitation wavelength of 230 nm by a FluoroLog3–22 Spectrofluorometer (Horiba Jobin Yvon, Palaiseau, France).
3. Results and Discussion
3.1. Phase Structure
The investigation of the phase structure of the films was carried out with XRD analyses and it revealed that all samples possess a mixture of tetragonal (PDF 88–1007) and monoclinic (PDF 37–1484) ZrO2 crystallographic phases (Figure 1). The formation of these phases usually depends on the annealing temperature (Tann) used for crystallization: monoclinic structure forms at Tann < 1170 °C, while tetragonal structure stabilizes at Tann between 1170 and 2370 °C [9]. In our case, the addition of Gd resulted in preferential stabilization of the tetragonal phase at lower temperature (Tann = 600 °C). This however is not an unusual phenomenon when rare earth metals are used as dopants in sol-gel produced ZrO2 [9]. It is also observed that the crystallites associated with the main 101 tetragonal peak on the 2% Gd sample have decreased in size with 1/3 compared to the undoped ZrO2 film.
3.2. Surface Morphology
In order to investigate the surface morphology of the thin films, SEM and AFM techniques were deployed. Figure 2 depicts SEM images at 10,000 and 100,000 magnifications of doped and undoped ZrO2 coatings. No difference can be seen between the two samples—both films possess very smooth, homogeneous and crack free surface.
Similar observations can be made from the AFM images on Figure 3. At low concentration, the dopant does not change the fine, uniform morphology of the thin films surface. At 5% Gd however, slight changes are present: the underlaying of the film becomes smoother on the account of secondary particles being formed on the surface. There is also a slight increase of roughness with the increase of dopant concentration, while the average roughness of the films is about 0.8 nm (Table 1).
3.3. Optical Properties
The optical reflectance spectra of the samples were measured at normal light incidence. The optical constants (n and k) and the films thickness were determined from the reflectance spectra of the films using previously developed calculating procedure [10]. All films dispersion curves obeyed normal dispersion. The data for the refractive index and the extinction coefficient is taken at wavelengths of 600 nm. A summary of the thickness and optical constants for the whole series of thin films is presented in Table 2.
The photoluminescence spectra of the samples were obtained in the wavelength range of 245–800 nm with excitation radiation of 230 nm (5.39 eV). The PL emission consisted of two distinctive narrow peaks in the UV-B and red regions and one broad band between them, centered at about 425 nm (Figure 4a). Lin et al. reported that tetragonal ZrO2 nanocrystalline powders showed whitish blue emission at 425 nm owing to some carbon defects [11]. Indeed, the existence of these defects may lead to charge imbalances in local regions of the crystal structure that could be eliminated by the recombination of holes and electrons, facilitating the PL emission. These carbon defects could have been introduced in our thin films via the sol-gel precursors. The two other peaks in the PL spectra are due to the rare earth metal ions as they appear only in the doped films. The UV-B band at 313 nm is very typical of the Gd3+ ions and it’s related to transitions corresponding to the 6P7/2 → 8S7/2 energy states [12] as depicted on Figure 4b. This type of radiation is known to be effective for treating skin diseases such as vitiligo vulgaris, psoriasis, and periodontitis [13,14,15,16,17,18].
The red emission peak at 628 nm can be attributed to the 6G7/2 → 6P3/2 transition as the excitation energy of 5.39 eV should be enough for the excited electron to reach the conduction band of the host material where the 6Gj energy state of Gd3+ is located [19]. The overall emission color of our thin films is pinpointed on the CIE chromaticity diagram shown in Figure 5a. It is observed that the dopant addition results in a slight red shift from the light blue of the pure ZrO2 film towards more violet colors. It has been established that the optimal dopant concentration that gives the highest intensity of UV-B and red emission in our experiment is 2% Gd. At 5% the quenching effect already takes hold, and the intensity of the PL emission decreases (Figure 5b).
4. Conclusions
A series of thin, homogeneous films of ZrO2, doped with different amounts of Gd (0.5–5%) were successfully deposited by spin coating technique. The phase structure analyses revealed the presence of both tetragonal and monoclinic ZrO2 crystallographic phases. It was established that the rare earth dopant promoted the stabilization of the tetragonal phase as well as the decrease of the crystallites size with one third. The surface morphology of the thin films was very smooth (average roughness of 0.8 nm), without visible cracks and with no great alterations from the presence of the dopant. The refractive index of the films remained high (about 1.83) for the most part of the series. Upon excitation with 230 nm radiation, the samples exhibited violet-blue PL emission. It was established that the rare earth dopant led to a red shift in the film’s emission. The UV-B band at 313 nm caused by the 6P7/2 → 8S7/2 energy transition of the Gd3+ ion has potential application in phototherapeutic devices for treatment of different skin conditions. The maximum PL intensity in this series of ZrO2 thin films was found to be at 2% concentration of Gd.
Author Contributions
Conceptualization, O.D. and I.S.; methodology, O.D., I.S. and K.L.; validation, I.S., K.L., S.V. and S.S.; investigation, O.D., S.V., K.L. and S.S.; writing—original draft preparation, O.D.; writing—review and editing, I.S., K.L., S.V. and S.S.; visualization, O.D.; supervision, I.S. All authors have read and agreed to the published version of the manuscript.
Funding
This research received no external funding.
Acknowledgments
Research equipment of distributed research infrastructure INFRAMAT (part of Bulgarian National roadmap for research infrastructures) supported by Bulgarian Ministry of Education and Science under contract D01-284/17.12.2019 was used in this investigation.
Conflicts of Interest
The authors declare no conflict of interest.
References
- Izumi, K.; Minami, N.; Uchida, Y. Sol-Gel-Derived Coatings on Steel Sheets. Key Eng. Mater. 1998, 150, 77–88. [Google Scholar] [CrossRef]
- Zhang, Z.; Ji, G.; Shi, Z. Tribological properties of ZrO2 nanofilms coated on stainless steel in a 5% NaCl solution, distilled water and a dry environment. Surf. Coat. Technol. 2018, 350, 128–135. [Google Scholar] [CrossRef]
- Dankeaw, A.; Poungchan, G.; Panapoy, M.; Ksapabutr, B. In-situ one-step method for fabricating three-dimensional grass-like carbon-doped ZrO2 films for room temperature alcohol and acetone sensors. Senors Actuators B Chem. 2017, 242, 202–214. [Google Scholar] [CrossRef]
- Kaliaraj, G.S.; Vishwakarma, V.; Kirubaharan, K.; Dharini, T.; Muthaiah, B. Corrosion and biocompatibility behaviour of zirconia coating by EBPVD for biomedical applications. Surf. Coat. Technol. 2018, 334, 336–343. [Google Scholar] [CrossRef]
- Berlin, I.J.; Lekshmy, S.S.; Ganesan, V.; Thomas, P.V.; Joy, K. Effect of Mn doping on the structural and optical properties of ZrO2 thin films prepared by sol–gel method. Thin Solid Films 2014, 550, 199–205. [Google Scholar] [CrossRef]
- Lakshmi, J.S.; Berlin, I.J.; Daniel, G.P.; Thomas, V.P.; Joy, K. Effect of calcination atmosphere on photoluminescence properties of nanocrystalline ZrO2 thin films prepared by sol–gel dip coating method. Phys. B 2011, 406, 3050–3055. [Google Scholar] [CrossRef]
- Salas, P.; Angeles-Chavez, C.; Montoya, J.A.; De la Rosa, E.; Dıaz-Torres, L.A.; Martınez, A.; Romero-Romo, M.A.; Morales, J. Synthesis, characterization and luminescence properties of ZrO2:Yb3+-Er3+ nanophosphor. Opt. Mater. 2005, 27, 1295–1300. [Google Scholar] [CrossRef]
- Lovisa, L.X.; Araújo, V.D.; Tranquilin, R.L.; Longo, E.; Li, M.S.; Paskocimas, C.A.; Bomio, M.R.D.; Motta, F.V. White photoluminescence emission from ZrO2 co-doped with Eu3+,Tb3+ and Tm3+. J. Alloys Comp. 2016, 674, 245–251. [Google Scholar] [CrossRef]
- Córdova-Martínez, W.; De la Rosa-Cruz, E.; Díaz-Torres, L.A.; Salas, P.; Montoya, A.; Avendaño, M.; Rodríguez, R.A.; Barbosa-García, O. Nanocrystalline tetragonal zirconium oxide stabilization at low temperatures by using rare earth ions: Sm3+ and Tb3+. Opt. Mater. 2002, 20, 263–271. [Google Scholar] [CrossRef]
- Lazarova, K.; Vasileva, M.; Marinov, G.; Babeva, T. Optical characterization of sol–gel derived Nb2O5 thin films. Opt. Laser Technol. 2014, 58, 114–118. [Google Scholar] [CrossRef]
- Lin, C.K.; Zhang, C.M.; Lin, J. Phase transformation and photoluminescence properties of nanocrystalline ZrO2 powders prepared via the Pechini-type sol-gel process. J. Phys. Chem. C 2007, 111, 3300–3307. [Google Scholar] [CrossRef]
- Zhong, J.; Liang, H.; Su, Q.; Zhou, J.; Huang, Y.; Gao, Z.; Tao, Y.; Wang, J. Luminescence properties of NaGd(PO3)4:Eu3+ and energy transfer from Gd3+ to Eu3+. Appl. Phys. B 2010, 98, 139–147. [Google Scholar] [CrossRef]
- Tjioe, M.; Gerritsen, M.J.P.; Juhlin, L.; Van De Kerkhof, P.C.M. Treatment of vitiligo vulgaris with narrow band UV-B (311 nm) for one year and the effect of addition of folic acid and vitamin B12. Acta Derm. Venereol. 2002, 82, 369–372. [Google Scholar] [CrossRef] [PubMed]
- Höningsmann, H. Phototherapy for psoriasis. Clin. Exp. Dermatol. 2001, 26, 343–350. [Google Scholar] [CrossRef]
- Reich, A.; Mędrek, K. Effects of narrow band UVB (311 nm) irradiation on epidermal cells. Int. J. Mol. Sci. 2013, 14, 8456–8466. [Google Scholar] [CrossRef]
- Takada, A.; Matsushita, K.; Horioka, S.; Furuichi, Y.; Sumi, Y. Bactericidal effects of 310 nm ultraviolet light-emitting diode irradiation on oral bacteria. BMC Oral Health 2017, 17, 96. [Google Scholar] [CrossRef]
- Berneburg, M.; Röcken, M.; Benedix, F. Phototherapy with narrowband vs broadband UVB. Acta Derm. Venereol. 2005, 85, 98–108. [Google Scholar] [CrossRef] [PubMed]
- Tamboli, S.; Nair, G.B.; Dhoble, S.J.; Burghate, D.K. Energy transfer from Pr3+ to Gd3+ ions in BaB8O13 phosphor for phototherapy lamps. Phys. B 2018, 535, 232–236. [Google Scholar] [CrossRef]
- Motloung, S.V.; Motaung, T.E.; Hlatshwayo, T.T.; Koao, L.F.; Malevu, T.D.; Mpelane, S. Associated aspects on structure, morphology and photoluminescence of MgAl2O4:x% Gd3+ nanophosphor prepared via citrate sol-gel method. J. Electron. Mater. 2019, 48, 3947–3957. [Google Scholar] [CrossRef]
Figure 1.
X-ray diffractograms of undoped ZrO2 thin film (a) and thin film doped with 2% Gd (b).

Figure 2.
SEM images of undoped ZrO2 thin film (a) and thin film doped with 2% Gd (b).

Figure 3.
AFM images of undoped ZrO2 thin film (a) and thin films doped with 1% (b) and 5% Gd (c).

Figure 4.
PL emission spectra of the films (a) and energy levels diagram of Gd3+ transitions (b).
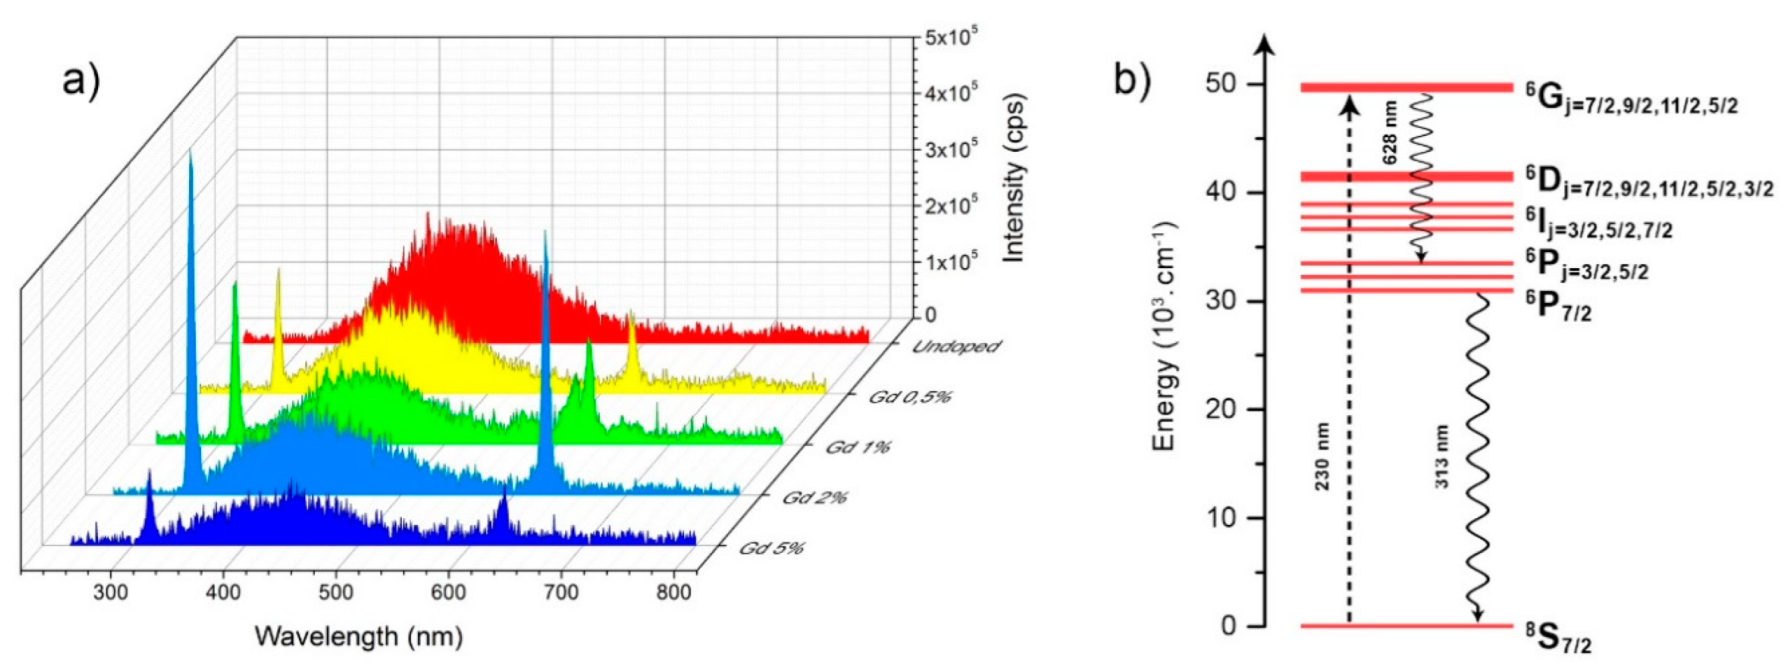
Figure 5.
CIE chromaticity diagram with color coordinates for each sample (a) and evolution of the main emission peaks with dopant concentration (b).
Figure 5.
CIE chromaticity diagram with color coordinates for each sample (a) and evolution of the main emission peaks with dopant concentration (b).


Table 1.
Root-mean-square roughness (nm) of the thin films surface as measured by AFM analyses.
| Undoped ZrO2 | Gd 1% | Gd 5% | |
|---|---|---|---|
| Rq at 2 µm measurement | 0.702 | 0.819 | 0.910 |
| Rq at 5 µm measurement | 0.618 | 0.856 | 0.940 |
Table 2.
Thickness (nm), refractive index and extinction coefficient of the thin films.
| % of Gd | Thickness | n | k |
|---|---|---|---|
| Undoped | 106.3 | 1.83 | 0.004 |
| 0.5% | 104.3 | 1.84 | 0.006 |
| 1% | 106.9 | 1.84 | 0.003 |
| 2% | 125.0 | 1.81 | 0.002 |
| 5% | 136.1 | 1.63 | 0.013 |
Publisher’s Note: MDPI stays neutral with regard to jurisdictional claims in published maps and institutional affiliations. |
© 2020 by the authors. Licensee MDPI, Basel, Switzerland. This article is an open access article distributed under the terms and conditions of the Creative Commons Attribution (CC BY) license (https://creativecommons.org/licenses/by/4.0/).
Share and Cite
MDPI and ACS Style
Dimitrov, O.; Stambolova, I.; Vassilev, S.; Lazarova, K.; Simeonova, S. Surface and Optical Properties of Gd-Doped ZrO2 Nano Films. Mater. Proc. 2021, 4, 4. https://doi.org/10.3390/IOCN2020-07841
AMA Style
Dimitrov O, Stambolova I, Vassilev S, Lazarova K, Simeonova S. Surface and Optical Properties of Gd-Doped ZrO2 Nano Films. Materials Proceedings. 2021; 4(1):4. https://doi.org/10.3390/IOCN2020-07841
Chicago/Turabian StyleDimitrov, Ognian, Irina Stambolova, Sasho Vassilev, Katerina Lazarova, and Silvia Simeonova. 2021. "Surface and Optical Properties of Gd-Doped ZrO2 Nano Films" Materials Proceedings 4, no. 1: 4. https://doi.org/10.3390/IOCN2020-07841