
Starch-Stabilized Iron Oxide Nanoparticles for the Photocatalytic Degradation of Methylene Blue

Department of Chemistry, Institute for Polymer Research and Waterloo Institute for Nanotechnology, University of Waterloo, 200 University Avenue West, Waterloo, ON N2L 3G1, Canada
*
Author to whom correspondence should be addressed.
Polysaccharides 2022, 3(3), 655-670; https://doi.org/10.3390/polysaccharides3030038
Submission received: 21 July 2022
/
Revised: 22 August 2022
/
Accepted: 9 September 2022
/
Published: 19 September 2022
Abstract
:The photocatalytic Fenton process, which produces a strong oxidant in the form of hydroxyl radicals, is a useful method to degrade organic contaminants in water. The Fenton reaction uses hydrogen peroxide and Fe2+ ions under relatively acidic conditions (typically pH 2–3) to maintain solubility of the iron catalyst but is troublesome due to the large volumes of decontaminated yet highly acidic water generated. Starch-stabilized iron (Fe2+/Fe3+) oxide nanoparticles were synthesized to serve as a colloidal catalyst system as the hydrophilic starch effectively prevents precipitation of the nanoparticles under conditions closer to neutrality. To evaluate the usefulness of this catalyst system for the photo-Fenton degradation of methylene blue as a model dye, the preparation protocol used and the iron loading in the starch were varied. The photocatalytic Fenton reaction was investigated at pH values up to 4. Not only were the starch-stabilized catalysts able to decolorize the dye but also to mineralize it in part, that is, to degrade it to carbon dioxide and water. The catalysts could be reused in several degradation cycles. This demonstrates that starch is an efficient stabilizer for iron oxide nanoparticles in aqueous media, enabling their use as environmentally friendly and cost-effective photo-Fenton catalysts. These starch-stabilized iron nanoparticles may also be useful to degrade other dyes and pollutants in water, such as pesticides.
Keywords:
starch; Fenton; photocatalytic; iron; degradation; biodegradable; mineralization; methylene blue; nanoparticles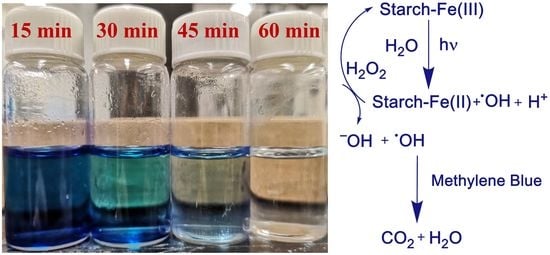
1. Introduction
Natural dyes have been used for a long time, but the colors obtained are generally dull and limited in range. The first synthetic dyes, discovered by Perkins in 1856, led to the development of bright colors and shades; their use and production culminated during the industrial revolution [1]. More than 10,000 dyes are currently being used in the textiles industry. While dyes represent a minor percentage of water pollution, their color in solution makes them highly noticeable, which prompted governments to impose stringent laws requiring cleansing of colored effluent water [2]. Depending on the type of dye used, losses in effluent water can vary from 2 to 50% [3], mainly due to insufficient fixing on the textile fibers [4]. Water effluents are often poorly regulated, and the discharged dyes can have substantial negative consequences on both human health and the environment [4]. Out of the roughly 800,000 tons of dyes produced worldwide yearly, it is estimated that about 10–15% are lost in various processes in the textiles industry [5].
Color removal from water effluents is not an easy task as dyes absorb light strongly at visible wavelengths and can be detected visually at concentrations below 1 mg/L [6]. Decolorizing dyes typically requires several steps as no universal commercially feasible treatment exists. There are three main methods for textile wastewater treatment: physical, chemical, and biological. Physical techniques include filtration, flocculation, and adsorption, which are generally costly and ineffective. Advanced oxidation processes (AOPs, which include the Fenton reaction) and chemical oxidation are two types of chemical methods [7]. The production of iron sludge in the Fenton reaction, owing to flocculation of the catalyst and the dye, as well as the high energy cost of various other chemical oxidation processes, are major disadvantages of the chemical techniques. Enzymatic and microorganism-based approaches can be both cost-effective and efficient, but the degradation timeframe can be longer than 24 h [6]. It has been suggested that, for optimal results, AOPs could be combined with biological remediation [8].
The Fenton reaction is an AOP creating hydroxyl radicals from H2O2 and iron salts (Fe2+/Fe3+) under acidic conditions [9]. One of the benefits of this reaction is that the iron catalysts used in the process are inexpensive and readily available. Furthermore, the only other component in the reaction is H2O2, which is potentially capable of degrading dyes into CO2 and H2O to achieve complete mineralization. The reaction times are typically short, and the process can be carried out at ambient temperature and pressure. The Fenton process involves multiple reactions that can be classified into three categories, namely initiation, propagation, and termination (Table 1) [9,10,11]. The initiation stage generates radicals, such as HO∙, HO2∙, and O2−∙, that initiate the oxidation process, while the propagation stage involves radical reactions with organic compounds to produce and further transform alkyl (R∙) and alkyl peroxide (RO2∙) radicals [9,10,11]. In the termination process, the reactive intermediates are deactivated. The key challenge with the Fenton reaction is to take advantage of the initiation and propagation steps, and to delay termination reactions as much as possible.
The photo-Fenton reaction uses ultraviolet (UV) light in combination with iron (Fe2+/3+) salts and H2O2. It has been shown that the irradiation of Fe3+/H2O2 with UV favors the formation of strong oxidant radicals capable of degrading organic matter in water [7]. An important characteristic of the photo-Fenton reaction is the accelerated reduction of Fe3+ to Fe2+ with the energy provided by light. The UV irradiation also induces the direct photolysis of H2O2, accelerating the production of hydroxyl radicals [13].
Homogeneous photo-Fenton reactions only use Fe(2+/3+), H2O2, and UV light under acidic conditions. Since Fe2+ is easily oxidized, most of the iron species exist as Fe3+. A pH of 2–3 is considered optimal for homogenous Fenton reactions to avoid the formation of insoluble Fe(OH)2+ [13]. Possible sources of UV light include UVA (λ = 315–400 nm), UVB (λ = 285–315 nm), and UVC (λ < 285 nm); in all cases, the yield of hydroxyl radicals varies with the intensity of the light source [14]. This process has been employed to treat several contaminants, such as pesticides and pharmaceuticals [15,16], albeit with drawbacks. The stability of iron salts and H2O2 decreases as the pH increases, which makes the Fenton process strongly pH-dependent. Other issues include the formation of oxohydroxides above pH 3, which precipitate as iron sludge [17].
A solid support is used in the heterogeneous photo-Fenton process to promote the dispersion of the iron oxide particles and increase the effective surface area of the iron species. There are benefits to heterogeneous photo-Fenton reactions over the homogeneous forms. The substrate can be selected to improve the catalytic activity of iron and prevent its leaching in the aqueous environment, thus minimizing the formation of sludge [18]. Since most heterogeneous catalysts use porous substrates, the pollutants can be adsorbed on their surface, resulting in an increased rate of pollutant degradation. This also makes it possible to conduct the reaction over a wider pH range in contrast to the homogeneous Fenton reaction [13].
Several iron-based heterogeneous catalysts have been used for the photo-Fenton reaction. Some of the recent reports include composites of ZnFe2O4 and graphene oxide [19], CuFe2O4 [20], S-doped NiFe-based catalysts [21], metal composites of hexaferrite [22,23], and CoFe2O4 [24] to degrade MB. While most of these catalysts were capable of degrading MB, they were relatively expensive to synthesize and may lead to the formation of sludge due to their poor dispersibility in water. It was also shown that starch can serve as a precursor for the preparation of porous carbon-supported Fe2O3 catalysts [25].
It will now be shown that starch can serve to stabilize iron oxide nanoparticles that are highly active as catalysts for the photo-Fenton reaction. Since starch can adsorb dyes [25], this may facilitate their degradation by concentrating them close to the iron catalyst. In the current investigation, methylene blue (MB) was used as a model pollutant to study dye degradation with the starch-supported catalysts. It is a dark green crystalline solid that dissolves in water to form a bright blue solution, even at concentrations below 1 ppm. It absorbs strongly at 650–670 nm, which makes degradation easy to quantify with UV–visible (UV–vis) spectroscopy measurements [26]. Starch was used in different amounts to stabilize the iron oxide nanoparticles in solution. The starch-stabilized iron oxide nanoparticles exhibited exceptional catalytic activity for the degradation of MB with H2O2. The main objective of the work was to use a minimal amount of starch substrate to stabilize the nanoparticles while achieving optimal MB degradation efficiency. These starch-stabilized iron oxide nanoparticles have several advantages over conventional homogeneous Fenton catalysts in that they are non-toxic, biodegradable, inexpensive, and reusable.
2. Materials and Methods
2.1. Chemicals and Materials
Research-grade cooked starch with Mn = 2.2 × 10⁶ g/mol and Mw = 4.4 × 10⁶ g/mol was provided by EcoSynthetix (Burlington, ON, Canada). Methylene blue (high purity, certified biological stain, ≥99.9%) was from Fisher Scientific (Mississauga, ON, Canada). Trisodium citrate dihydrate (ACS reagent, ≥99.9%), iron (II) chloride tetrahydrate (≥99.9 %), glacial acetic acid (≥99.9%), ammonium hydroxide (30–33% NH3 in H2O), hydrogen peroxide (30% w/w in H2O), 1,10-phenanthroline (≥99.9 %), terephthalic acid (98%), iron(III) chloride (reagent grade, 97%), ferrous ammonium sulfate hexahydrate (ACS reagent, ≥99.9%), NaOH (ACS reagent, ≥98%, pellets), phenol (ACS reagent, ≥98%, pellets), sulfuric acid (99.999%), and sodium acetate (anhydrous, ≥99.9%) were all from Sigma-Aldrich (Oakville, ON, Canada). Spectra/Por dialysis tubing with 50 kDa molecular weight cut-off (MWCO) was supplied by Spectrum Laboratories (Gardena, CA, USA).
2.2. Instrumentation
A Malvern Zetasizer Nano S instrument with non-invasive back scatter technology was used to perform dynamic light scattering (DLS) measurements. The colloidal dispersions were diluted to 3 mg/mL and transferred to a 1 cm path length cuvette for the measurements.
For transmission electron microscopy imaging, the starch-stabilized iron NP samples were diluted to 0.1 mg/mL in deionized water. An 8-μL aliquot of the solution was deposited onto a 400-mesh grid coated with carbon-Formvar and allowed to dry overnight. The sample was then imaged with a charge-coupled device camera on a CM10 Philips microscope operating at 60 kV acceleration voltage.
A Hewlett Packard 8542A diode array spectrophotometer was used to acquire UV–vis absorbance spectra for the samples. Fluorescence measurements were carried out on a PTI QuantaMaster 400 steady-state fluorescence system.
Total organic carbon (TOC) analysis was achieved on a Shimadzu TOC-L analyzer with a 20 μL injection volume. The combustion was conducted at 680 °C, and the products were detected by a nondispersive infrared sensor.
2.3. Synthesis of Starch-Stabilized Iron (Fe2+/Fe3+) Oxide Nanoparticles
Two different protocols were used to obtain starch-stabilized iron oxide nanoparticles. In each case, the starch content was varied to determine the optimal composition for MB degradation.
2.3.1. Starch–Iron (St–Fe) Nanoparticles
A low iron content catalyst system was obtained by the method of Tang et al. with modifications [27]. Cooked starch (300–1000 mg) was dissolved in water (30 mL) by stirring for 2 h in a 50-mL round bottom flask (RBF). Trisodium citrate dihydrate (90 mg, 0.3 mmol) was added, and the solution was stirred further for 15 min before 2 M ferric chloride (1 mL, 2 mmol) was added, immediately followed by a concentrated sodium hydroxide solution until pH 10 was reached. This solution was placed in a water bath at 30 °C, stirred for 24 h, and then centrifuged at 10,000 rpm and 20 °C for 20 min. Finally, the supernatant was dialyzed against water for 48 h in a Spectra/Por dialysis bag with 50 kD MWCO.
2.3.2. Iron–Starch (Fe–St) Nanoparticles
A higher iron content catalyst system was obtained starting from iron oxide nanoparticles prepared by a modification of the co-precipitation method outlined by Krenkova et al. [28]. Iron (II) chloride tetrahydrate (0.3 g, 1.5 mmol), iron (III) chloride (0.82 g, 5.1 mmol), acetic acid (20 μL, 0.35 mmol), and trisodium citrate dihydrate (1.14 g, 4.4 mmol) were dissolved in 38 mL of water in a 100-mL RBF. A 25% ammonium hydroxide (2.5 mL) solution was then rapidly added under vigorous stirring at room temperature, followed by cooked starch (100–300 mg), and stirring was continued for ~16 h. Finally, the solution was dialyzed against water for 48 h in a Spectra/Por dialysis bag with 50 kD MWCO.
2.3.3. Starch-Free Iron Oxide Nanoparticles
Iron oxide (Fe3O4) nanoparticles without starch stabilizer were prepared by the co-precipitation method outlined by Krenkova et al. [28]. Iron (II) chloride tetrahydrate (0.3 g, 1.5 mmol), iron (III) chloride (0.82 g, 5.1 mmol), acetic acid (20 μL, 0.35 mmol), and trisodium citrate dihydrate (1.14 g, 4.4 mmol) were dissolved in 38 mL of water in a 100-mL RBF. A 25% ammonium hydroxide (2.5 mL) solution was then rapidly added under vigorous stirring at room temperature. The iron oxide colloid was precipitated with acetone (200 mL) and centrifuged at 12800× g for 10 min. The supernatant was discarded, while the pellet was redispersed in water (40 mL) by sonication. The process was repeated 5 times to eliminate excess citrate ions. Krenkova et al. and Karaagac et al. characterized the iron oxide nanoparticles obtained by X-ray diffraction, Fourier transform infrared spectroscopy, transmission electron microscopy, and scanning electron microscopy [28,29].
2.4. Quantification of the Iron Content
The iron in the starch-stabilized nanoparticles was quantified according to a method described by Pitarresi et al. [30]. To evaluate the iron sequestered in the starch–iron oxide nanoparticles, 0.3511 g (0.8954 mol) of ferrous ammonium sulfate (Fe(NH4)2(SO4)2∙6H2O) and 5.0 mL of 6 M sulfuric acid were dissolved in water in a 500 mL volumetric flask. A 5.0 mL aliquot of this solution was transferred to a 100 mL volumetric flask and 10 mL of acetate buffer (5.0 M HC2H3O2, 0.5 M NaC2H3O2) was added, along with 10 mL of 10% w/v hydroxylamine hydrochloride (NH2OH∙HCl). After allowing the reduction of Fe3+ to Fe2+ for 10 min, 10 mL of 0.1% 1,10-phenanthroline solution was added. The solution was diluted to the 100 mL mark and allowed to sit for 10 min until a stable reddish-orange color developed. The above steps were repeated using 1.0, 2.0, 3.0, and 4.0 mL of the Fe(NH4)2(SO4)2 standard solution, and the samples were used to obtain a calibration curve. The same preparation procedure was applied to 0.3511 g samples of starch–iron nanoparticles for iron quantification. The solutions were analyzed in a UV–vis spectrometer to determine their absorbance at 510 nm, and the unknown samples were compared with the calibration curve to determine their iron content.
2.5. Photo-Fenton Experiments
The activity of the starch–iron (St–Fe) and iron–starch (Fe–St) catalysts was investigated with methylene blue as model pollutant. At pH values ranging from 2–4, a 10 mL aliquot of methylene blue solutions of varying concentrations (4–32 mg/L) was treated with different amounts of Fe from the catalyst (9.9–580 μmol/L) and H2O2 (45–720 μmol/L). It should be noted that, due to the potential presence of different forms of iron oxide and hydroxide in the catalysts, the catalyst concentration in the reactions is always expressed in μmol Fe/L. Four 350 nm Rayonet tube lamps were used to irradiate the samples inside a UV box (150 cm × 60 cm × 90 cm) at a distance of ~18 cm. The experiments were conducted in triplicate, the samples being measured every 15 min in a UV–vis spectrometer to determine the residual MB concentration. The reactions were stopped when at least 80% MB degradation was achieved.
The starch-stabilized iron oxide nanoparticles were tested for their reusability, in which case MB at a concentration of 4 mg/L was degraded in multiple cycles. In each cycle, aliquots of a concentrated (1 g/L) MB solution were added to bring the MB concentration back to 4 mg/L. The additions were made every 60 min to ensure complete degradation before the next addition.
2.6. Spectrophotometric Detection of Hydroxyl Radicals
Terephthalic acid was used as a fluorescence probe for the quantification of hydroxyl radicals. To that end, 60 mL of 0.06 M terephthalic acid (C8H6O4), 6 mL of acetate buffer (pH 4.0, 0.1 M), 400 μL (9 mM) of H2O2, and varying concentrations of 1000 mg St–Fe catalyst were mixed to be analyzed in a fluorescence spectrometer. An excitation wavelength of 315 nm was used, and the emission was monitored from 330–600 nm.
2.7. Colorimetric Test for Fe3+ Leaching
Different concentrations of starch-stabilized iron nanoparticles (0.005–0.01 M Fe) were allowed to equilibrate with phenol (0.06 M) and analyzed in a UV–vis spectrometer.
3. Results and Discussion
3.1. Catalyst Synthesis and Characterization
Two distinct protocols were designed to prepare starch-stabilized iron oxide nanoparticles with different iron: citrate: starch ratios. Spectrophotometry served to quantify the iron content by weight in the purified starch-stabilized iron nanoparticles (Table 2). To this end, Fe3+ was reduced to Fe2+ with hydroxylamine hydrochloride since Fe2+ forms a reddish-orange tris complex with 1,10-phenanthroline. The resulting compound absorbs light in the visible range, with maximum absorption at about 510 nm. Starch, citrate, the oxygen component of iron oxide, and, potentially, impurities constituted the non-iron components of the catalyst. The weight (in mg) of starch added in the synthesis is specified in the sample nomenclature used. The St–Fe NPs were formed in the presence of starch (in situ), but starch was introduced after the synthesis of the NPs (ex situ) for the Fe–St NPs. It was determined that the Fe–St NPs contained more iron than the St–Fe NPs (Table 2). This is most likely due to the presence of a larger amount of sodium citrate, serving as a ligand for Fe3+ions, in the Fe–St NPs. Sodium citrate may also act as a bridging agent between the iron ions and the cooked starch in the reaction. Upon dialysis, however, excess sodium citrate may be eliminated and allow enhanced interactions between the iron and starch [30].
Dynamic light scattering (DLS) analysis was performed to determine the average size of the starch–iron complexes (Figure 1). For cooked starch and the 100 mg Fe–St catalyst, the Z-average diameter was 89 and 76 nm, respectively. The St–Fe complexes prepared from 1000 and 300 mg St–Fe had Z-average diameters of 165 and 185 nm, respectively, while the Fe–St catalyst with 300 mg starch had a diameter of 152 nm. The intensity-weighed size distribution curves shown in Figure 1 clearly show that the St–Fe sample prepared with 1000 mg of starch was aggregated, while the distribution became narrower as the starch content was decreased for both sample types. The catalyst system with the lowest starch content (100 mg Fe–St) was least aggregated, with a size closest to the starch substrate. While the presence of starch during the synthesis prevents the immediate agglomeration of nanoparticles [31], increasing the starch concentration apparently favors aggregation of the starch–iron oxide composite. This is clearly observed for 1000 mg St–Fe, which contained the lowest amount of iron by weight and the highest amount of starch in the synthesis.
TEM imaging (Figure 2) confirmed the presence of iron (Fe2+/Fe3+) oxide NPs embedded within the starch matrix. In the images, the dark spots/shaded areas are due to the iron NPs, while the lighter shaded areas are for the starch. During imaging, it was occasionally observed that the catalyst (most likely the starch component) would degrade due to exposure to the high-intensity electron beam. The TEM images demonstrate the presence of a large number of small particles with diameters well below 50 nm but agglomerated into particles with diameters sometimes over 50 nm (Figure 2). There may be a few reasons for the differences in average particle sizes obtained by TEM and DLS analyses. Because the intensity of the DLS signal relies on the size of a scattering center as I ~ r6, the overall intensity contribution from large particles is very large even though they may be present in small numbers. Because DLS analysis is more sensitive to large particles, the DLS size distribution is always skewed toward larger sizes [32].
3.2. Degradation of MB with Starch-Stabilized Iron Oxide Nanoparticles
3.2.1. Control Experiments
The catalytic activity of starch-stabilized iron (Fe2+/Fe3+) oxide NPs was studied with MB as a model pollutant. Since pH 3 is considered optimal for the Fenton reaction, control reactions were completed at this pH. It should be noted that, because the absorbance of a solution is proportional to the MB concentration, the ratio of the absorbance at time t to the initial absorbance (At/Ao) was proportional to the relative concentration (Ct/Co), or the relative amount of dye left in the sample. Control experiments were carried out by excluding one of the components required for the reaction (catalyst, H2O2, or UV light), while the concentrations of catalyst and H2O2 were set at 290 μmol/L Fe and 360 μmol/L, respectively, which are typical concentrations used in the remainder of the investigation. As can be seen in Figure 3a, degradation of the dye was very limited in the absence of catalyst, H2O2, or UV light. The Fe3O4 NPs prepared without starch but only with citrate were also ineffective at degrading MB as they were colloidally unstable in aqueous solutions at pH 3. Quick and efficient degradation of MB was thus only possible when the combination of the developed catalysts, H2O2, and UV irradiation was used.
The Fenton process involves over 20 reactions (Table 1), but the most important step is shown below [13]. The hydroxyl radicals generated in the reaction responsible for MB degradation are highly oxidizing in nature, as portrayed by their strong oxidation–reduction potential of 2.8 V [33].
The hydroxyl radicals generated could be detected by fluorescence spectroscopy, using terephthalic acid as a fluorescence probe. As expected, an increase in fluorescence intensity was observed over 60 min due to the increased production of hydroxyl radicals (Figure 3b).
Hereafter, all the Fenton reactions were completed at pH 4 as efficient MB degradation was not observed above that pH. One reason for this could be that H2O2 is unstable above pH 4, breaking down into water and oxygen [34]. Moreover, starch hydrolysis and the production of hydroxide ions in the Fenton reaction may lead to an increase in pH, which would accelerate the decomposition of H2O2:
3.2.2. Influence of UV Radiation Source and H2O2 Concentration
The influence of the irradiation source was also investigated by comparing direct sunlight illumination with the Rayonet UV lamp sources (Figure 4). A modest increase in degradation efficiency was detected with direct sunlight (Waterloo, October 10th, 2019, 14:00, 17 °C, 56% relative humidity), which might be related to a higher UV intensity from sunlight, or else to the broader wavelength spectrum of solar radiation as compared with 350 nm UV sources [13]. These results show that, beyond considerations of energy consumption and potential hazards, sunlight may be preferable over UV light as an irradiation source. It may also significantly lower iron sludge formation and improve H2O2 breakdown [35]. For the purpose of the current investigation, however, the 350 nm UV sources were preferred to ensure a consistent irradiation intensity for testing.
The influence of the H2O2 concentration was investigated using the 1000 mg St–Fe catalyst with UV irradiation at pH 4 and 290 μmol/L Fe, as shown in Figure 4b. The peroxide concentration appears to have little effect on the process, and the reaction actually seems to proceed slightly faster at the lower H2O2 concentration (180 μmol/L). It has been suggested that this negative impact is due to scavenging of the ∙OH radicals by H2O2 as described by Equation (3), which affects the pollutant degradation efficiency [9,10,11]. Therefore, in addition to being wasteful, an excessive peroxide concentration has a detrimental influence on the degradation process: a decrease in MB degradation rate occurred when the H2O2 concentration was tripled (Figure 4b). In addition to being wasteful, excess H2O2 can have a negative impact on the degradation process.
3.2.3. Optimization of the H2O2: Fe Ratio
Marianna et al. [36] reported that an H2O2 : Fe ratio of 20 : 1 was optimal for the breakdown of the Reactive Yellow 84 azo dye, while, according to Tengrui et al. [37], a ratio of 2.5 : 1 was best for the degradation of landfill leachate. It, therefore, appears that the optimal H2O2 : Fe ratio can vary widely for different catalyst systems and degradation substrates. Considering that starch can also contribute to the consumption of HO∙ radicals in the photo-Fenton reaction, the amount of starch added in the synthesis of the starch-stabilized catalysts was varied to be either 1000 or 300 mg for the St–Fe catalysts (Section 2.3.1), and either 300 or 100 mg for the Fe–St catalysts (Section 2.3.2). A change in starch content may likewise influence the optimal H2O2 : Fe ratio for MB degradation. Consequently, we examined the activity of the four catalysts at different iron concentrations from 32–290 μmol/L, and H2O2 concentrations from 90–360 μmol/L. The H2O2 : Fe ratio was optimized for each of the four catalyst systems listed in Table 2, at MB at concentrations up to 32 mg/L with UV irradiation at pH 4. The optimal H2O2 : Fe ratios for the 1000 mg St–Fe, 300 mg St–Fe, 300 mg Fe–St, and 100 mg Fe–St catalyst were determined to be 1.2 : 1, 3.6 : 1, 1.1 : 1, and 2.8 : 1, respectively.
3.2.4. Activity of the Starch-Stabilized Iron Catalysts
The performance of each of the four catalysts under optimal conditions for the degradation up to 32 mg/L MB is depicted in Figure 5. It is clear that the initial degradation rate (slope) was greater for the Fe–St than the St–Fe NPs. The two types of NPs differed not just in terms of starch content but also in how they were synthesized. According to the weight ratios in Table 2, the ratio of starch to iron used for the preparation of the Fe–St NPs was much lower than for the St–Fe NPs. The goal in synthesizing the Fe–St NPs was to minimize starch breakdown competing with MB degradation while achieving a concentration of H2O2 similar to or lower than in the St–Fe degradation tests. The decreased amount of starch in the Fe–St catalysts should lower markedly the reaction probability of starch with the potent hydroxyl radicals in solution [38]. Furthermore, it was shown in Figure 1 that a lower amount of starch led to better dispersion (reduced aggregation) of the iron oxide nanoparticles. The combination of lowered starch content and increased surface area achieved for the Fe–St system may explain their enhanced catalytic activity, resulting in more efficient pollutant degradation.
For Fe–St, the addition of starch after the formation of the iron nanoparticles and the use of a larger amount of sodium citrate (complexing agent) apparently improved the accessibility of the iron oxide nanoparticles to H2O2 and UV light. The 300 mg Fe–St sample had almost the same iron content as the 1000 mg St–Fe sample, but the synthetic route affected the activity of the catalyst. The presence of excess starch in 1000 mg St–Fe, combined with enhanced aggregation, would have yielded a thicker starch coating around the iron NPs, making the catalyst surface less accessible.
Overall, the higher iron content of the Fe–St NPs led to faster degradation of MB than the St–Fe NP catalyst system. The 100 mg Fe–St catalyst was indeed highly effective as over 90% degradation was achieved for 32 mg/L MB within 30 min when using 32 µmol/L Fe and 90 µmol/L H2O2. This is an overall iron concentration similar to that used for the 300 mg St–Fe catalyst, likewise yielding 80% degradation for 32 mg/L of MB, but only after 60 min. However, since only 100 mg of starch was added in the synthesis of 100 mg Fe–St, the starch encapsulation should be thinnest, leading to fast degradation rates. Moreover, the 100 mg Fe–St NPs were smaller and more narrowly dispersed, as observed in the DLS measurements (Figure 1); i.e., minimal aggregation was observed for these particles.
3.2.5. Multiple Additions of Methylene Blue
The different starch-stabilized iron nanoparticles were tested for their reusability by conducting successive degradation cycles of 4 mg/L MB solutions as shown in Figure 6. To this end, a few µL of a 1 g/L (concentrated) MB solution were added every hour so that the reaction mixture contained 4 mg/L of MB at the beginning of each degradation cycle. The hourly timing of the additions was to guarantee full dye degradation before the new addition. The number of consecutive completed (>80% degradation) cycles for 1000 mg St–Fe, 300 mg St–Fe, 300 mg Fe–St, and 100 mg Fe–St were 2, 7, 3, and 2, respectively.
Even though the 1000 mg St–Fe and 100 mg Fe–St samples could degrade MB at concentrations up to 32 mg/L, they were only able to perform less than three complete degradation cycles with 4 mg/L MB. This could be due to a shortage of HO∙ radicals or a lack of NP accessibility, especially for the 1000 mg St–Fe NPs. The recombination of the HO∙ radicals to create water and oxygen is a likely possibility leading to their depletion: [9,10,11].
Another reason might be the strong pH dependence of the self-decomposition of H2O2. In practice, H2O2 is supplied as slightly acidic solutions (pH below 5) to avoid fast self-decomposition at higher pH values: [9]
While the initial pH of the reaction was set to 4, it gradually increased to 4.20 after the first degradation cycle and up to 4.50 in subsequent cycles, presumably due to the different rates of the following termination reactions favoring the production of OH− anions:
This causes a drift in the rates of formation and consumption of H+ ions as the reaction proceeds. The most successful catalyst in the multiple additions test (Figure 6) was the 300 mg St–Fe NPs, which completed seven MB degradation cycles at a concentration of 4 mg/L. Moreover, an increase in degradation rate was observed for 300 mg St–Fe after the first degradation cycle, while all the other catalysts had decreasing degradation rates in successive cycles. This increase could be due to partial degradation of the starch encapsulating the iron, allowing easier access to the catalyst surface. The degradation of starch was obvious from the decrease in total organic carbon (TOC) in the analysis of the blank after degradation, as discussed in detail below.
3.3. Total Organic Carbon (TOC) Analysis
The degraded samples were investigated in a TOC analyzer after 60 min of UV irradiation. Unfortunately, it was not possible to inject the MB solutions for analysis prior to degradation since the dye would stain the tubing in the instrument. A blank for each sample, namely a solution of the starch-stabilized iron catalyst and H2O2, was analyzed first. The TOC of the blank solution was measured again after 60 min of UV exposure, as described in Section 2.5, but without MB. The initial organic carbon content of MB solutions at concentrations of 4, 8, and 16 mg/L was calculated by adding the contribution from MB to the blank reading. Finally, the TOC content was determined by injecting the degraded MB solutions into the TOC analyzer. Even though starch and citrate degradation was only partial, the extent of MB mineralization could be calculated by taking into account the residual TOC of the blank according to the procedure described below. The theoretical (initial) TOC of the MB solutions was calculated as follows:
The Final TOC value obtained after degradation was used to calculate the % mineralization of MB as follows:
The starch-stabilized iron nanoparticles were tested at 4, 8, and 16 mg/L of MB, and at different concentrations of Fe and H2O2 (Table 3). The iron and H2O2 concentrations were selected based on the performance of the various starch-based iron NPs in the UV–vis tests discussed above (Figure 5). The 1000 mg St–Fe catalyst was not tested as the MB concentration was much lower than the starch concentration in that sample (<10%), leading to large errors.
A mineralization level of 57% was obtained when degrading 4 mg/L of MB with 300 mg St–Fe, which dropped to 40% for 16 mg/L MB (Table 3a). However, as previously observed in the UV–vis experiments (Figure 6), the discoloration rate increased in the second degradation cycle for that catalyst, which could potentially lead to more promising results. Unfortunately, due to instrumentation limitations, it was not possible to measure the % mineralization over successive cycles of MB degradation. According to Table 3, the 300 mg St–Fe NPs contained the most starch among the three catalyst systems studied in these tests, suggesting that HO∙ radicals may have contributed to starch mineralization in addition to MB mineralization. Since the starch was only partially degraded, as shown in the TOC values for the blank before and after UV irradiation, it seems that the selectivity of HO∙ radicals is higher for MB than for starch.
For the 300 mg Fe–St NPs, a higher mineralization level was achieved for the starch and citrate components, as shown from the TOC values of the blank before and after UV irradiation (Table 3b). A somewhat lower overall % mineralization level (50% for 4 mg/L MB) was observed for 300 mg Fe–St as compared to 300 mg St–Fe.
3.4. Iron Leaching from the Starch-Stabilized NPs
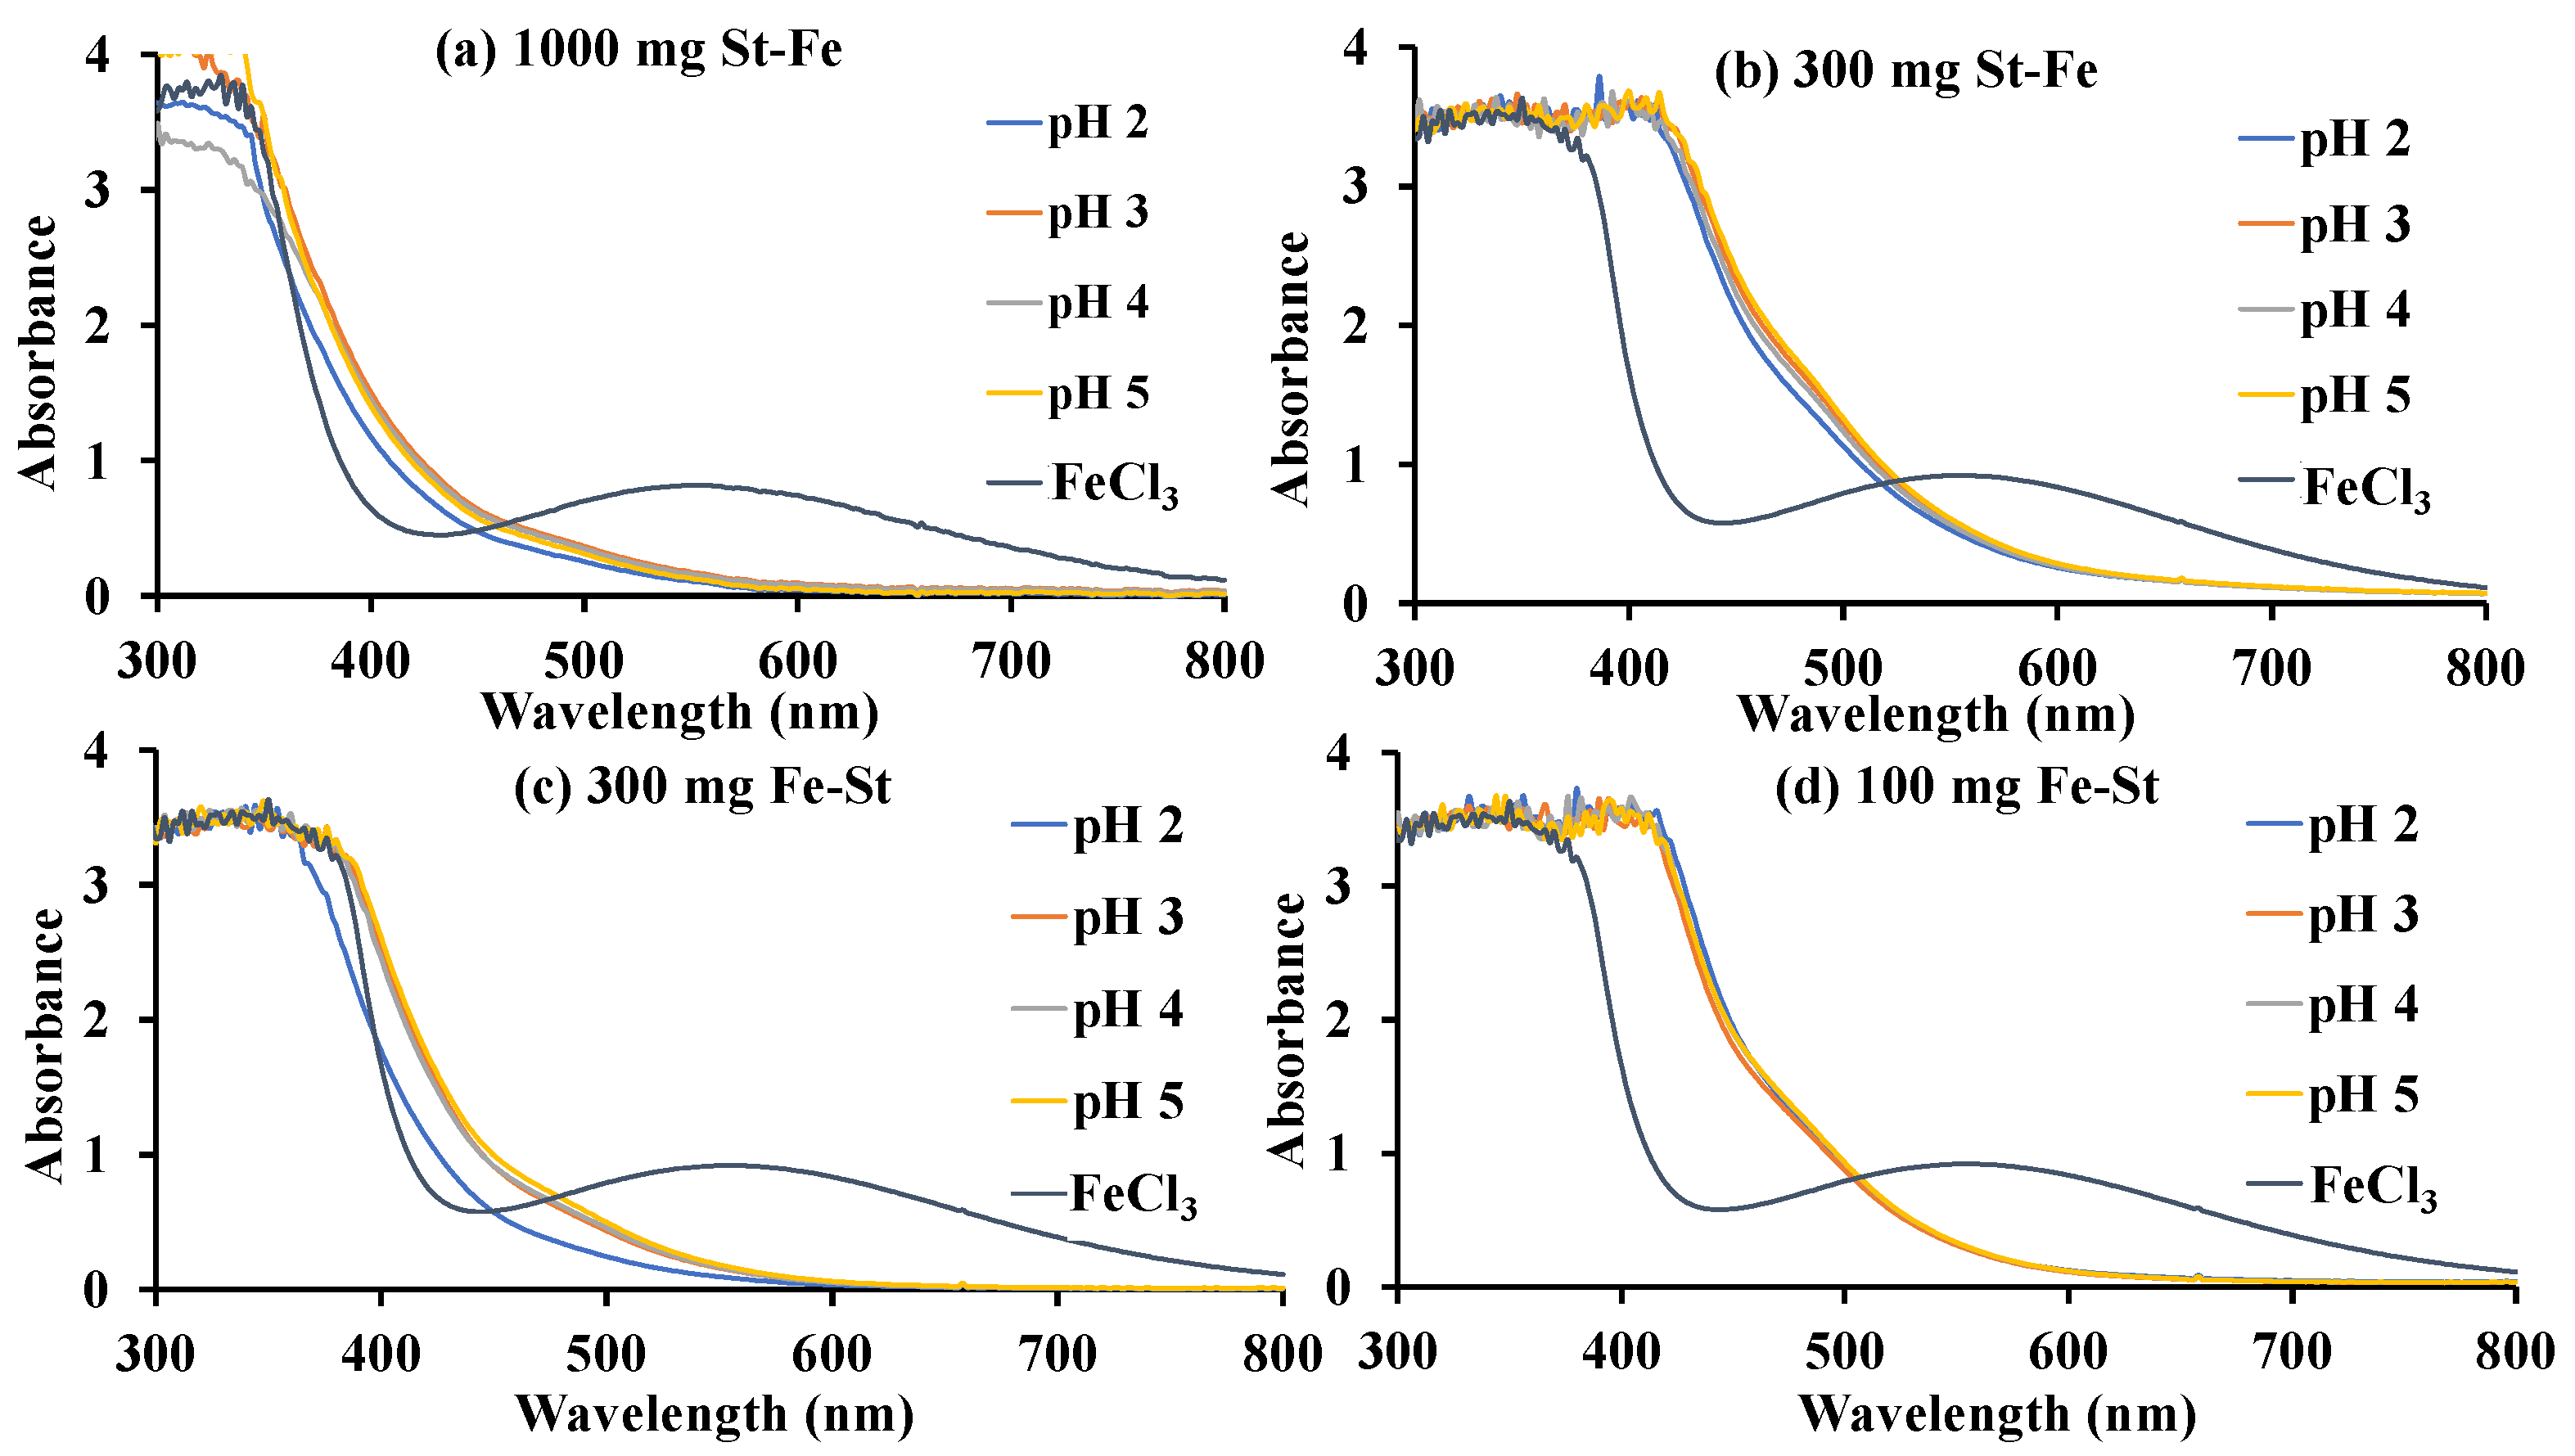
The four catalyst systems being investigated were treated with phenol at pH values ranging from 2−5, and UV–vis spectra were acquired for comparison with ferric chloride-phenol standards to verify the occurrence of Fe3+ leaching (Figure 7). To this end, aliquots corresponding to a 0.01 M Fe concentration for each catalyst were treated with 0.06 M phenol using H2SO4 to adjust the pH of the solutions. Only Fe3+ is known to form a dark blue complex with phenol [39]. No leaching of Fe3+ was observed for any of the catalysts over the pH 2–5 range, which shows that they were stable under these conditions.
3.5. Catalyst Performance Comparison with Other Reported Work
The results obtained for the 100 mg Fe–St catalyst (with the best overall performance out of the four systems investigated) can be compared with results reported in the literature to degrade MB by the photo-Fenton reaction (Table 4). Zhou et al. [40] derived a heterogeneous photo-Fenton catalyst (PMS-Fe-400) from paper mill sludge. High discoloration and mineralization efficiencies were achieved in less than 80 min with this system, albeit at a high Fe loading of 500 mg/L, favoring the formation of iron sludge. Catalysts with lower iron loadings have also been reported with comparable performance, such as Fe2O3 supported on graphene oxide (GO) by Liu et al. [41] or Fe–Ni impregnated on SiO2 by Ahmed et al. [42]. While these systems used considerably less iron to achieve degradation efficiencies similar to PMS-Fe-400, they relied upon supports that are non-biodegradable and may cause additional harm to the environment. The 100 mg Fe–St system reported in this work led to degradation efficiencies comparable to the other systems, at iron loadings 50- to 250-fold lower, and using a biodegradable, sustainable catalyst support. This comparison emphasizes the significance of the findings reported herein and establishes that starch-stabilized heterogeneous Fenton catalyst systems provide a highly viable approach to water decontamination.
4. Conclusions
Two different synthetic routes were developed to prepare starch-stabilized iron oxide (Fe2+/3+) nanoparticles for the photocatalytic Fenton degradation of methylene blue. Four catalysts were obtained with different iron: citrate: starch ratios. The overall particle size of the starch-stabilized catalysts, determined by DLS analysis, increased with the amount of starch used in their synthesis, apparently due to aggregation.
All four catalyst systems could degrade methylene blue at concentrations up to 32 mg/L. These catalysts can be viewed as superior in comparison with similar starch-based catalytic systems reported in the literature [9] as a mineralization level of up to 65% was achieved for 4 mg/L MB under UV irradiation at pH 4 when using 32 µmol Fe/L and 90 µmol/L H2O2 with the 100 mg Fe–St catalyst. Catalyst reusability was most notable for the 300 mg St–Fe system, which remained active in the degradation of up to seven aliquots of 4 mg/L MB in successive additions when 99 µmol Fe/L and 360 µmol/L H2O2 were used. The catalysts were also shown to be stable under acidic conditions as no Fe3+ leaching was observed over a pH range of 2–5. Due to their successful application to methylene blue degradation, it would be interesting to investigate these catalyst systems in the degradation of other dyes.
A most significant finding of the current investigation is the fact that, since starch improved catalyst dispersibility markedly over a broad pH range, it allowed the photo-Fenton reaction to be carried out at pH 4. This corresponded to acid concentrations 10- to 100-fold lower than typically used in these reactions (pH 2–3). Furthermore, due to the high catalytic activity of the starch-stabilized iron oxide nanoparticles, the low iron concentrations used resulted in no sludge formation. These characteristics make the photo-Fenton reaction a cost-effective process for dye degradation due to the short reaction time involved and the availability of UV radiation emitted by the sun required to activate the reaction. It requires no specialized equipment, and the procedure is simple to execute in solution at ambient temperature, resulting in high mineralization rates. Nevertheless, several limitations exist to that approach. The presence of large amounts of contaminants would require more iron and H2O2, increasing operational costs. Because the Fenton reaction requires acidic conditions, alkaline solutions cannot be treated. While we did not observe sludge formation with our starch-stabilized iron nanoparticles, any iron sludge in the form of Fe(OH)3 would require proper disposal [43].
Author Contributions
Formal analysis, N.D.; Funding acquisition, M.G.; Investigation, N.D. and M.A.N.; Methodology, N.D., M.A.N. and M.G.; Resources, M.G.; Supervision, M.G.; Validation, M.A.N.; Writing—original draft, N.D.; Writing—review & editing, M.A.N. and M.G. All authors have read and agreed to the published version of the manuscript.
Funding
This research was funded by the Natural Science and Engineering Research Council of Canada (NSERC).
Institutional Review Board Statement
Not applicable.
Data Availability Statement
Not applicable.
Conflicts of Interest
The authors declare no conflict of interest.
References
- Corradini, M.G. Synthetic Food Colors. Encycl. Food Chem. 2018, 1, 291–296. [Google Scholar]
- Arif, Z.; Sethy, N.K.; Swati; Mishra, P.K.; Verma, B. Grossly Polluting Industries and Their Effect on Water Resources in India. Chapter 3. Pollut. Water Manag. 2021, 47–65. [Google Scholar] [CrossRef]
- Punzi, M.; Mattiasson, B.; Jonstrup, M. Treatment of Synthetic Textile Wastewater by Homogeneous and Heterogeneous Photo-Fenton Oxidation. J. Photochem. Photobiol. A Chem. 2012, 248, 30–35. [Google Scholar] [CrossRef]
- Drumond Chequer, F.M.; de Oliveira, G.A.R.; Anastacio Ferraz, E.R.; Carvalho, J.; Boldrin Zanoni, M.V.; de Oliveir, D.P. Textile Dyes: Dyeing Process and Environmental Impact. In Eco-Friendly Textile Dyeing and Finishing; IntechOpen: London, UK, 2013. [Google Scholar]
- Hassaan, M.A.; Nemr, A.E. Health and Environmental Impacts of Dyes: Mini Review. Am. J. Environ. Sci. Eng. 2017, 1, 64–67. [Google Scholar]
- Sarayu, K.; Sandhya, S. Current Technologies for Biological Treatment of Textile Wastewater-A Review. Appl. Biochem. Biotechnol. 2012, 167, 645–661. [Google Scholar] [CrossRef]
- Pérez, M.; Torrades, F.; Domènech, X.; Peral, J. Fenton and Photo-Fenton Oxidation of Textile Effluents. Water Res. 2002, 36, 2703–2710. [Google Scholar] [CrossRef]
- Holkar, C.R.; Jadhav, A.J.; Pinjari, D.V.; Mahamuni, N.M.; Pandit, A.B. A Critical Review on Textile Wastewater Treatments: Possible Approaches. J. Environ. Manag. 2016, 182, 351–366. [Google Scholar] [CrossRef] [PubMed]
- Wang, J.L.; Xu, L.J. Advanced Oxidation Processes for Wastewater Treatment: Formation of Hydroxyl Radical and Application. Crit. Rev. Environ. Sci. Technol. 2012, 42, 251–325. [Google Scholar] [CrossRef]
- Zhu, Y.; Zhu, R.; Xi, Y.; Zhu, J.; Zhu, G.; He, H. Strategies for Enhancing the Heterogeneous Fenton Catalytic Reactivity: A Review. Appl. Catal. B Environ. 2019, 255, 117739. [Google Scholar] [CrossRef]
- Munoz, M.; de Pedro, Z.M.; Casas, J.A.; Rodriguez, J.J. Preparation of Magnetite-Based Catalysts and Their Application in Heterogeneous Fenton Oxidation—A Review. Appl. Catal. B Environ. 2015, 176–177, 249–265. [Google Scholar] [CrossRef]
- Pliego, G.; Zazo, J.A.; Garcia-Muñoz, P.; Munoz, M.; Casas, J.A.; Rodriguez, J.J. Trends in the Intensification of the Fenton Process for Wastewater Treatment: An Overview. Crit. Rev. Environ. Sci. Technol. 2015, 45, 2611–2692. [Google Scholar] [CrossRef]
- Zhang, M.; Dong, H.; Zhao, L.; Wang, D.; Meng, D. A Review on Fenton Process for Organic Wastewater Treatment Based on Optimization Perspective. Sci. Total Environ. 2019, 670, 110–121. [Google Scholar] [CrossRef] [PubMed]
- Karthikeyan, S.; Titus, A.; Gnanamani, A.; Mandal, A.B.; Sekaran, G. Treatment of Textile Wastewater by Homogeneous and Heterogeneous Fenton Oxidation Processes. Desalination 2011, 281, 438–445. [Google Scholar] [CrossRef]
- Clarizia, L.; Russo, D.; di Somma, I.; Marotta, R.; Andreozzi, R. Homogeneous Photo-Fenton Processes at near Neutral PH: A Review. Appl. Catal. B Environ. 2017, 209, 358–371. [Google Scholar] [CrossRef]
- Gligorovski, S.; Strekowski, R.; Barbati, S.; Vione, D. Environmental Implications of Hydroxyl Radicals (•OH). Chem. Rev. 2015, 115, 13051–13092. [Google Scholar] [CrossRef] [PubMed]
- Xue, W.; Huang, D.; Zeng, G.; Wan, J.; Zhang, C.; Xu, R.; Cheng, M.; Deng, R. Nanoscale Zero-Valent Iron Coated with Rhamnolipid as an Effective Stabilizer for Immobilization of Cd and Pb in River Sediments. J. Hazard. Mater. 2018, 341, 381–389. [Google Scholar] [CrossRef] [PubMed]
- Jain, B.; Singh, A.K.; Kim, H.; Lichtfouse, E.; Sharma, V.K. Treatment of Organic Pollutants by Homogeneous and Heterogeneous Fenton Reaction Processes. Environ. Chem. Lett. 2018, 341, 947–967. [Google Scholar] [CrossRef]
- Jenita Rani, G.; Jothi Rajan, M.A.; Gnana Kumar, G. Reduced Graphene Oxide/ZnFe2O4 Nanocomposite as an Efficient Catalyst for the Photocatalytic Degradation of Methylene Blue Dye. Res. Chem. Intermed. 2017, 43, 2669–2690. [Google Scholar] [CrossRef]
- Guo, X.; Wang, K.; Xu, Y. Tartaric Acid Enhanced CuFe2O4-Catalyzed Heterogeneous Photo-Fenton-like Degradation of Methylene Blue. Mater. Sci. Eng. B Solid-State Mater. Adv. Technol. 2019, 245, 75–84. [Google Scholar] [CrossRef]
- Guo, X.; Meng, Q.; Wang, D.; Zha, F.; Tang, X.; Tian, H. S-Doped NiFe-Based Catalyst for Fast Degradation of Methylene Blue by Heterogeneous Photo-Fenton Reaction. Environ. Sci. Pollut. Res. 2021, 28, 36112–36121. [Google Scholar] [CrossRef]
- Ashraf, G.A.; Rasool, R.T.; Hassan, M.; Zhang, L. Enhanced Photo Fenton-like Activity by Effective and Stable Al–Sm M-Hexaferrite Heterogenous Catalyst Magnetically Detachable for Methylene Blue Degradation. J. Alloy Compd. 2020, 821, 153410. [Google Scholar] [CrossRef]
- Abbas Ashraf, G.; Hassan, M.; Tur Rasool, R.; Abbas, W.; Zhang, L. Mesoporous SnMgNd Substituted M-Hexaferrite Catalyzed Heterogeneous Photo-Fenton-like Activity for Degradation of Methylene Blue. J. Colloid Interface Sci. 2019, 557, 408–422. [Google Scholar] [CrossRef] [PubMed]
- Kalam, A.; Al-Sehemi, A.G.; Assiri, M.; Du, G.; Ahmad, T.; Ahmad, I.; Pannipara, M. Modified Solvothermal Synthesis of Cobalt Ferrite (CoFe2O4) Magnetic Nanoparticles Photocatalysts for Degradation of Methylene Blue with H2O2/Visible Light. Results Phys. 2018, 8, 1046–1053. [Google Scholar] [CrossRef]
- Su, L.; Xiong, Y.; Wu, M.; Duan, Z.; Zhang, Z.; Xie, W.; Zhu, D.; Luo, Y.; He, X. From Starch to Magnetic Porous Fe2O3@C: A Promising Peroxidase-Mimicking Heterogeneous Biocatalyst for Degradation of Organic Dye. Starch-Stärke 2018, 70, 1700221. [Google Scholar] [CrossRef]
- El Qada, E.N.; Allen, S.J.; Walker, G.M. Adsorption of Methylene Blue onto Activated Carbon Produced from Steam Activated Bituminous Coal: A Study of Equilibrium Adsorption Isotherm. Chem. Eng. J. 2006, 124, 103–110. [Google Scholar] [CrossRef]
- Tang, M.; Wang, D.; Hou, Y.; Buchili, P.; Sun, L. Preparation, Characterization, Bioavailability in Vitro and in Vivo of Tea Polysaccharides-Iron Complex. Eur. Food Res. Technol. 2013, 236, 341–350. [Google Scholar] [CrossRef]
- Krenkova, J.; Foret, F. Iron Oxide Nanoparticle Coating of Organic Polymer-Based Monolithic Columns for Phosphopeptide Enrichment. J. Sep. Sci. 2011, 34, 2106–2112. [Google Scholar] [CrossRef]
- Karaagac, O.; Kockar, H. Iron Oxide Nanoparticles Co-Precipitated in Air Environment: Effect of [Fe2+]/[Fe3+] Ratio. IEEE Trans. Magn. 2012, 48, 1532–1536. [Google Scholar] [CrossRef]
- Pitarresi, G.; Tripodo, G.; Cavallaro, G.; Palumbo, F.S.; Giammona, G. Inulin-Iron Complexes: A Potential Treatment of Iron Deficiency Anaemia. Eur. J. Pharm. Biopharm. 2008, 68, 267–276. [Google Scholar] [CrossRef]
- Baalousha, M.; Manciulea, A.; Cumberland, S.; Kendall, K.; Lead, J.R. Aggregation and Surface Properties of Iron Oxide Nanoparticles: Influence of pH and Natural Organic Matter. Environ. Toxicol. Chem. 2008, 27, 1875–1882. [Google Scholar] [CrossRef]
- Soshnikova, Y.M.; Roman, S.G.; Chebotareva, N.A.; Baum, O.I.; Obrezkova, M.V.; Gillis, R.B.; Harding, S.E.; Sobol, E.N.; Lunin, V.V. Starch-Modified Magnetite Nanoparticles for Impregnation into Cartilage. J. Nanopart. Res. 2013, 15, 2092. [Google Scholar] [CrossRef]
- Wang, X.; Zhang, L. Kinetic Study of Hydroxyl Radical Formation in a Continuous Hydroxyl Generation System. RSC Adv. 2018, 8, 40632–40638. [Google Scholar] [CrossRef] [PubMed] [Green Version]
- Watts, R.J.; Foget, M.K.; Kong, S.H.; Teel, A.L. Hydrogen Peroxide Decomposition in Model Subsurface Systems. J. Hazard. Mater. 1999, 69, 229–243. [Google Scholar] [CrossRef]
- Mierzwa, J.C.; Rodrigues, R.; Teixeira, A.C.S.C. UV-Hydrogen Peroxide Processes. In Advanced Oxidation Processes for Wastewater Treatment: Emerging Green Chemical Technology; Academic Press: London, UK, 2018; pp. 13–48. [Google Scholar]
- Neamtu, M.; Yediler, A.; Siminiceanu, I.; Kettrup, A. Oxidation of Commercial Reactive Azo Dye Aqueous Solutions by the Photo-Fenton and Fenton-like Processes. J. Photochem. Photobiol. A Chem. 2003, 161, 87–93. [Google Scholar] [CrossRef]
- Tengrui, L.; Al-Harbawi, A.; Jun, Z.; Bo, L.M. The Effect and Its Influence Factors of the Fenton Process on the Old Landfill Leachate. J. Appl. Sci. 2007, 7, 724–727. [Google Scholar] [CrossRef]
- Parovuori, P.; Hamunen, A.; Forssell, P.; Autio, K.; Poutanen, K. Oxidation of Potato Starch by Hydrogen Peroxide. Starch-Stärke 1995, 47, 19–23. [Google Scholar] [CrossRef]
- Silver, J.; Morrison, I.E.G.; Rees, L.V.C. A Mössbauer Spectroscopic Study of Frozen Solutions of FeCl3-Phenols. Inorg. Nucl. Chem. Lett. 1979, 15, 433–436. [Google Scholar] [CrossRef]
- Zhou, G.; Fang, F.; Chen, Z.; He, Y.; Sun, H.; Shi, H. Facile Synthesis of Paper Mill Sludge-Derived Heterogeneous Catalyst for the Fenton-like Degradation of Methylene Blue. Catal. Commun. 2015, 62, 71–74. [Google Scholar] [CrossRef]
- Liu, Y.; Jin, W.; Zhao, Y.; Zhang, G.; Zhang, W. Enhanced Catalytic Degradation of Methylene Blue by α-Fe2O3/Graphene Oxide via Heterogeneous Photo-Fenton Reactions. Appl. Catal. B Environ. 2017, 206, 642–652. [Google Scholar] [CrossRef]
- Ahmed, Y.; Yaakob, Z.; Akhtar, P. Degradation and Mineralization of Methylene Blue Using a Heterogeneous Photo-Fenton Catalyst under Visible and Solar Light Irradiation. Catal. Sci. Technol. 2016, 6, 1222–1232. [Google Scholar] [CrossRef]
- Walling, S.A.; Um, W.; Corkhill, C.L.; Hyatt, N.C. Fenton and Fenton-like Wet Oxidation for Degradation and Destruction of Organic Radioactive Wastes. npj Mater. Degrad. 2021, 5, 2021. [Google Scholar] [CrossRef]
Figure 1.
Dynamic light scattering measurements of starch-stabilized iron oxide nanoparticles.

Figure 2.
TEM imaging of St–Fe and Fe–St NPs as identified above.
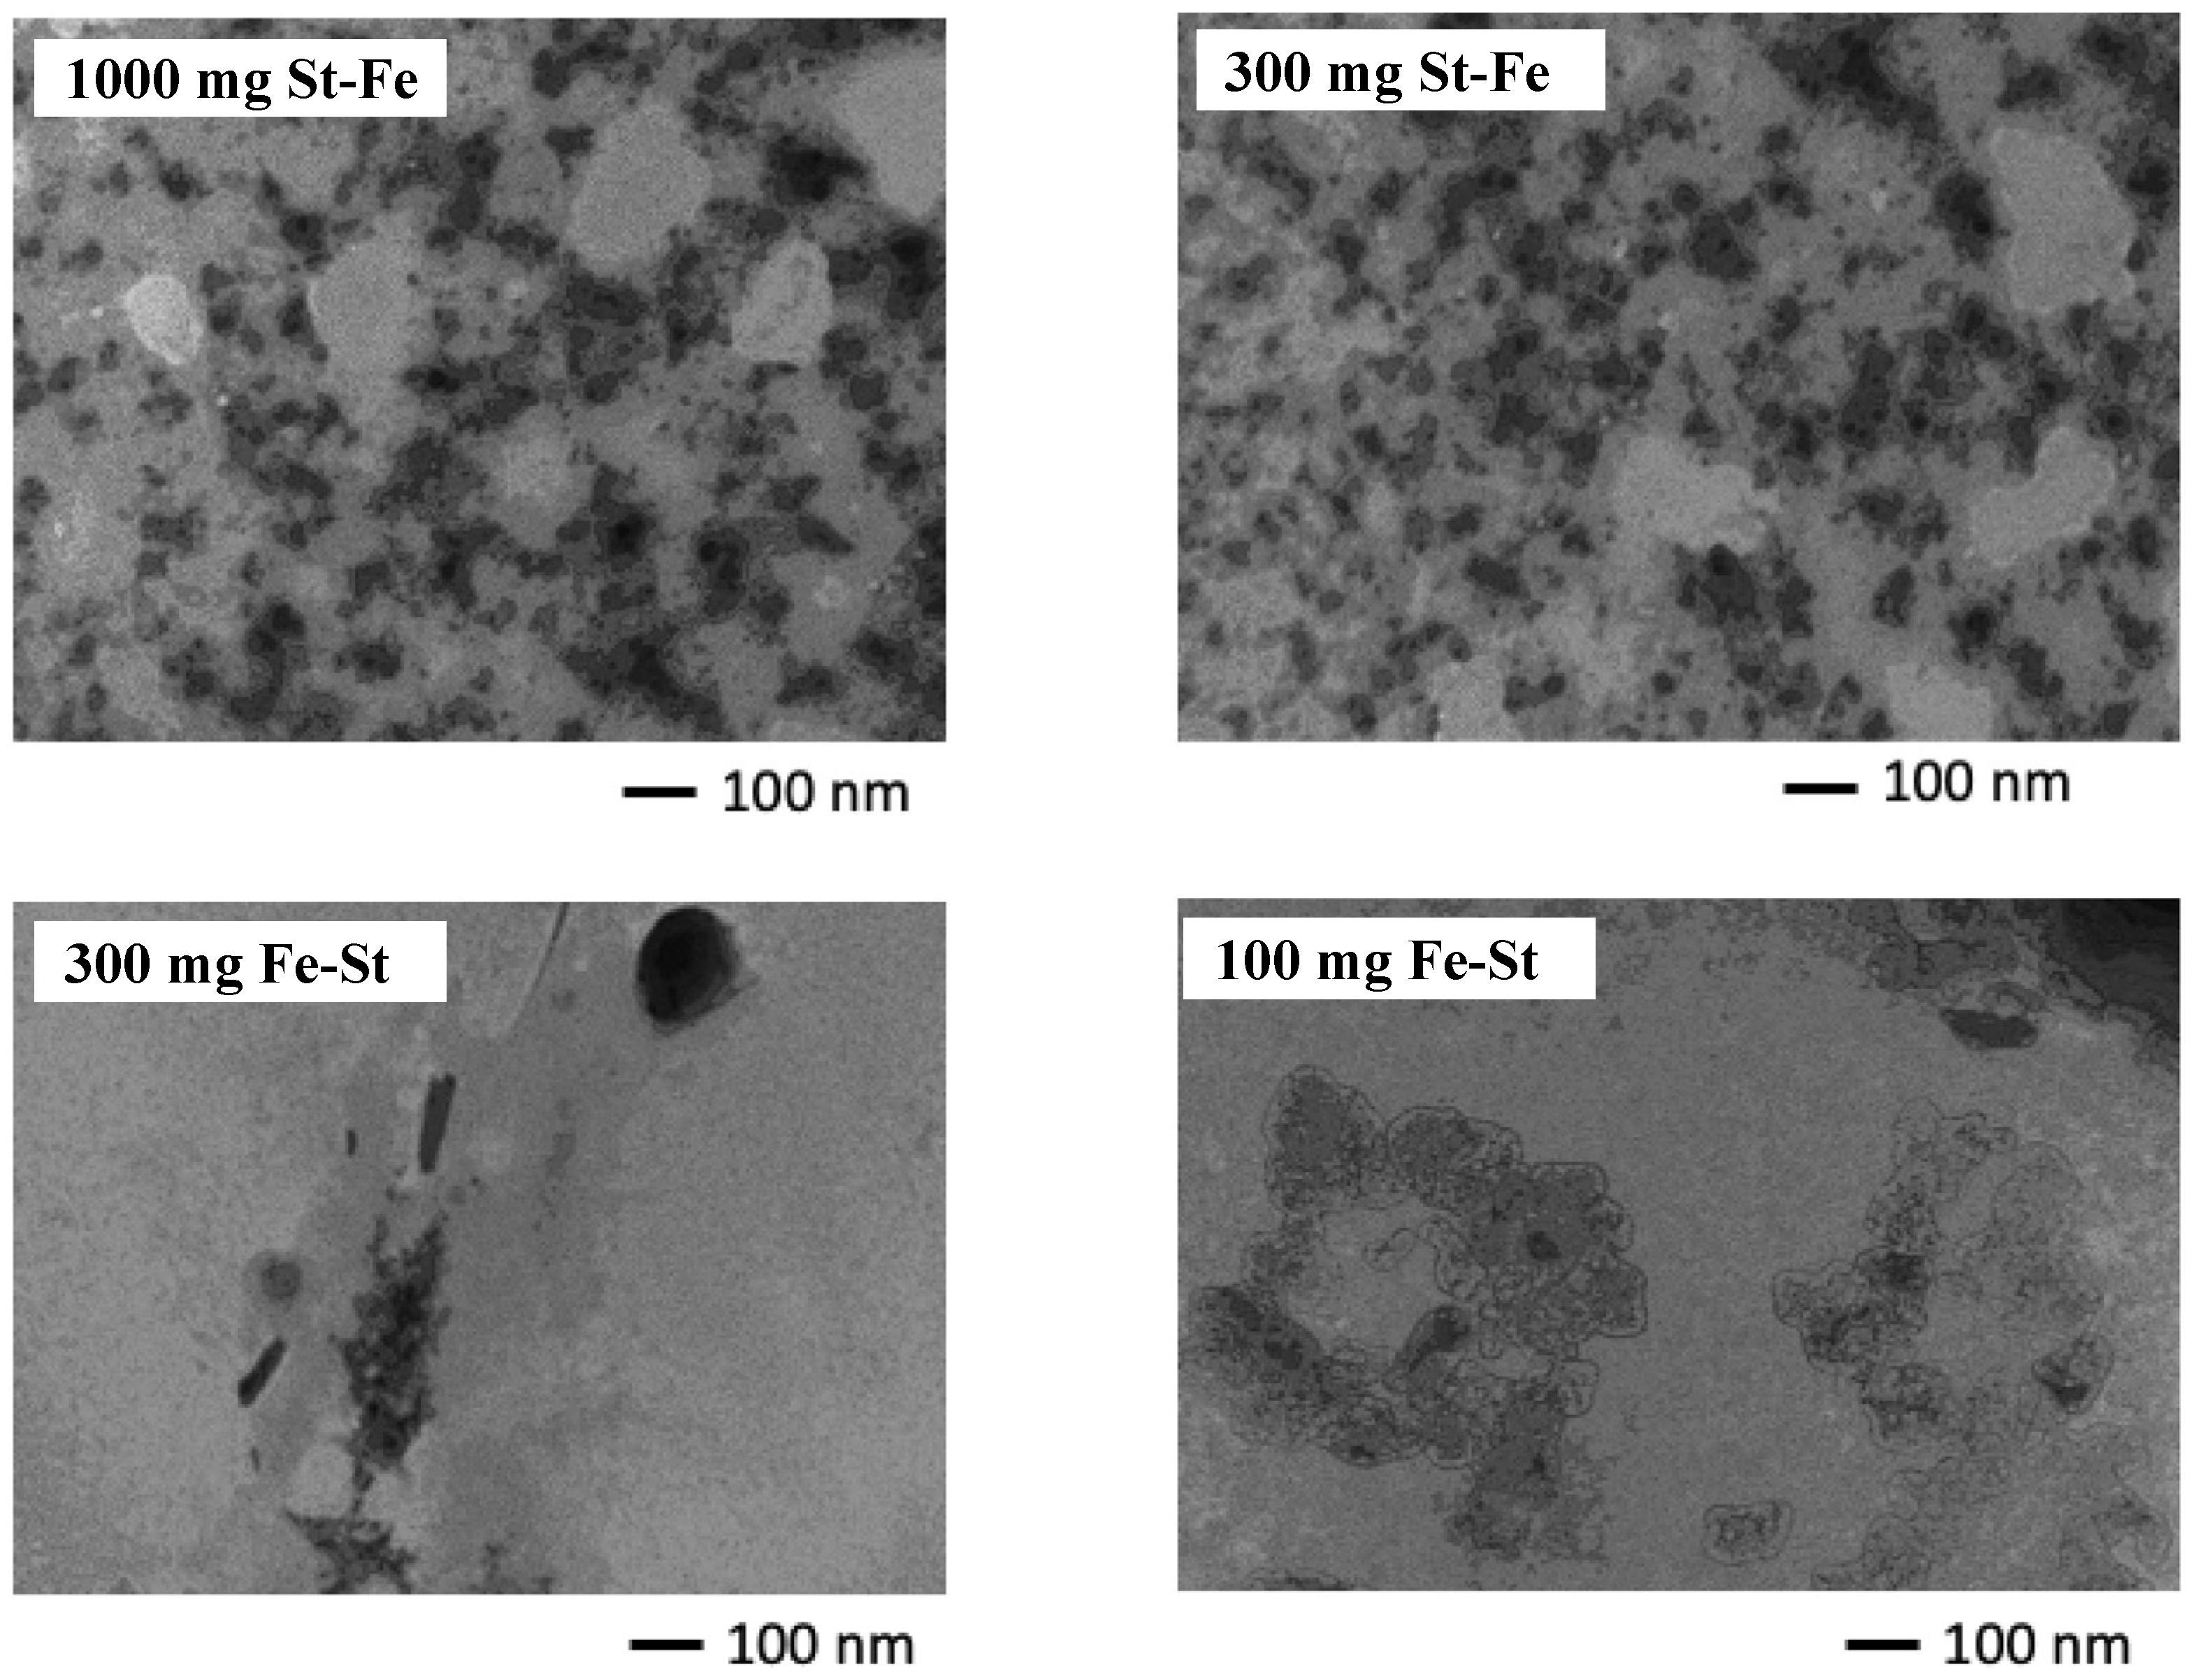
Figure 3.
(a) MB degradation control experiments (10 mL volume, 4 mg/L) at pH 3 with 290 μmol/L Fe (1000 mg St–Fe NPs), 360 μmol/L H2O2, and UV light unless otherwise mentioned; (b) hydroxyl radicals detected using 44 μmol/L Fe (1000 mg St–Fe NPs), 55 μmol/L H2O2, and 0.06 mol/L terephthalic acid at pH 4 after UV irradiation for the specified time intervals.
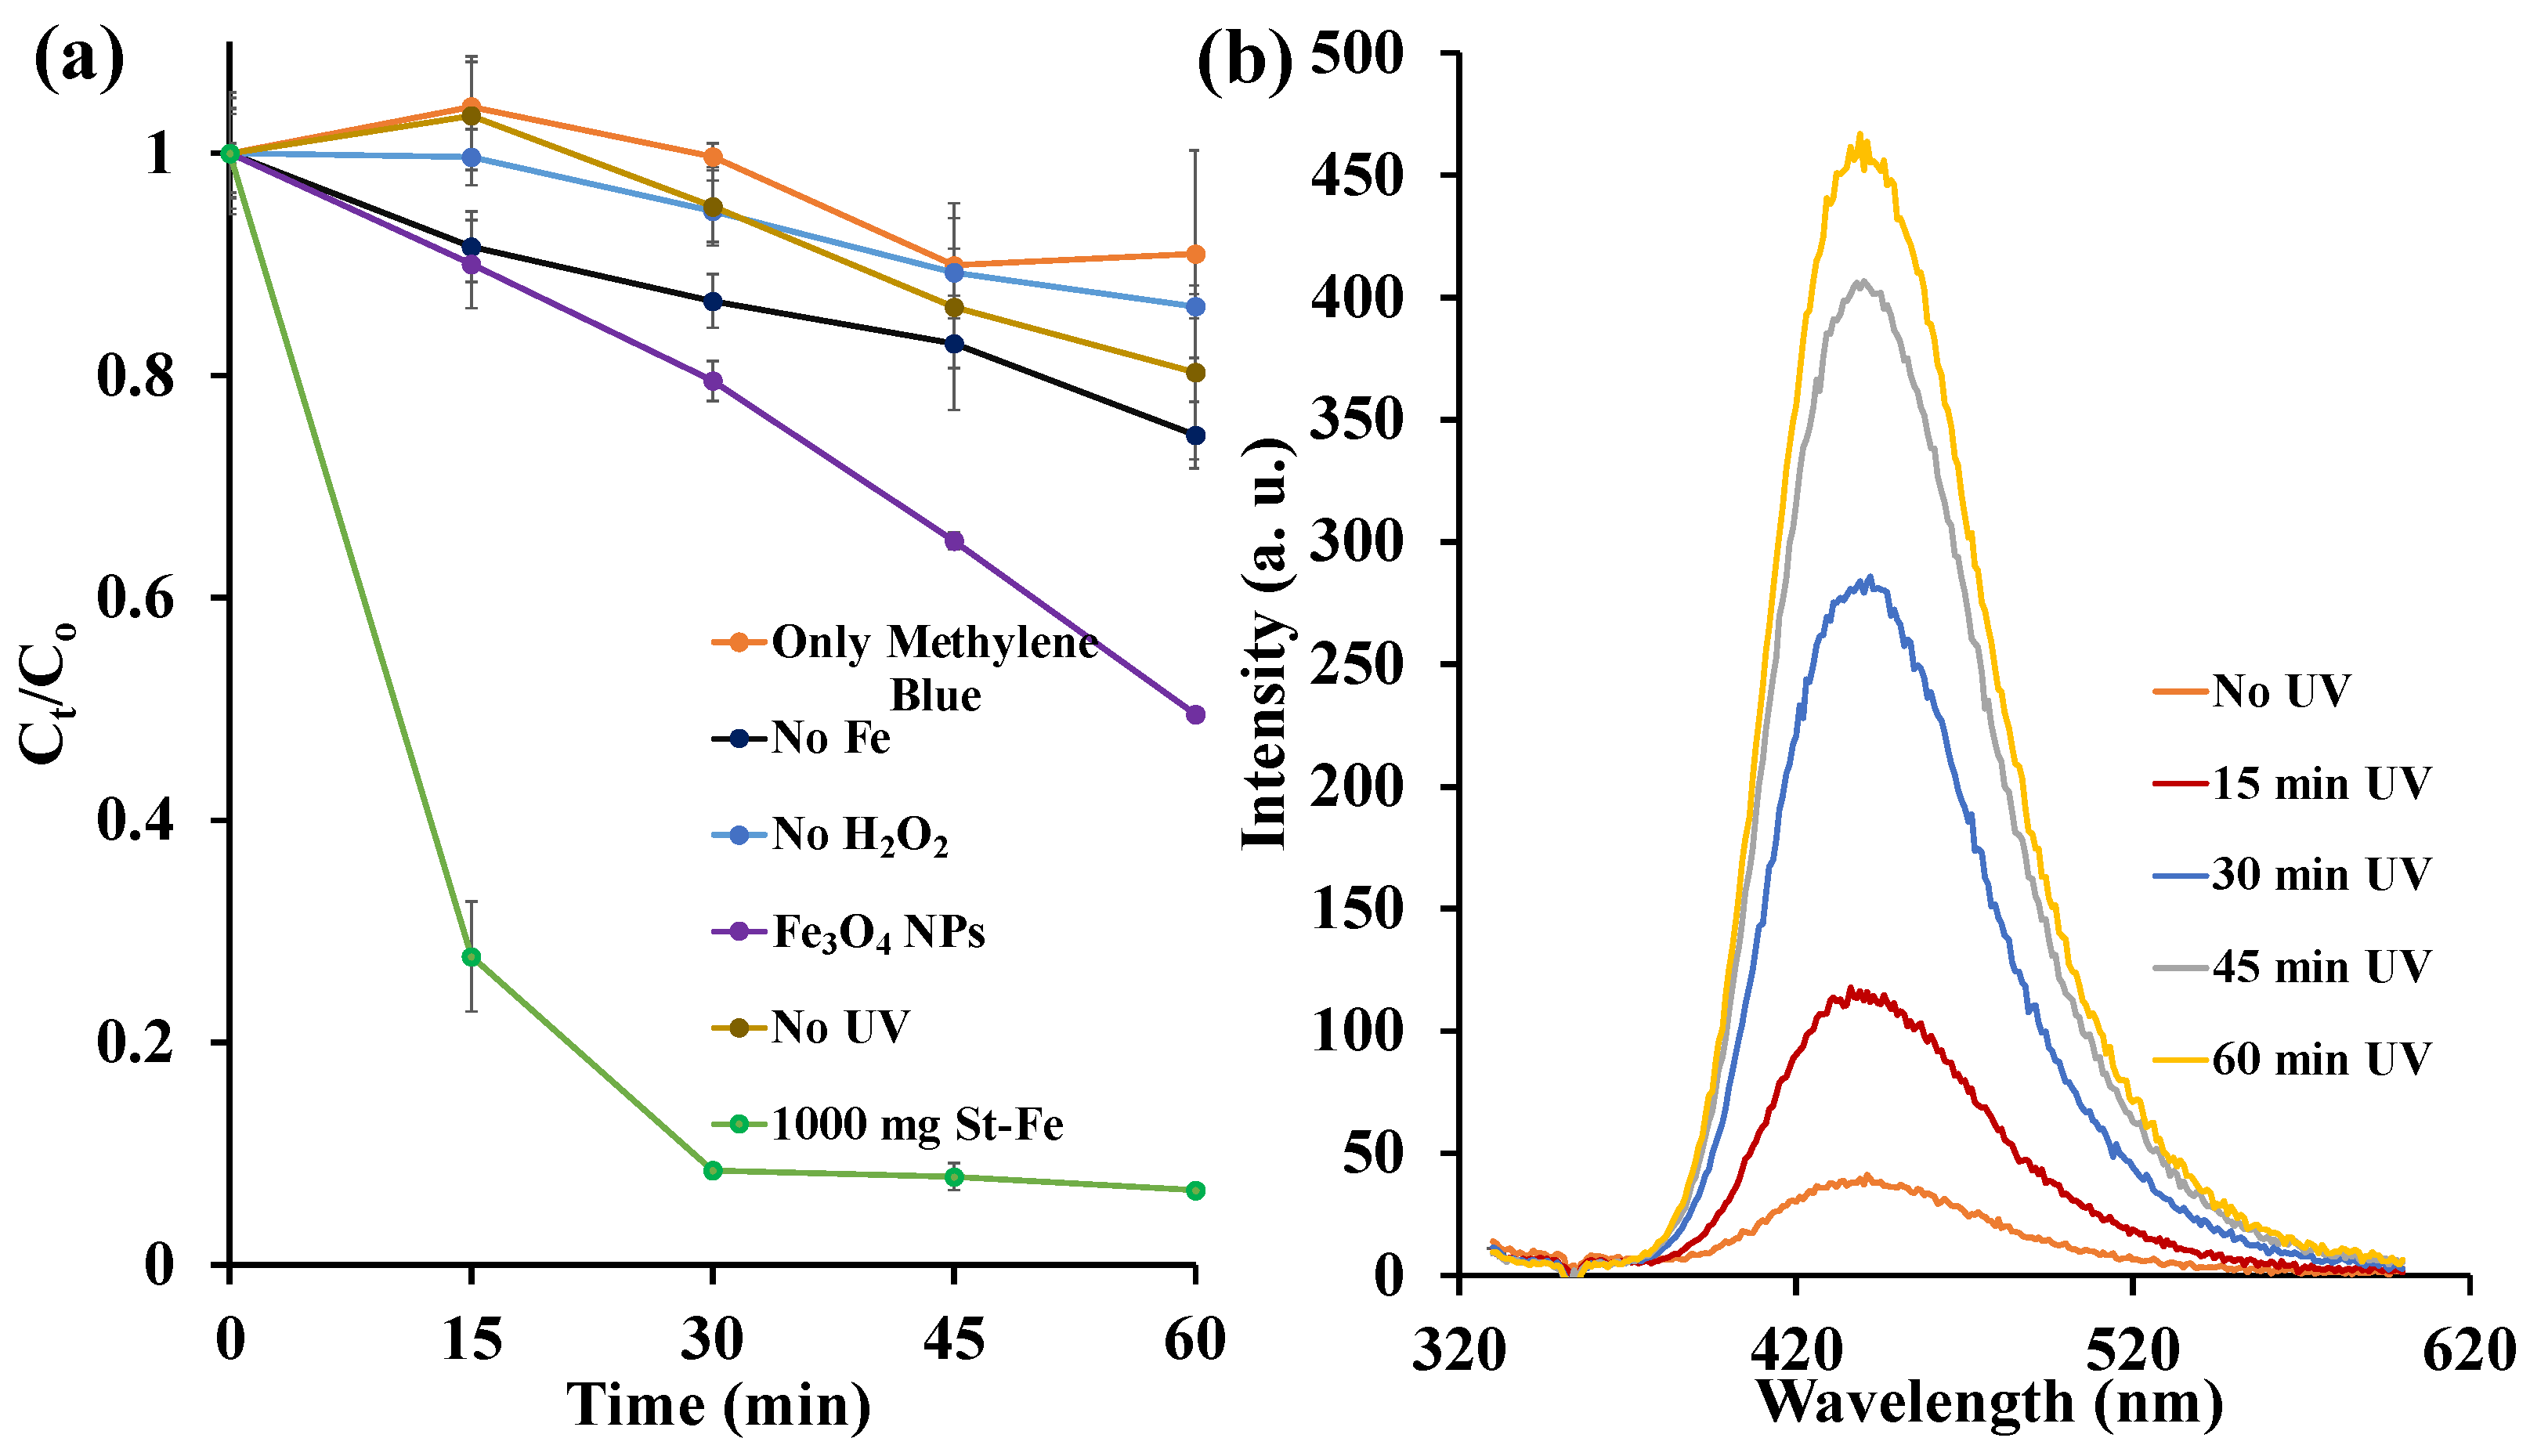
Figure 4.
(a) Influence of sunlight on the degradation of 4 mg/L MB at 290 µmol Fe/L (1000 mg St–Fe), 360 µmol/L H2O2, and pH 4; (b) influence of H2O2 concentration on the degradation of 4 mg/L MB at 290 µmol Fe/L (1000 mg St–Fe) and pH 4.
Figure 4.
(a) Influence of sunlight on the degradation of 4 mg/L MB at 290 µmol Fe/L (1000 mg St–Fe), 360 µmol/L H2O2, and pH 4; (b) influence of H2O2 concentration on the degradation of 4 mg/L MB at 290 µmol Fe/L (1000 mg St–Fe) and pH 4.
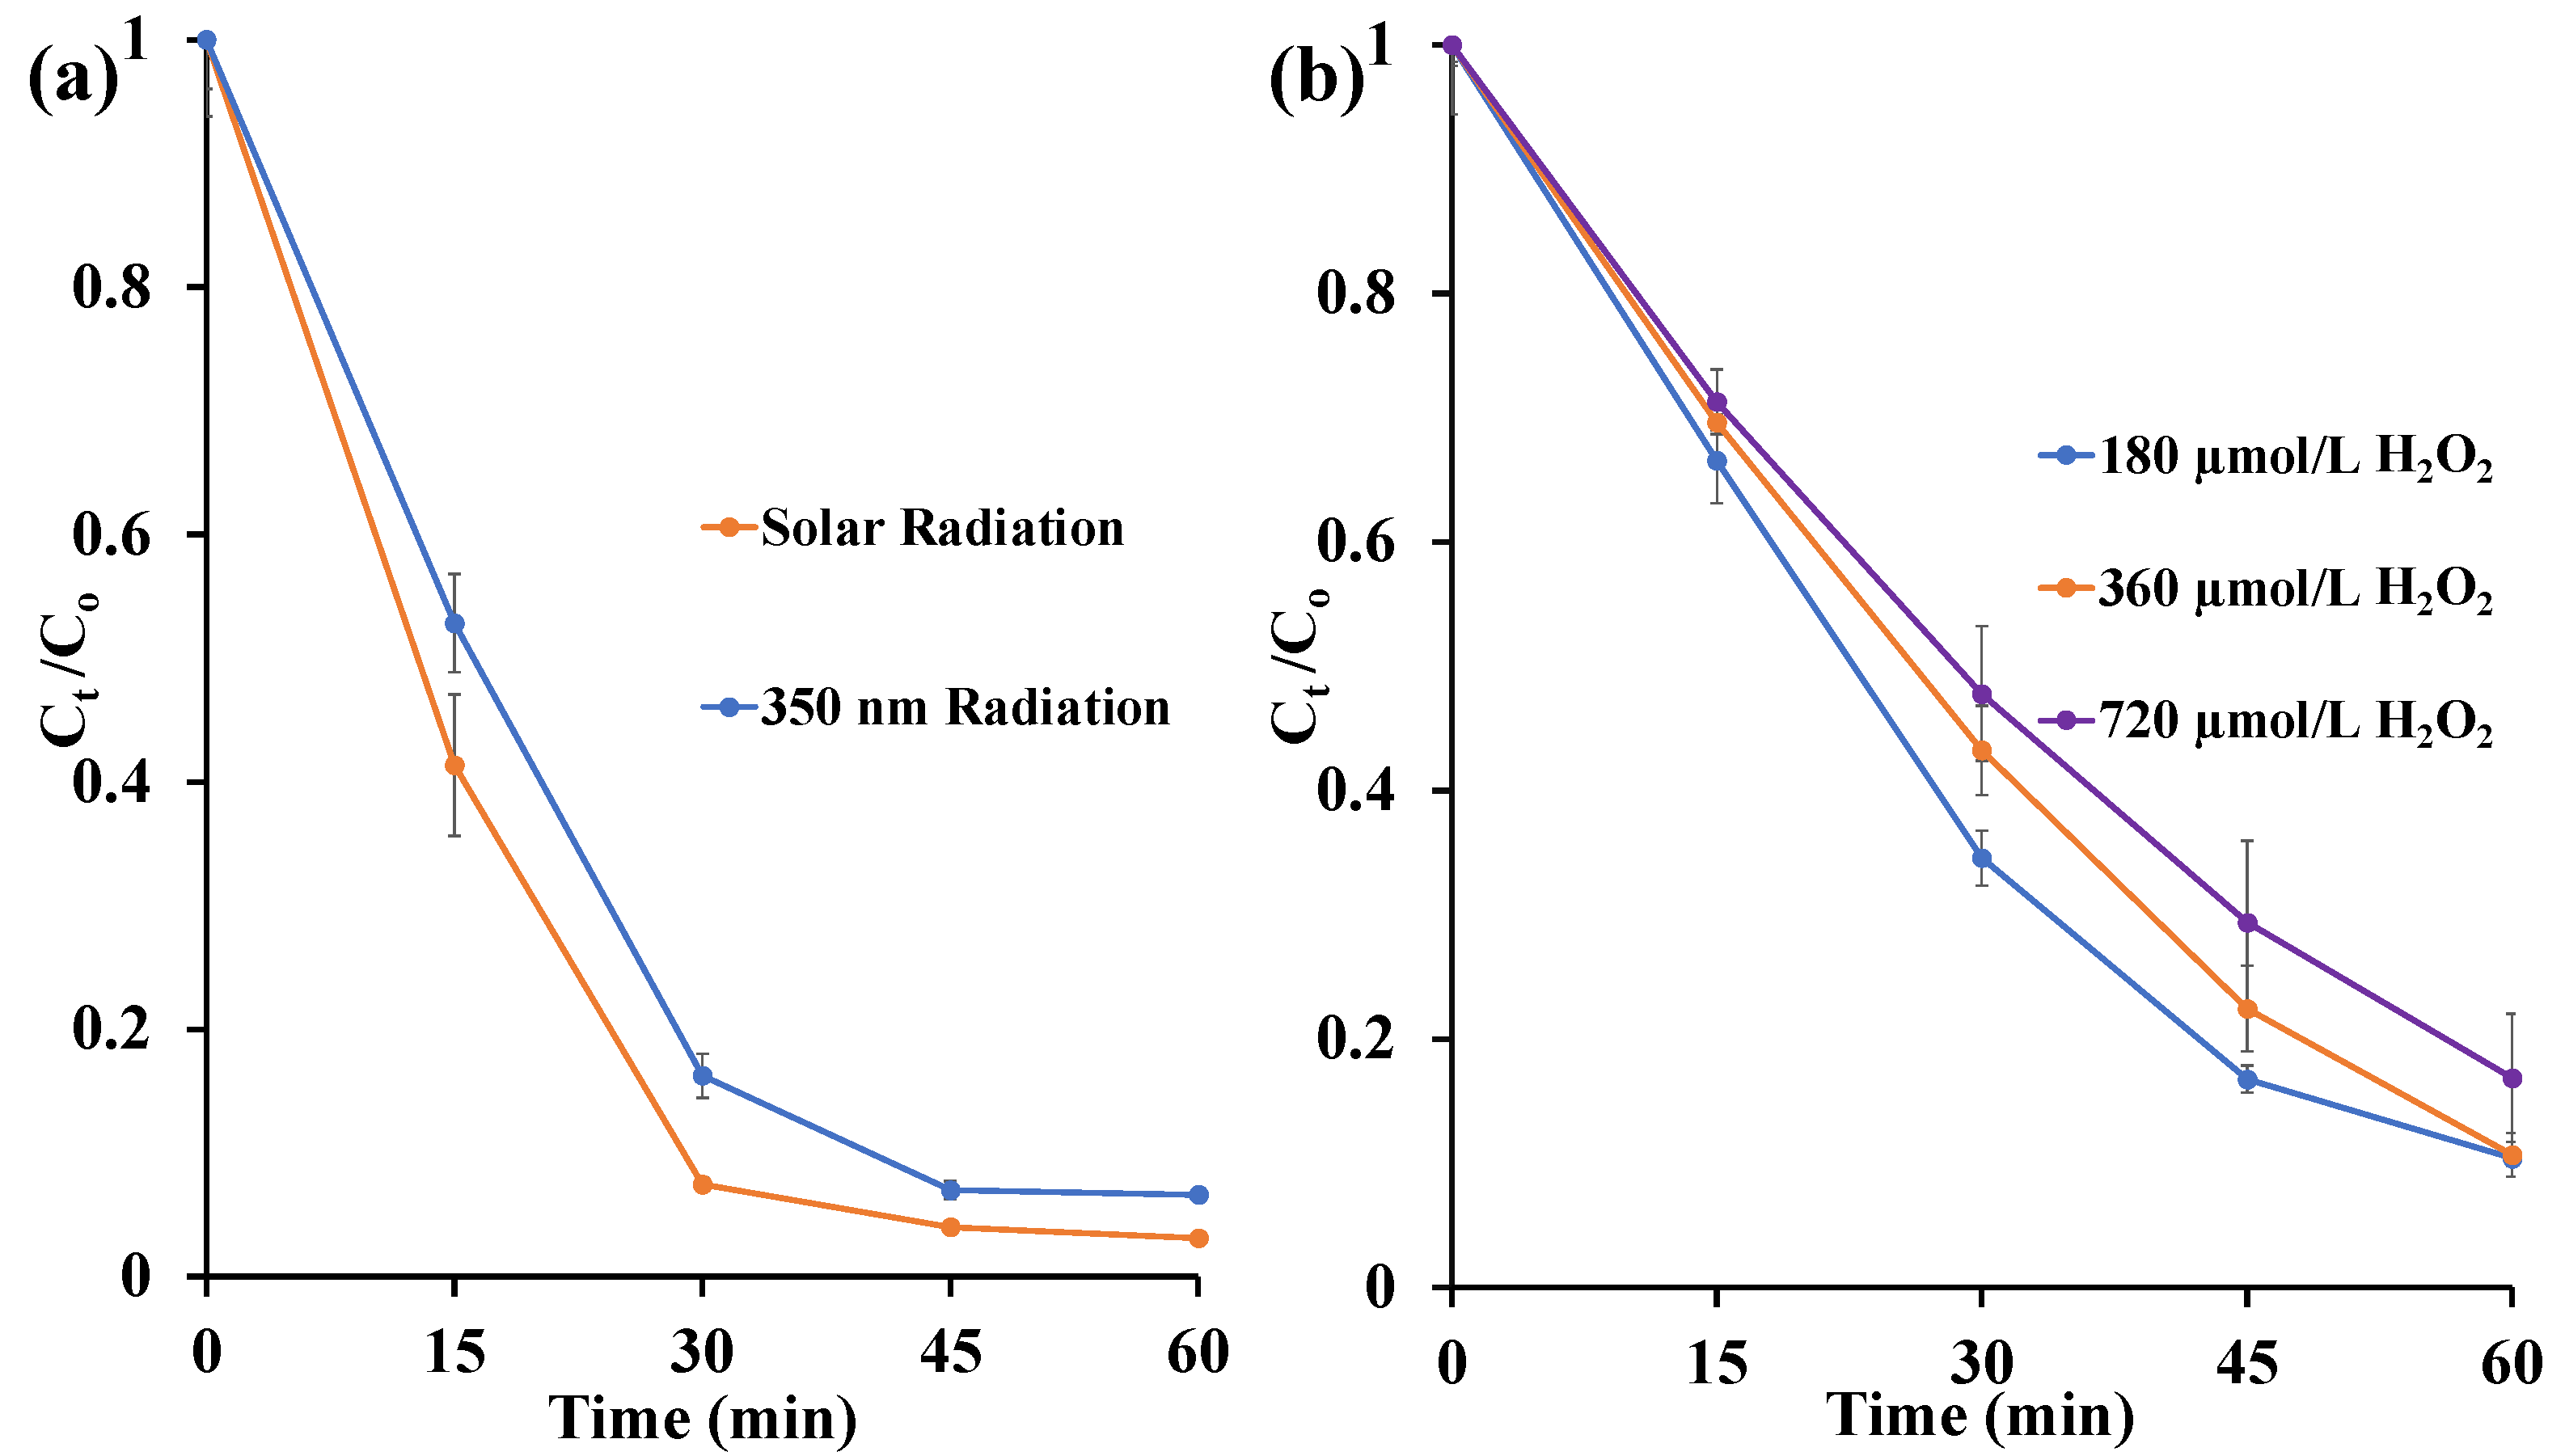
Figure 5.
Degradation of MB at different concentrations using (a) 1000 mg St–Fe, (b) 300 mg St–Fe, (c) 300 mg Fe–St, and (d) 100 mg Fe–St at pH 4.
Figure 5.
Degradation of MB at different concentrations using (a) 1000 mg St–Fe, (b) 300 mg St–Fe, (c) 300 mg Fe–St, and (d) 100 mg Fe–St at pH 4.
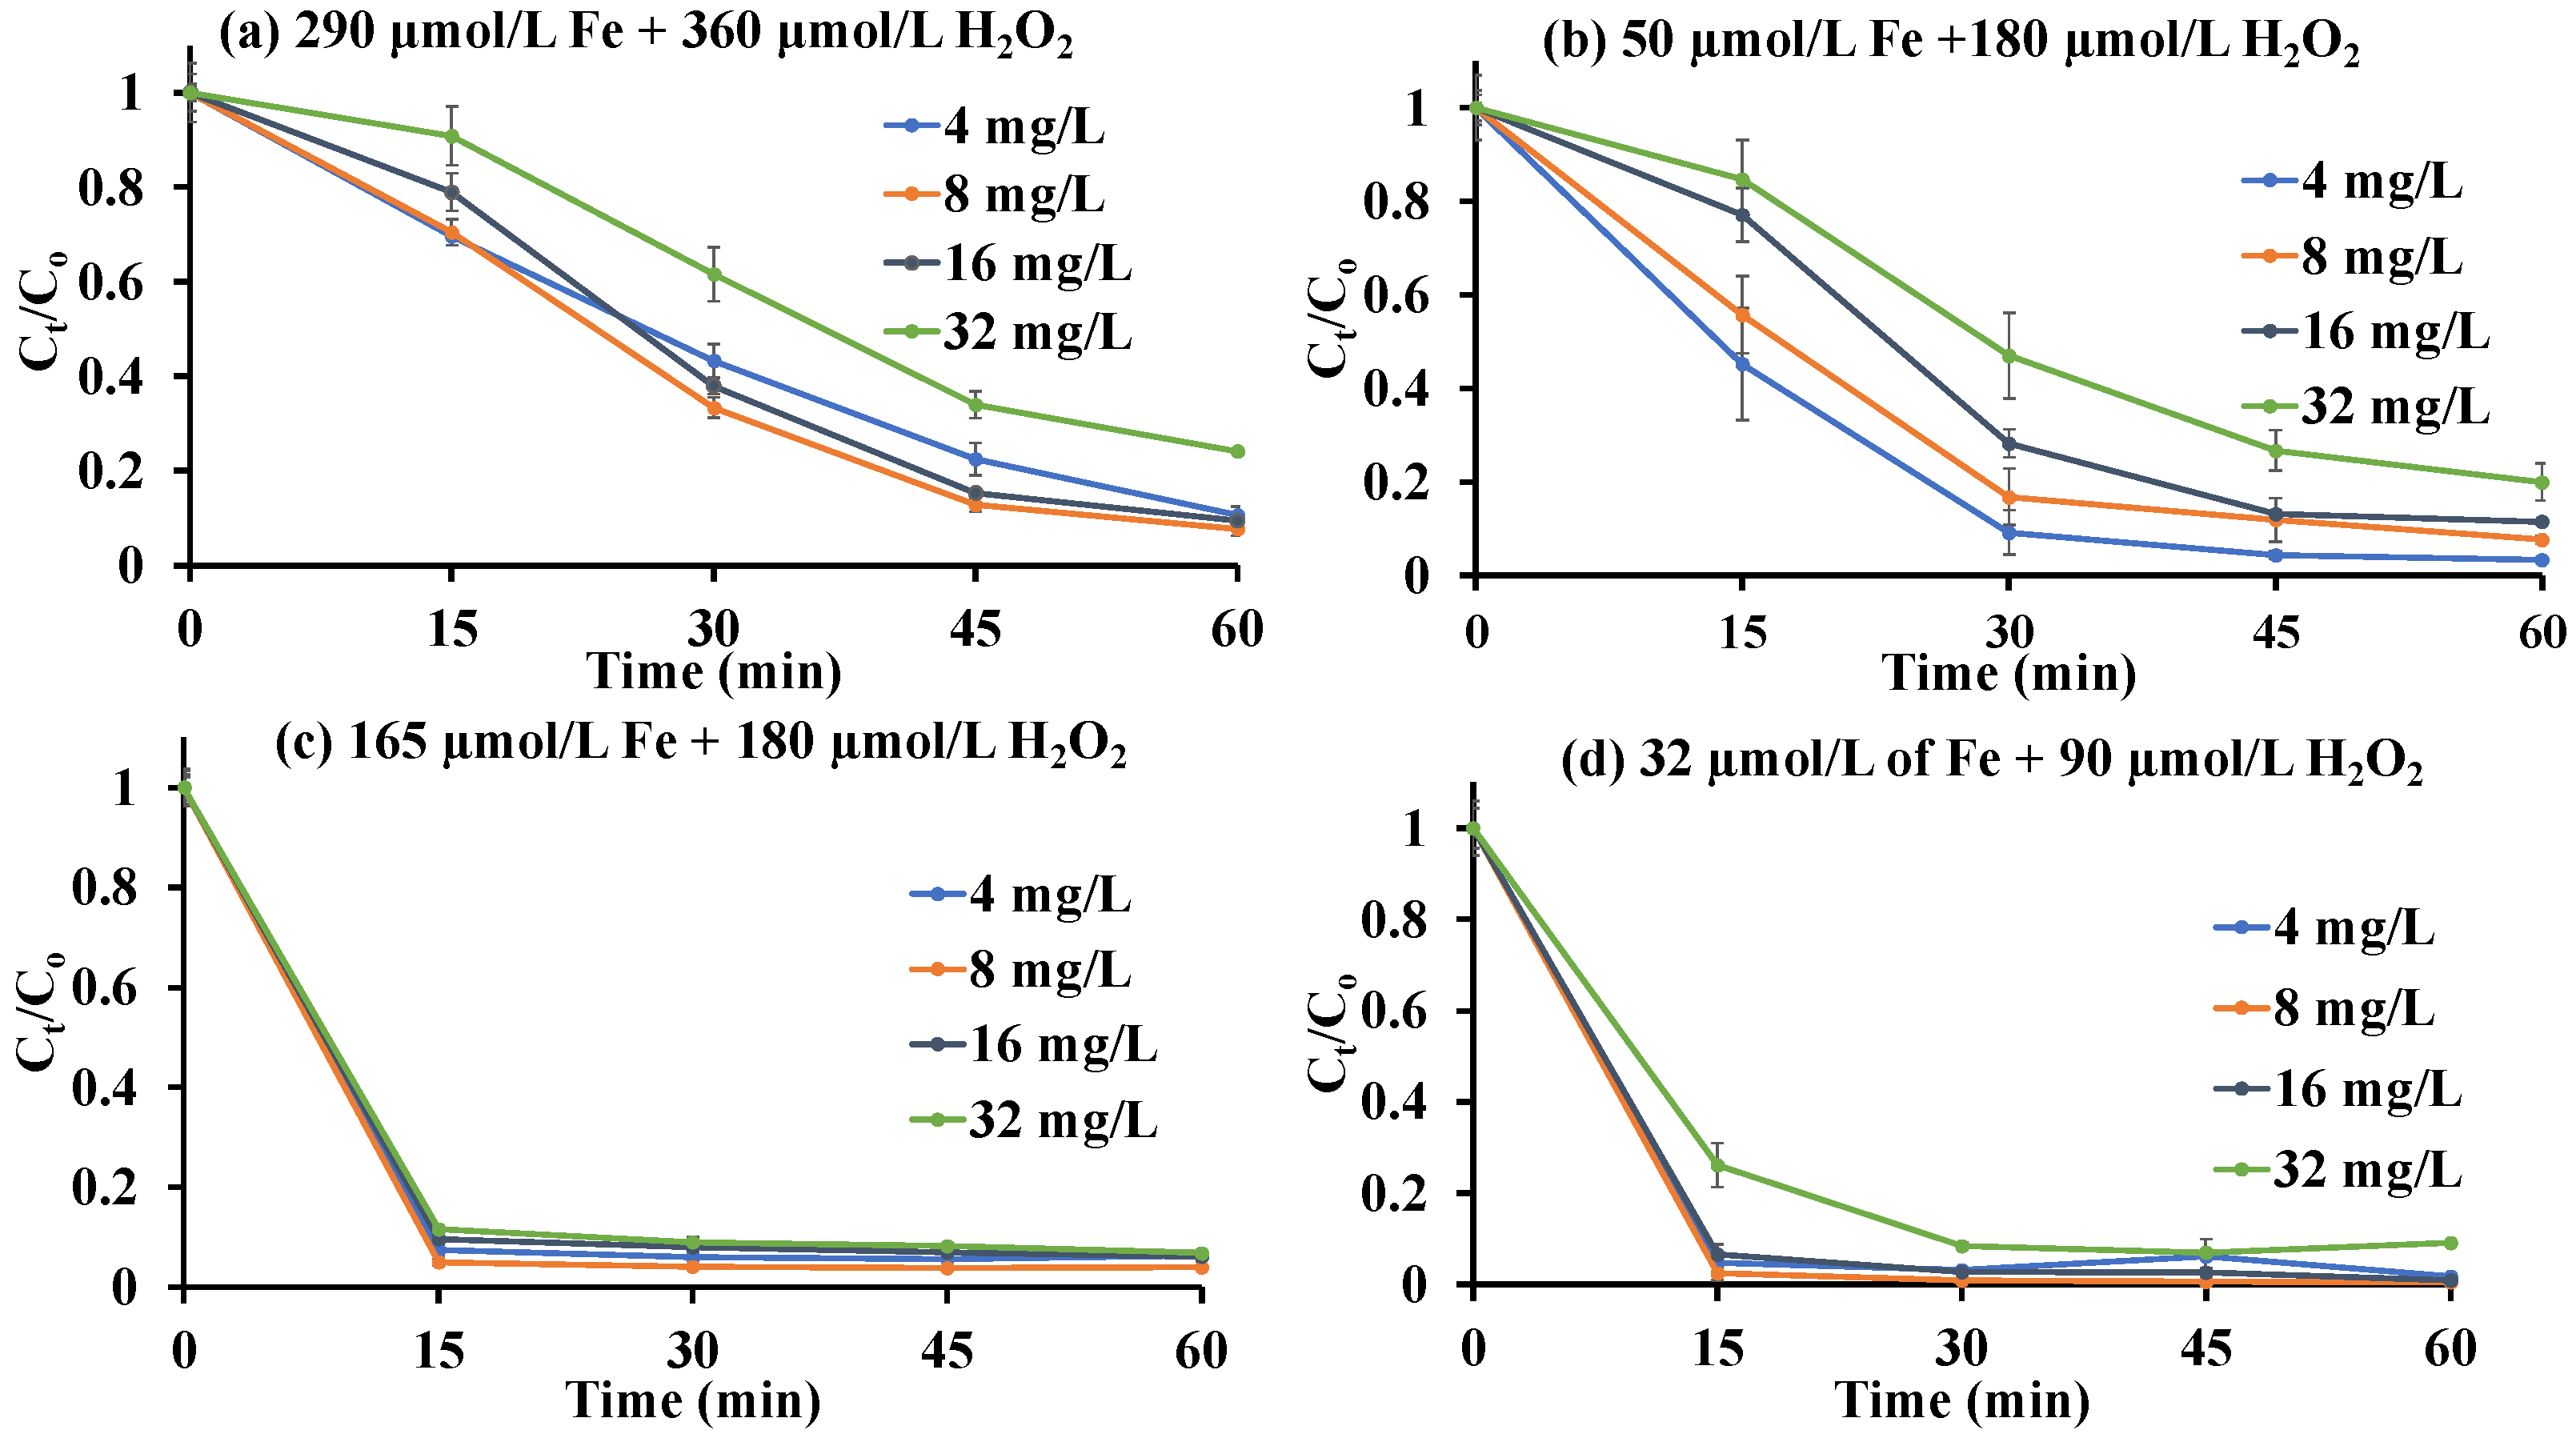
Figure 6.
Degradation of MB in successive addition cycles for (a) 1000 mg St–Fe, (b) 300 mg St–Fe, (c) 300 mg Fe–St, and (d) 100 mg Fe–St with 360 µmol/L H2O2, 350 nm UV irradiation at pH 4, and 4 mg/L MB in each cycle.
Figure 6.
Degradation of MB in successive addition cycles for (a) 1000 mg St–Fe, (b) 300 mg St–Fe, (c) 300 mg Fe–St, and (d) 100 mg Fe–St with 360 µmol/L H2O2, 350 nm UV irradiation at pH 4, and 4 mg/L MB in each cycle.
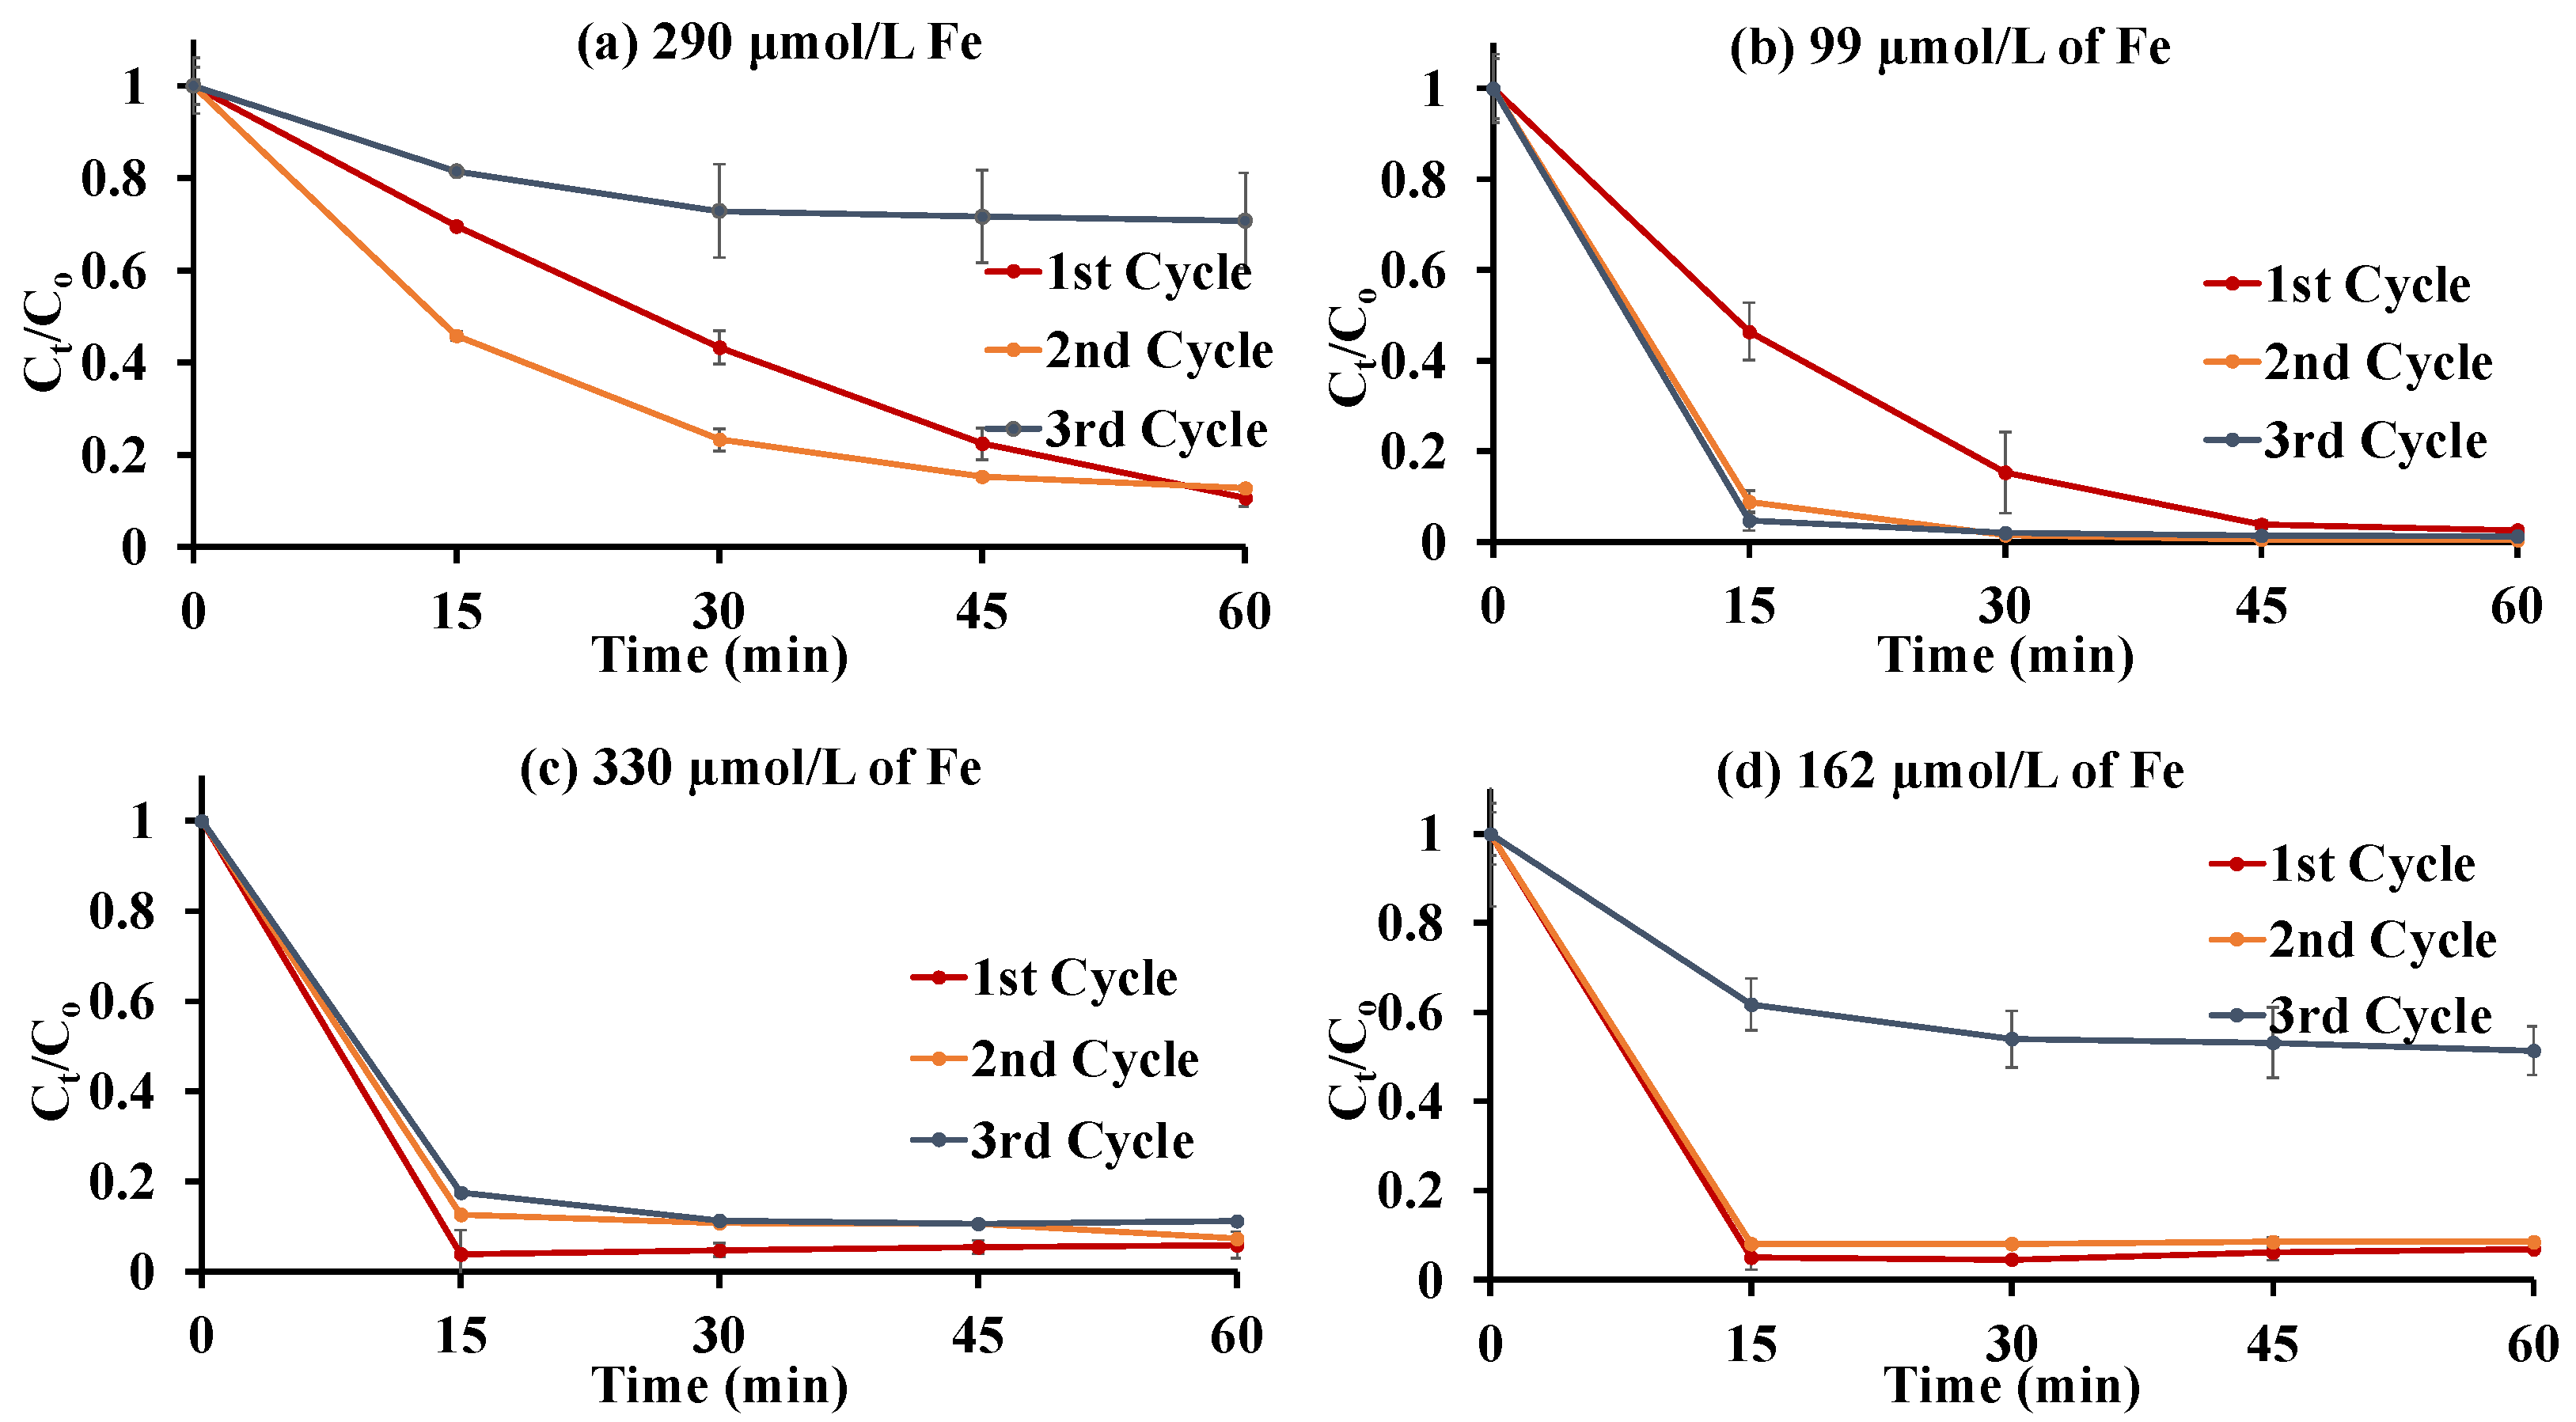
Figure 7.
UV–vis absorbance spectra for 0.01 M Fe aliquots of the different catalysts treated with 0.06 M phenol at pH 2, 3, 4, and 5; 0.02 M ferric chloride was used as a control.
Figure 7.
UV–vis absorbance spectra for 0.01 M Fe aliquots of the different catalysts treated with 0.06 M phenol at pH 2, 3, 4, and 5; 0.02 M ferric chloride was used as a control.

Table 1.
Possible reaction steps in the Fenton process.
| Step | Reaction | Rate Constant (M−1 s−1) | References |
|---|---|---|---|
| Initiation | [9,10,11] | ||
| [9,10,11] | |||
| [9,11] | |||
| Propagation | [10,11] | ||
| [10] | |||
| [10] | |||
| [9,10] | |||
| - | [10] | ||
| - | [10,11] | ||
| - | [10,11] | ||
| Termination | [9,10,11,12] | ||
| [10,11] | |||
| [10,11] | |||
| [10,11] | |||
| - | [10,11] | ||
| [10,11] | |||
| [10] |
Table 2.
Reagent ratios used and iron content for the catalyst systems investigated.
| Catalyst | Initial Weight Ratio of Iron: Citrate: Starch | Iron (% w/w) |
|---|---|---|
| 1000 mg St–Fe | ||
| 300 mg St–Fe | ||
| 300 mg Fe–St | ||
| 100 mg Fe–St |
Table 3.
TOC results for the degradation of MB at various concentrations with (a) 300 mg St–Fe, (b) 100 mg Fe–St, and (c) 100 mg Fe–St NPs.
Table 3.
TOC results for the degradation of MB at various concentrations with (a) 300 mg St–Fe, (b) 100 mg Fe–St, and (c) 100 mg Fe–St NPs.
| (a) 300 mg St–Fe 50 μmol/L Fe + 180 μmol/L H2O2 | |||
|---|---|---|---|
| Sample | Initial TOC (mg/L) | Final TOC | % Mineralized |
| Blank | 4.13 | 3.35 | - |
| 4 mg/L MB | 6.57 | 4.41 | 56.7 |
| 8 mg/L MB | 8.94 | 5.88 | 47.5 |
| 16 mg/L MB | 13.74 | 9.09 | 40.4 |
| (b) 300 mg Fe–St 33 μmol/L Fe + 45 μmol/L H2O2 | |||
| Sample | Initial TOC (mg/L) | Final TOC | % Mineralized |
| Blank | 1.41 | 0.46 | - |
| 4 mg/L MB | 3.81 | 1.66 | 50.2 |
| 8 mg/L MB | 6.22 | 3.40 | 38.9 |
| 16 mg/L MB | 11.03 | 7.75 | 24.2 |
| (c) 100 mg Fe–St 32 μmol/L Fe + 90 μmol/L H2O2 | |||
| Sample | Initial TOC (mg/L) | Final TOC (mg/L) | % Mineralized |
| Blank | 2.12 | 0.7 | - |
| 4 mg/L MB | 4.52 | 1.53 | 65.3 |
| 8 mg/L MB | 6.92 | 2.49 | 62.9 |
| 16 mg/L MB | 11.73 | 6.20 | 42.8 |
Table 4.
Comparison of the performance of Fe-based heterogeneous photo-Fenton catalysts for the degradation of methylene blue reported in the literature and in this work.
Table 4.
Comparison of the performance of Fe-based heterogeneous photo-Fenton catalysts for the degradation of methylene blue reported in the literature and in this work.
| Catalyst System | MB Conc. (mg/L) | Iron Conc. (mg/L) | H2O2 Conc. (µmol/L) | Reaction Time (min) | % Discoloured | % Mineralized |
|---|---|---|---|---|---|---|
| PMS-Fe-400 [40] | 50 | 500 | 1800 | 80 | 93.3 | 78 |
| Fe2O3/GO [41] | 40 | 100 | 1100 | 80 | 99 | 56 |
| Fe–Ni/SiO2 [42] | 40 | 85 | 3000 | 60 | 99.8 | 86.2 |
| 100 mg Fe–St | 4 | 1.8 | 90 | 60 | 99 | 65.3 |
| 100 mg Fe–St | 8 | 1.8 | 90 | 60 | 99 | 62.9 |
| 100 mg Fe–St | 32 | 1.8 | 90 | 30 | 92 | N/A |
Publisher’s Note: MDPI stays neutral with regard to jurisdictional claims in published maps and institutional affiliations. |
© 2022 by the authors. Licensee MDPI, Basel, Switzerland. This article is an open access article distributed under the terms and conditions of the Creative Commons Attribution (CC BY) license (https://creativecommons.org/licenses/by/4.0/).
Share and Cite
MDPI and ACS Style
Dasgupta, N.; Nayak, M.A.; Gauthier, M. Starch-Stabilized Iron Oxide Nanoparticles for the Photocatalytic Degradation of Methylene Blue. Polysaccharides 2022, 3, 655-670. https://doi.org/10.3390/polysaccharides3030038
AMA Style
Dasgupta N, Nayak MA, Gauthier M. Starch-Stabilized Iron Oxide Nanoparticles for the Photocatalytic Degradation of Methylene Blue. Polysaccharides. 2022; 3(3):655-670. https://doi.org/10.3390/polysaccharides3030038
Chicago/Turabian StyleDasgupta, Natun, Milind Ajith Nayak, and Mario Gauthier. 2022. "Starch-Stabilized Iron Oxide Nanoparticles for the Photocatalytic Degradation of Methylene Blue" Polysaccharides 3, no. 3: 655-670. https://doi.org/10.3390/polysaccharides3030038