Article

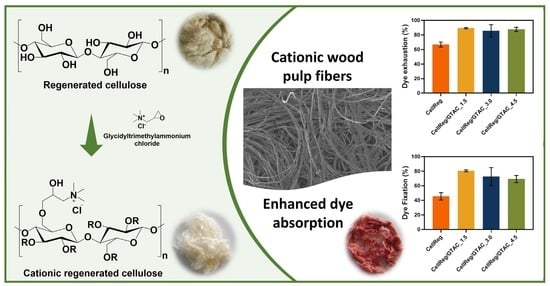
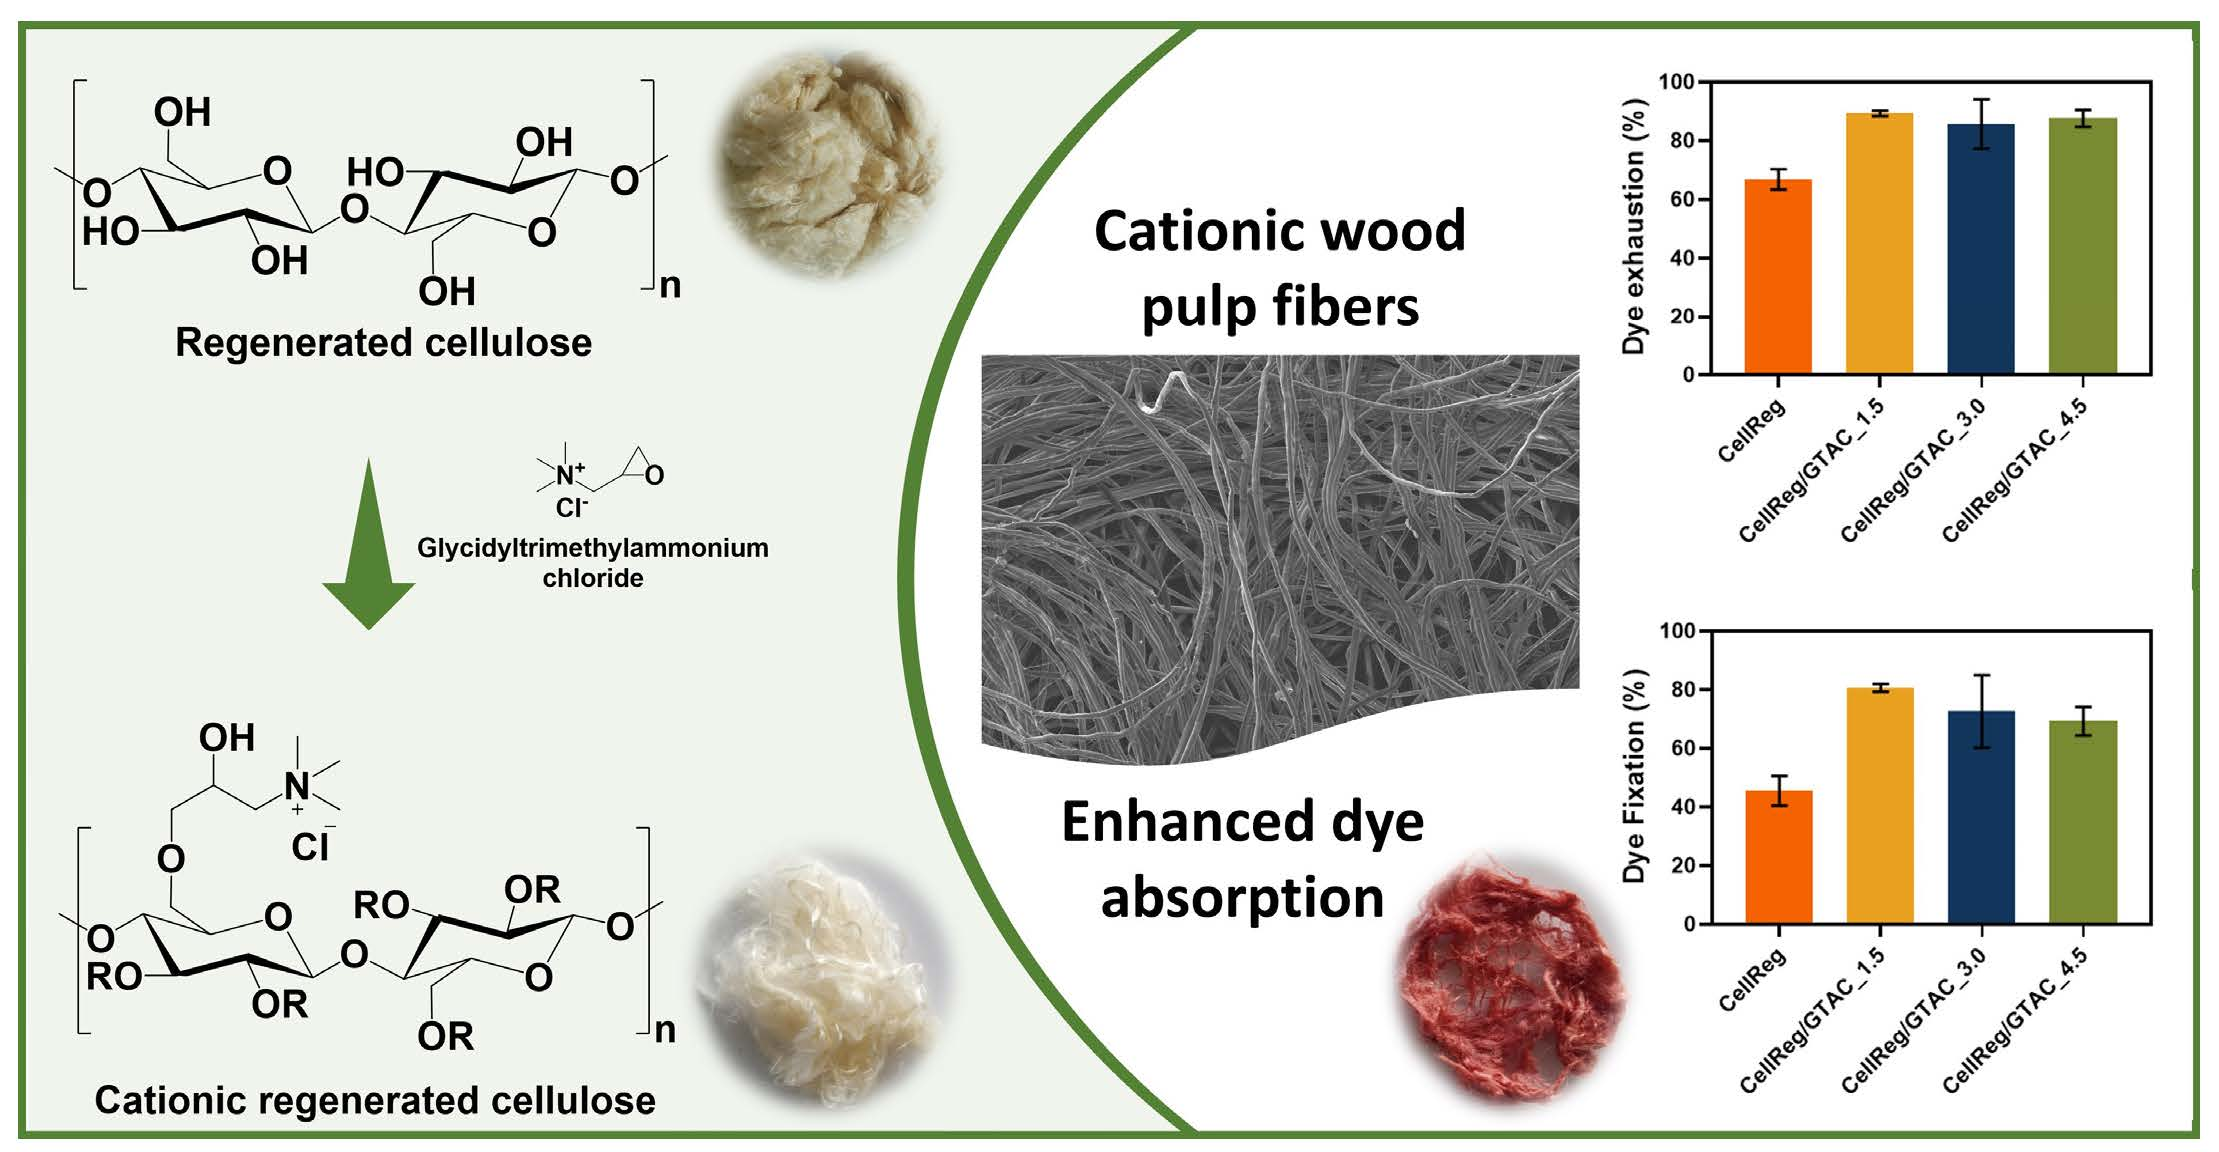
From Regenerated Wood Pulp Fibers to Cationic Cellulose: Preparation, Characterization and Dyeing Properties

by
Bárbara Pereira
1,†,
Filipe S. Matos
1,†,
Bruno F. A. Valente
1,
Niklas Von Weymarn
2,
Taina Kamppuri
3,
Carmen S. R. Freire
1,
Armando J. D. Silvestre
1 and
Carla Vilela
1,*
1
CICECO—Aveiro Institute of Materials, Department of Chemistry, University of Aveiro, 3810-193 Aveiro, Portugal
2
Metsä Spring Oy, 02100 Espoo, Finland
3
VTT Technical Research Centre of Finland Ltd., Vuorimiehentie 3, FI-02044 VTT Espoo, Finland
*
Author to whom correspondence should be addressed.
These authors contributed equally to this work.
Polysaccharides 2022, 3(3), 609-624; https://doi.org/10.3390/polysaccharides3030036
Submission received: 15 June 2022 / Revised: 4 August 2022 / Accepted: 23 August 2022 / Published: 7 September 2022

Abstract

:
The global demand for sustainable textile fibers is growing and has led to an increasing research interest from both academia and industry to find effective solutions. In this research, regenerated wood pulp fibers were functionalized with glycidyltrimethylammonium chloride (GTAC) to produce modified regenerated cellulose with cationic pending groups for improved dye uptake. The resultant cationic cellulose with a degree of substitution (DS) between 0.13 and 0.33 exhibited distinct morphologies and contact angles with water ranging from 65.7° to 82.5° for the fibers with DS values of 0.13 and 0.33, respectively. Furthermore, the thermal stability of the modified regenerated cellulose fibers, albeit lower than the pristine ones, reached temperatures up to 220 °C. Additionally, the modified fibers showed higher dye exhaustion and dye fixation values than the non-modified ones, attaining maxima values of 89.3% ± 0.9% and 80.6% ± 1.3%, respectively, for the cationic fibers with a DS of 0.13. These values of dye exhaustion and dye fixation are ca. 34% and 77% higher than those obtained for the non-modified fibers. Overall, regenerated wood pulp cellulose fibers can be used, after cationization, as textiles fiber with enhanced dye uptake performance that might offer new options for dyeing treatments.

Graphical Abstract

1. Introduction

The textile industry—with an expected textile fiber production of 133.5 million tons by 2030—just like most industrial sectors, is moving towards the development of sustainable processes and materials as a strategy to expedite the deployment of the circular economy and bioeconomy concepts [1], as part of the 2030 Agenda for Sustainable Development [2]. Most of the textile fibers are either synthetic (63% of the global fiber production in 2019 [1]) or made from cotton (90% of all natural fibers in textiles [1]), both of which raise environmental problems, although in different forms and scales [3,4]. On the one hand, the production of synthetic fibers composed of petroleum-based polymers, such as polyester, polyamide and polyacrylic fibers, deeply contribute to global warming, and are a massive source of microplastics [5,6]. On the other hand, the cultivation of cotton involves the exploitation of arable land, and the consumption of high quantities of irrigation water, fertilizers and pesticides, which raise the negative environmental impact of these natural fibers [4,6]. Moreover, the cotton fiber production process also generates massive amounts of byproducts that are either incinerated or landfilled, and requires a high water intake [6,7].
An alternative to cotton fibers can be offered by using forest-based raw materials, most often free from herbicides and insecticides, and requiring no irrigation [6], such as wood-based cellulose fibers [1] from cheaper paper grade kraft pulp fibers [8,9]. Viscose and lyocell are two examples of commercially available manmade cellulose fibers where dissolving grade pulp is the main wood-based raw material [1,10]. However, the viscose and lyocell processes for the conversion of wood fibers into spun textile fibers also cause several hurdles that need to be tackled. In fact, both processes require fibers with a high content of pure α-cellulose, low molecular weight cellulose, and the use of environmentally hazardous chemicals and solvents, namely the highly toxic carbon disulfide for the viscose process and the explosive N-methylmorpholine N-oxide for the lyocell process [1,10].
Given the evolution towards sustainability, a step towards fabricating regenerated cellulose involves the use of ionic liquids (ILs) as non-derivatizing (or derivatizing) solvents for the dissolution and regeneration of cellulose [1,11,12,13,14,15,16], as for instance in the case of the Ioncell® technology [17], although this process is still in its industrial infancy. The common denominator in these dissolution/regeneration methods is the fact that the wood cellulose fibers are too short for textiles and, thus, require processing with a continuous spinning and regenerating technology [1]. Although this might be perceived as a drawback, regenerated cellulose fibers have several advantageous features over both synthetic and natural counterparts by combining the best of both worlds: uniform morphological, mechanical and physical properties, biodegradability, CO2 neutrality and low density [1].
Another relevant characteristic of regenerated cellulose fibers is their high proneness to chemical modification [18], which opens the possibility of imparting specific functional groups to the fiber surface to facilitate, for instance, the reduction of water use in textile treatments, such as dyeing. In fact, the increase in the absorption of dyes is of paramount relevance to reduce the environmental footprint of the textile value chain. Despite the existence of studies dealing with the manufacture of cellulose textile fibers with superior dyeability, most are focused on the modification of cellulose pulp powder [19] and cotton fibers [20,21,22], as well as on the regeneration of cellulose fibers from cotton waste pulp [23]. For example, Björquist et al. [23] investigated the textile qualities of lyocell fibers from pure cotton waste pulp and lyocell fibers blended with conventional dissolving pulp, and compared them with the commercial manmade TENCEL® staple fibers. According to the authors, the dyeability of the regenerated cellulose fibers from cotton waste was as good as that of the commercial manmade fibers [23]. To the best of our knowledge, there is no study dealing with the functionalization of regenerated wood pulp cellulose fibers with cationic groups—known for facilitating dyeing [19,20]— to produce textile fibers with improved dyeability.
In this perspective, the goal of the present work is to exploit regenerated wood pulp fibers as a surrogate of cotton to manufacture fibers with improved dyeability and reduced environmental footprint for potential application as textile fibers. Therefore, regenerated wood pulp fibers were subjected to heterogenous modification via the reaction with a tetraalkylammonium derivative containing reactive epoxy moieties, namely glycidyltrimethylammonium chloride (GTAC), viz. a well-known reagent for polysaccharide cationization [24]. The modified regenerated cellulose fibers were studied in detail in terms of degree of substitution, structure, crystallinity, morphology, surface charge and wettability, thermal stability, and dye uptake capacity.

2. Materials and Methods

2.1. Chemicals and Materials

Regenerated unbleached staple fibers from pilot scale production using 7-methyl-1,5,7-triazabicyclo(4.4.0)dec-5-ene (MTBD)-acetate as the solvent of unbleached softwood paper-grade Kraft pulp (viscosity-adjusted with sulfuric acid, average fiber fineness: 1.7 dtex—1 dtex is equal to 1 g/10,000 m—and average fiber staple length: 40 mm) were supplied by Metsä Spring Oy (Espoo, Finland). Glycidyltrimethylammonium chloride (GTAC, ≥90%), hydrochloric acid (37% solution), sodium hydroxide (anhydrous, ≥98%, pellets), tetrahydrofuran (THF, ≥99.9%) and Remazol Brilliant Orange 3R (reactive orange 16, dye content: ≥70%) were purchased from Sigma-Aldrich (Saint Louis, MO, USA). Ultrapure water (type 1) with a resistivity of 18.2 MΩ cm and conductivity of 0.056 μS cm−1 at 25 °C was purified by a Simplicity® Water Purification System (Merck, Darmstadt, Germany). Other chemicals and solvents were of laboratory grade.

2.2. Cationization of the Regenerated Cellulose Fibers

The cationization of the regenerated cellulose fibers was adapted from the method described by Odabas et al. [25]. Briefly, 1 g of dried regenerated unbleached fibers was soaked in ultrapure water for 4 h, dispersed using a heavy-duty vortex mixer (VWR International, Alfragide, Portugal) at a speed of 3500 rpm and filtered off. Then, the fibers were re-dispersed in 45 mL of ultrapure water/THF (10/90 v/v). After stirring for 1 h at room temperature, 0.5 mL of 10 M aqueous solution of NaOH were added, and 30 min later, GTAC was added dropwise: three molar ratios of GTAC to anhydroglucose unit (AGU) were tested, namely 1.5, 3.0 and 4.5, as summarized in Table 1. Ultrapure water was added to reach a total solvent volume of 50 mL. After 15 h at 40 °C, the reaction was stopped by adding 2.5 mL of a 4 M aqueous solution of HCl. The modified fibers were filtered, washed with ultrapure water until neutral pH and dried in a ventilated oven (Thermo Fisher Scientific, Waltham, MA, USA) at 40 °C for 24 h.

2.3. Characterization Methods

2.3.1. Elemental Analysis

Elemental analysis (C, H, N) was carried out on a LECO TruSpec 630-200-200 CHNS equipment (LECO Corporation, Michigan, MI, USA). The degree of substitution (DS) was calculated using the nitrogen content (N) of the modified fibers and the molar masses of nitrogen (14.01 g mol−1), of the substituent (151.63 g mol−1) and of the AGU (162.15 g mol−1), as follows [25,26]:
DS = N × 162.15 14.01 N × 151.63

2.3.2. Fourier Transform Infrared-Attenuated Total Reflection (FTIR-ATR) Spectroscopy

FTIR-ATR spectroscopy was performed in a Perkin-Elmer FT-IR System Spectrum BX spectrophotometer (PerkinElmer Inc., Waltham, MA, USA) fitted out with a single horizontal Golden Gate ATR cell (Specac®, London, UK). The samples were analyzed from 4000 to 600 cm−1 at 32 scans and 4 cm−1 resolution.

2.3.3. Solid-State Carbon Cross-Polarization/Magic-Angle-Spinning Nuclear Magnetic Resonance (13C CP/MAS NMR) Spectroscopy

13C CP/MAS NMR spectra were recorded on a Bruker Avance III 400 spectrometer (Bruker Corporation, Billerica, MA, USA) operating at a B0 field of 9.4 T using 12 kHz MAS with proton 90° pulse of 3 µs, time between scans of 3 s and a contact time of 2000 µs.

2.3.4. X-ray Diffraction (XRD)

XRD was performed on a Phillips X’pert MPD diffractometer (PANalytical, Eindhoven, The Netherlands) using Cu Kα radiation (λ = 1.541 Å) with a scan rate of 0.05° s−1. The XRD patterns were collected in reflection mode with the samples (flat discs of 1.5 cm2) placed on a Si wafer, with negligible background signal, for mechanical support.

2.3.5. Optical Microscopy

Optical microscopy images were recorded with an OLYMPUS BX51 microscope (Olympus Europa, Hamburg, Germany) coupled with a digital uEye camera (IDS Imaging Development Systems, Obersulm, Germany). The samples were placed on microscope glass slides.

2.3.6. Scanning Electron Microscopy (SEM)

SEM micrographs were obtained with a HR-FESEM SU-70 Hitachi microscope (Hitachi High-Technologies Corporation, Tokyo, Japan) operating at 4 kV. The samples were placed on an aluminum stub and previously coated with a carbon film.

2.3.7. Zeta Potential

Apparent zeta potential measurements were carried out in a Malvern Zetasizer Nano ZS equipment (Malvern Panalytical, Cambridge, UK), using ultrapure water as dispersion medium at room temperature. All samples were analyzed in triplicate (based on one hundred measurements per sample).

2.3.8. Contact Angle Measurements

The measurement of the contact angles was performed with a DataPhysics Instruments OCA20 equipment with a video camera and the SCA 20 software (DataPhysics Instruments, Filderstadt, Germany), using the sessile drop method [27]. The procedure consisted in placing the test specimens (flat discs of 2.5 cm2) in the equipment and depositing a drop of ultrapure water on its surface using a micro-syringe (Hamilton, model DS500/GT, 500 µL, needle of 0.52 mm diameter). Ten measurements were recorded for each sample.

2.3.9. Thermogravimetric Analysis (TGA)

TGA was performed with a SETSYS Setaram TGA analyzer (SETARAM Instrumentation, Lyon, France) equipped with a platinum cell. The samples were heated from room temperature to 800 °C, at a constant rate of 10 °C min−1 under inert (N2) atmosphere.

2.3.10. Colorimetric Coordinates and ISO Brightness

The colorimetric coordinates (CIELab scale: L*, a*, b*) and ISO brightness (ISO 2470-1 [28]) were measured with a Konica Minolta CM-2300d portable sphere type spectrophotometer (Konica Minolta Sensing Europe BV, UK) with horizontal alignment, and calibrated according to standard specifications [29]. The parameters of lightness, L* (black = 0 to white = 100), and color coordinates, a* (green = −a* to red = +a*) and b* (blue = −b* to yellow = +b*) were measured using the SpectraMagic™ NX software.
The total color difference (∆E) of the samples was given by the following equation [30]:
E = L * 2 + a * 2 + b * 2
where ∆L*, ∆a* and ∆b* parameters are (i) before dyeing: the difference between the color of the non-modified regenerated cellulose and the color of each modified cellulose sample, and (ii) after dyeing: the difference between the color of each non-dyed cellulose sample and the color of the respective sample after dyeing.

2.4. Dyeing Uptake Tests

A dyebath containing Remazol Brilliant Orange 3R dye (3 wt % relative to the fibers), 1/3 of Na2CO3 (10 g L−1) and Na2SO4 (80 g L−1) was prepared. An aliquot (A0) was taken for analysis by ultraviolet-visible (UV-Vis) spectroscopy (Shimadzu UV-1800 UV–vis spectrophotometer, Shimadzu Corp., Kyoto, Japan) at 492 nm (maximum absorption peak of the reactive dye). Then, the fiber samples were added to the dyebath at a liquor ratio of 1:20. After 30 min, the remaining 2/3 of Na2CO3 were added, and 30 min later, the fibers were taken out and an aliquot was removed for UV-Vis spectroscopic analysis (A1) and the fibers rinsed with cold tap water. For the washing-off, the fibers were boiled for 15 min, then another aliquot was taken for UV-Vis spectroscopic analysis (A2) and, finally, the fibers were rinsed with cold tap water and oven dried at 40 °C overnight. The dye exhaustion (E) and fixation (F) percentages were calculated through the following equations [20,31]:
E % = 1 A 1 A 0 × 100
F % = A 0 A 1 A 2 A 0 × 100 = 1 A 1 A 0 A 2 A 0 × 100 .

2.5. Statistical Analysis

Statistical significance was established at p < 0.05 using (i) one-way variance analysis (ANOVA) and Tukey’s test for the DS, zeta potential, contact angle, dye exhaustion and dye fixation data, and (ii) two-way variance analysis (ANOVA) and Tukey’s test for the colorimetric coordinates and ISO brightness data (GraphPad Prism 8.0, GraphPad Software, San Diego, CA, USA).

3. Results and Discussion

The heterogenous modification of the regenerated wood pulp cellulose fibers was performed with the aim of fine-tuning target surface properties of the fibers, namely to enhance their dye uptake capacity. These regenerated cellulose fibers (CellReg) were chosen for their uniform morphological, mechanical and physical properties, biodegradability, CO2 neutrality and low density [1], as well as their high reactivity, while GTAC was selected as the cationizing agent for making possible the improvement of the reactive dyeing of the fibers. Therefore, the modification was focused on the cationization of CellReg by grafting cationic pending groups via the reaction with a tetraalkylammonium derivative containing reactive epoxy moieties. The cationization reaction, displayed in Figure 1A, was performed in a THF-water (90:10) mixture, since this was reported to enhance the cationization efficiency and the integrity of the cellulose fibers by suppressing the occurrence of side-reactions, namely the hydrolysis of GTAC in aqueous alkaline conditions [32]. Three distinct GTAC/AGU molar ratios, namely 1.5:1, 3.0:1 and 4.5:1, were studied to modulate the degree of substitution of the modified cellulose fibers [33]. The non-modified and modified regenerated cellulose samples were thoroughly characterized regarding their DS based on elemental analysis, molecular structure by FTIR-ATR and solid-state 13C NMR spectroscopy, crystallinity by XRD, surface charge by zeta potential measurements, surface wettability by contact angle (with water) measurements, morphology by SEM, thermal stability by TGA and dye uptake by dyeing the cellulosic samples with a commercial reactive dye (i.e., Remazol brilliant Orange 3R), as discussed in the following paragraphs.

3.1. Composition and Structure

The cationization reaction was investigated with the goal of preserving the bulk properties of the fibers, but at the same time adequate to attain enhanced surface properties, namely superior dye uptake capacity. Therefore, the ratio of GTAC to AGU was varied from 1.5 (CellReg/GTAC_1.5) to 3.0 (CellReg/GTAC_3.0) and 4.5 (CellReg/GTAC_4.5), as listed in Table 1.
The ensuing cellulose samples are shown in Figure 1B and their distinct macroscopic aspect is the first indication that the cationization reaction predictably took place to different extents, leading to distinct DS values (Table 1). While for the CellReg/GTAC_1.5 the fibrous aspect of the material was preserved, for the other samples, namely CellReg/GTAC_3.0 and CellReg/GTAC_4.5, a reduction of the fibrillar appearance was detected, particularly for the sample with the highest DS where a film-like material was obtained. The DS values of the modified fibers increased with the increasing GTAC/AGU ratio from 0.13 ± 0.004 for CellReg/GTAC_1.5 to 0.33 ± 0.002 for CellReg/GTAC_4.5. Therefore, the resultant DS values can be modulated by varying the GTAC/AGU ratio [19,25,26,34,35,36], and are comparable with the data described by Courtenay et al. [33], who achieved DS values of 0.188 and 0.230 for GTAC/AGU molar ratios of 1:1 and 3:1, respectively.
The cationization of the regenerated cellulose fibers was further confirmed by FTIR-ATR and solid state 13C NMR spectroscopy, as shown in Figure 2A,B. The FTIR-ATR spectrum of the non-modified regenerated cellulose (CellReg, Figure 2A) show the typical absorption bands of cellulosic substrates at ca. 3320 cm−1 (O–H stretching vibration of the primary and secondary OH groups), 2890 cm−1 (C–H stretching vibration), 1306, 1366 and 1420 cm−1 (O–H in-plane bending vibration bands of the primary and secondary OH groups), 1154 cm−1 (C–O–C antisymmetric stretching vibration of the glycosidic bonds) and 1020 cm−1 (C–O stretching vibration) [37,38,39].
Regarding the regenerated cellulose samples modified with the different GTAC/AGU ratios (1.5, 3.0 and 4.5), apart from the typical absorption bands of cellulose, the three spectra show the emergence of a new band at ca. 1476 cm−1, which is assigned to the trimethyl groups of the quaternized ammonium moiety of GTAC [32,40,41,42]. Thus, this absorption band confirms the presence of the grafted moieties and, therefore, the successful cationization of the regenerated cellulose fibers. As anticipated, a higher GTAC/AGU ratio translates into an increase in the intensity of the absorption bands characteristic of the substituent, which is in accordance with the DS values (Table 1).
Figure 2B depicts the solid-state 13C CP/MAS NMR spectra of the non-modified and modified regenerated cellulose fibers. The non-modified sample shows the representative carbon resonances of regenerated cellulose (cellulose II allomorph) with peaks at δ 104.8 ppm with a shoulder at 107.1 ppm (C1), 88.7 ppm (C4), 72.1–74.8 ppm (C2,3,5) and 64.8 ppm (C6) [37]. The three modified cellulose samples display the typical carbon resonances of regenerated cellulose in tandem with a new peak assigned to the carbon resonance of the (CH3)3N+ moiety at 54.9 ppm (C10) [33,43]. The presence of this resonance corroborates the FTIR-ATR data and further confirms the occurrence of the cationization reaction. It is also clearly visible (Figure 2B) that the intensity of the carbon resonance of the tetraalkylammonium moiety increased with the augmentation in the GTAC/AGU ratio, once again pointing to the different DS values of the modified regenerated cellulose samples (Table 1).
The crystallinity of the non-modified and modified regenerated cellulose samples was evaluated by XRD as illustrated in Figure 2C. As foreseen, the CellReg sample exhibits the diffraction pattern of cellulose II consisting of a small broad peak centered at 2θ = 12.2° corresponding to the (1 1 ¯ 0) diffraction plane and two overlapped broad peaks at 2θ = 20.2° and 21.5° allocated to the (110) and (020) diffraction planes, which are characteristic of regenerated cellulose [13,39,44]. The diffraction pattern of the regenerated cellulose is different from that of cellulose I [37] because the process of dissolution followed by regeneration changes the crystal structure of this polysaccharide [18,44]. The XRD diffractograms of the modified regenerated cellulose samples (Figure 2C), i.e., CellReg/GTAC_1.5, CellReg/GTAC_3.0 and CellReg/GTAC_4.5, are similar to that of CellReg, although showing some broadening of the peaks and a decrease in the intensity of the (110) and (020) reflections relative to that of (1 1 ¯ 0), both observed for increasing DS values, which is consistent with a small increase in the amorphous domains of the samples and their macroscopic aspect. This slight increase in the amorphous character of the modified samples is in consonance, not only with the data described by Ho et al. [19] for GTAC-modified nanofibrillated cellulose, but also for other polysaccharides (e.g., chitosan) modified with GTAC [45].

3.2. Morphology, Surface Charge and Surface Wettability

The morphology of the non-modified and modified regenerated cellulose samples was examined by optical and SEM microscopy as depicted in Figure 3. The optical micrographs (Figure 3A) evince a fibrous morphology for all samples but with a considerable reduction of visible individualized fibers in the case of CellReg/GTAC_4.5, in line with their macroscopic appearance shown in Figure 1B. In fact, a closer look at the optical micrograph of CellReg/GTAC_4.5 shows a large decline in the number of available fibers and a tremendous lowering of their length size, as well as a decrease in the amount of visible light that passes through the sample, which is congruous with a cellulose derivative with a film-like morphology. This is further corroborated by the SEM micrographs of the surface of the samples presented in Figure 3B. After modification of CellReg with GTAC, only the CellReg/GTAC_1.5 sample with the lowest DS (0.13 ± 0.004) retained a total fibrillar morphology. On the other hand, the CellReg/GTAC_3.0 and CellReg/GTAC_4.5 samples exhibit a film-like morphology with a smooth surface with only a few visible fibers. This film-like morphology is a clear indication of the higher DS values of those two samples, again in accordance with their visual aspect (Figure 1B) and XRD data (Figure 2C). This was anticipated to some extent since, as the DS increases, the modification starts to occur beyond the surface of the fibers, thus starting to destroy the characteristic fibrillar microstructure of the cellulose fibers and originating a cellulose derivative with a film-like morphology. Therefore, given that the goal was to fine-tune specific surface properties without changing the bulk properties of the fibers, the CellReg/GTAC_1.5 sample is, thus far, the most promising one given its fibrillar morphology.
The surface charge of the non-modified and modified regenerated cellulose samples was assessed by zeta potential measurements. According to Table 1, CellReg presents a negative apparent zeta potential value of −15.4 ± 5.0 mV, as a result of the presence of carboxyl and hydroxyl groups [46,47], in accordance with, e.g., the value reported for Lyocell fibers of ca. −15 mV (at pH 7) [48]. After cationization, the surface charge turns positive with apparent zeta potential values of 8.4 ± 3.9 mV for CellReg/GTAC_1.5, 15.2 ± 3.2 mV for CellReg/GTAC_3.0 and 26.9 ± 5.5 mV for CellReg/GTAC_4.5. The change in the surface charge of CellReg after modification with GTAC reflects the success of the cationization and the different DS values, which is consistent with the charge reversal observed by Odabas et al. [32] for cationically modified bleached Kraft pulp and by Courtenay et al. [33] for cationically modified cellulose nanofibrils.
The surface wettability of the non-modified and modified regenerated cellulose samples was studied by contact angle measurements with water [49] via the sessile drop method. As depicted in Table 1, the non-modified regenerated cellulose fibers (CellReg) revealed the lowest contact angle value of 50.7 ± 6.3°, in accordance with data recorded by Pang et al. [39] for regenerated cellulose from cotton linters using different ionic liquids as solvents. In the case of the modified cellulose samples (Table 1), the contact angles increased from 65.7 ± 3.4° for CellReg/GTAC_1.5 to 71.5 ± 2.2° for CellReg/GTAC_3.0 and 82.5 ± 3.8° for CellReg/GTAC_4.5. These results provide evidence that the cationization reaction slightly increased the hydrophobicity of the modified regenerated cellulose fibers, although remaining in the hydrophilic range (10° < θ < 90°). This might be associated, on one hand, with the reduction of the fibrillar nature of the cellulosic materials, particularly for the sample with the highest DS (CellReg/GTAC_4.5) where a film-like material was obtained (Figure 1B); and, on the other hand, with the presence of the more hydrophobic methyl (−CH3) groups of GTAC at the surface of the cellulosic materials, alongside the more hydrophilic hydroxyl (−OH) moieties [50]. In fact, a similar trend was described by Kallio and co-workers, who have shown that the water contact angle of cellulose nanofibrils increased from 32.6° to 67.7° after cationization with GTAC (DS of 0.35) [51], which, as conjectured by the authors, is due to the fact that the hydrophobic methyl groups of the (CH3)3N+ moieties do not establish hydrogen bonds with water, thus, rendering the surface of the cellulose nanofibrils slightly less hydrophilic than the pristine cellulose nanofibrils [50].

3.3. Thermal Stability

The thermal stability of the non-modified and modified regenerated cellulose samples was assessed by TGA and the corresponding thermograms are shown in Figure 2D. Apart from the volatilization of water below 100 °C, the regenerated cellulose fibers exhibited a one-step weight-loss degradation profile in the range 273–370 °C with a maximum decomposition temperature of 344 °C and a total mass loss of ca. 89% at 800 °C, aligned with data described elsewhere [39]. On the other hand, the CellReg/GTAC_1.5 and CellReg/GTAC_3.0 samples displayed a two-step weight-loss degradation profile, alongside the initial loss allocated to the release of adsorbed water below 100 °C (loss of ca. 7 wt %). In relation to CellReg/GTAC_1.5, the first degradation stage took place at 243–319 °C with a maximum decomposition temperature of 288 °C, while the second one occurred at 319–362 °C with a maximum decomposition temperature of 331 °C (Figure 2D). For the CellReg/GTAC_3.0 sample, the first stage emerged at 243–314 °C with a maximum decomposition temperature of 286 °C, and the second stage appeared at 314–366 °C with a maximum decomposition temperature of 340 °C. According to Li et al. [52], the first degradation step is related to the thermal decomposition of the GTAC functional groups, whereas the second one is mainly linked with the decomposition of the cellulose backbone. However, this is questionable because the amount of material that was degraded in the first stage is higher than that in the second stage for both fiber samples. In fact, as hypothesized by Odabas et al. [25], the first stage is most likely associated with the simultaneous degradation of the substituent groups and the cellulose functional moieties to which they are bonded.
Regarding the CellReg/GTAC_4.5 sample with a DS value of 0.33 ± 0.002, the thermograms followed a one-step weight-loss with a maximum decomposition temperature at 280 °C and a total mass loss of about 81% at 800 °C (Figure 2D). When compared with the other two modified fibers (i.e., CellReg/GTAC_1.5 and CellReg/GTAC_3.0), this single step degradation profile is indicative of a higher DS and, hence, of the complete decomposition of the cationic cellulose, as noted by Yan et al. [36].
Overall, these results clearly prove that the modified regenerated cellulose samples have lower thermal stability than the non-modified regenerated cellulose fibers, which agrees with the data reported for cationic cellulose derivatives [25,36,52]. Despite the smaller thermal stability, the modified regenerated cellulose samples are still thermally stable up to about 220 °C, which demonstrates that these cationic fibers can, if necessary, withstand temperatures below 100 °C during textile manufacturing processes [10,12].

3.4. Dye Uptake Tests

The goal of the modification of the regenerated cellulose fibers via cationization reaction was to improve their dye uptake capacity envisioning their application as alternative textile fibers. Therefore, dye uptake tests were performed using the dischargeable diazo dye Remazol Brilliant Orange 3R (Reactive Orange 16), which is a water soluble reactive anionic dye that fixates into the fibers, thus enduring harsher conditions and creating a more permanent color [53]. Noteworthy from an environmental impact perspective is the fact that this reactive dye can be biologically degraded by using, for instance, the bacterium Bacillus stratosphericus SCA1007 [54]. These dye uptake tests will deliver information on the dye exhaustion (E) and dye fixation (F), which are, respectively, the amount of dye that is taken up by the fibers, and the amount of dye that is fixated into the fibers [31,53].
Figure 4A shows the dye exhaustion and dye fixation data obtained for the non-modified and modified regenerated cellulose. As expected, the sample that shows the lowest dye exhaustion and dye fixation values is the non-modified regenerated cellulose (CellReg). This means that 66.8% ± 3.4% (E) of the total amount of dye was taken up by the fibers (and concomitantly ca. 33.2% remained in the dyebath solution), of which only 45.5% ± 5.0% (F) was fixated into the CellReg fibers. When compared with the literature, these values are lower than those obtained by Wang et al. [20] for cotton fibers dyed with Remazol Brilliant Orange 3R (E = 71.6%, F = 74.9%), by Shu et al. [55] for cotton fabrics (176 g m−2) dyed with Reactive Orange 16 (F = 63.1% ± 1.5%) and by Björquist et al. [23] for regenerated cellulose fibers from cotton waste pulp dyed with Levafix® Brilliant Blue E-BRA Macrolat reactive dye (E≈ 96%).
Concerning the cationized regenerated cellulose, all three samples exhibited higher dye exhaustion and dye fixation abilities than CellReg, although the values of these two parameters for the three modified samples are not significantly different, reaching what seems to be maxima values of 89.3% ± 0.9% (E) and 80.6% ± 1.3% (F) for the CellReg/GTAC_1.5 (Figure 4A). This implies that 89.3% of the total amount of dye was taken up by the cationic fibers (with ca. 10.7% remaining in the dyebath), of which 80.6% (F) was fixated to the CellReg/GTAC_1.5 fibers. Therefore, the cationization of the regenerated cellulose fibers improved both the dye exhaustion and dye fixation because this anionic reactive dye can simultaneously interact with the hydroxyl and the tetraalkylammonium groups of the modified cellulose samples [21]. Furthermore, it is important to mention that CellReg/GTAC_1.5 generated the maxima values of dye exhaustion and dye fixation, despite displaying the lowest DS value, probably because of the conjunction of its fibrillar structure, greater surface area and higher availability of the surface cationic groups when compared with the other two modified samples with a film-like morphology.
If one compares these results with literature data, it is clear that they are superior to those achieved by Wang et al. [20] for cationic cotton fibers, where only 84.4% of the reactive dye (Remazol Brilliant Orange 3R) was exhausted and 63.5% was fixated. Khatri et al. [56] showed that, when compared with the non-modified cellulose nanofibers, the cationization of electrospun cellulose nanofibers with GTAC generated higher dye fixation values independently of the reactive dye used, namely C.I. Reactive Black 5 (F = 85–91%), C.I. Reactive Red 195 (F = 85–89%) and C.I. Reactive Blue 19 (F = 81–82%). Furthermore, Correia et al. [21] extensively studied the effect of four different (poly)electrolytes containing quaternary ammonium groups, including GTAC, on the dyeing process of cotton with the reactive red 195 dye. The authors concluded that the cationization of cotton with GTAC was the most advantageous in terms of dye fixation and exhaustion since it generated the lowest mass of residual dye in both exhaustion and washing baths [21]. More recently, Wang et al. [57] reported a dye fixation of 95% for cationic cotton fabrics manufactured via a single-step pad-steam cationization and dyeing process of plain-woven pure cotton fabric (126 g m−2) with C.I. Reactive Blue 5, which is higher than the value obtained in the present study.
The dye exhaustion and fixation data are further corroborated by the macroscopic appearance (Figure 4B), as well as the colorimetric coordinates (Table 2) of CellReg, CellReg/GTAC_1.5, CellReg/GTAC_3.0 and CellReg/GTAC_4.5 after the dye uptake tests. As portrayed in Figure 4B, the color of the non-modified fibers after the dyeing tests is much less intense than those of the modified fiber samples, and the color intensities of the modified fibers appear similar among them, which validates the fact that the values of the dye exhaustion and dye fixation of the modified fiber samples are not significantly different among them (Figure 4A). The optical micrographs of the cellulose samples after dyeing (Figure 4C) reveal that the dyeing process with a reactive dye did not affect their morphology since their micrographs are analogous to those portrayed in Figure 3A, the only difference being in the orange/reddish color of the samples after dyeing.
The colorimetric coordinates of the fiber samples before dyeing (Table 2) show that CellReg exhibits the highest values of L* (83.9 ± 2.0, lightness), a* (2.3 ± 0.3, redness) and b* (17.5 ± 1.0, yellowness) coordinates; and that their combination points to straw colored fibers, in accordance with the macroscopic aspect of these unbleached regenerated pulp fibers (Figure 1A) and similarly to data reported for non-regenerated unbleached kraft pulps of Eucalyptus globulus [58]. Regarding the modified samples before dyeing (Table 2), there is a negative contribution to the a* coordinate (red (+a*) to green (−a*)) and a reduction of the b* (yellowness/blueness) and L* (white (100) to black (0)) coordinates with the cationization of the regenerated cellulose with GTAC. In terms of total color difference from the CellReg sample, this parameter increased with the rising DS of the modified fibers, in line with the macroscopic appearance of the fibers displayed in Figure 1B. The ISO brightness values of the non-modified and modified fibers are significantly different (p < 0.0001) and, when compared with CellReg, the modified fibers present higher values except for the CellReg/GTAC_4.5. Moreover, there is a decrease in the ISO brightness of the cationic fibers with higher DS values, credited to their translucent aspect, which translates into a lower amount of reflectance of blue light, viz. lesser brightness [28].
After the dyeing uptake tests with the reactive dye, the colorimetric coordinates of the non-modified and modified regenerated cellulose fibers changed for superior values of the coordinate +a* (redness) as outlined in Table 2, which was expected given the orange/red color of the reactive dye (Remazol Brilliant Orange 3R or Reactive Orange 16). The same trend was disclosed, for instance, by Correia et al. [21] for cotton and cationic cotton fibers dyed with Reactive Red 195. The dyed CellReg is the fiber sample with the highest values of the coordinates L* and b*, and ISO brightness, which concurs with their lowest dye exhaustion and dye fixation values (Figure 4A) as well as their visual aspect (Figure 4B). When comparing the dyed non-modified with the dyed modified regenerated cellulose, it is evident that the values of lightness (L*) diminished with increasing DS values, except for CellReg/GTAC_4.5 whose value is not significantly different from that of CellReg/GTAC_3.0. This means that, after dyeing, the CellReg/GTAC_3.0 and CellReg/GTAC_4.5 samples seem to have a darker color and less brightness than the other samples. Moreover, the total color difference decreased with the increase in DS, which concurs with the higher values of dye exhaustion and fixation of CellReg/GTAC_1.5 (Table 2).
Worth noting here is the fact that, despite the similar dye exhaustion and dye fixation data between the modified cellulose samples (not statistically different, Figure 4A), it is perceptible that the colorimetric coordinates slightly differ among them, particularly for the CellReg/GTAC_1.5 whose coordinates (L*, a*, b*) are statistically different. Since the objective of the present study was to adjust target surface properties without altering the bulk properties of the fibers, the CellReg/GTAC_1.5 sample is indeed the most promising one in terms of retaining the fiber morphology, while having adequate surface charge, surface wettability and dye uptake capacity.

4. Conclusions

The present study investigated the successful heterogenous modification of regenerated wood pulp cellulose fibers (unbleached staple fiber produced using MTBD-acetate as the solvent) via the reaction with a tetraalkylammonium derivative with the aim of improving dye uptake. The grafting of cationic pending groups generated modified cellulose fibers with DS values between 0.13 and 0.33, which translated into samples with distinct morphologies, surface wettability values and thermal stability temperatures up to 220 °C. Additionally, the GTAC modified cellulose exhibits higher dye exhaustion and dye fixation values than the non-modified regenerated cellulose, reaching maxima values of 89.3% ± 0.9% and 80.6% ± 1.3%, respectively, for the fibers with a DS value of 0.13. In fact, the modified cellulose with the lower DS value is the one that attained the best compromise between dyeing properties and the preservation of the bulk properties of the fibers. In view of these results, regenerated wood pulp fibers from the pulp and paper industry can potentially be utilized as textile fibers with good dye uptake capacity that may possibly provide an alternative for dyeing treatments.

Author Contributions

Conceptualization, A.J.D.S. and C.V.; investigation, B.P., F.S.M. and B.F.A.V.; resources, N.V.W. and T.K.; data curation, B.P., F.S.M., B.F.A.V. and C.V.; writing—original draft preparation, C.V.; writing—review and editing, B.P., F.S.M., B.F.A.V., N.V.W., T.K., C.S.R.F., A.J.D.S. and C.V.; supervision, A.J.D.S. and C.V.; project administration, A.J.D.S. and C.V.; funding acquisition, N.V.W., T.K., C.S.R.F., A.J.D.S. and C.V. All authors have read and agreed to the published version of the manuscript.

Funding

This work was developed within the scope of the project GRETE—Green Chemicals and Technologies for the Wood-to-textile Value Chain, funded from the Bio-Based Industries Joint Undertaking under the European Union’s Horizon 2020 research and innovation programme under grant agreement No 837527—GRETE—H2020-BBI-JTI-2018, project CICECO—Aveiro Institute of Materials, UIDB/50011/2020, UIDP/50011/2020 & LA/P/0006/2020, financed by national funds through the FCT/MCTES (PIDDAC) and project Cell4Janus (PTDC/BII-BIO/1901/2021), financially supported by national funds (OE), through FCT/MCTES. FCT is also acknowledged for the research contracts under Scientific Employment Stimulus to C.S.R.F. (CEECIND/00464/2017) and C.V. (CEECIND/00263/2018 and 2021.01571.CEECIND).

Conflicts of Interest

The authors declare no conflict of interest.

References

  1. Felgueiras, C.; Azoia, N.G.; Gonçalves, C.; Gama, M.; Dourado, F. Trends on the Cellulose-Based Textiles: Raw Materials and Technologies. Front. Bioeng. Biotechnol. 2021, 9, 608826. [Google Scholar] [CrossRef] [PubMed]
  2. United Nations Transforming Our World: The 2030 Agenda for Sustainable Development. Available online: https://sdgs.un.org/2030agenda (accessed on 3 June 2022).
  3. Stone, C.; Windsor, F.M.; Munday, M.; Durance, I. Natural or synthetic–How global trends in textile usage threaten freshwater environments. Sci. Total Environ. 2020, 718, 134689. [Google Scholar] [CrossRef] [PubMed]
  4. Cherrett, N.; Barrett, J.; Clemett, A.; Chadwick, M.; Chadwick, M.J. Ecological Footprint and Water Analysis of Cotton, Hemp and Polyester; Stockholm Environment Institute: Stockholm, Sweden, 2022; ISBN 9197523828. [Google Scholar]
  5. Henry, B.; Laitala, K.; Grimstad, I. Microfibres from apparel and home textiles: Prospects for including microplastics in environmental sustainability assessment. Sci. Total Environ. 2019, 652, 483–494. [Google Scholar] [CrossRef]
  6. EPRS|European Parliamentary Research Service. Environmental Impact of the Textile and Clothing Industry. Available online: https://www.europarl.europa.eu/RegData/etudes/BRIE/2019/633143/EPRS_BRI(2019)633143_EN.pdf (accessed on 3 June 2022).
  7. Serra, A.; Serra-Parareda, F.; Vilaseca, F.; Delgado-Aguilar, M.; Espinach, F.X.; Tarrés, Q. Exploring the potential of cotton industry byproducts in the plastic composite sector: Macro and micromechanics study of the flexural modulus. Materials 2021, 14, 4787. [Google Scholar] [CrossRef]
  8. Santiago, A.S.; Neto, C.P.; Vilela, C. Impact of effective alkali and sulfide profiling on Eucalyptus globulus kraft pulping. Selectivity of the impregnation phase and its effect on final pulping results. J. Chem. Technol. Biotechnol. 2008, 83, 242–251. [Google Scholar] [CrossRef]
  9. Valente, B.F.A.; Silvestre, A.J.D.; Neto, C.P.; Vilela, C.; Freire, C.S.R. Effect of the micronization of pulp fibers on the properties of green composites. Molecules 2021, 26, 5594. [Google Scholar] [CrossRef]
  10. Salleh, K.M.; Armir, N.A.Z.; Mazlan, N.S.N.; Wang, C.; Zakaria, S. Cellulose and its derivatives in textiles: Primitive application to current trend. In Fundamentals of Natural Fibres and Textiles (The Textile Institute Book Series); Mondal, M.I.H., Ed.; Woodhead Publishing: Sawston, UK; Elsevier: Amsterdam, The Netherlands, 2021; pp. 33–63. [Google Scholar]
  11. Carvalho, J.P.F.; Silva, A.C.Q.; Silvestre, A.J.D.; Freire, C.S.R.; Vilela, C. Spherical Cellulose Micro and Nanoparticles: A Review of Recent Developments and Applications. Nanomaterials 2021, 11, 2744. [Google Scholar] [CrossRef]
  12. Silva, A.C.Q.; Silvestre, A.J.D.; Freire, C.S.R.; Vilela, C. Modification of textiles for functional applications. In Fundamentals of Natural Fibres and Textiles (The Textile Institute Book Series); Mondal, M.I.H., Ed.; Woodhead Publishing: Sawston, UK; Elsevier: Amsterdam, The Netherlands, 2021; pp. 303–365. ISBN 9780128214831. [Google Scholar]
  13. Elsayed, S.; Hummel, M.; Sawada, D.; Guizani, C.; Rissanen, M.; Sixta, H. Superbase-based protic ionic liquids for cellulose filament spinning. Cellulose 2021, 28, 533–547. [Google Scholar] [CrossRef]
  14. Elsayed, S.; Hellsten, S.; Guizani, C.; Witos, J.; Rissanen, M.; Rantama, A.H.; Varis, P.; Wiedmer, S.K.; Sixta, H. Recycling of Superbase-Based Ionic Liquid Solvents for the Production of Textile-Grade Regenerated Cellulose Fibers in the Lyocell Process. ACS Sustain. Chem. Eng. 2020, 8, 14217–14227. [Google Scholar] [CrossRef]
  15. Martins, M.A.R.; Sosa, F.H.B.; Kilpeläinen, I.; Coutinho, J.A.P. Physico-chemical characterization of aqueous solutions of superbase ionic liquids with cellulose dissolution capability. Fluid Phase Equilib. 2022, 556, 113414. [Google Scholar] [CrossRef]
  16. Xia, Z.; Li, J.; Zhang, J.; Zhang, X. Processing and valorization of cellulose, lignin and lignocellulose using ionic liquids. J. Bioresour. Bioprod. 2020, 5, 79–95. [Google Scholar] [CrossRef]
  17. Ioncell® Technology. Available online: https://ioncell.fi/ (accessed on 6 June 2022).
  18. El-wakil, N.A.; Hassan, M.L. Structural Changes of Regenerated Cellulose Dissolved in FeTNa, NaOH/thiourea, and NMMO Systems. J. Appl. Polym. Sci. 2008, 109, 2862–2871. [Google Scholar] [CrossRef]
  19. Ho, T.T.T.; Zimmermann, T.; Hauert, R.; Caseri, W. Preparation and characterization of cationic nanofibrillated cellulose from etherification and high-shear disintegration processes. Cellulose 2011, 18, 1391–1406. [Google Scholar] [CrossRef]
  20. Wang, H.; Lewis, D.M. Chemical modification of cotton to improve fibre dyeability. Color. Technol. 2002, 118, 159–168. [Google Scholar] [CrossRef]
  21. Correia, J.; Oliveira, F.R.; Valle, R.d.C.S.C.; Valle, J.A.B. Preparation of cationic cotton through reaction with different polyelectrolytes. Cellulose 2021, 28, 11679–11700. [Google Scholar] [CrossRef] [PubMed]
  22. Chattopadhyay, D.P.; Surati, D. Enhancing Dyeability and Antibacterial Feature of Cotton Through Nano-chitosan Attachment. J. Inst. Eng. Ser. E 2020, 101, 175–184. [Google Scholar] [CrossRef]
  23. Björquist, S.; Aronsson, J.; Henriksson, G.; Persson, A. Textile qualities of regenerated cellulose fibers from cotton waste pulp. Text. Res. J. 2018, 88, 2485–2492. [Google Scholar] [CrossRef]
  24. Prado, H.J.; Matulewicz, M.C. Cationization of polysaccharides: A path to greener derivatives with many industrial applications. Eur. Polym. J. 2014, 52, 53–75. [Google Scholar] [CrossRef]
  25. Odabas, N.; Amer, H.; Henniges, U.; Potthast, A.; Rosenau, T. A comparison of methods to quantify cationization of cellulosic pulps. J. Wood Chem. Technol. 2017, 37, 136–147. [Google Scholar] [CrossRef]
  26. Song, Y.; Wang, H.; Zeng, X.; Sun, Y.; Zhang, X.; Zhou, J.; Zhang, L. Effect of Molecular Weight and Degree of Substitution of Quaternized Cellulose on the Efficiency of Gene Transfection. Bioconjug. Chem. 2010, 21, 1271–1279. [Google Scholar] [CrossRef]
  27. Salajkov, M.; Berglund, L.A.; Zhou, Q. Hydrophobic cellulose nanocrystals modified with quaternary ammonium salts. J. Mater. Chem. 2012, 22, 19798–19805. [Google Scholar] [CrossRef]
  28. ISO 2470-1:2016; Paper, Board and Pulps—Measurement of Diffuse Blue Reflectance Factor—Part 1: Indoor Daylight Conditions (ISO brightness). International Organization for Standardization: Geneva, Switzerland, 2016.
  29. Vilela, C.; Pinto, R.J.B.; Coelho, J.; Domingues, M.R.M.; Daina, S.; Sadocco, P.; Santos, S.A.O.; Freire, C.S.R. Bioactive chitosan/ellagic acid films with UV-light protection for active food packaging. Food Hydrocoll. 2017, 73, 120–128. [Google Scholar] [CrossRef]
  30. Bastante, C.C.; Silva, N.H.C.S.; Cardoso, L.C.; Serrano, C.M.; Martínez de la Ossa, E.J.; Freire, C.S.R.; Vilela, C. Biobased films of nanocellulose and mango leaf extract for active food packaging: Supercritical impregnation versus solvent casting. Food Hydrocoll. 2021, 117, 106709. [Google Scholar] [CrossRef]
  31. Hossain, M.Y.; Sarker, S.; Zakaria, M.; Islam, M.R.; Fayazi, R.U.; Acharjya, S. Influence of Process Parameters on Exhaustion, Fixation and Color Strength in Dyeing of Cellulose Fiber with Reactive Dye. Int. J. Text. Sci. Eng. 2020, 3, 127. [Google Scholar] [CrossRef]
  32. Odabas, N.; Amer, H.; Bacher, M.; Henniges, U.; Potthast, A.; Rosenau, T. Properties of Cellulosic Material after Cationization in Different Solvents. ACS Sustain. Chem. Eng. 2016, 4, 2295–2301. [Google Scholar] [CrossRef]
  33. Courtenay, J.C.; Ramalhete, S.; Skuze, W.J.; Soni, R.; MKhimyak, Y.Z.; Edler, K.J.; Scott, J.L. Unravelling cationic cellulose nanofibril hydrogel structure: NMR spectroscopy and small angle neutron scattering analyses. Soft Matter. 2018, 21, 255–263. [Google Scholar] [CrossRef] [PubMed]
  34. de la Motte, H.; Hasani, M.; Brelid, H.; Westman, G. Molecular characterization of hydrolyzed cationized nanocrystalline cellulose, cotton cellulose and softwood kraft pulp using high resolution 1D and 2D NMR. Carbohydr. Polym. 2011, 85, 738–746. [Google Scholar] [CrossRef]
  35. Olszewska, A.; Eronen, P.; Johansson, L.-S.; Malho, J.-M.; Ankerfors, M.; Lindstrom, T.; Ruokolainen, J.; Laine, J.; Osterberg, M. The behaviour of cationic NanoFibrillar Cellulose in aqueous media. Cellulose 2011, 18, 1213–1226. [Google Scholar] [CrossRef]
  36. Yan, L.; Tao, H.; Bangal, P.R.; Chemistry, P. Synthesis and Flocculation Behavior of Cationic Cellulose Prepared in a NaOH/Urea Aqueous Solution. Clean 2009, 37, 39–44. [Google Scholar] [CrossRef]
  37. Foster, E.J.; Moon, R.J.; Agarwal, U.P.; Bortner, M.J.; Bras, J.; Camarero-Espinosa, S.; Chan, K.J.; Clift, M.J.D.; Cranston, E.D.; Eichhorn, S.J.; et al. Current characterization methods for cellulose nanomaterials. Chem. Soc. Rev. 2018, 47, 2609–2679. [Google Scholar] [CrossRef] [Green Version]
  38. Vilela, C.; Silva, A.C.Q.; Domingues, E.M.; Gonçalves, G.; Martins, M.A.; Figueiredo, F.M.L.; Santos, S.A.O.; Freire, C.S.R. Conductive polysaccharides-based proton-exchange membranes for fuel cell applications: The case of bacterial cellulose and fucoidan. Carbohydr. Polym. 2020, 230, 115604. [Google Scholar] [CrossRef] [PubMed]
  39. Pang, J.-H.; Liu, X.; Wu, M.; Wu, Y.-Y.; Zhang, X.-M.; Sun, R.-C. Fabrication and Characterization of Regenerated Cellulose Films Using Different Ionic Liquids. J. Spectrosc. 2014, 2014, 214057. [Google Scholar] [CrossRef]
  40. Solin, K.; Beaumont, M.; Rosenfeldt, S.; Orelma, H.; Borghei, M.; Bacher, M.; Opietnik, M.; Rojas, O.J. Self-Assembly of Soft Cellulose Nanospheres into Colloidal Gel Layers with Enhanced Protein Adsorption Capability for Next-Generation Immunoassays. Small 2020, 16, 2004702. [Google Scholar] [CrossRef]
  41. Vilela, C.; Sousa, N.; Pinto, R.J.B.; Silvestre, A.J.D.; Figueiredo, F.M.L.; Freire, C.S.R. Exploiting poly(ionic liquids) and nanocellulose for the development of bio-based anion-exchange membranes. Biomass Bioenergy 2017, 100, 116–125. [Google Scholar] [CrossRef]
  42. Vilela, C.; Moreirinha, C.; Almeida, A.; Silvestre, A.J.D.; Freire, C.S.R. Zwitterionic nanocellulose-based membranes for organic dye removal. Materials 2019, 12, 1404. [Google Scholar] [CrossRef] [PubMed]
  43. Vilela, C.; Moreirinha, C.; Domingues, E.M.; Figueiredo, F.M.L.; Almeida, A.; Freire, C.S.R. Antimicrobial and conductive nanocellulose-based films for active and intelligent food packaging. Nanomaterials 2019, 9, 980. [Google Scholar] [CrossRef] [PubMed]
  44. Onwukamike, K.N.; Tassaing, T.; Grelier, S.; Grau, E.; Cramail, H.; Meier, M.A.R. Detailed Understanding of the DBU/CO2 Switchable Solvent System for Cellulose Solubilization and Derivatization. ACS Sustain. Chem. Eng. 2018, 6, 1496–1503. [Google Scholar] [CrossRef]
  45. Fernandes, S.C.M.; Oliveira, L.; Freire, C.S.R.; Silvestre, A.J.D.; Pascoal Neto, C.; Gandini, A.; Desbrieres, J. Novel transparent nanocomposite films based on chitosan and bacterial cellulose. Green Chem. 2009, 11, 2023–2029. [Google Scholar] [CrossRef]
  46. Stana-Kleinschek, K.; Kreze, T.; Ribitsch, V.; Strnad, S. Reactivity and electrokinetical properties of different types of regenerated cellulose fibres. Colloids Surfaces A Physicochem. Eng. Asp. 2001, 195, 275–284. [Google Scholar] [CrossRef]
  47. Manian, A.P.; Jaturapiree, A.; Bechtold, T. Salt sorption on regenerated cellulosic fibers: Electrokinetic measurements. Cellulose 2018, 25, 3307–3314. [Google Scholar] [CrossRef] [Green Version]
  48. Payerl, C.; Bračič, M.; Zankel, A.; Fischer, W.J.; Kaschowitz, M.; Fröhlich, E.; Kargl, R.; Stelzer, F.; Spirk, S. Nonspecific protein adsorption on cationically modified Lyocell fibers monitored by zeta potential measurements. Carbohydr. Polym. 2017, 164, 49–56. [Google Scholar] [CrossRef]
  49. Wei, D.W.; Wei, H.; Gauthier, A.C.; Song, J.; Jin, Y.; Xiao, H. Superhydrophobic modification of cellulose and cotton textiles: Methodologies and applications. J. Bioresour. Bioprod. 2020, 5, 1–15. [Google Scholar] [CrossRef]
  50. Pajorova, J.; Skogberg, A.; Hadraba, D.; Broz, A.; Travnickova, M.; Zikmundova, M.; Honkanen, M.; Hannula, M.; Lahtinen, P.; Tomkova, M.; et al. Cellulose Mesh with Charged Nanocellulose Coatings as a Promising Carrier of Skin and Stem Cells for Regenerative Applications. Biomacromolecules 2020, 21, 4857–4870. [Google Scholar] [CrossRef]
  51. Skogberg, A.; Ma, A.; Metta, M.; Lahtinen, P.; Kallio, P. Cellulose Nanofiber Alignment Using Evaporation-Induced Droplet-Casting, and Cell Alignment on Aligned Nanocellulose Surfaces. Biomacromolecules 2017, 18, 3936–3953. [Google Scholar] [CrossRef]
  52. Li, G.; Fu, Y.; Shao, Z.; Zhang, F.; Qin, M. Preparing Cationic Cellulose Derivative in NaOH/Urea Aqueous Solution and its Performance as Filler Modifier. BioResources 2015, 10, 7782–7794. [Google Scholar] [CrossRef]
  53. Agarwal, J. Sonia Dyes and dyeing processes for natural textiles and their key sustainability issues. In Fundamentals of Natural Fibres and Textiles (The Textile Institute Book Series); Mondal, M.I.H., Ed.; Woodhead Publishing: Sawston, UK; Elsevier: Amsterdam, The Netherlands, 2021; pp. 339–472. [Google Scholar]
  54. Akansha, K.; Yadav, A.N.; Manish, K.; Chakraborty, D.; Sachan, S.G. Decolorization and degradation of reactive orange 16 by Bacillus stratosphericus SCA1007. Folia Microbiol. 2022, 67, 91–102. [Google Scholar] [CrossRef]
  55. Shu, D.; Fang, K.; Liu, X.; Cai, Y.; An, F. High Dye Fixation Pad-Steam Dyeing of Cotton Fabrics with Reactive Dyes Based on Hydrophobic Effect. J. Nat. Fibers 2020, 17, 665–675. [Google Scholar] [CrossRef]
  56. Khatri, Z.; Mayakrishnan, G.; Hirata, Y.; Wei, K.; Kim, I. Cationic-cellulose nanofibers: Preparation and dyeability with anionic reactive dyes for apparel application. Carbohydr. Polym. 2013, 91, 434–443. [Google Scholar] [CrossRef] [PubMed]
  57. Wang, L.; Xie, G.; Mi, X.; Kang, X.; Zhu, Q.; Yu, Z. A single-step pad-steam cationisation and dyeing process for improving dyeing properties of cotton fabrics. Color. Technol. 2022, 1–13. [Google Scholar] [CrossRef]
  58. Gominho, J.; Lopes, C.; Lourenço, A.; Simões, R.; Pereira, H. Eucalyptus globulus stumpwood as a raw material for pulping. BioResources 2014, 9, 4038–4049. [Google Scholar] [CrossRef] [Green Version]
Figure 1. (A) Reaction scheme of the cationization of cellulose with glycidyltrimethylammonium chloride (GTAC), and (B) digital photographs of the non-modified and modified regenerated cellulose fiber samples: CellReg, CellReg/GTAC_1.5, CellReg/GTAC_3.0 and CellReg/GTAC_4.5.
Polysaccharides 03 00036 g001
Figure 2. (A) FTIR-ATR spectra (vibrational modes: ν = stretching and δ = bending), (B) 13C CP/MAS NMR spectra, (C) XRD diffractograms and (D) TGA thermograms (up) and derivative (dTG) curves (down) of the non-modified and modified regenerated cellulose samples: CellReg, CellReg/GTAC_1.5, CellReg/GTAC_3.0 and CellReg/GTAC_4.5.
Polysaccharides 03 00036 g002
Figure 3. (A) Optical micrographs and (B) SEM micrographs of the non-modified and modified regenerated cellulose samples: CellReg, CellReg/GTAC_1.5, CellReg/GTAC_3.0 and CellReg/GTAC_4.5.
Polysaccharides 03 00036 g003
Figure 4. (A) Dye exhaustion and dye fixation for the fiber samples: CellReg, CellReg/GTAC_1.5, CellReg/GTAC_3.0 and CellReg/GTAC_4.5 (the symbol * denotes the means with a significant difference from the CellReg sample at p < 0.05), (B) digital photographs and (C) optical micrographs of the fiber samples after the dyeing uptake test.
Polysaccharides 03 00036 g004
Table 1. List of the non-modified and modified regenerated cellulose samples with the corresponding ratio of GTAC to anhydroglucose units (AGU), degree of substitution (DS), zeta potential and contact angle (with water) 1.
SampleRatio of GTAC/AGUDSZeta Potential (mV)Contact Angle (°)
CellReg–15.4 ± 5.0 a50.7 ± 6.3 a
CellReg/GTAC_1.51.5:10.13 ± 0.004 a8.4 ± 3.9 b65.7 ± 3.4 b
CellReg/GTAC_3.03.0:10.24 ± 0.006 b15.2 ± 3.2 c71.5 ± 2.2 c
CellReg/GTAC_4.54.5:10.33 ± 0.002 c26.9 ± 5.5 d82.5 ± 3.8 d
1 The values of DS, zeta potential and contact angle are expressed as means ± SD; the values in the same column followed by distinct letters (a, b, c, d) are significantly different (at p < 0.05) as determined from the statistical analysis.
Table 2. Colorimetric coordinates and brightness of the CellReg, CellReg/GTAC_1.5, CellReg/GTAC_3.0 and CellReg/GTAC_4.5 before and after the dye uptake tests 1.
SampleL*a*b*ΔEBrightness (%)
Before dyeingCellReg83.9 ± 2.0 a2.3 ± 0.3 a17.5 ± 1.0 a47.3 ± 3.4 a
CellReg/GTAC_1.586.4 ± 2.6 a−0.5 ± 0.1 b8.6 ± 0.6 b9.761.7 ± 4.4 b
CellReg/GTAC_3.081.1 ± 2.5 b−0.7 ± 0.1 b7.7 ± 1.5 b10.751.7 ± 3.0 c
CellReg/GTAC_4.576.0 ± 2.4 c−0.2 ± 0.1 c3.8 ± 0.6 c16.022.1 ± 2.1 d
After dyeingCellReg70.1 ± 1.4 a27.6 ± 0.7 a16.5 ± 0.5 a28.028.4 ± 0.4 a
CellReg/GTAC_1.557.1 ± 1.7 b34.3 ± 1.0 b14.6 ± 0.7 b45.916.7 ± 0.8 b
CellReg/GTAC_3.045.9 ± 1.7 c27.4 ± 1.8 a8.6 ± 1.2 c45.111.3 ± 0.7 c
CellReg/GTAC_4.543.5 ± 1.6 c27.7 ± 2.1 a10.0 ± 1.2 c43.19.6 ± 0.6 d
1 All values are expressed as means ± SD, and the values in the same column followed by distinct letters (a, b, c, d) are significantly different (at p < 0.0001) as determined from the statistical analysis.
Publisher’s Note: MDPI stays neutral with regard to jurisdictional claims in published maps and institutional affiliations.

