Article

Characterising Residual Limb Morphology and Prosthetic Socket Design Based on Expert Clinician Practice

1
Faculty of Engineering & Physical Science, University of Southampton, Southampton SO17 1BJ, UK
2
Institute for Life Sciences, University of Southampton, Southampton SO17 1BJ, UK
3
Radii Devices Ltd., Bristol BS1 6QH, UK
4
Opcare Ltd., Abingdon OX14 1RL, UK
*
Author to whom correspondence should be addressed.
A.D. and L.D. are joint first authors.
Prosthesis 2021, 3(4), 280-299; https://doi.org/10.3390/prosthesis3040027
Submission received: 26 August 2021 / Revised: 9 September 2021 / Accepted: 10 September 2021 / Published: 23 September 2021
(This article belongs to the Section Orthopedics and Rehabilitation)

Abstract

:
Functional, comfortable prosthetic limbs depend on personalised sockets, currently designed using an iterative, expert-led process, which can be expensive and inconvenient. Computer-aided design and manufacturing (CAD/CAM) offers enhanced repeatability, but far more use could be made from clinicians’ extensive digital design records. Knowledge-based socket design using smart templates could collate successful design features and tailor them to a new patient. Based on 67 residual limb scans and corresponding sockets, this paper develops a method of objectively analysing personalised design approaches by expert prosthetists, using machine learning: principal component analysis (PCA) to extract key categories in anatomic and surgical variation, and k-means clustering to identify local ‘rectification’ design features. Rectification patterns representing Total Surface Bearing and Patella Tendon Bearing design philosophies are identified automatically by PCA, which reveals trends in socket design choice for different limb shapes that match clinical guidelines. Expert design practice is quantified by measuring the size of local rectifications identified by k-means clustering. Implementing smart templates based on these trends requires clinical assessment by prosthetists and does not substitute training. This study provides methods for population-based socket design analysis, and example data, which will support developments in CAD/CAM clinical practice and accuracy of biomechanics research.

1. Introduction

Prosthetic socket design and fitting are crucial for providing comfortable, stable and functional prostheses that match the shape and biomechanical characteristics of the individual residual limb, distributing the pressure created by ambulatory loading in ways the limb can tolerate without tissue damage [1]. Residual limb shapes, sizes and tissue tolerances vary significantly across the population, so understanding the design objectives to best suit an individual is complex. Conventional approaches to socket fitting rely heavily on the skills of prosthetists, who work from limited objective data. There is a need for evidence to support their design choices so that they can optimise the fit for the individual, and at present this is a highly iterative process [2,3]. Some iteration will always be required to accommodate limb volume and shape changes, especially in the first year after amputation, but this project’s goal is to reduce the iteration arising from trial and error.

1.1. Current Clinical Practice in Residual Limb Shape Capture and Prosthetic Socket Design

There is a range of approaches for capturing the shape of a residual limb and generating a corresponding socket design, with shape capture and design often overlapping [4]. Hands-on methods include capturing the limb shape by plaster casting, creating a positive mould, and performing a range of shape modifications known as rectification (carving material off the mould, or building material up), so that a vacuum-formed ‘draped’ or composite laminated socket has a desired pattern of limb–prosthesis interface load transfer. The two most common approaches at the transtibial level are known as Patellar Tendon Bearing (PTB) [5] and Total Surface Bearing (TSB) [6]. PTB aims to preferentially load the tolerant tissue sites in the residual limb (including the patella tendon and fleshy zones either side of the anterior tibia and over the calf muscles), and offload more vulnerable sites (including the anterior and distal tibia, the fibula head, and residual limb distal tip). TSB sockets with elastomeric liners are intended to achieve more uniform load transfer across the limb surface, and thus avoid harmful pressure gradients.
Alternatively, several ‘hands-off’ shape capture methods are available, which aim to create uniform load transfer directly in response to the residual limb tissues’ compliance under load. Hydrostatic sockets (HS) are plaster cast over a silicone elastomer liner, non-weightbearing, with pressure applied through compressed air [7,8]. Pressure casting can also be performed weightbearing; the PCAST approach collects a plaster cast while suspending the limb inside a cylinder of water [9], and the CIR system uses sand casting under vacuum [10,11]. These methods are designed to reduce variation and reliance on manual dexterity, but may still require local shape modifications [4].
The family of computer-aided design and manufacturing (CAD/CAM) technologies are growing in use, typically to create sockets by the PTB and TSB concepts through digital modification of a 3D shape scan file, before carving a foam mould for socket fabrication. CAD/CAM requires the same clinician experience and skill as plaster methods, and gives the prosthetist full control over the design whilst preserving a digital record of individual designs, and their practice as a whole.

1.2. Towards More Evidence-Based Prosthetic Socket Design

Prosthetists have identified the need for support in evidence-based socket design to improve fit, and this remains part of the International Society for Prosthetics and Orthotics (ISPO) mission and ISPO 50 Charter [12]. Conventionally, this employs user feedback, though that is subjective and may be unreliable in people with vascular disease, whose tissues may be insensate. Technologists have worked towards offering feedback from limb–socket interface stress sensors [1,13] or predicting pressure, based on socket strain [14] and biomechanical simulations, commonly Finite Element Analysis (FEA) [15,16]. Despite recognising the need for these technologies over two decades ago, and recommendations for their clinical adoption [17,18], they have not yet reached common use and prosthetists still have the same request for technological support.
Socket design and fitting feedback technologies may face barriers to clinical adoption if they are not designed for users with conventional prosthetist-orthotist training, or if they add cost, complexity or inconvenience to the existing clinical pathway. For example, FEA is unlikely to be adopted if it requires expensive software licenses, a high-performance computer, expensive volume imaging (typically magnetic resonance imaging (MRI)), and a trained biomechanical engineer to build each patient’s model [16]. Furthermore, technologies are unlikely to face a warm reception from the clinical community if they are proposed to replace the need for skill and experience, or place any barrier between the clinician and their patient.

1.3. Machine Learning

Recently, researchers have proposed the use of machine learning (ML) to bridge the gap between hands-on socket design and complex software-supported alternatives [14,19,20,21,22,23,24]. Machine learning is a subset of techniques within Artificial Intelligence (AI), which involves the examination of datasets to find patterns. With ‘supervision’ to link these patterns to some known description or desired outcome, Machine Learning can be used for prediction or recommendation, and several applications have been considered for lower limb prosthetics.
Sewell et al. [14] used artificial neural networks (ANN) to predict socket–limb interface pressures from non-invasive strain measurements in the socket. Here, machine learning is unobstructive to the patient and clinician and potentially provides informative data, but imposes a workload in ‘training’ the ANN for each socket. Colombo et al. [19] proposed conducting automatic rectification design using an ANN based on a residual limb 3D scan, the person’s weight and desired activity level, and simple tissue ‘tonicity’–deformation relations. The alternative approach considered by biomechanical modellers is optimisation, whereby the socket design is adjusted in order to meet an objective such as minimising limb–socket interface pressure, or soft tissue strain [20,21,22]. Optimisation may be computationally expensive and require modelling knowledge, and ANNs remain limited by their large requirement for training data, which may not be available in prosthetics, and because they are often effectively black boxes for all except simple problems.
Instead, Expert Systems or Knowledge-Based Systems are proposed to be suited to the prosthetic socket design problem, as they involve learning to mechanise tasks which humans already perform well. Towards automating design, Sanz-Pena et al. [25] characterised rectification designs for scoliosis brace orthoses using landmarks, and Li et al. [23] proposed the Analytic Hierarchy Process decision approach to determine personalised socket design ‘compensations’ based on multiple prosthetists’ experience-based recommendations, and the residual limb’s characteristics.
Combining expert knowledge and physical measurements, Karamousadakis et al. [24] used a fuzzy-logic Inference Engine (IE) to convert socket pressure and shear stress measurements and expert prosthetists’ design rules into rectifications for a transfemoral socket design. Using more intuitive methods and incorporating expert knowledge in design might mean these concepts are closer to the objectives mentioned above, but it remains non-trivial to integrate them with current clinical workflows, without requiring additional modelling and data analysis or sensor complexity and expense.

1.4. Understanding Population and Design Variation in Current Prosthetics Workflows

The idea of learning from CAD/CAM prosthetic design practice was proposed in the 1990s. Lemaire and Johnson [26] presented a method for quantifying and comparing manual rectifications in the commercial CADVIEW CAD/CAM environment, and proposed using these data for education, improving clinical efficiency and consistency, and ensuring CAD/CAM is informed by best-practice manual approaches. Torres-Moreno et al. created a library of 27 reference shapes for transfemoral socket design in a CAD system, considering combinations of three brim sizes, lengths and profiles (skinny/sparse, average/moderate and fat/bulky), which could be modified interactively [27]. Later, Lemaire et al. [28] proposed using averaged modifications as a template for CAD/CAM rectifications, and demonstrated this approach produced sockets with equivalent function, comfort and overall satisfaction to manual methods. Recently, Fatone et al. have used a similar approach to produce templates for the transfemoral NW-FSIV socket [29]. Templates are not in common clinical use for CAD/CAM below-knee prosthetic socket design, though some clinicians use itemised workflows.
Improvements in 3D scanning technology and computational power and methods, as well as the increased collaborative work between data scientists and clinicians may now enable these early concepts to be enhanced. More formal population-based methods such as principal component analysis (PCA) employed for statistical shape modelling (SSM) can be used to reduce the dimensionality of anatomic variation, allowing identification of the principal, independent ‘modes’ of variation between individuals in a dataset. Population-based modelling approaches have extensive history in orthopaedics and musculoskeletal biomechanics, enabling machine learning to enhance the personalisation of models [30]. Understanding the behaviour of interventions or medical devices in a representative population sample is compulsory in preclinical trials, and is practical, low risk and low cost in an in silico clinical trial, sometimes using virtual participants. This population-based approach addresses the range of possible outcomes and avoids the risk of using near-average patient models that do not adequately represent the full range of results across a population [31]. This approach to capture variations in residual limb size and shape alone was used in unsupervised Machine Learning by Worsley et al. [32] to automatically classify residual limb shapes by their profile, and by Steer et al. [33] as a means of providing FEA predictions of limb–socket interface pressure in real time.

1.5. Motivation

We argue that it is inappropriate to fully automate the prosthetic socket design process, given the importance of clinical expertise to personalisation. However, we propose that there is benefit in pursuing evidence-based approaches to save time and iteration towards an acceptable socket for each person, learning from experts at each stage (Figure 1). Whilst there are proven conventions in socket design, there is no consensus on the targets for limb–socket rectification sizes, or their spatial pattern. There is also no measure of the clinically observed variability in these parameters. PCA and image analysis methods may allow extraction of quantitative descriptions of the key trends in prosthetic socket design as well as residual limb shape, which might be used alongside outcome measures in supervised Machine Learning processes to propose initial template designs for a new fitting.

1.6. Objectives

As a step towards enhancing prosthetic socket templates using expert clinician design data, this study aimed to evaluate methods of unsupervised machine learning to reverse-engineer expert clinical prosthetic socket design practice from a population of residual limb 3D scans and their matched prosthetic sockets:
  • The first objective was to investigate how population-based models of the residual limb anatomic shape and the prosthetic socket design might be built, the key requirements for each, and whether separate shape and design models might provide higher resolution for machine learning than a combined shape and design model. This compared methods of PCA (Section 2.2) and k-means clustering to identify local rectifications separately (Section 2.3).
  • The second objective was to inspect the data to characterise expert socket design following PTB and TSB approaches, and identify any general trends in socket design for particular residual limb shapes by descriptive statistics. Null hypotheses assumed that there was no difference between the limb shapes of individuals given PTB or TSB sockets, and that rectifications were more pronounced in PTB than TSB sockets.

2. Materials and Methods

2.1. Study Design, Approval and Raw Data

This study was approved by the University of Southampton’s institutional ethics and research governance office (ERGO, ID 53279), as a retrospective audit of clinical design practice. Inclusion criteria were age of 18 years or above, and transtibial amputation. Sixty-seven participants were selected by random sampling from clinical service provision in the UK. For each participant a pair of 3D surface mesh (.stl) files were provided, representing their residual limb scan and the corresponding clinician-designed mould shape for carving to produce a rectified socket. Researchers performing data processing were blinded to participant metadata.

2.2. PCA for Statistical Shape and Design Models

To describe individual limb shapes and socket designs, scan pairs were processed using the ampscan open source shape analysis toolbox [34] as a development of a previously published method for non-paired data [35]:
  • Right-sided shapes were mirrored.
  • The full set of socket shapes were aligned. A vertical superior–inferior translation was applied so that each shape’s patella tendon rectification was located at z = 0, and the shapes’ centroids at the patella tendon level were aligned in the medial–lateral and anterior–posterior axes (x = 0, y = 0). An internal–external rotation was applied so that the posterior trimline lay parallel with the coronal plane. The sockets’ abduction–adduction and flexion–extension were not changed from the CAD file.
  • Each limb shape was aligned with its corresponding socket. Shapes were aligned first by their centroids, then by automatic iterative-closest-point surface matching. Where the limb and socket scan shapes deviated considerably, manual alignment adjustments were made and checked by two experienced observers (Diment, Dickinson) to ensure prioritised medial–lateral, anterior–posterior and abduction–adduction alignment at the knee, flexion–extension and internal–external rotation alignment at the anterior tibia. Superior–inferior alignment referenced the anterior tibia and patella.
  • An HC Laplacian smoothing algorithm was applied to remove noise while preserving volume, and the socket shapes were cut at an approximated trimline.
  • A ~30,000 node mesh was registered onto each of the limb and socket meshes using elastic matching, to allow direct comparison in location of corresponding vertices.
  • For each socket, a field of surface vertex normal deviations representing their individual rectification design was calculated between each limb–socket pair, and plotted according to an accessible and community-standard colour map (Figure 2) [26].
Having identified individual limb shapes and socket rectification interventions, the subsequent process aimed to uncover generalised trends across the training population:
  • A statistical limb shape model (SLM) using the limb scans as a training dataset was produced by principal component analysis (PCA) using the scikit-learn toolbox [36]. The mesh files were each represented as a column vector:
    x = [ x 1 , y 1 , z 1 , , x m , y m , z m ] T
    where m represents the number of nodes in the baseline mesh and x ,   y and z are the vertex coordinates. A vector describing the mean limb shape was calculated by:
    x ¯ = 1 n i = 1 n x i
    where n represents the number of limbs in the training dataset. PCA by mean-centred Singular Value Decomposition allowed each limb shape to be described by:
    x = x ¯ + j = 1 c φ j d j
    where φ j are eigenvectors corresponding to the c principal components (PC) or ‘modes’ of the population’s shape variation, and d j is a vector of weighting coefficients associated with the eigenvectors to describe each shape’s deviation from mean.
  • A statistical design model (SDM) was produced in the same way, but using a column vector containing the socket–limb rectification values r at each vertex:
    x = [ r 1 , , r m ] T
  • Finally, a statistical limb shape and design model (SLDM) was produced in the same way, using a column vector of the limb shape and socket–limb rectification values:
    x = [ x 1 , y 1 , z 1 , r 1 , , x m , y m , z m , r m ] T
The 95% range of population variation in limb shape was estimated by plotting synthetic shapes with weighting coefficients at d j = ±   2 σ either side of the mean for each mode in turn, where σ represents the standard deviation of variation. Extremes of non-parametric socket design variation were plotted using the 2.5th and 97.5th percentile mode scores. Variations were interpreted by qualified clinicians (Hannett and Pearson).

2.3. K-Means Cluster Analysis of Localised Rectifications

A second methodology was developed to semi-automatically identify particular rectification features using a custom image recognition and classification tool, trained to identify PT, FH, MP, LP and DE rectifications. This involved:
  • Segmentation: fields of rectification, curvature, and combined rectification and curvature from the 67 training datasets (Figure 3a) were mapped onto 224 × 224-pixel 2D images (Figure 3b). K-means clustering was applied across all the images to generate up to 90 binarised pixel regions per image (Figure 3c).
  • Feature Extraction: The shape of each region was quantified using Histogram of Oriented Gradients (HOG) to detect the edges, followed by PCA to reduce the problem dimensionality, with the first 25 components retained (>95% of explained variance). In parallel, the location of each region was quantified by dividing the original region into a 7 × 7 grid, with the number of pixels for each region in each grid square calculated. Finally, the total pixel count was included. This resulted in 75 features for each region which were used for classification.
  • Classification: the features were fed into a second k-means clustering algorithm, which groups the regions generated from the image segmentation. To ensure all groups represented the same features, erroneous clustering was identified through comparison to the average of each cluster. Outliers were identified based upon pixel overlap with the average cluster. Any outlier regions were then moved to the cluster where they were closest to the average. The clustered groups were then visually inspected and related to rectifications of interest, for example, a group which contains the patella tendon bars across all input sockets (Figure 3d). The classified cluster images were then mapped back onto the corresponding 3D shape (Figure 3e).

2.4. Data Analysis

To address Objective 1, the validity of the three PCA models (limb shape model, socket design model, and combined model) was evaluated and compared. Compactness was assessed by finding the number of modes required to describe 95% of the training population’s variance. Generality was assessed by leave-one-out (LOO) testing to identify the required training dataset size. Each training population shape was left out of the statistical model generation and the mean shape recalculated. Its root mean squared error (RMSE) was calculated in comparison to the full model’s mean shape. A threshold RMSE of 1mm was defined, based on consistency measures of manual rectifications [37], plaster casting and 3D scanning in limb shape capture for socket design [38]. The k-means clustering process validity was measured by its accuracy in capturing the prevalence of each rectification across the training population.
To address Objective 2, gross and detailed shape and rectification measures were analysed for the training dataset. The limb lengths were measured from patella tendon to distal tip, and perimeters at the patella tendon and at half and three-quarters of the length. Profile ratios were created between the half- and three-quarter perimeters and the patella tendon perimeter. The abduction–adduction angle was calculated by finding the principal axis of the mesh below the patella tendon. Volume and area reductions were calculated by comparing limb and socket shapes. Finally, the distributions of rectification sizes were extracted using the k-means clustering method. These measures were inspected for the whole training population and for the PTB and TSB socket groups. A Kolmogorov–Smirnov test was used to assess whether data were normally distributed. Differences between measures for the PTB and TSB groups were assessed for statistical significance using an unpaired Student’s t-test (for normally distributed measures) and a Mann–Whitney U test (for non-parametric measures). Two-tailed tests were used for limb shape measures, where hypotheses assumed the populations were equal. One-tailed tests were used for rectification measures, where hypotheses assumed the PTB designs would have larger rectifications.

3. Results

3.1. Objective 1: Population Models of Residual Limb Anatomic Shape and Prosthetic Socket Design

Of the 67 participants selected by random sampling from clinical service provision in the UK, 20 were female and 47 male, with a mean age 56.9 years (range 19.6–88.2 years) and mean 4.5 years since amputation (range 0.14–30.2 years). Participants had a range of activity levels (8 K1, 29 K2, 27 K3, 3 K4) and reasons for amputation (27 dysvascularity, 20 trauma, 11 infection, 5 neoplasia, 2 neurological, 2 unknown). 55 had been fitted with a PTB socket, and 12 with a TSB, 40 to their left limb and 37 to their right.
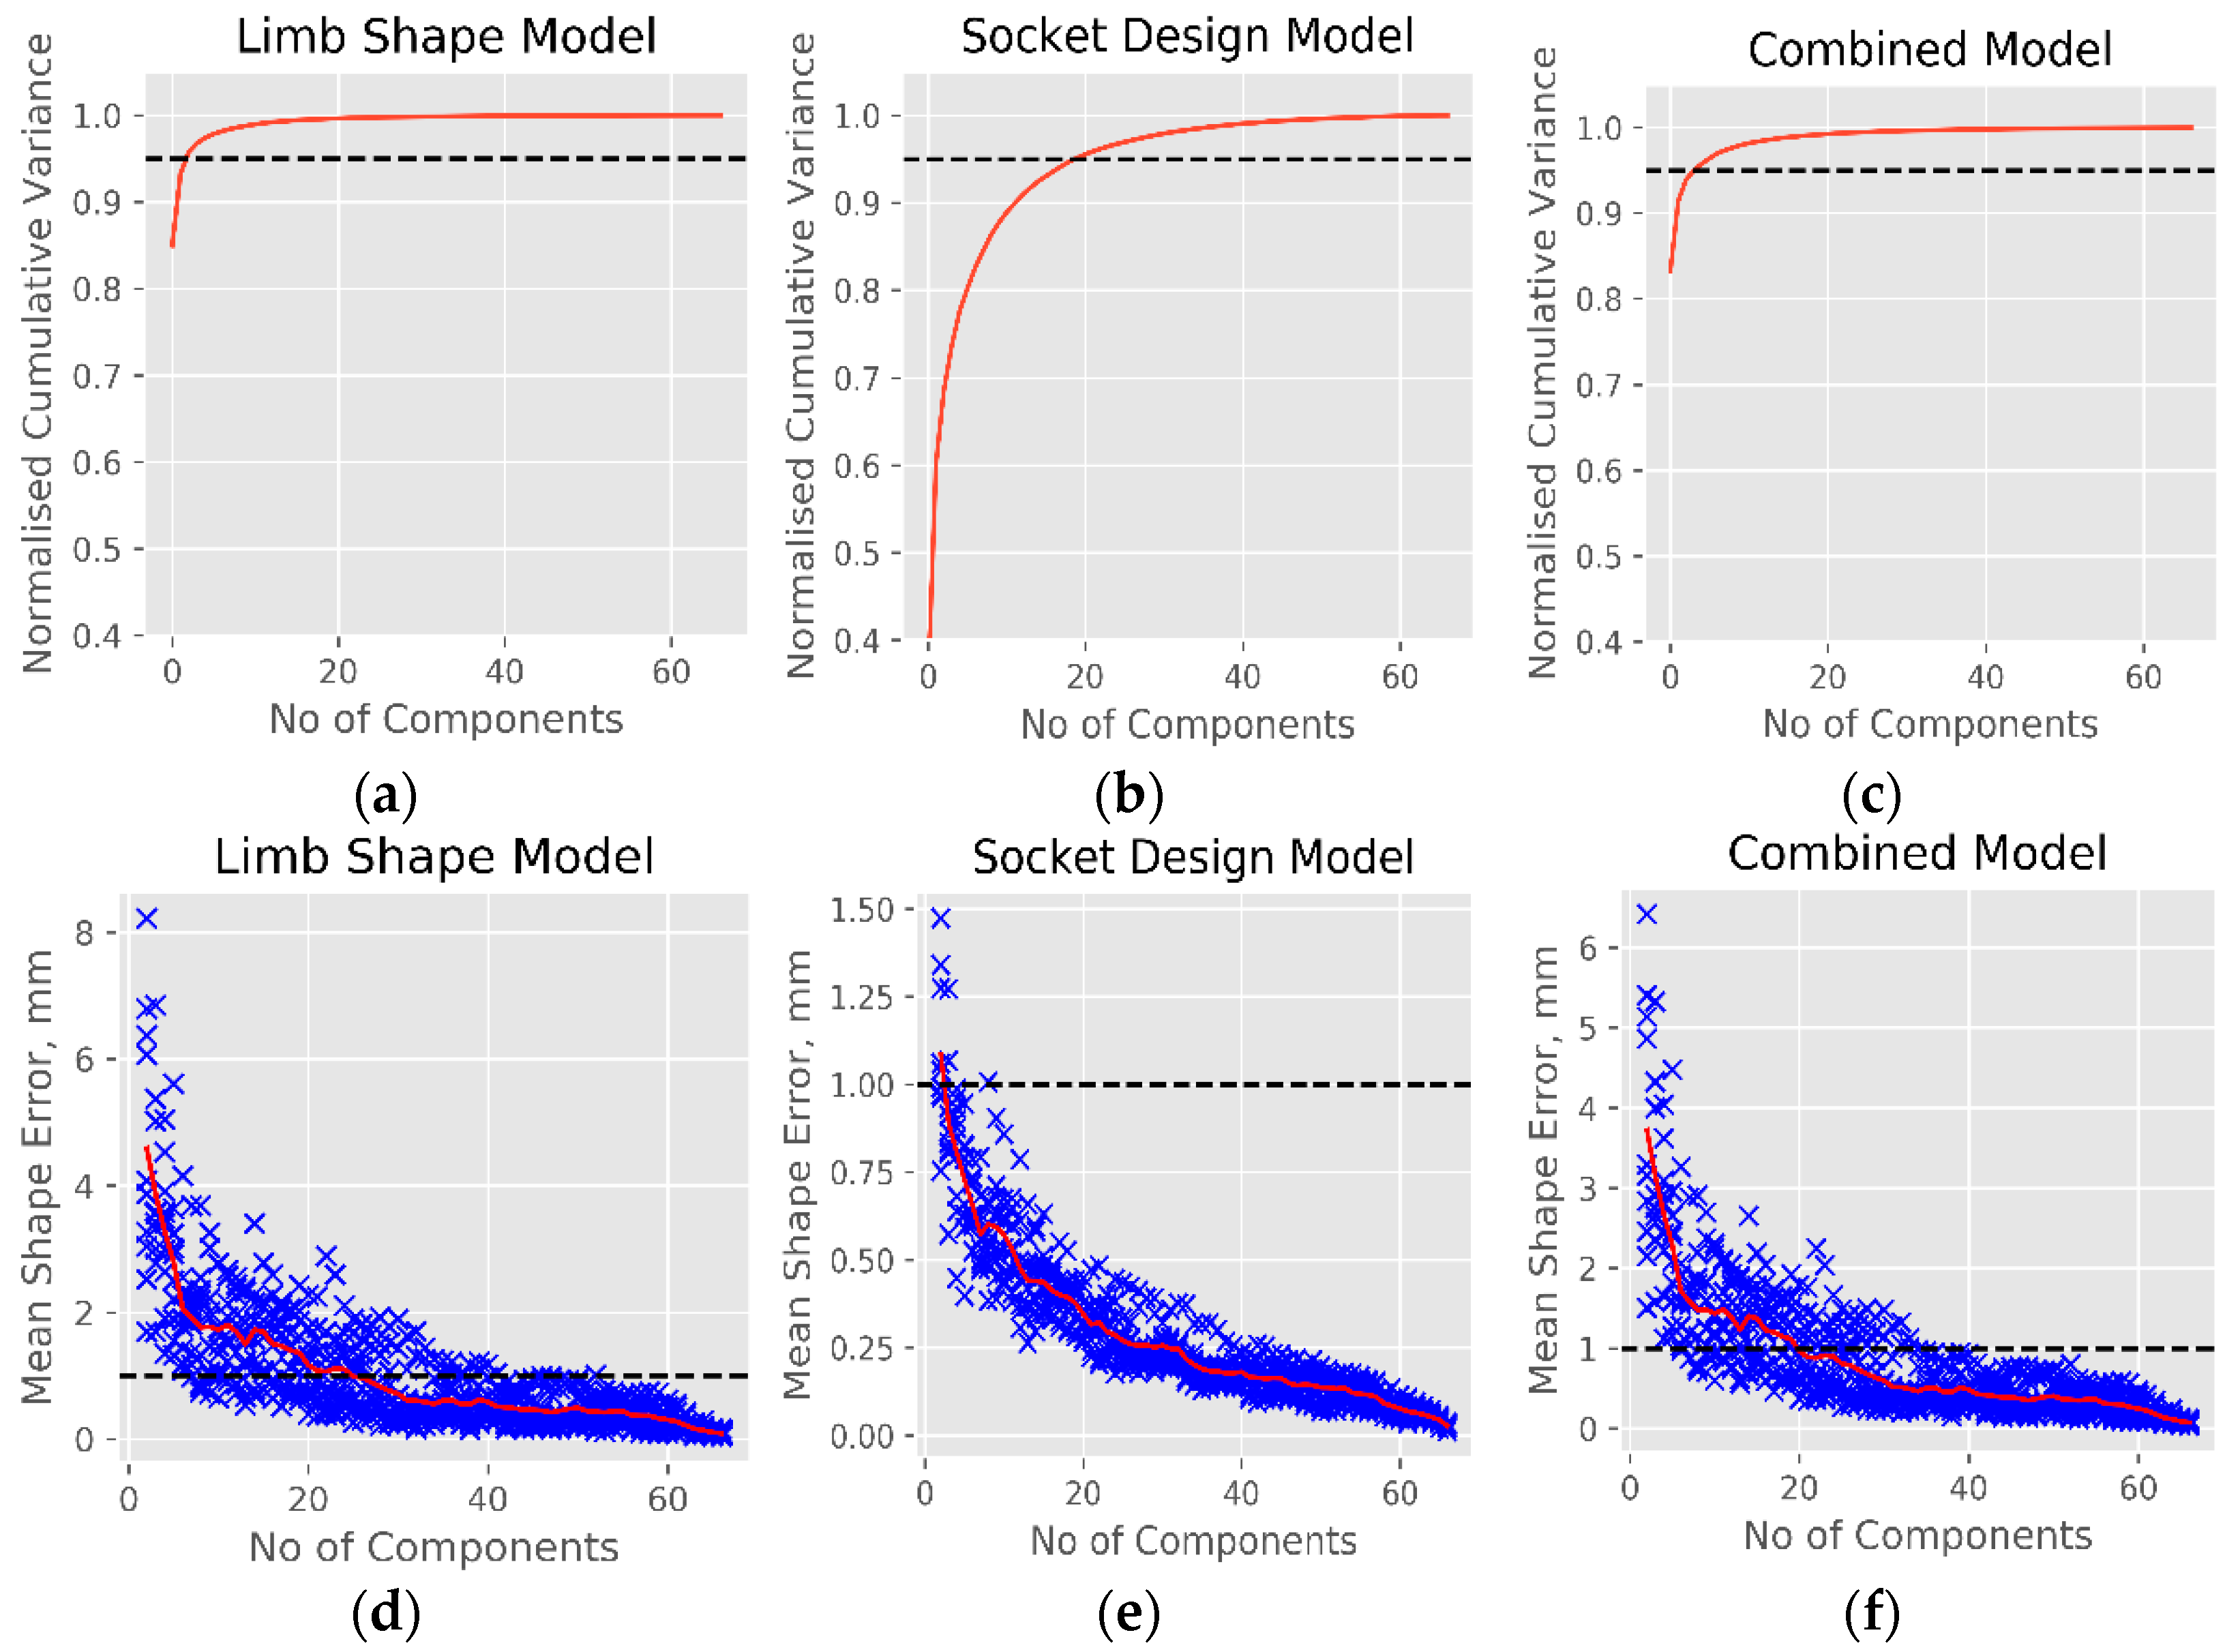
Statistical models were built using PCA for the limb shape (SLM), socket design (SDM) and combined limb shape and socket design (SLDM). Plots of cumulative variance across each model’s modes (Figure 4a–c) show that 95% of the population variation was captured by 3, 19 and 4 modes for the limb shape, socket design and combined models, respectively. This compactness test indicates that new individuals could be approximated by the SLM and SLDM models with 95% confidence using a small number of modes. This means that future use of these models may be possible with few variables and therefore be computationally inexpensive, although the SDM was far less compact. When randomly selected training datasets were reconstructed using different training population sizes (Figure 4d–f), leave-one-out (LOO) testing revealed that around 40 training limb and/or socket shapes are required for shape reconstructions from the SLM and SLDM models to have less than 1.0 mm mean error. The same accuracy was achieved for the SDM using only 10 training socket shapes. These generality results indicate that the training dataset was sufficiently large for the present population’s variability to be described.
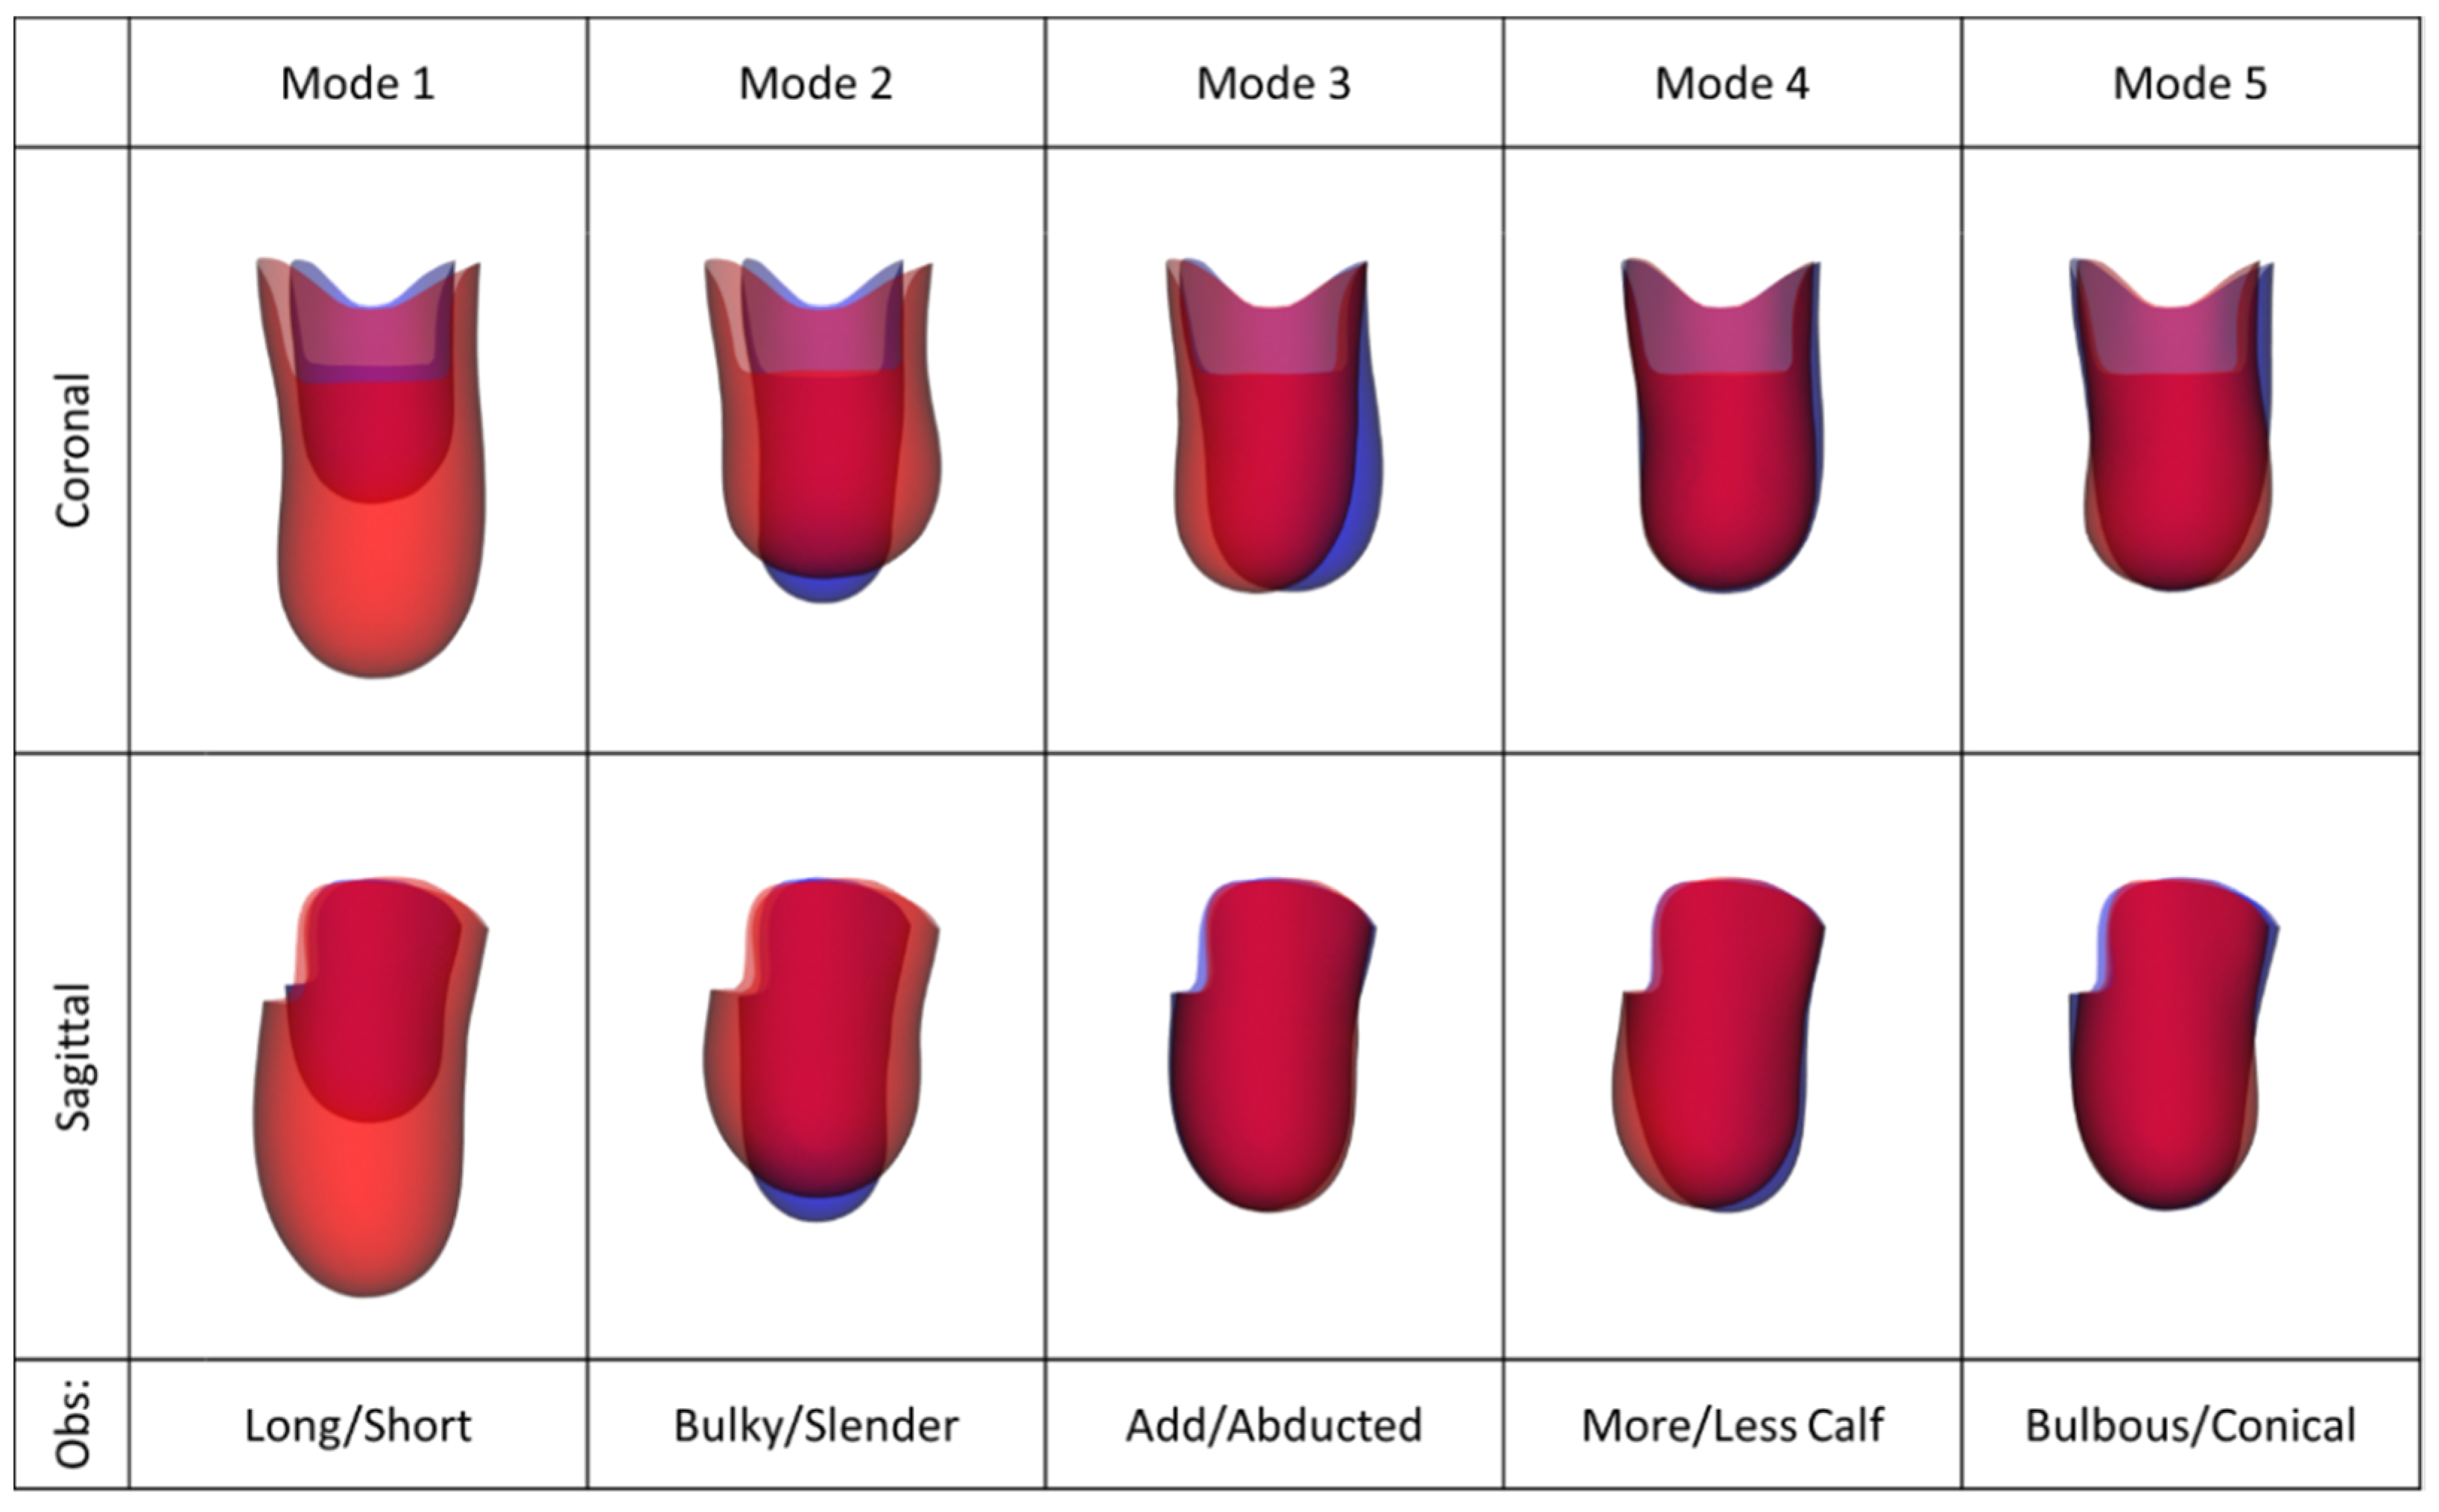
The SLM was able to discriminate between the main independent modes of limb shape variation (Figure 5). Variation presented as the limb’s overall size (mode 1 containing 85% of population variation), with larger limb circumference and width corresponding with longer length; and the limb’s soft tissue bulk (mode 2, 8.3% of variation). Mode 3 (2.5% of variation) described abduction–adduction angle at the knee. Mode 4 (1.1% of variation) represented calf muscle bulk, most apparent in the sagittal view, and mode 5 (0.6% of variation) contained the limb’s bulbous-conical profiles in the sagittal and coronal planes. Mode 2 demonstrates that larger circumference limbs were more likely to be bulbous shaped and smaller circumference limbs a more cylindrical or conical, and Modes 4 and 5 indicate how the profile can also vary independent of limb size or soft tissue bulk.
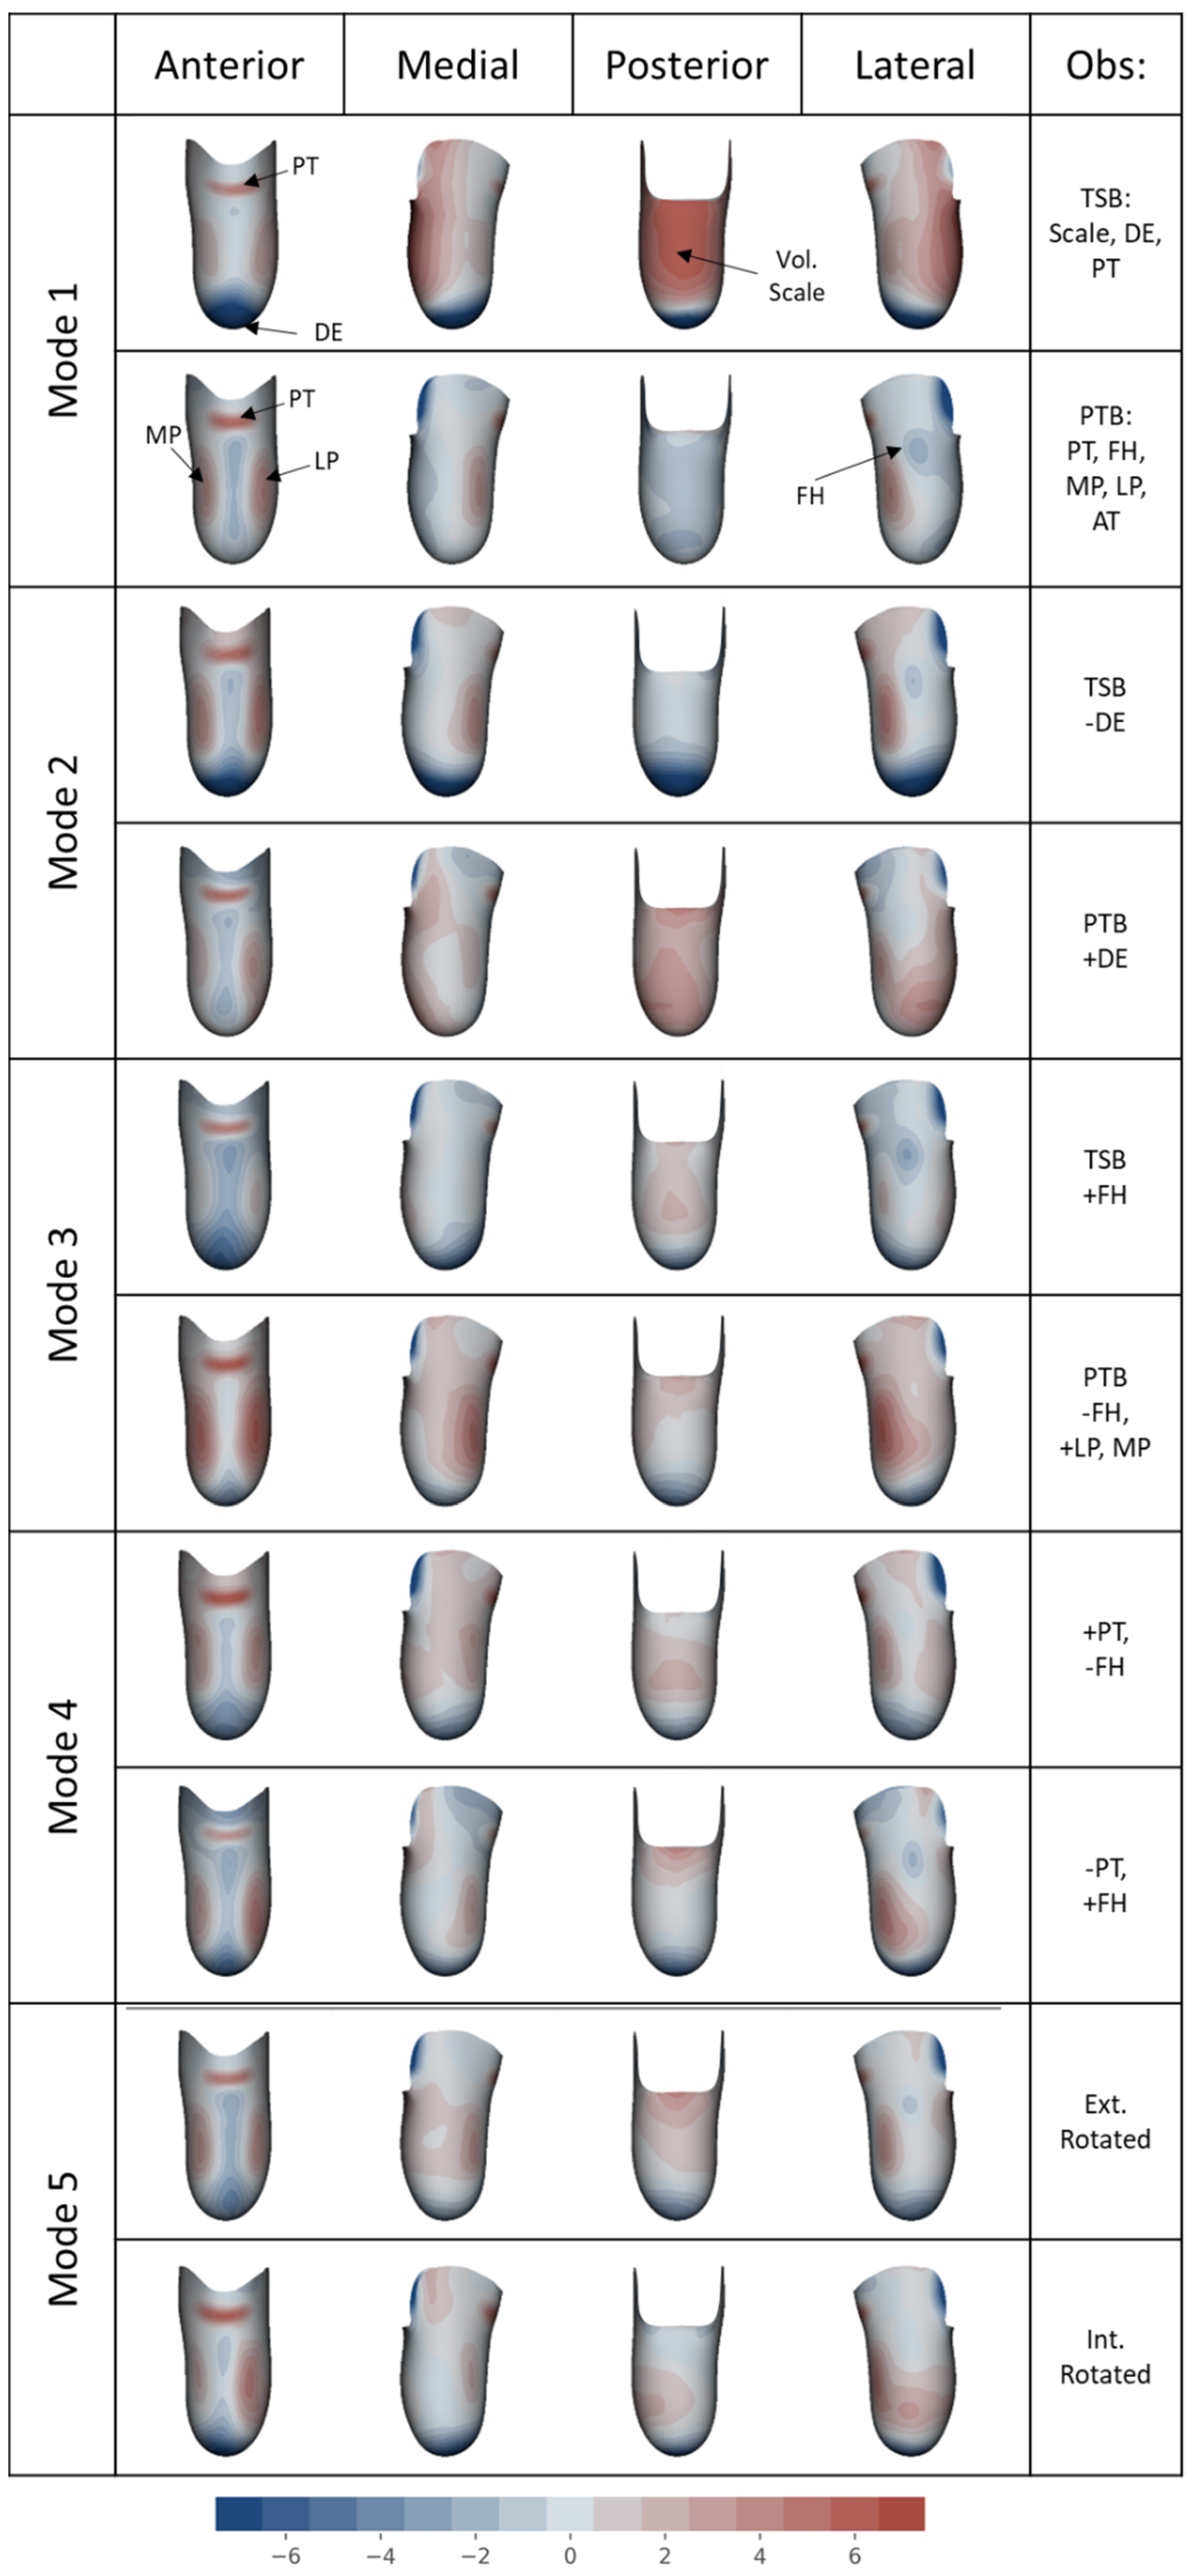
The SDM was able to discriminate between the main independent trends in prosthetic socket design variation (Figure 6). The first mode (containing 35% of population variation) showed an apparent trend between the commonly grouped rectifications of the PTB and TSB socket design philosophies. At one extreme of Mode 1, PTB-dominant design features were observed with notable rectifications at the patella tendon bar, lateral and medial areas either side of the anterior tibial crest (all visible on the anterior view), and relief over the fibula head (visible on the lateral view). Posteriorly, nearly matching limb–socket fit was observed. At the other extreme of Mode 1, TSB-dominant design features were observed. The socket was a similar shape to the limb, with slight press-fit/interference around the limb periphery and few local rectifications except at the patella tendon bar, and substantial distal tip off-loading. The next three modes appeared to show these local socket rectifications in combination with various extents of the PTB-TSB grouped features. Mode 2 (25% of variation) presented variation between PTB and TSB designs but with the distal tip off-loading aligned with the PTB design. Mode 3 (8.5% of variation) showed the fibula head off-loading feature presenting more strongly in the TSB design, than in the PTB with which it is normally associated. Mode 4 (5.1% of variation) showed variation in the patella tendon bar rectifications. Finally, mode 5 (3.9% of variation) showed little variation in the pattern or magnitudes of rectification, but showed their locations varying in internal–external rotation. In summary, PCA performed upon socket rectification data did not generate an SDM which discriminated between individual rectifications, instead identifying variance in combined rectification groups.
The SLDM (Figure 7) showed very similar limb shapes and variance to the pure statistical limb shape model (Figure 5), which dominated the modes. However, this model revealed trends in socket design which correspond with the shape variation. A more PTB-like design was observed for larger, longer limb shapes (mode 1), for more bulbous limb shapes (modes 2 and 5), and for limbs with less defined calf tissue (mode 4). More TSB-like sockets corresponded with limbs that were smaller (mode 1), more slender or cylindrical (modes 2 and 5) and with more defined calf tissue (mode 4). Mode 3 contained abduction–adduction angle variation at the knee, and showed little socket design variation except a slightly more marked fibula head buildup in abducted limbs.
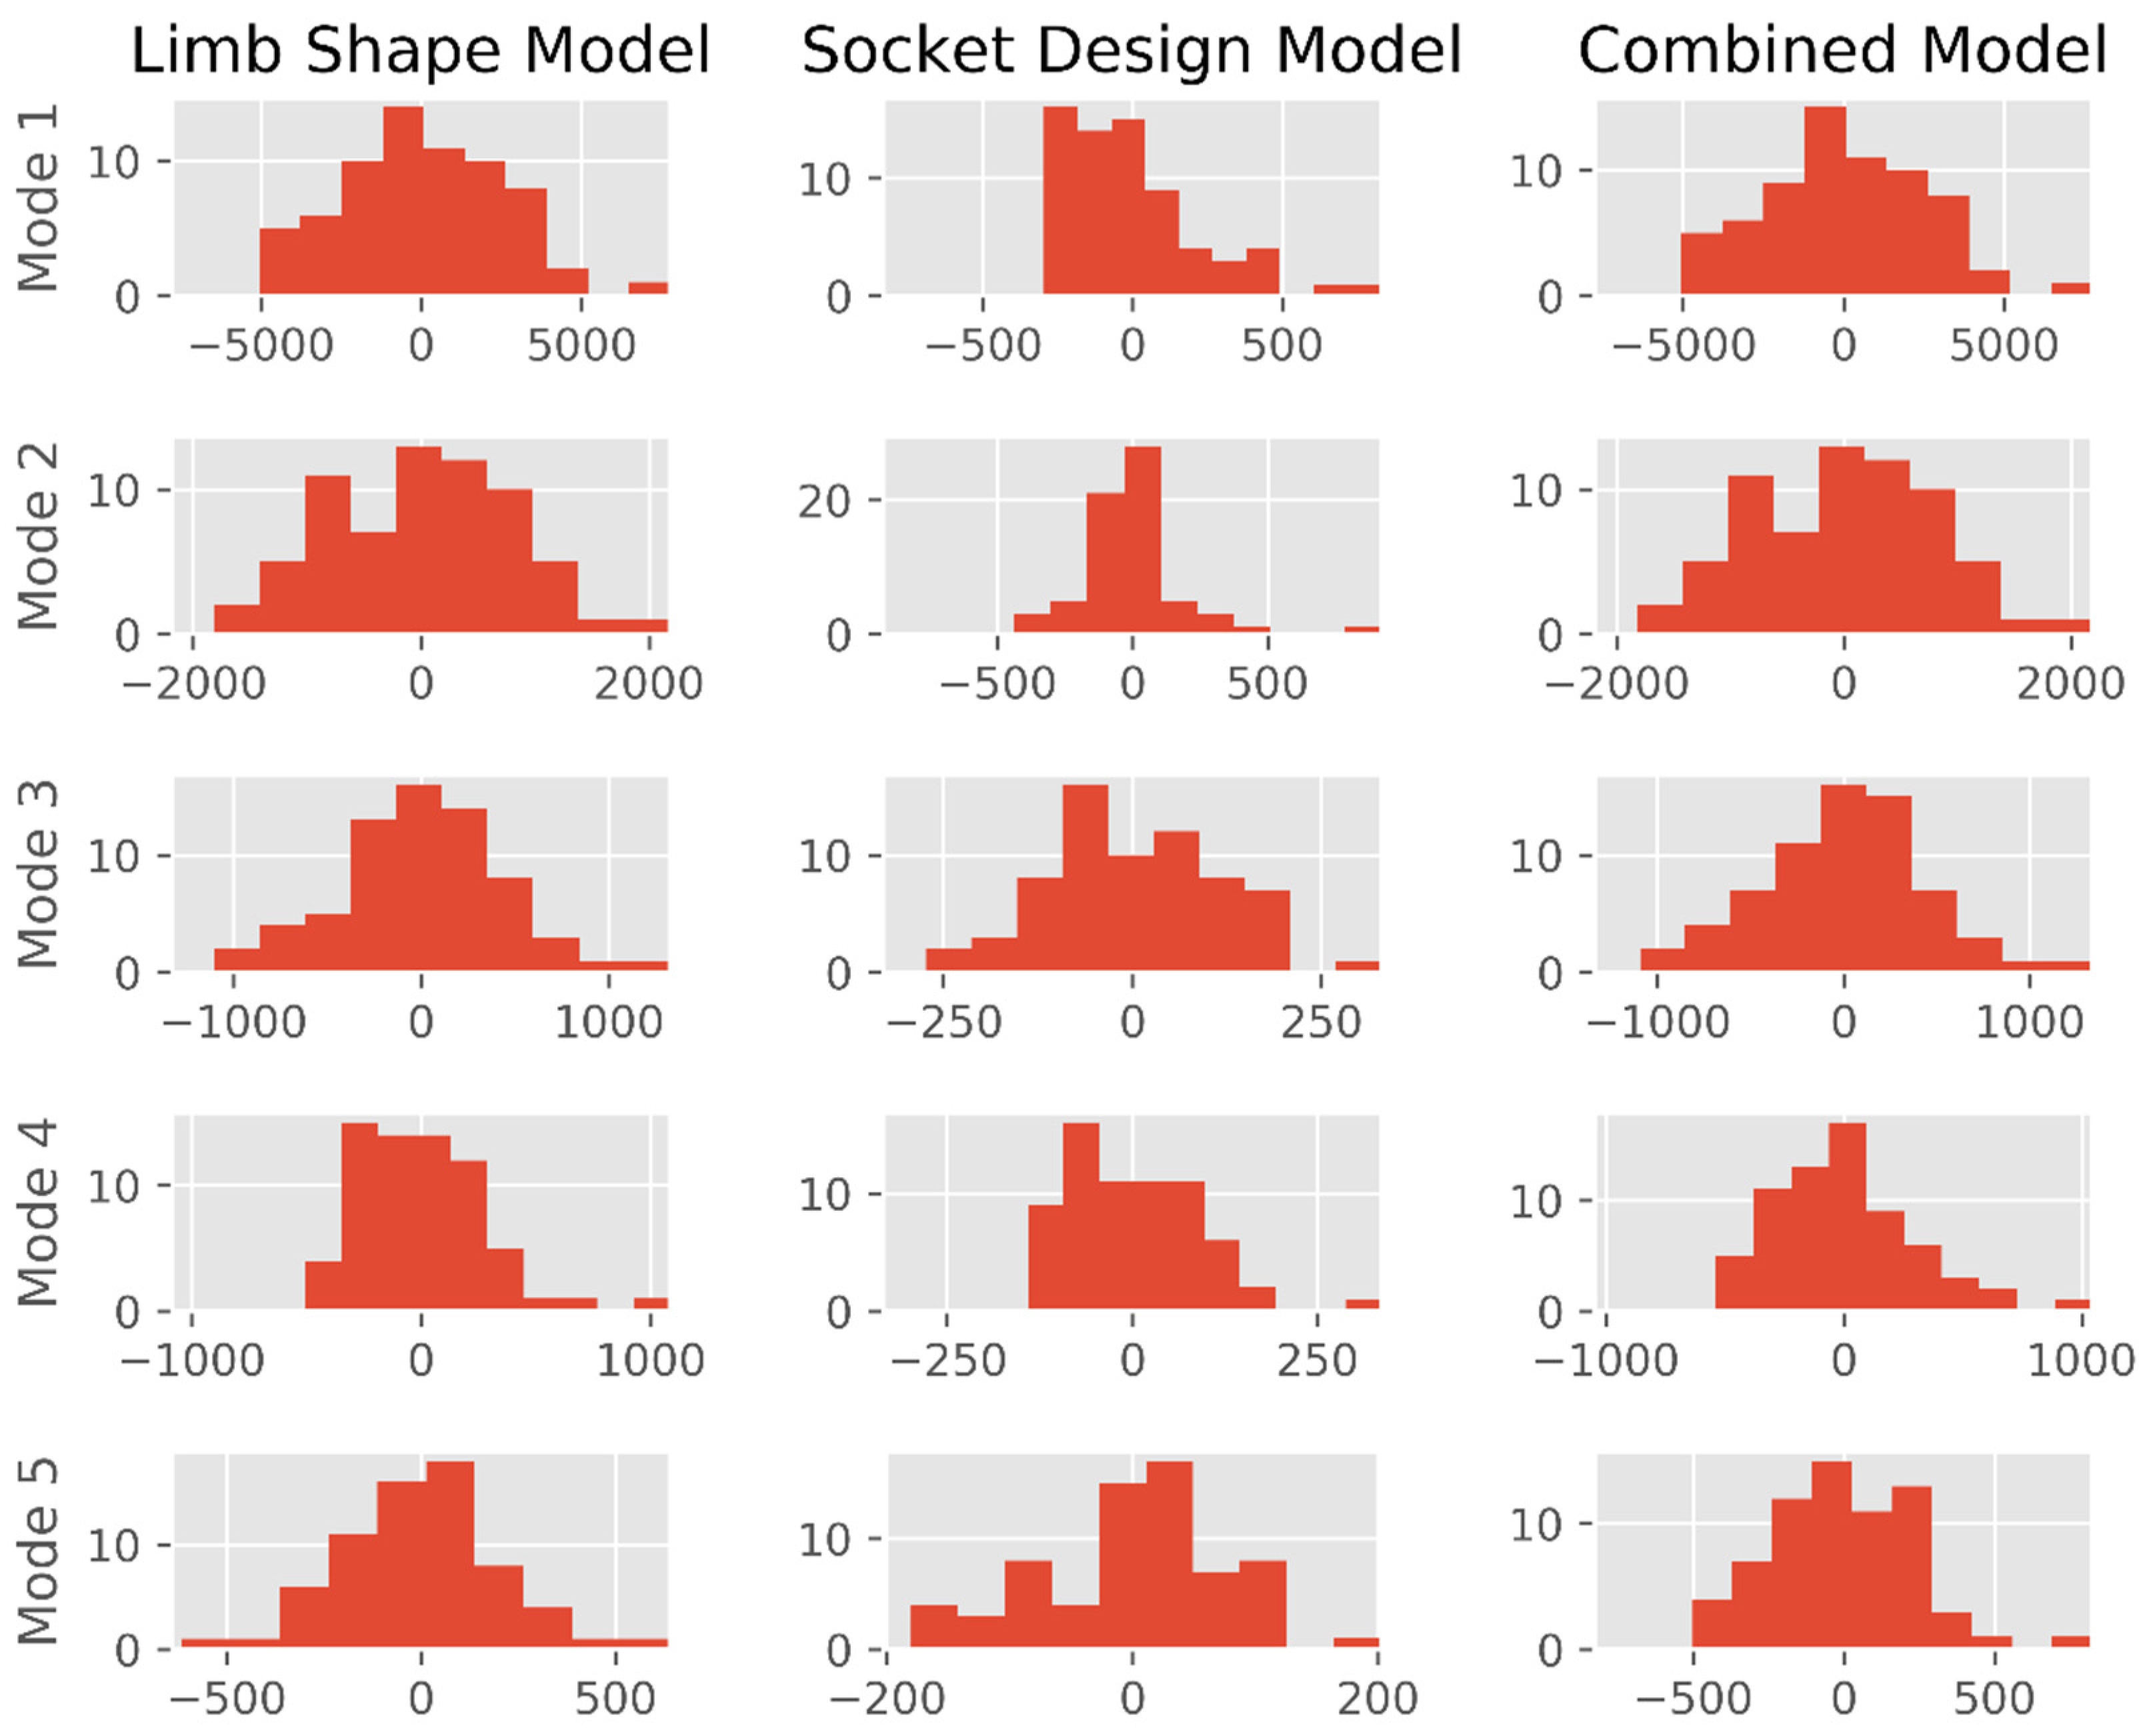
The main shape and design correspondences identified in the PCA statistical models are summarised in Table 1. The training population was observed to be normally distributed in the generated limb shape and combined limb shape and socket design models, but the statistical socket design model was not normally distributed (Figure A1).
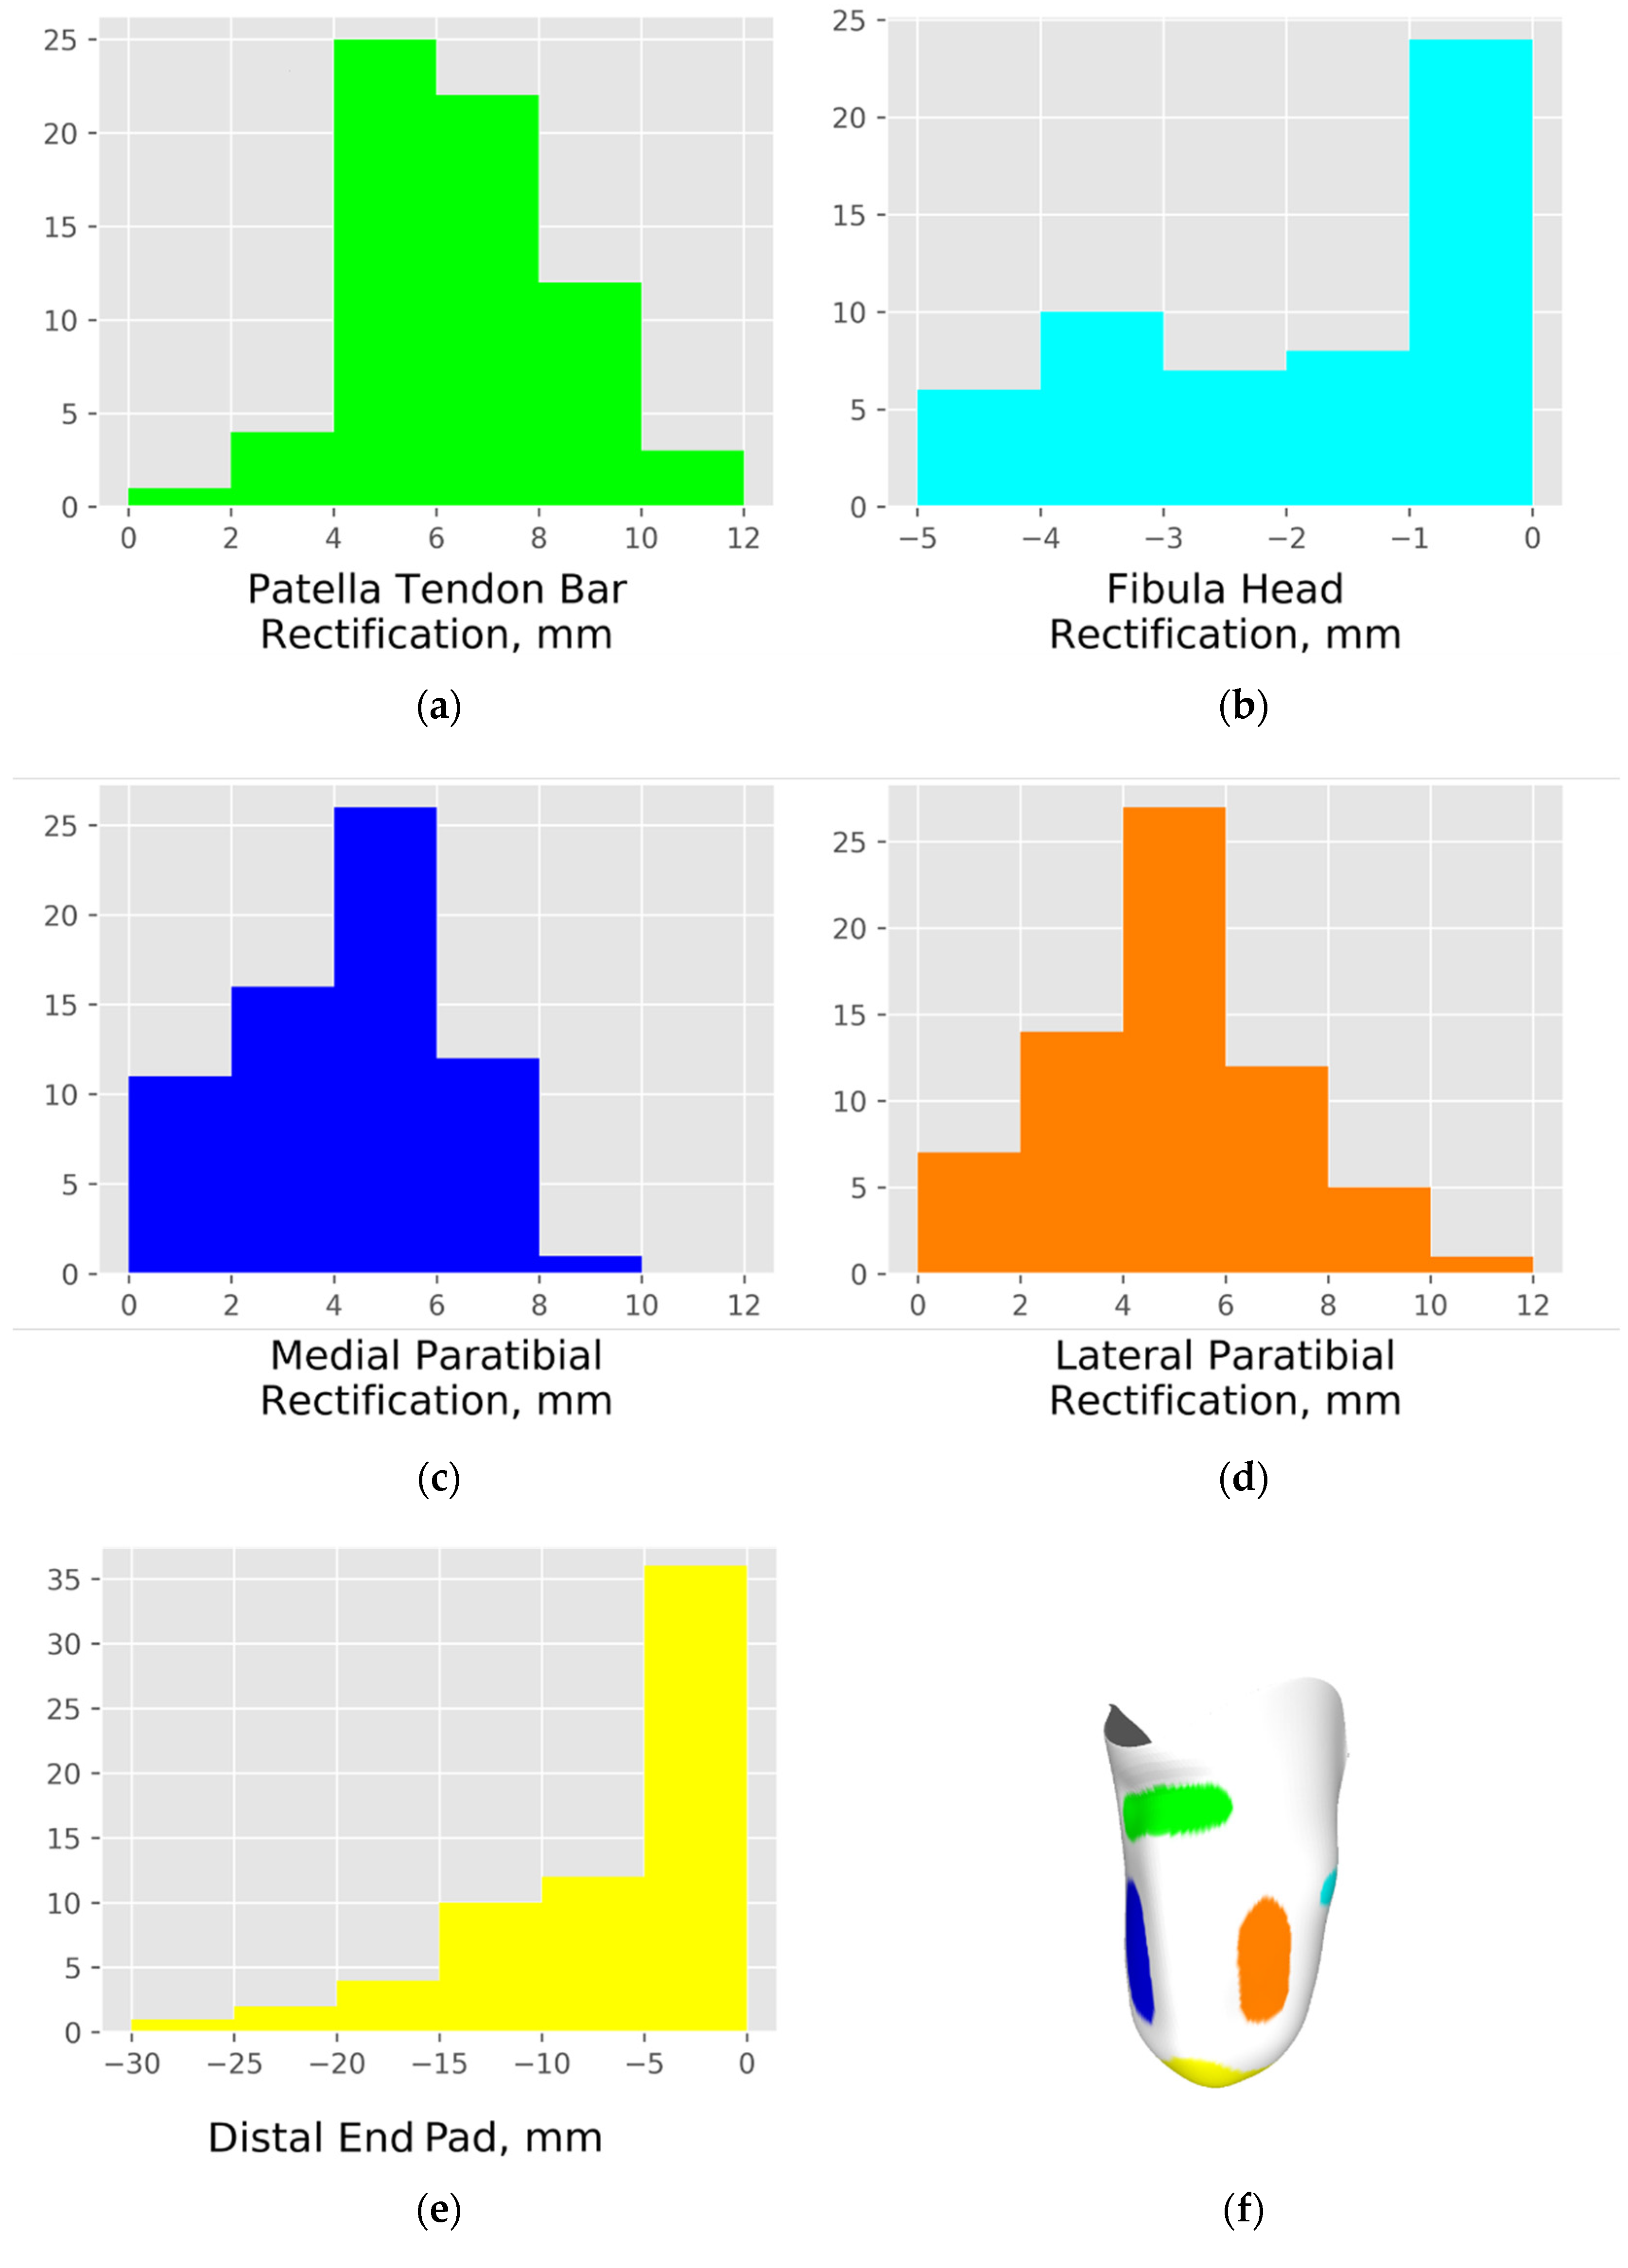
The k-means clustering method permitted statistical analysis of the training sockets’ individual rectification sizes (Figure 8). Against a human observer, the method classified rectifications with 97.3% accuracy overall, including 100% for PT and DE (Table 2). After correcting the few incorrectly classified rectifications, the method identified that all sockets had a rectification at the patella tendon. At least one paratibial rectification was identified all sockets except one from each group. Fibula head rectifications featured in 49/55 PTB sockets but only 6/12 TSB sockets.

3.2. Objective 2: Characterising Residual Limb Anatomic Shape and Prosthetic Socket Design Practice

The limb shape and socket design distributions were extracted from the general residual limb shape measures, and rectifications from the k-means clustering (Table 3). No statistically significant limb shape measures were observed between the individuals who received PTB and TSB sockets (p > 0.05). Inspecting the socket volume and cross-sectional area reduction measures, TSB sockets were smaller compared to the limb than PTB sockets, although this did not reach statistical significance (0.23 ≤ p ≤ 0.36). The local PT, MP and LP rectifications were normally distributed (Figure 8a,c,d). No difference was found between the PT rectification size for each group (p = 0.40). The paratibial rectifications were larger for the PTB designs, but this was marginally insignificant for the lateral side (p = 0.051). The fibula head and distal end rectifications (Figure 8b,e) were skewed owing to many sockets with small or no rectification at these sites. Larger DE rectifications were seen for the TSB sockets, a compensation for their greater press-fit as the near-incompressible posterior soft tissues must be accommodated elsewhere. The difference between PTB and TSB groups was not significant (p = 0.21). PTB sockets had significantly more pronounced FH rectifications than TSB sockets (p = 0.03).

4. Discussion

This study applied unsupervised machine learning methods to evaluate trends in the shape of residual limbs and corresponding expert-designed prosthetic sockets. It investigated how population-based models might be built, and whether separate shape and design models might provide higher resolution for machine learning than a combined shape and design model. Global limb shape trends were captured and separated clearly using principal component analysis of surface shape. The same method distinguished the main overall trends in prosthetic socket design (i.e., PTB and TSB), but it was less successful in separating the variations in discrete local rectifications. For this purpose a k-means clustering model was trained to identify specific rectifications so that they could be compared quantitatively. Correspondences in anatomy and socket design variation were inspected to identify whether there were trends in the socket design approach for particular residual limb shapes in the training dataset.

4.1. Observations

The statistical limb model (Figure 5) showed detailed distinction between different shape profiles, with separate modes capturing independent variations in gross tissue bulk (Mode 2) and the conical-cylindrical-bulbous profile in sagittal (Mode 4) and coronal (Mode 5) planes. The modes showing coronal plane bulbousness varying to a cylindrical profile (Mode 2, and particularly Mode 5 which shows medial and lateral ‘ears’) might indicate short-term swelling and oedema which subsides in the months following surgery, whereas the bulbous to conical shape variance seen in the sagittal plane (Mode 4) might be associated more with activity level and atrophic effects. These theories were tested in a secondary analysis of correlation between the SLM mode scores and time-since-amputation (Table A1). No correlation was seen for Modes 1, 3 and 4 (r < 0.1, p > 0.4) but weak correlations were observed for the bulbousness-shape Modes 2 and 5 (r = 0.23 and 0.28, respectively), which reached significance for Mode 5 (p = 0.065 and 0.026, respectively).
The socket design model’s modes did not clearly distinguish between separate local rectifications (Figure 6). The first mode clearly showed the established trends in PTB and TSB socket designs, in fine detail. For example, a difference can be seen in the straight patella tendon ‘bar’ rectification in the PTB design, compared to the TSB’s more curved, anatomy-following modification at this site, Ref [6] as can be observed in Figure 2. However, subsequent SDM modes contained variation in local rectifications combined with these overall design variation trends, so this method did not allow direct assessment of individual rectification sizes and shapes. The SLDM, however, showed some general trends between limb shape and socket design which are consistent with clinical practice. Clinical, functional and user preference for TSB and PTB sockets is complex, and highly influenced by the liners and accessories they are worn with [39,40], though there is some evidence to support the choice of socket when considering residuum shape and tissue composition. TSB sockets are reported to be preferred for “stumps without oedema and pain”, which are more common in early rehabilitation. Ref [41] PTB sockets are used for earlier rehabilitation where the strategic proximal loading and distal offloading protects the vulnerable soft tissue reconstruction. Ref [42] TSB sockets are preferred for individuals with mature residual limbs of stable volume, without excessive soft tissue, and which are not excessively long [43], although they may be more difficult to fit to highly conical shaped limbs. Ref [6] Bulbous limbs are understood to require PTB sockets, as it would be difficult to don a TSB socket over a bulbous distal shape and achieve the desired uniform load transfer. These clinical use principles are consistent with the correlations observed in this study’s SLDM, where socket designs had more PTB-like features in longer, larger, more bulbous limb shapes (Figure 7).
More detailed analysis of personalised local rectifications was possible using the k-means clustering approach. Inspection of rectifications across the training population revealed that many of the same rectification features were used for both PTB and TSB socket designs. No differences in patellar tendon or distal tip rectifications were observed, though PTB sockets had larger paratibial and fibular head rectifications. TSB sockets were more tightly fitted to the limb than PTB sockets (−3.1% vs. −1.6% by volume, on average). Only the FH rectification differences reached statistical significance, and the clinical significance of these fine variations in socket design are unknown. However, it is noteworthy that this method showed how expert prosthetists produce sockets across a continuum of design, instead of in discrete groups as the PTB and TSB approaches were originally presented. Prosthetic socket design may have evolved to employ the most biomechanically useful features of PTB and TSB approaches, tailored to individual patients. The present study shows how design is tailored to general limb shape trends (Figure 7), and further work is required to understand how detailed design is tailored to individuals.

4.2. Limitations

Statistical shape models are, at best, as limited as the data used to create them. It is risky to use them to extrapolate outside the training population. This model will not necessarily describe other populations, from different ecogeographic groupings or ethnicities, with their respective effects on physical characteristics, form of injury or disease, and surgical approach. For example, amputations may be performed at different heights and with different soft tissue reconstructions depending on the reason for amputation (e.g., landmine trauma vs. road accident trauma vs. vascular disease), and there will be between-group differences in bony anatomy and soft tissue composition. Furthermore, the socket population was biased towards PTB designs, with only 12 TSB sockets in the training dataset. The present method would be strengthened with more training data, but the training population was deemed acceptable for the present study as it was randomly sampled, and the TSB concept relatively closely matches the limb shape, so it might be described adequately with fewer models than the more variable PTB concept. Ultimately, the socket design model was verified to within 1mm with only 10 socket shapes.
A further study limitation in scope is retrospective assessment of limb shape and socket design only, without a direct consideration of the residuum’s bony anatomy, soft tissue wounds or underlying pathology which might influence socket design, such as bone spurs, heterotopic ossification, neuromata, bursae, adhered scars. In CAD/CAM clinical practice, these are identified in limb assessment prior to socket design but not necessarily tracked in the CAD record. There have been proposals for how bony anatomy might be predicted from limb surface topology, using surface curvature [44] or an ANN [45]. However, the soft tissue pathological phenomena mentioned above would probably not be identifiable, so the use of any such data to inform new socket design would rely on template adaptation to the individual by a prosthetist, part of their value-added work.

4.3. Implications and Use

As described earlier, the authors argue that it is inappropriate to try to fully automate the prosthetic socket design process. Instead, this project builds upon proposals made early in CAD/CAM prosthetics [26,28], to learn from past experience for smart templating. With quantitative descriptions of the key trends in residual limb shape, a person’s limb can be compared to a population dataset, and prior socket designs for similar individuals could be looked up. Based on the present study’s unsupervised analysis of design, effectively reverse-engineering excellent clinical practice, subsequent supervised machine learning will allow trends in socket design to be scored by appropriate clinical outcome measures of comfort or function, providing templates which can be integrated in current CAD/CAM workflows. This process requires expert human input throughout, from development to clinical use, to provide the key value of patient-centred design (Figure 1). According to the Pareto 80:20 principle [46], this expert-led proposal could protect the prosthetists’ time to provide their skill where it is most valuable, in adapting the template to their patient. As such, the presented methods could support evidence-based approaches to save time and iteration towards an acceptable socket, and sharing best practice with colleagues and trainees. Ahead of such templates, this study provides quantitative measures of clinically used socket rectifications and press-fit (Table 3), reveals a design continuum between more PTB-like and more TSB-like sockets, and demonstrates how prosthetists select these features for different limb shapes (Figure 7).
Beyond direct clinical application, characterisation of residual limb size and shape variability is useful to ensure that biomechanical analysis models are representative of a broad population of prosthesis users. Without access to such data, Silver-Thorn [47,48] developed a generic FEA model of the transtibial amputated limb that was resized for the individual to estimate interface stresses with various socket designs, but used standard geometric shapes rather than accurate geometries, and did not account for limb shape variations. The same shape PCA method presented here has been used with volume mesh morphing to produce an FE limb model scaled from an MRI scan onto a population of surface scans, enabling far more general FE predictions than a single model allows [33]. Where many FE studies have used single- or highly simplified, volume-scaled socket designs [16], the presented shape analysis method and quantitative rectification data (Table 3) would enable modellers to work with more clinically representative sockets.

5. Conclusions

This study provides methods for population-based socket design analysis which will support developments in CAD/CAM clinical practice and accuracy of biomechanics research. These methods may help to reduce clinic time and iterations required to fit a comfortable socket. Bearing in mind the mentioned limitations, we advise care in interpreting and using the present study’s findings. These design trends are observations from a single group of patients and clinicians, and they do not imply any causal link between design and outcome. As such the present study’s results do not represent recommendations for clinical practice and will not apply to all patients and clinical situations. The proposal of any socket design guideline or template should be validated in a blinded, controlled clinical study comparing from-template and from-scratch sockets. The authors reiterate our position that prosthetic socket design should not be fully automated, but that the process may be improved using smart socket templates, fitted by a highly trained prosthetist.

Author Contributions

Conceptualisation, A.D. and J.S.; methodology, A.D., L.D., R.M. and J.S.; software, J.S. and R.M.; validation, A.D., L.D., E.P. and D.H.; formal analysis, J.S. and R.M.; resources, E.P., D.H.; data curation, E.P., A.D. and J.S.; writing—original draft preparation, A.D. and L.D.; writing—review and editing, All; visualisation, A.D. and J.S.; project administration, A.D.; funding acquisition, A.D. and J.S. All authors have read and agreed to the published version of the manuscript.

Funding

This research was funded by the Royal Academy of Engineering (RAEng), grant numbers RF/130 and EF1819\8\24 and the Engineering and Physical Sciences Research Council (EPSRC)/National Institute for Health Research (NIHR) Global Challenges Research Fund programme, grant number EP/R014213/1.

Institutional Review Board Statement

This study was conducted according to the guidelines of the Declaration of Helsinki, and approved by the Institutional Ethics Committee of University of Southampton (protocol code ERGO 53279 on 11 November 2019).

Informed Consent Statement

Patient consent was waived due to this study’s retrospective, anonymised analysis of data collected under routine clinical practice, structured as a service development audit. This approach was supported by a committee chair from the UK National Research Ethics Service (NRES).

Data Availability Statement

The dataset supporting the conclusions of this article is available in the University of Southampton repository, https://doi.org/10.5258/SOTON/D1942.

Acknowledgments

We acknowledge kind support from Peter Worsley, Sonia Zakrzewski and James Batchelor, and the University of Southampton’s Institute for Life Sciences.

Conflicts of Interest

The authors declare no conflict of interest. The funders had no role in the design of the study; in the collection, analyses, or interpretation of data; in the writing of the manuscript, or in the decision to publish the results.

Appendix A

Figure A1. Histograms of training dataset mode scores for the SLM, SDM and SLDM. Greatest deviation from normal distributions is observed for the statistical design model.
Prosthesis 03 00027 g0a1
Table A1. Correlations between statistical limb model mode scores and participant metadata:
Correlations Between SLM Modes and Participant Metadata
Mode12345
Gross Size:
Large to Small
Soft Tissue:
Bulky to Slender
Knee Angle:
Adducted to Abducted
Sag. Profile:
Conical to Bulbous
Cor. Profile:
Conical to Bulbous
Time Since Amputationr0.100.230.020.050.28
p0.4330.0650.8650.7020.026 *
* denotes statistically significant correlations (p < 0.05).

References

  1. Safari, R. Lower limb prosthetic interfaces: Clinical and technological advancement and potential future direction. Prosthet. Orthot. Int. 2020, 44, 384–401. [Google Scholar] [CrossRef] [PubMed]
  2. Pezzin, L.E.; Dillingham, T.R.; MacKenzie, E.J.; Ephraim, P.; Rossbach, P. Use and satisfaction with prosthetic limb devices and related services. Arch. Phys. Med. Rehabil. 2004, 85, 723–729. [Google Scholar] [CrossRef] [PubMed]
  3. Haggstrom, E.E.; Hansson, E.; Hagberg, K. Comparison of prosthetic costs and service between osseointegrated and conventional suspended transfemoral prostheses. Prosthet. Orthot. Int. 2013, 37, 152–160. [Google Scholar] [CrossRef] [PubMed]
  4. Suyi Yang, E.; Aslani, N.; McGarry, A. Influences and trends of various shape-capture methods on outcomes in trans-tibial prosthetics: A systematic review. Prosthet. Orthot. Int. 2019, 43, 540–555. [Google Scholar] [CrossRef] [Green Version]
  5. Foort, J. The Patellar-Tendon-Bearing Prosthesis for below-knee amputees, a review of technique and criteria. Artif Limbs 1965, 13, 4–13. [Google Scholar]
  6. Staats, T.B.; Lundt, J. The UCLA Total Surface Bearing Suction Below-Knee Prosthesis. Clin. Prosthet. Orthot. 1987, 11, 118–130. [Google Scholar]
  7. Fillauer, C.E.; Pritham, C.H.; Fillauer, K.D. Evolution and development of the silicone suction socket (3S) for below-knee prostheses. J. Prosthet. Orthot. 1989, 1, 92–103. [Google Scholar] [CrossRef]
  8. Kristinsson, O. The ICEROSS concept: A discussion of a philosophy. Prosthet. Orthot. Int. 1993, 17, 49–55. [Google Scholar] [CrossRef]
  9. Murdoch, G. The “Dundee” Socket—A Total Contact Socket for the Below-Knee Amputation. Orthop. Prosthet. Appl. J. 1965, 19, 231–234. [Google Scholar]
  10. Wu, Y.; Casanova, H.; Smith, W.K.; Edwards, M.; Childress, D.S. CIR sand casting system for trans-tibial socket. Prosthet. Orthot. Int. 2003, 27, 146–152. [Google Scholar] [CrossRef]
  11. Wu, Y.; Casanova, H.R.; Reisinger, K.I.M.D.; Smith, W.K.; Childress, D.S. CIR casting system for making transtibial sockets. Prosthet. Orthot. Int. 2009, 33, 1–9. [Google Scholar] [CrossRef] [Green Version]
  12. ISPO. International Society for Prosthetics and Orthotics ISPO Biennium Report 2017–2019; ISPO: Brussels, Belgium, 2019. [Google Scholar]
  13. Al-Fakih, E.A.; Abu Osman, N.A.; Mahmad Adikan, F.R. Techniques for interface stress measurements within prosthetic sockets of transtibial amputees: A review of the past 50 years of research. Sensors 2016, 16, 1119. [Google Scholar] [CrossRef] [PubMed] [Green Version]
  14. Sewell, P.; Noroozi, S.; Vinney, J.; Amali, R.; Andrews, S. Static and dynamic pressure prediction for prosthetic socket fitting assessment utilising an inverse problem approach. Artif. Intell. Med. 2012, 54, 29–41. [Google Scholar] [CrossRef]
  15. Krouskop, T.A.; Muilenberg, A.L.; Doughtery, D.R.; Winningham, D.J. Computer-aided design of a prosthetic socket for an above-knee amputee. J. Rehabil. Res. Dev. 1987, 24, 31–38. [Google Scholar] [PubMed]
  16. Dickinson, A.S.; Steer, J.W.; Worsley, P.R. Finite element analysis of the amputated lower limb: A systematic review and recommendations. Med. Eng. Phys. 2017, 43, 1–18. [Google Scholar] [CrossRef]
  17. Sewell, P.; Noroozi, S.; Vinney, J.; Andrews, S. Developments in the trans-tibial prosthetic socket fitting process: A review of past and present research. Prosthet. Orthot. Int. 2000, 24, 97–107. [Google Scholar] [CrossRef] [PubMed]
  18. Mak, A.F.T.; Zhang, M.; Boone, D.A. State-of-the-art research in lower-limb prosthetic biomechanics-socket interface: A review. J. Rehabil. Res. Dev. 2001, 38, 161–173. [Google Scholar] [PubMed]
  19. Colombo, G.; Facoetti, G.; Rizzi, C. Automatic Below-Knee Prosthesis Socket Design: A Preliminary Approach. In Proceedings of the 7th International Conference, DHM 2016, Held as Part of HCI International 2016, Toronto, ON, Canada, 17–22 July 2016. [Google Scholar]
  20. Saverio Frillici, F.; Rotini, F. Prosthesis socket design through shape optimization. Comput. Aided. Des. Appl. 2013, 10, 863–876. [Google Scholar] [CrossRef]
  21. Steer, J.W.; Grudniewski, P.A.; Browne, M.; Worsley, P.R.; Sobey, A.J.; Dickinson, A.S. Predictive prosthetic socket design: Part 2—generating person-specific candidate designs using multi-objective genetic algorithms. Biomech. Model. Mechanobiol. 2020, 19, 1347–1360. [Google Scholar] [CrossRef] [Green Version]
  22. Ballit, A.; Mougharbel, I.; Ghaziri, H.; Dao, T.T. Computer-aided parametric prosthetic socket design based on real-time soft tissue deformation and an inverse approach. Vis. Comput. 2021, 37, 1–19. [Google Scholar] [CrossRef]
  23. Li, S.; Lan, H.; Luo, X.; Lv, Y.; Gao, L.; Yu, H. Quantitative compensation design for prosthetic socket based on eigenvector algorithm method. Rev. Sci. Instrum. 2019, 90, 104101. [Google Scholar] [CrossRef]
  24. Karamousadakis, M.; Porichis, A.; Ottikkutti, S.; Chen, D.; Vartholomeos, P. A Sensor-Based Decision Support System for Transfemoral Socket Rectification. Sensors 2021, 21, 3743. [Google Scholar] [CrossRef] [PubMed]
  25. Sanz-Pena, I.; Arachchi, S.; Halwala-Vithanage, D.; Mallikarachchi, S.; Kirumbara-Liyanage, J.; McGregor, A.; Silva, P.; Newell, N. Characterising the mould rectification process for designing scoliosis braces: Towards automated digital design of 3d-printed braces. Appl. Sci. 2021, 11, 4665. [Google Scholar] [CrossRef]
  26. Lemaire, E.D.; Johnson, F. A Quantitative Method for Comparing and Evaluating Manual Prosthetic Socket Modifications. IEEE Trans. Rehabil. Eng. 1996, 4, 303–309. [Google Scholar] [CrossRef]
  27. Torres-Moreno, R.; Foort, J.; Morrison, J.B.; Saunders, C.G. A reference shape library for computer aided socket design in above-knee prostheses. Prosthet. Orthot. Int. 1989, 13, 130–139. [Google Scholar] [CrossRef] [PubMed] [Green Version]
  28. Lemaire, E.D.; Bexiga, P.; Johnson, F.; Solomonidis, S.E.; Paul, J.P. Validation of a quantitative method for defining CAD/CAM socket modifications. Prosthet. Orthot. Int. 1999, 23, 30–44. [Google Scholar] [CrossRef] [Green Version]
  29. Fatone, S.; Johnson, W.B.; Tran, L.; Tucker, K.; Mowrer, C.; Caldwell, R. Quantification of rectifications for the Northwestern University Flexible Sub-Ischial Vacuum Socket. Prosthet. Orthot. Int. 2017, 41, 251–257. [Google Scholar] [CrossRef] [PubMed]
  30. Saxby, D.J.; Killen, B.A.; Pizzolato, C.; Carty, C.P.; Diamond, L.E.; Modenese, L.; Fernandez, J.; Davico, G.; Barzan, M.; Lenton, G.; et al. Machine learning methods to support personalized neuromusculoskeletal modelling. Biomech. Model. Mechanobiol. 2020, 19, 1169–1185. [Google Scholar] [CrossRef]
  31. Cook, D.D.; Robertson, D.J. The generic modeling fallacy: Average biomechanical models often produce non-average results! J. Biomech. 2016, 49, 3609–3615. [Google Scholar] [CrossRef]
  32. Worsley, P.R.; Steer, J.W.; Woods, C.J.; Dickinson, A.S. Classifying residual limb shape in transtibial amputees. Prosthet. Orthot. Int. 2015, 39, 414. [Google Scholar] [CrossRef] [Green Version]
  33. Steer, J.W.; Worsley, P.R.; Browne, M.; Dickinson, A.S. Predictive prosthetic socket design: Part 1—population-based evaluation of transtibial prosthetic sockets by FEA-driven surrogate modelling. Biomech. Model. Mechanobiol. 2020, 19, 1331–1346. [Google Scholar] [CrossRef] [PubMed] [Green Version]
  34. Steer, J.; Stocks, O.; Parsons, J.; Worsley, P.; Dickinson, A. Ampscan: A lightweight Python package for shape analysis of prosthetics and orthotics. J. Open Source Softw. 2020, 5, 2060. [Google Scholar] [CrossRef]
  35. Dickinson, A.S.; Steer, J.W.; Woods, C.J.; Worsley, P.R. Registering a methodology for imaging and analysis of residual-limb shape after transtibial amputation. J. Rehabil. Res. Dev. 2016, 53, 207–218. [Google Scholar] [CrossRef] [PubMed]
  36. Pedregosa, F.; Varoquaux, G.; Gramfort, A.; Michel, V.; Thirion, B.; Grisel, O.; Blondel, M.; Prettenhofer, P.; Weiss, R.; Dubourg, V.; et al. Scikit-Learn: Machine Learning in Python. J. Mach. Learn. Res. 2011, 12, 2825–2830. [Google Scholar]
  37. Convery, P.P.; Buis, A.W.P.; Wilkie, R.; Sockalingam, S.; Blair, A.; McHugh, B. Measurement of the consistency of patellar-tendon-bearing cast rectification. Prosthet. Orthot. Int. 2003, 27, 207–213. [Google Scholar] [CrossRef]
  38. Dickinson, A.; Donovan-Hall, M.; Kheng, S.; Bou, K.; Tech, A.; Steer, J.; Metcalf, C.; Worsley, P. Selecting Appropriate 3D Scanning Technologies for Prosthetic Socket Design and Transtibial Residual Limb Shape Characterisation. J. Prosthet. Orthot. 2020. [Google Scholar] [CrossRef]
  39. Safari, M.R.; Meier, M.R. Systematic review of effects of current transtibial prosthetic socket designs—Part 1: Qualitative outcomes. J. Rehabil. Res. Dev. 2015, 52, 491–508. [Google Scholar] [CrossRef] [Green Version]
  40. Stevens, P.M.; Depalma, R.R.; Wurdeman, S.R. Transtibial socket design, interface, and suspension: A clinical practice guideline. J. Prosthet. Orthot. 2019, 31, 172–178. [Google Scholar] [CrossRef]
  41. Yiǧiter, K.; Şener, G.; Bayar, K. Comparison of the effects of patellar tendon bearing and total surface bearing sockets on prosthetic fitting and rehabilitation. Prosthet. Orthot. Int. 2002, 26, 206–212. [Google Scholar] [CrossRef] [Green Version]
  42. Laing, S.; Lee, P.V.; Goh, J.C. Engineering a trans-tibial prosthetic socket for the lower limb amputee. Ann. Acad. Med. Singap. 2011, 40, 252–259. [Google Scholar]
  43. Hachisuka, K.; Dozono, K.; Ogata, H.; Ohmine, S.; Shitama, H.; Shinkoda, K. Total surface bearing below-knee prosthesis: Advantages, disadvantages, and clinical implications. Arch. Phys. Med. Rehabil. 1998, 79, 783–789. [Google Scholar] [CrossRef]
  44. Chan, R.B.; Rovick, J.S.; Childress, D.S. Surface curvature analysis for enhanced computer-aided-design of prosthetic sockets. In Proceedings of the 15th Annual International Conference of the IEEE Engineering in Medicine and Biology Society, San Diego, CA, USA, 31 October 1993; pp. 1292–1293. [Google Scholar] [CrossRef]
  45. Chahande, A.I.; Billakanti, S.R. Identification of load bearing areas for prosthetic limbs in a below-the-knee amputee using neural networks. In Proceedings of the 15th Annual International Conference of the IEEE Engineering in Medicine and Biology Society, San Diego, CA, USA, 31 October 1993; pp. 1284–1285. [Google Scholar] [CrossRef]
  46. Sanders, R. The Pareto principle: Its use and abuse. J. Serv. Mark. 1987, 1, 37–40. [Google Scholar] [CrossRef]
  47. Silver-Thorn, M.B.; Childress, D.S. Parametric analysis using the finite element method to investigate prosthetic interface stresses for persons with trans-tibial amputation. J. Rehabil. Res. Dev. 1996, 33, 227–238. [Google Scholar] [PubMed]
  48. Silver-Thorn, M.B.; Childress, D.S. Generic, geometric finite element analysis of the transtibial residual limb and prosthetic socket. J. Rehabil. Res. Dev. 1997, 34, 171–186. [Google Scholar]
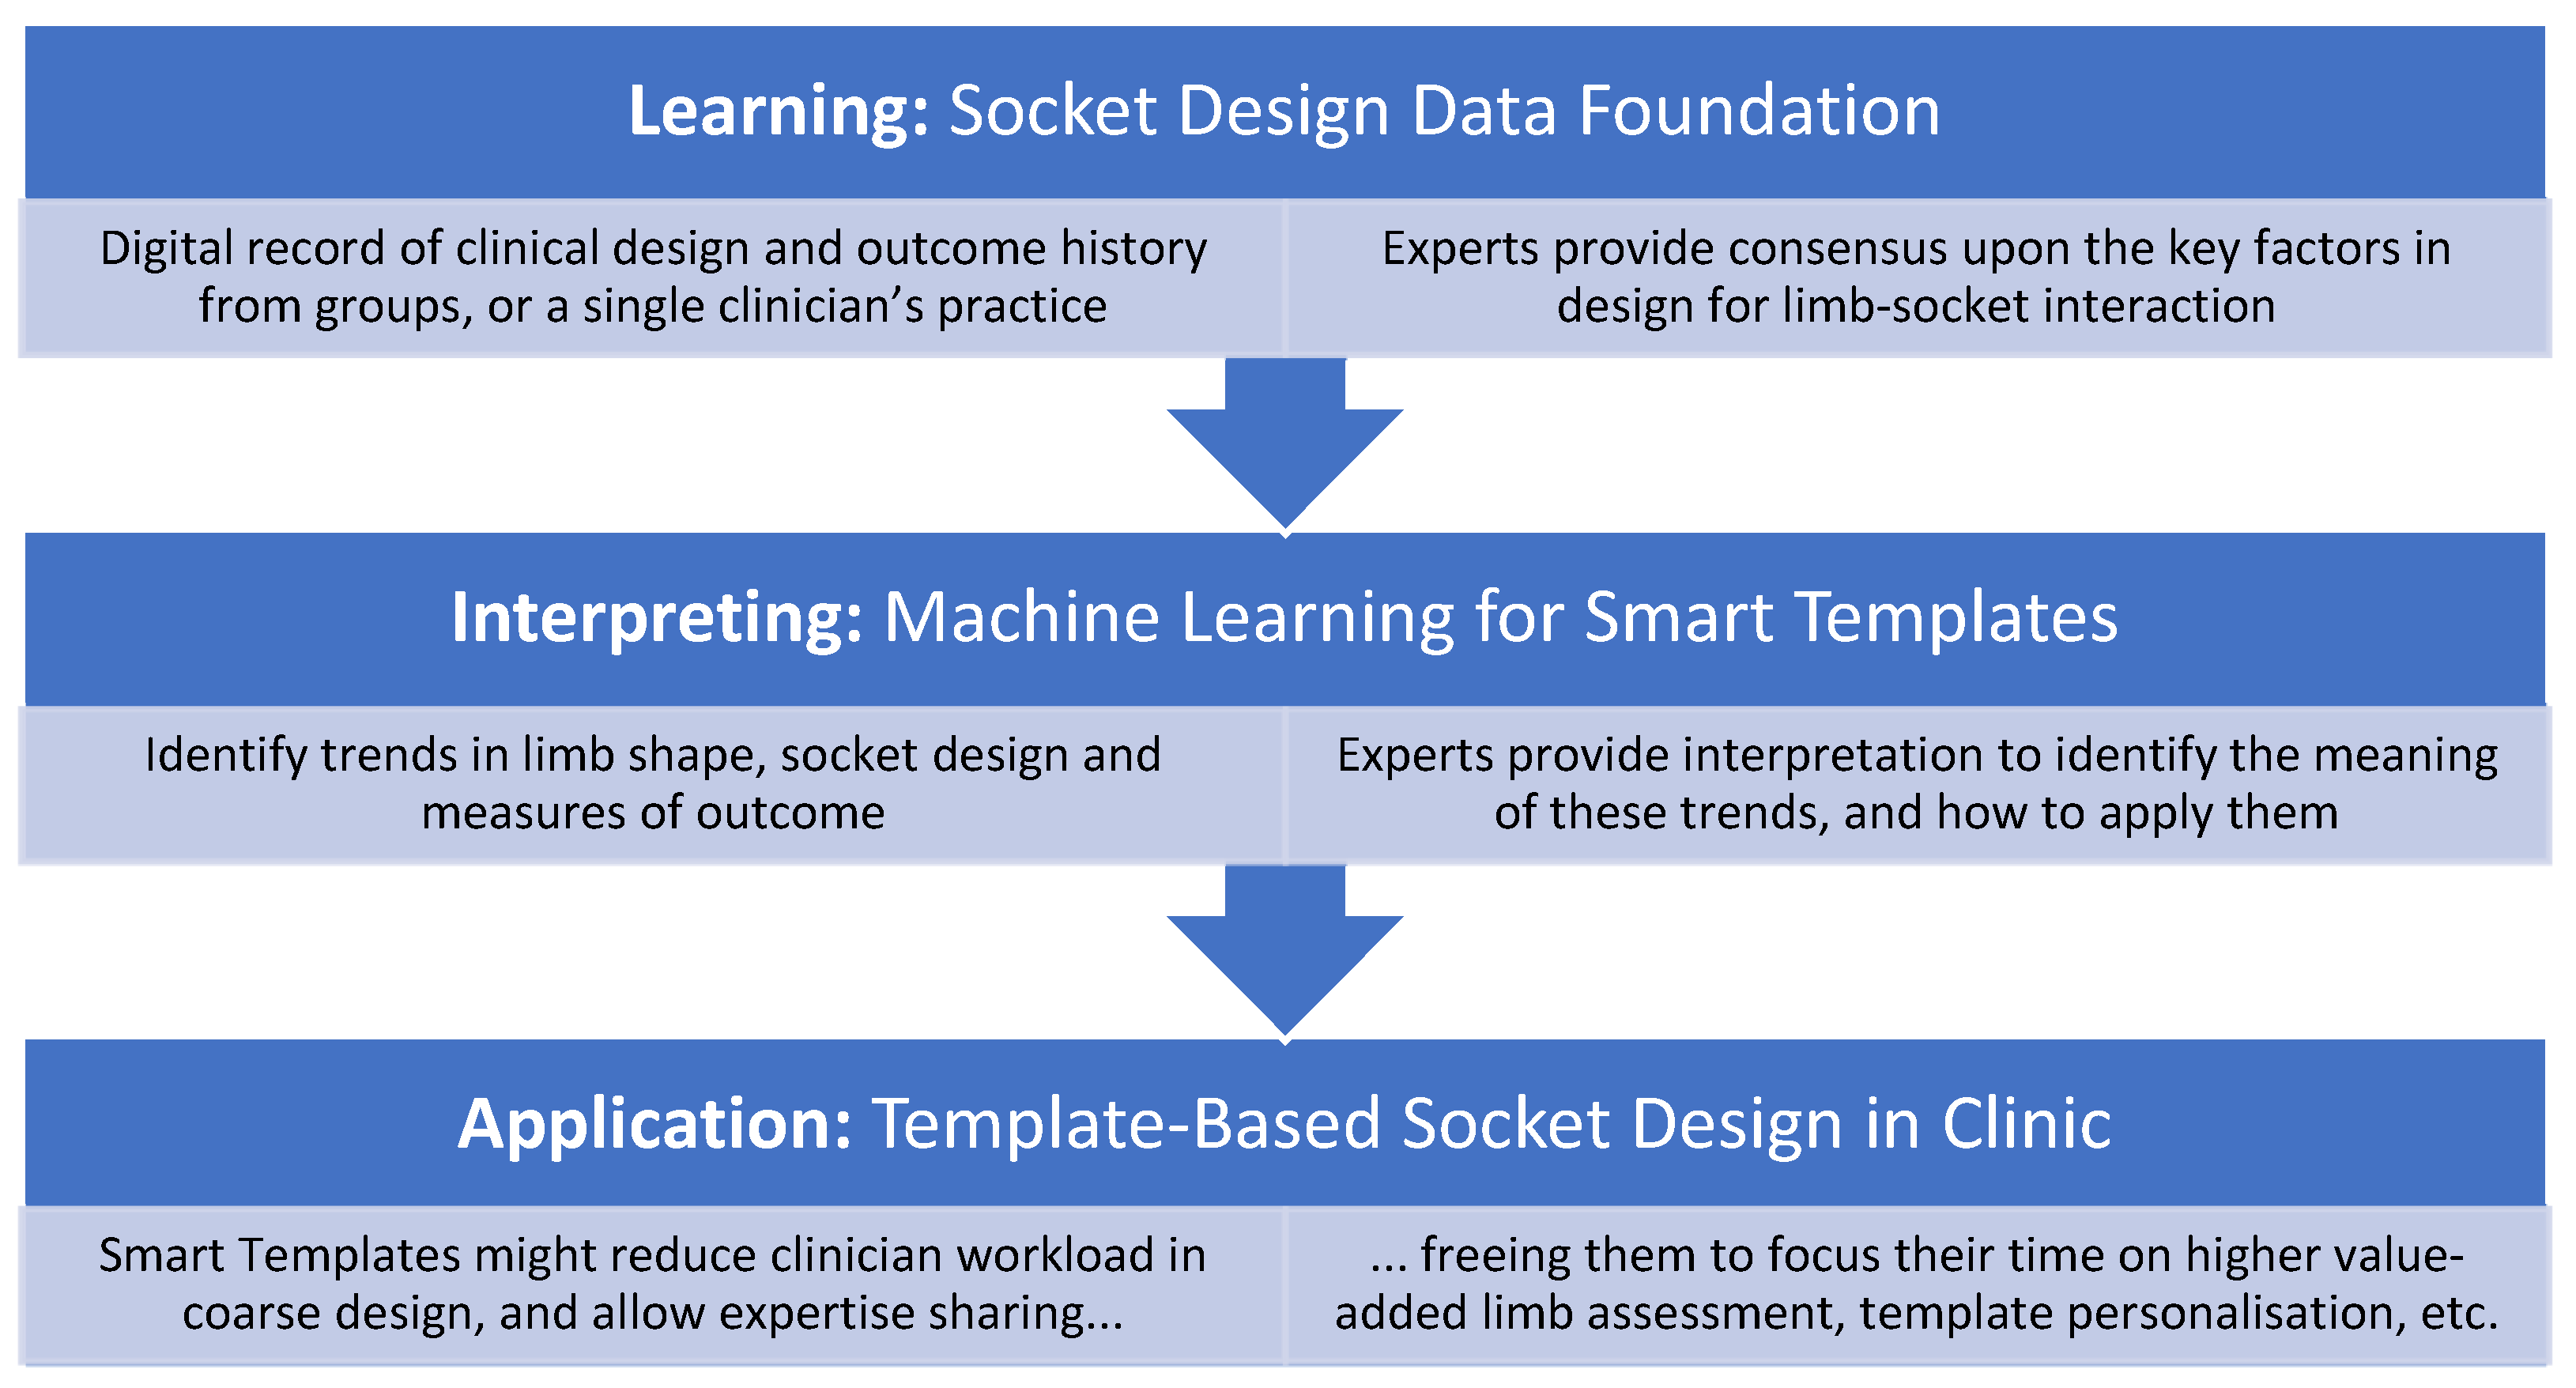
Figure 1. Proposed process overview for developing and using smart templates as part of expert-informed, evidence-based socket design. Instead of automating design at the expense of clinicians, the proposal includes the experts in each stage of development and clinical use.
Prosthesis 03 00027 g001
Figure 2. Example limb shapes plotted with rectification design field from aligned, registered sockets, of PTB (top) and TSB (bottom) design approaches. Rectifications are labelled as PT (patella tendon), TC (tibial crest), DAT (distal anterior tibia), DE (distal end), LP (lateral paratibial), MP (medial paratibial), FH (fibula head), MSC (medial supracondylar), LSC (lateral supracondylar), and PF (popliteal fossa). The images also label the trim line (TL).
Prosthesis 03 00027 g002
Figure 3. K-means clustering method for identifying and measuring local rectifications. The socket curvature and rectification maps are taken as inputs (a) and mapped onto 244 × 244-pixel 2D arrays (b). K-means clustering is used to identify regions of pixels representing design features (c). These are clustered, and desired features are classified using their shape and location, labelled (d), and finally mapped back onto the 3D socket shape (e).
Prosthesis 03 00027 g003
Figure 4. Cumulative mode variance graphs (ac) and leave-one-out (LOO) error graphs (de) for statistical limb shape model (SLM, a,d), statistical socket design model (SDM, b,e) and statistical limb shape and socket design model (SLDM, c,f) cases.
Prosthesis 03 00027 g004
Figure 5. First five mode variations for the Statistical Shape Model (SSM), showing ±2 standard deviation shapes either side of the mean. Shape variation observations (Obs) are labelled.
Prosthesis 03 00027 g005
Figure 6. First five mode variations for the statistical design model (SDM), showing the 2.5th and 97.5th percentile shapes. Rectification map units: mm. Design variation Observations are labelled.
Prosthesis 03 00027 g006
Figure 7. First five mode variations for the statistical limb shape and socket design model (SLDM), showing mean ±2 standard deviation shapes. Rectification map units: mm.
Prosthesis 03 00027 g007
Figure 8. Histograms of local rectification sizes across the training population for (a) patella tendon, (b) fibula head, (c) medial and (d) lateral paratibial, and (e) distal end design features as mapped on the (f) 3D socket shape. −ve denotes buildup; +ve denotes carve.
Prosthesis 03 00027 g008
Table 1. Descriptions and proportional variance in shape and/or design described by the first five modes in each model.
Mode No.Mode Variance and Description for Each Statistical Model
Limb Shape (SLM)Socket Design (SDM)Limb Shape and Socket Design (SSDM)
1(85%) Size and length:
long/large to small/short
(35%) PTB to TSB with distal tip space(83%) Large and PTB to small and TSB
2(8.3%) Bulky to slender
soft tissue
(25%) PTB with distal tip space to TSB(8.2%) Bulky and PTB to slender and TSB
3(2.5%) Angle of knee,
abducted to adducted
(8.5%) PTB to TSB with fibula head rectns.(2.5%) Abducted to
adducted knee
4(1.1%) Sagittal profile,
conical to bulbous
(5.1%) PTB to TSB with patella tendon and anterior tibia rectns.(1.1%) Profile:
conical PTB to bulbous TSB
5(0.6%) Coronal profile,
conical to bulbous
(3.9%) Internal–external rotation of tibia(0.7%) Profile:
bulbous PTB to conical TSB
Table 2. Prevalence of each rectification, and accuracy of classification by k-means clustering.
RectificationPTFHMPLPDE
Prevalence, %10082949791
Classification, %100939996100
Table 3. Training dataset shape and socket design measures.
MeasureWhole Group
(n = 67)
PTB Group
(n = 55)
TSB Group
(n = 12)
Residual Limb Anatomy: normally distributed: mean (s.d.)
Limb length, mm156 (29)157 (29)153 (31)
Perimeter at patella tendon, mm383 (40)383 (42)385 (34)
Perimeter at ½ limb length, mm366 (51)358 (55)355 (30)
Perimeter at ¾ limb length, mm327 (48)329 (52)315 (24)
Profile ratio at ½ limb length 10.95 (0.06)0.96 (0.06)0.92 (0.05)
Profile ratio at ¾ limb length 10.85 (0.07)0.86 (0.07)0.82 (0.04)
Abduction/adduction angle, °0.7 (1.9)0.7 (2.0)0.5 (1.6)
Gross Socket Sizing: normally distributed: mean (s.d.)
Overall volume reduction, %−1.9 (4.3)−1.6 (4.4)−3.1 (3.7)
Area reduction at patella tendon, %−4.1 (5.7)−3.8 (5.6)−5.6 (5.8)
Area reduction at ½ limb length, %−6.0 (4.5)−5.7 (4.2)−7.7 (5.4)
Area reduction at ¾ limb length, %−1.9 (5.8)−1.6 (5.8)−3.7 (5.5)
Local Socket Rectifications: non-normally distributed: median (10th–90th percentile range)
Patella tendon rect. depth, mm6.7 (4.2–9.0)6.7 (4.2–9.1)6.6 (3.8 –8.6)
Fibula head rect. height, mm−1.0 (−4.2–0.4)−1.6 (−4.4–0.4) *0.0 (−3.0–0.4) *
Medial paratibial rect. depth, mm4.3 (0.9–6.9)4.5 (1.2–6.9)3.8 (0.0–7.2)
Lateral paratibial rect. depth, mm4.9 (1.5–7.8)4.9 (2.8–7.9)3.5 (−0.2–8.7)
Distal end rect. height, mm−4.2 (−15.4–0.0)−4.1 (−14.4–0.0) −5.2 (−21.0–0.6)
1 Profile ratio of 1 is cylindrical, below 1 is conical, above 1 is bulbous. * indicates a statistically significant difference between PTB and TSB groups at the p < 0.05 level.
Publisher’s Note: MDPI stays neutral with regard to jurisdictional claims in published maps and institutional affiliations.