Global Ancestry and Cognitive Ability


1
Department of Economics, University of Minnesota Twin Cities, Minneapolis, MN 55455, USA
2
Department of Management, Cleveland State University, Cleveland, OH 44115, USA
3
Cleveland State University, Cleveland, OH 44115, USA
4
Ulster Institute for Social Research, London NW26 9LQ, UK
*
Author to whom correspondence should be addressed.
Psych 2019, 1(1), 431-459; https://doi.org/10.3390/psych1010034
Submission received: 8 June 2019
/
Revised: 26 August 2019
/
Accepted: 28 August 2019
/
Published: 30 August 2019
Abstract
:Using data from the Philadelphia Neurodevelopmental Cohort, we examined whether European ancestry predicted cognitive ability over and above both parental socioeconomic status (SES) and measures of eye, hair, and skin color. First, using multi-group confirmatory factor analysis, we verified that strict factorial invariance held between self-identified African and European-Americans. The differences between these groups, which were equivalent to 14.72 IQ points, were primarily (75.59%) due to difference in general cognitive ability (g), consistent with Spearman’s hypothesis. We found a relationship between European admixture and g. This relationship existed in samples of (a) self-identified monoracial African-Americans (B = 0.78, n = 2,179), (b) monoracial African and biracial African-European-Americans, with controls added for self-identified biracial status (B = 0.85, n = 2407), and (c) combined European, African-European, and African-American participants, with controls for self-identified race/ethnicity (B = 0.75, N = 7,273). Controlling for parental SES modestly attenuated these relationships whereas controlling for measures of skin, hair, and eye color did not. Next, we validated four sets of polygenic scores for educational attainment (eduPGS). MTAG, the multi-trait analysis of genome-wide association study (GWAS) eduPGS (based on 8442 overlapping variants) predicted g in both the monoracial African-American (r = 0.111, n = 2179, p < 0.001), and the European-American (r = 0.227, n = 4914, p < 0.001) subsamples. We also found large race differences for the means of eduPGS (d = 1.89). Using the ancestry-adjusted association between MTAG eduPGS and g from the monoracial African-American sample as an estimate of the transracially unbiased validity of eduPGS (B = 0.124), the results suggest that as much as 20%–25% of the race difference in g can be naïvely explained by known cognitive ability-related variants. Moreover, path analysis showed that the eduPGS substantially mediated associations between cognitive ability and European ancestry in the African-American sample. Subtest differences, together with the effects of both ancestry and eduPGS, had near-identity with subtest g-loadings. This finding confirmed a Jensen effect acting on ancestry-related differences. Finally, we confirmed measurement invariance along the full range of European ancestry in the combined sample using local structural equation modeling. Results converge on genetics as a potential partial explanation for group mean differences in intelligence.
1. Introduction
The European-American (EA) and African-American (AA) populations have been found to differ in mean general cognitive ability (or general intelligence, g) by about one standard deviation [1,2,3]. This difference exists even though the heritability of intelligence is both high and virtually identical in the European and African-American populations [4]. Likewise, the shared and unshared environmental components of variance in g are similar in these groups. These findings, in conjunction with others (see, e.g., [2,5]), have led some to propose the existence of a non-trivial genetic influence on group differences in cognitive ability (e.g., [2,6,7,8,9]).
Researchers have devised various methods to assess the causality behind these differences [10,11]. Examples include transracial adoption studies [12,13] (for a review, see [14,15]), analysis of differential regression to the mean [7,16,17], investigations of Spearman’s hypothesis [18,19,20], biometric decomposition of mean group differences [2,21], studies of multiracial persons [11,22], and various intra- and cross-national comparisons [8].
Some researchers have proposed the use of admixture analysis to assess the relationship between genetic ancestry and cognitive ability [10,23,24,25]. The premise of this approach is that among admixed population’s individuals possessing different proportions of genetic ancestry from different populations will be more or less similar to members of these populations if they derive a greater or lesser proportion of their genetic ancestry from them. This simple genetic model predicts that individual resemblance to a given group mean in various outcomes (e.g., height, appearance, intelligence) will be a function of that individual’s ancestry derived from that group [24,26]. When a difference in the level of some trait is observed between groups, an admixture analysis can provide indirect evidence that genetics plays a role in the difference.
A number of older studies have attempted to assess the relationship between ancestry and cognitive ability in admixed populations. Most of these studies, however, used indirect measures of ancestry, such as self-reports, genealogical records, or indices based on physical features like hair texture or skin color. These measures do not constitute objective or reliable indices of ancestry. As such, they show substantial measurement error and may thus be prone to giving inaccurate results. This may be especially true when the measures are based on phenotypic indicators of ancestry, as these are confounded with potentially biasing variables like discrimination, or cross-assortative mating for specific traits [1,2,27].
The above problem is common to all classical admixture studies. In addition to uncertainty regarding the extent of admixture, these studies also tend to suffer from small sample sizes, lack of replication, distinctly unrepresentative sampling, and young age at assessment [28]. The issue of age at assessment can be severe, as one of the most well-replicated findings about the behavior genetics of intelligence is that heritability tends to increase with age (this has been dubbed the Wilson effect; [29]). As heritability rises, the shared environmental component of traits like intelligence tends to become insignificant [30,31]. If individuals from different races are reared in similar environments, typically observed differences in cognitive ability may not emerge until adulthood due to these shared environments masking them in childhood.
Modern DNA-based methods of assessing admixture are available, and with them researchers can generate accurate point estimates of individual ancestry from many different groups. Genomic admixture analysis has already proven to be a useful technique for investigating the causes of group differences in a variety of traits. For example, Becker et al. (2011) [32] found that among Central African Pygmies, non-Pygmy admixture was associated with greater height. After the initial association between admixture and a trait is found to be robust, other methods like local admixture mapping are available to determine the specific genes and mechanisms behind group differences. Several authors (see, e.g., [33,34,35,36]) have applied these techniques to Pygmies, finding that the Pygmy/non-Pygmy stature gap can be traced in part to specific differences in immune and neuroendocrine functioning.
Admixture analysis has been applied to many other traits, including diabetes [37,38,39], hypertension [40], adaptation to high altitudes [41], asthma [42], sleep depth [43], risk of prostate cancer [44,45,46,47], and uterine fibroids [48]. These studies generally find that admixture relates to the trait under investigation above and beyond covariates. Sometimes, however, the inclusion of putative environmental covariates, like diet or socioeconomic status (SES), removes the association with ancestry (e.g., [49]). This suggests either that environmental covariates mediate the associations between ancestry and outcomes or that ancestry is a non-causal correlate of the trait in question that’s actually caused by something else. This suggests either that environmental covariates mediate the associations between ancestry and outcomes or that ancestry is a non-causal correlate of the trait in question that’s actually caused by something else if the mediation is not spurious. Ultimately, controls alone cannot establish causality [50].
Four studies we know of have related genetically-assessed ancestry to cognitive ability in samples of African-Americans [24,25,51,52]. Others have done this for Hispanic Americans [24,25] and various groups in Latin America [53,54,55]. Of these, the earlier ones [51,52,53,54] relied on ancestry estimates derived from blood groups. The use of blood groups has been criticized on the grounds that they are unable to reliably assess global ancestry [11,27].
A recent study by Kirkegaard et al. [24] focused on the relationship between genetic ancestry and g. The authors analyzed the multisite Pediatric Imaging, Neurocognition, and Genetics (PING) dataset. They found that European ancestry was associated with g among both self-identified African and Hispanic Americans (respectively, r = 0.20, N = 225; r = 0.23, N = 328; Tables S10–S11). They assessed genetic ancestry with 15,000 SNPs, making their index highly-reliable [56]. Ancestry explained both the full gap between African and European-Americans and most of the gap between Hispanic and European-Americans in g. However, the analysis had a few shortcomings. First, it was based on relatively small samples. Second, the heritability of g was unknown. Since the sample comprised children (with a mean age of 12 years) this is potentially concerning due to the Wilson effect. Third, strict factorial invariance (SFI) was not established so it cannot be unequivocally said that the group differences in g were measurement invariant. (In our supplementary materials we show that SFI along with the strong version of Spearman’s hypothesis hold in the PING data.) Fourth, the sample was geographically dispersed. Such geographic dispersion could lead to spurious correlations between ancestry and cognitive ability [57], though the location of the MRIs did not affect estimates. Finally, as the authors note, no measure of skin color was included in the study, opening up the results to confounding by phenotype-based discrimination.
These results have been replicated in a preregistered study relating European ancestry to cognitive ability in a sample of African and Hispanic Americans (r = 0.297, N = 193, [25]). This sample was composed of adults, and used 27 items from the International Cognitive Ability Resource Team [58] as a cognitive ability measure. This analysis also had shortcomings. For one, it was on a relatively small sample of individuals recruited online through Qualtrics (an online pollster) and participants self-reported their ancestry (as assessed by commercial DNA testing services such as Ancestry.com or 23andMe), opening these up to reporting error and bias due to differences in admixture estimates from different companies. Additionally, SES was not measured. Moreover, as with Kirkegaard et al. [24], the heritability in this sample is unknown, there was no measure of skin color, and the sample was geographically dispersed.
The purpose of the present study is to conduct an admixture analysis capable of addressing the aforementioned problems with previous studies. We focus on African and European-Americans because the former represent a population substantially admixed with the latter. Generally, African-Americans have around 20% European DNA [37,59,60,61,62]. Provided that our African-American sample is sufficiently variable in terms of European admixture, we should be able to detect whether an association exists between cognitive ability and admixture from the two parent populations (i.e., Africans and Europeans) and, if so, to what degree genetic admixture mediates the observed mean difference between the groups. Moreover, if the samples are representative of their respective populations (and statistical power is sufficient), a finding of no association would indicate that an evolutionary-genetic explanation of the gap is unlikely [26,63].
The present work uses a population-representative Philadelphia-based sample, the Philadelphia Neurodevelopmental Cohort (PNC), otherwise known as the Trajectories of Complex Phenotypes study (TCP). Due to the location, the results are directly comparable to those of Scarr et al. [52]. Our analysis has numerous advantages compared to earlier admixture studies. First, participants all came from the same location, so geographic confounding is not an issue. Second, we assessed measurement invariance (MI) for the cognitive test battery using multi-group confirmatory factor analysis (MGCFA; [64]). Third, the heritabilities of the g factor and subtest scores have already been estimated for this sample. Specifically, Mollon et al. [65] reported heritabilities for g of 0.61 (standard error (S.E.) = 0.14) and 0.72 (S.E. = 0.07) for the non-Hispanic African and European-Americans in this sample respectively. Fourth, we included estimates of skin, hair, and eye color to evaluate phenotypic discrimination (i.e., colorism) models of the observed differences. Fifth, we validated polygenic scores (PGS) associated with cognitive ability for both the African- and European-American samples and we examined to what extent cognitive ability- and education-related PGS (eduPGS), could account for group differences. Sixth, we tested for Jensen effects in relation to ancestry, heritability, and eduPGS. Seventh, we examined whether MI was tenable across the full range of European ancestry using local structural equation modeling (LSEM).
2. Materials and Methods
The TCP study was originally intended to evaluate behavioral dimensions predicting risk of mental illness [66,67]. The total sample includes data from 9421 genotyped participants assessed primarily from 2010 to 2013. Demographically, the sample was 51.7% female, 55.8% European-American, 32.9% African-American, and 11.4% Other, with a mean age of 14.2 (standard deviation (SD) = 3.7) years of age. Participants were recruited from the Philadelphia area. Persons with severe cognitive or medical impairments were excluded from the final sample. The subjects were English-speaking people aged 8–21 years at the time of testing. Access to the data was obtained through dbgap (phs000607.v3.p2) via Bryan J. Pesta.
2.1. Cognitive Ability
Participants were administered the Penn Computerized Neurocognitive Battery (PCNB; [68]). This battery was built to be highly-reliable, psychometrically-robust, and to incorporate tasks linked to specific brain systems. The PCNB consists of 14 tests grouped into five broad behavioral domains: Executive Control, Episodic Memory, Complex Cognition, Social Cognition, and Sensorimotor Speed. The tests in the battery are as follows: Penn Conditional Exclusion Test (PCET; meant to assess Mental Flexibility), Penn Continuous Performance Test (PCPT; Attention), Letter N-Back Task (LNB; Working Memory), Penn Word Memory Task (PWMT; Verbal Memory), Penn Face Memory Task (PFMT; Face Memory), Visual Object Learning Test (VOLT; Spatial Memory), Penn Verbal Reasoning Test (PVRT; Language Reasoning), Penn Matrix Reasoning Test (PMRT; Nonverbal Reasoning), Penn Line Orientation Test (PLOT; Spatial Ability), Penn Emotion Identification Test (PEIT; Emotion Identification), Penn Emotion Differentiation Test (PEDT; Emotion Differentiation), Motor Praxis Test (MP; Sensorimotor Speed), Finger Tapping (Tap; Sensorimotor Speed), and the Penn Age Differentiation Test (PADT; Age Differentiation). The sample also completed the Wide Range Achievement Test (WRAT), which is a highly-reliable broad ability measure [67].
Approximately 1.4% of the cognitive data were missing. We excluded individuals who did not have data for at least half the tests (n = 115). We imputed values for the remaining cases using IRMI (iterative robust model-based imputation) [69,70]. This left us with complete cognitive data for 3,067 African- and 5,076 European-Americans. Since we are only concerned with African and European-Americans in this study we report results only for these groups. We residualized cognitive test variables for age and sex using a natural spline model.
In order to ensure this battery was unbiased, we followed the theoretical configuration reported by Moore et al. (2016) [68] and performed an MGCFA [64,71,72] with our two groups being self-identified African- and European-Americans. The group factors we used were Executive Functioning (EF), Episodic Memory (EM), and Complex Reasoning (CR). The tests which loaded onto these factors were the LNB, PCET, PCPT (EF), PFMT, PWMT, VOLT (EM), WRAT, PVRT, PLOT, and PMAT (CR). We attempted, alternatively a five factor model but the Social Cognition (PEIT, PEDT, PADT) and Sensorimotor Speed (MP, Tap) factors had low loadings and identification issues so we removed these tests.
The three-factor baseline model was found to fit well in both groups and the addition of a bifactor g considerably improved model fit. SFI was found for this model. The strong and contra forms of Spearman’s hypothesis [2] were rejected but the weak model fit the data well. Our constraint for testing the weak model was to set the episodic memory factor mean to 0 while the other group factor means were freed. The resulting mean differences appear in Table 1.
These results accord with previous analyses (e.g., [2,73]) in that there is a nearly one d difference in cognitive ability between African and European-Americans and that this difference is concentrated on the g factor. The model without constraints for Spearman’s hypothesis shows that (net of the g factor) there is an African-American advantage in executive functioning and episodic memory. This replicates patterns found in prior studies (e.g., [18,73]). The MGCFA results are discussed more fully in the Supplementary Materials. For the admixture analysis, we used g scores since differences were primarily relegated to this factor.
2.2. Parental Socioeconomic Status
Only paternal and maternal education were available to us as measures of SES. We coded parental education as the average of each, both z-scored first. When data were only available from one parent this value was used. The final score was then z-scored again. This variable was used as a control for SES in our admixture regressions but because we were unable to factor analyze a variety of SES measures and extract a more reliable indicator [74] the control can only be regarded as partial. With this noted, parental education has been found to be more important than wealth in shaping children’s intelligence [75]. The effect of SES as a background variable in our MGCFA is investigated in our Supplementary Materials.
2.3. Self-Identified Race/Ethnicity (SIRE)
Subjects chose their self-identified race/ethnicity (SIRE) based on yes/no questions wherein it was possible to select multiple races or ethnicities. The choices were: Black or African-American; American Indian or Alaskan Native; Asian; European-American; Hispanic/Latino; Native Hawaiian/Pacific Islander; Other; and Not Available/Pending Validation. We coded European-American following standard procedures: subjects who selected the European-American option only and did not report being Hispanic. African-American was coded the same way. Finally, we coded subjects who selected both European- and African-American as biracial African-European-American (AA|EA). We then filtered subjects with different identifications, reducing the sample size from an initial N of 9496 to 8580. Of the included participants, there were 5183 European-Americans, 3155 African-Americans, and 242 biracial African-European-Americans.
2.4. Genetic Ancestry Percentages
Satterthwaite et al. [76] described the genotyping of the PNC dataset. Briefly, the participants were genotyped on six different arrays from two different manufacturers. The different arrays covered different variants. As such, it was necessary to impute them to obtain large, overlapping sets of single nucleotide polymorphisms (SNPs). We imputed the dataset using the Michigan Imputation Server (https://imputationserver.sph.umich.edu/index.html) with the Minimac3 imputation algorithm, 1000G Phase 3 v5 as reference panel, and Eagle v2.3 Phasing. In total, 15.5 M variants were available for analysis. To reduce computation time, we filtered these to variants with a minor allele frequency (MAF) of at least 0.05 in the subset of interest (i.e., the combined sample of European and African-Americans). That is, we selected only variants for which the second-most common alleles occurred in the population at a frequency of 0.05 or higher. This screening left 6. 5M variants to compute genetic ancestry percentages. Note, this was only done in the context of computing admixture scores. We did not filter for MAF when computing color scores, as we did not want to lose variants that affected them. These operations were done using PLINK v1.90b6.8 [77]. To estimate individual global ancestry we used ADMIXTURE version 1.3.0 D.H. [78]. Since we were only concerned with European and African-Americans, we ran ADMIXTURE with k = 2 genetic clusters. Some subjects either had no genotypes available or their data failed quality control. Thus, the final sample size was reduced to 7399. Consistent with previous research (e.g., [59], SIRE is strongly associated with genetic ancestry. This can be seen in Figure 1 which shows the probability of identifying with a particular SIRE group as a function of European admixture.
2.5. Skin, Hair, and Eye Color
The data did not include measures of appearance, so we opted to impute these based on genotypes. We used the HIrisPlex-S web application to do this (https://hirisplex.erasmusmc.nl/). This application was developed by the U.S. Department of Justice for use in forensic investigations. It imputes skin, hair, and eye color probabilities with a high degree of accuracy based on 41 SNPs (with overlapping variants; 6 for eye color, 22 for hair color, and 36 for skin color). This tool has been validated on thousands of people from diverse regions of the world [79].
We focus on skin color since this trait is given primacy by colorist theorists (e.g., [80,81]) and because we were able to calculate skin color scores for a larger subsample than for hair or eye color. HIrisPlex-S gives probabilities of the Fitzpatrick Scale skin type (i.e., Type I, scores 0–6, “palest, freckles”; Type II, scores 7–13; Type III-IV (combined), scores 14–27; Type V, scores 28–34; Type VI, scores 35–36, “deeply pigmented dark brown to darkest brown”). We weighted the medium score of each Type (e.g., Type I = 3) by the probability of each type in order to create a single color measure. Unfortunately, because of the poor tagging of the relevant variants in some of the arrays, the imputed phenotypes were only available for a subset of the data (N = 7321 with cognitive ability and ancestry, versus N = 5533 with cognitive ability, ancestry, and skin color). By this scale, higher scores indicate darker colors.
The correlation between our imputed color score and European ancestry was −0.87 for the combined sample (N = 5585) and −0.39 for the African-Americans only sample (N = 1557). Figure 2 shows the regression plot for skin color and European ancestry, with SIRE groups marked in red (African-American), green (biracial African-European-American), and blue (European-American). The correlation found among African-Americans is similar to those previously reported (r’s 0.25 to 0.71; median: ~0.50) for African-Americans and other groups of African descent [56,61,82,83]. Furthermore, the predicted skin color values matched the expected values on the Fitzpatrick scale. The mean score for European-Americans was 14.70, placing them in category III (i.e., sometimes mild burn, tans uniformly) bordering on category II (i.e., usually burns, tans minimally), and for African-Americans, 30.96, placing them in category V (very rarely burns, tans very easily).
2.6. Cognitive Ability-Related Polygenic Scores
We scored the genomes using PLINK v1.90b6.8 [77] based on the genome-wide association study (GWAS) results for educational attainment reported in Lee et al. [84]. We constructed four different PGS based on the relative trade-off between differential linkage disequilibrium (LD) decay bias and the within-population signal. For background, a PGS “represents an aggregation, usually in the form of a sum, of the estimated effect sizes of the genetic variants in the genome” [85]. LD is the non-random association of alleles at different loci in a particular population. LD decay is the breakdown of this association between divergent populations. LD decay bias is bias in PGS—which are calculated based on both causal variants and variants in linkage with causal and non-causal ones—due to populations having different patterns of associations between variants and sites that are nearby (or in linkage).
First, we used the eduPGS with all variants trained without the 23andMe cohort (n = 7,762,369 SNPs overlapping in the present dataset) to construct a predictor with good within-population validity but very high LD decay bias [86,87]. Second, we used the multi-trait analysis of genome-wide association study (MTAG) eduPGS 10k SNPs (n = 8442 overlapping variants) to construct a predictor with good within-population validity but high LD decay bias. The MTAG eduPGS were PGS computed using MTAG. This is a method for analyzing statistics from genome-wide association study (GWAS) on different but genetically correlated traits (e.g., education and intelligence). Third, we used the MTAG eduPGS lead SNPs to construct an eduPGS with moderate within-population validity and LD decay bias (n = 1558 overlapping variants). The lead SNPs are the ones which had the most-significant association with education/intelligence within each cluster of LD-associated SNPs. The reasoning is that because SNPs with lower p-values (i.e., greater statistical significance) are more likely to be causal [88], and because causal SNPs are more likely to be transethnically valid [86,89], using SNPs with a higher significance may increase the transethnic validity of eduPGS [90]. Fourth, we used Lee et al.’s [84] putatively causal variants to construct an eduPGS with minimal LD decay bias and low within-population validity (n = 111 overlapping variants).
3. Results
3.1. Descriptive Statistics
Table 2 shows descriptive statistics for all groups. AA|EAs were primarily European (80%) in ancestry. Correspondingly, they were closer to the EA means on SES, g, and color. The AA/EA g difference was d = 0.984 (IQEA = 100 versus IQAA = 85.28, with the biracial group scoring in-between at 97.96), while the SES difference was d = 0.99 and the difference in color was d = 3.60.
3.2. Bivariate Relationships among the Variables
Correlations between g, parental SES, genetic ancestry, and SIRE group appear in Table 3 and Table 4. Correlations are as expected based on the cognitive and SES differences between different SIRE groups and the strong correlation between genetic ancestry and SIRE. However, this bivariate analysis is not very informative as outcomes are confounded with non-genetic causes and ancestry variables are negatively correlated by design since individual ancestry must sum to one. The relationship between parental SES and cognitive ability is likely stronger here than is typically reported (see [91]; r = 0.29) because we used both parents’ education and a latent cognitive ability measure which reduces error that would normally attenuate the strength of this relationship.
The correlations between cognitive ability and both color and African ancestry are highest in the combined African-, African-European-, and European-American sample, intermediate in the combined mono- and bi-racial African-American sample, and lowest in the monoracial African-American sample. The difference in the magnitudes of the correlations is a result of the first sample having the most variability in ancestry and the last sample having the least. This difference is mostly a statistical artifact of restriction of range, which attenuates correlations [92].
3.3. Regression Analyses
Our primary focus is whether genetic ancestry predicts cognitive ability. The rationale for the analysis has been explained in detail by Kirkegaard et al. [24]. In order to determine if this is the case, we constructed a series of regression models. These models were applied to the African-American and the combined African-, European-, and biracial African-European-American sample. Restricting the first analysis to SIRE African-Americans approximates the methodology used by Scarr et al. [52]. Our initial analysis used European ancestry (EUR) as the independent variable. We then added skin color to test discrimination (i.e., colorism) and other appearance-based hypotheses. Finally, we added SES to assess the effect of familial environmental influences on the observed gap, noting again that these measures are genetically confounded.
To provide results that can be easily compared across groups and studies, we standardize all values except European ancestry and then report the unstandardized beta coefficients. Doing so leaves only ancestry unstandardized. This allows one to interpret the beta coefficient for ancestry as a change in a standard deviation of cognitive ability over a change of 100% European ancestry. Following Kirkegaard et al. [24], we do not report standardized betas (except in Table 5 for illustration), because, in the context of the effect of ancestry on outcomes, these are difficult to compare across groups. This difficulty arises because groups differ substantially in their variability in ancestry and its effects. As such, a change of one standard deviation of ancestry from one group has a substantially different meaning than the same from another group.
In models that only included monoracial African-Americans, we found that European ancestry was always strongly and significantly related to cognitive ability. Skin color (assessed genetically with the highly accurate predictor [79,93] was associated with cognitive ability (Model 1b, Table 5), but made no significant incremental contribution when ancestry was also in the model (Model 2, Table 5). Results could still be due to phenotypic confounding from other appearance variables. To test this possibility, we fitted a number of models including skin, hair, and eye color. We found that none of these features had significant effects on their own, except for brown eye color, which was positively related to cognitive ability, but with a large standard error. These results are shown in the R notebook. The last monoracial African-American model (Model 3, Table 5) included SES, which had a considerable effect on cognitive ability. However, the so-called sociologist’s fallacy [2,5] may be at play here. That is, controlling for parental SES also controls for genetic effects on SES which may be shared with cognitive ability.
As an alternative to the model with only monoracial African-Americans, we next included both individuals who identified as monoracial African- and biracial African-European-American. This is equivalent to the “broadly-defined” African-American group used by Kirkegaard et al. [24]. These results are shown in Table 6. In Model 2, with self-identified European-American race (which, in this case, indicates biracial status) as a covariate, the beta for European ancestry (BEUR = 0.85; n = 2407) was comparable although slightly higher than that for the monoracial African-American sample (BEUR = 0.78; n = 2179).
Comparing Model 2 and Model 3b, biracial status had a significant effect independent of European ancestry. This could be due to selective patterns of self-identification, whereby choosing to report that one is a European-American, regardless of one’s genetic ancestry, is associated with greater cognitive ability. This appears to have been the case as evidenced by Figure 3, which shows the relationship between European ancestry and cognitive ability. Being above the regression line was associated with a greater likelihood of biracial African-European self-identification regardless of one’s actual ancestry. Whatever the case, unlike with self-reported European-American race, skin color did not have significant predictive validity independent of European ancestry. The comparison between Model 3a and Model 3b shows that the inclusion of ancestry reduced the effect of color from highly significant to non-significant (Bcolor = −0.25 in 3a and Bcolor = −0.06 in 3b, n = 1,690). As in the models for monoracial AAs, the inclusion of parental SES reduced, but did not eliminate, the effect of European ancestry (Model 4).
The next set of models utilized the whole sample of African, European, and biracial African-European-Americans. These results appear in Table 7. The first model revealed a substantial impact of European ancestry on cognitive ability. The next model found the same, but also produced a significant effect of SIRE European-American (but not SIRE African-American) self-identification. That is, some incremental validity existed which was associated with self-identification as European-American and this did not occur for self-identification as African-American. The next model included physical appearance in the form of skin color. As with the African-American-only and the combined African- and biracial African-European-American sample, this variable had no significant effect on cognitive ability in the full sample with ancestry included (Model 3b). Our final model included SES. The inclusion of SES reduced the effect of SIRE European-American, although it still remained significant. Nonetheless, in this model, European ancestry was the dominant determinant of cognitive ability. The effect of SES on cognitive ability was essentially the same in the full sample as it was in the monoracial African-American model. The fact that the effect of SIRE European-American weakened with the inclusion of SES is perhaps notable, as it may imply that selective self-identification as European-American is driven in part by social processes. It is clear here though that self-identification and other-identifiable physical characteristics are much less important as determinants of cognitive ability than is genetic ancestry.
Cumulatively, European ancestry was consistently positively related to cognitive ability in all models. SES was similarly related to cognitive ability. European-American SIRE also had a significant effect independently of genetic ancestry, indicating that differences were not wholly explained by ancestry. Skin color was not significantly related to cognitive ability in any of our models which included genetic ancestry. However, it was related to cognitive ability in models not including ancestry, as found in previous studies [17,94,95,96] (for a review of older studies, see [1]).
Recent immigrants from Africa in the sample may have affected the scores reported here as migrants may have been selected for cognitive ability when they emigrated from their home countries. As such, we conducted a robustness test by rerunning the analyses excluding individuals with one percent or less European ancestry. This exclusion did not substantially affect the results (reported in the R notebook, Model 17b). Thus, confounding due to migration likely did not influence our findings.
3.4. Cognitive Ability and Education-Related Polygenic Scores (eduPGS)
We examined the validity of four cognitive ability and education-related PGSs reported by Lee et al. [84]. The eduPGS were derived from European populations. First, we used the eduPGS based on all variants trained without the 23andme cohort (n = 7,762,369 variants overlapping in the present dataset). The goal was to construct a predictor with good within-discovery population (European, in this case) validity, but very high LD decay bias, and thus low transethnic validity. Second, we used MTAG eduPGS with 10k variants (n = 8442 overlapping variants) to construct a predictor with good within-discovery population validity and reduced LD decay bias. Third, we used the MTAG eduPGS lead SNPs (n = 1558 overlapping variants) to see if we could reduce LD decay bias and increase transethnic validity while retaining within-discovery population validity. Finally, we used the putatively causal variants (N = 111 overlapping variants in our dataset) to construct an eduPGS with minimal LD decay bias, but low within-discovery population validity. At some point, screening SNPs based on p values may lead to lower validity in both the discovery population and other-ethnic populations, despite having relatively high transethnic validity [90]. The goal is to identify PGS which have both high within-discovery population and transethnic validities.
The correlations with g are shown in Table 8, with results for European-Americans above the diagonal and results for (monoracial) African-Americans below. Since the PNC is independent from the samples analyzed by Lee et al. [84], the results for European-Americans constitute an independent replication of those reported by Lee et al. [84]. This may be of interest to some because our dependent variable was a good measure of g.
Of the PGS, the MTAG_10k PGS had the highest validity in both the European-American and African-American samples, although the validity for African-Americans was reduced by 51%. The results for MTAG_10k and MTAG eduPGS lead SNPs correlated highly with one another (r > 0.80) in both the African- and European-American samples. These eduPGS also had similar relationships with cognitive ability.
As expected, the GWAS eduPGS had high within-source population validity but low transethnic validity. While significant in the African-American sample, the validity was only 0.044/0.225 = 20% of that in the European-American sample. This low transethnic validity occurred because the 7,762,369 variants in conjunction with high LD decay produced considerable noise. Due to being based on only 111 overlapping variants, the putatively causal eduPGS had low validity within both samples but had the highest relative transethnic validity: 0.031/0.058 = 54%.
Consistent with theory [90], the eduPGS with the highest validity in both the African- and European-American samples was the MTAG_EA_10K (r = 0.112 & r = 0.227, respectively). As such, in the following analyses, we restricted consideration to these scores. While retaining some validity in the African-American sample, the MTAG_10k eduPGS showcased predictive bias. Indeed, a Fisher r-to-z Test showed that the differences in the correlations for African and European-Americans was highly significant (z = −4.6, p < 0.01). This difference is illustrated in Figure 4, which shows the regression plot for eduPGS and g for European (red) and African-Americans (blue).
The slope of the regression line and the intercepts for the African-American sample are both lower. As Zanetti & Weale [86] note, differences in SNP predictivity could be due to (1) lack of statistical power, (2) allele frequency differences, (3) linkage disequilibrium, or (4) differences in true causal variant effect sizes/directions. These authors suggest that the last explanation is generally not necessary. Regardless, a combination of these factors could lead to PGS bias in favor of Europeans (or Africans). There are a number of possible ways in which such bias could have arisen. For example, imagine the case for more recent polymorphisms. These more recent polymorphisms will probably have a higher frequency in the discovery population. If recent selection favored IQ-promoting variants and purged IQ-reducing variants, the more recent polymorphisms will be IQ-promoting, which will result in bias in favor of the discovery population. There is some evidence of an increase in PGS over time [97]. Of course, the reverse would be true, if recent selection disfavored high IQ alleles. However, given that most mutations are deleterious [98], if the PGS contain a large number of recent variants it is likely that they’ll be biased against their discovery populations. For disease phenotypes, Kim, Patel, Teng, Berens, & Lachance [99] showed how this bias can function and found that correcting for differences in derived vs. ancestral polymorphisms can improve the transracial predictivity of PGS. In a supplementary analysis, conducted to address a reviewer’s point, we did not find evidence of a substantive (or even statistically significant) effect of young vs. old polymorphisms. Thus, the concern raised regarding bias due to polymorphism age (e.g., [99]) does not seem to be a problem in this case and so we did not create polymorphism age-corrected PGS.
Table 9 shows eduPGS means and standard deviations for African, biracial African-European, and European-Americans. The eduPGS difference is large at d = 1.89 and it is larger than the phenotypic gap in g. This would be expected even if the PGS were unbiased given the imperfect relationship between PGS and g. Beyond this and possible bias in the PGS, another possibility is that the PGS differences between groups are primarily in common variants, while the differences between individuals within groups are in both common variants and rare variants that arose recently by mutations and which are under mutation-selection balance. Given this scenario, PGS which indexed mostly common variants between populations would manifest as reduced phenotypic differences even assuming consistent validity.
The association between eduPGS (MTAG_10k) and g in the African-American sample could, in principle, result from confounding with environmental factors. This could be an indirect effect of the association between g and European ancestry or, alternatively, color. Alternatively, the variants in the eduPGS could be “chopstick genes” [100] which have a statistical but no causal effect. If eduPGS were merely indexing European ancestry, one would expect the GWAS eduPGS (which is based on more than 7 million additional variants) to exhibit an association as high as the one we found with MTAG_EA_10k eduPGS. This is because the GWAS_eduPGS, with its greater number of variants, is likely to be a better index of ancestry. This does not appear to be the case. Regardless, to explore this possibility further, we ran regression models with European ancestry (Model 1b) and color scores (Model 2b) for the monoracial African-American and combined African-, European-, and biracial African-European-American samples. The results are shown in Table 10 and Table 11 respectively.
Adjusting for European ancestry does not reduce the validity of eduPGS in the African-American sample (Table 10; Model 1b), nor does controlling for skin color. In fact, the validity here increases slightly relative to that found among European-Americans. Table 12 shows the regression results for European-Americans (Model 2). Comparing the monoracial African-American SIRE beta (Model 1b, Table 10) to the European-American beta (Model 2, Table 12) gives an African-American validity 52% the size of the European-American validity.
If we take the beta of 0.124 in the AA-only sample (Model 1b, Table 10) as an estimate of the LD-unbiased effect of eduPGS on g, the g-score differences due to eduPGS would be 0.124 × 1.89 (i.e., the Cohen’s d for the African-/European-American eduPGS difference) = 0.23. This implies that 20%–25% of the difference in g can be accounted for by presently known cognitive ability- and education-related PGS.
Concerns have been raised that the eduPGS computed by Lee et al. [84] may be biased against non-Europeans due to the inclusion of population-specific variants [101] (for a more general discussion see [99]). These population-specific variants would have very low frequency in non-European populations. Following Piffer’s suggestion [101], as a robustness check, we computed MTAG eduPGS excluding variants with MAF < 0.01 (leaving 7636 overlapping variants) and <0.05 (leaving 7172 overlapping variants) among African lineages. The 1000 Genomes reference samples were used to determine the African MAF. This exclusion had no substantive effect on the eduPGS validity with respect to g for either African or European-Americans. For SIRE monoracial African-Americans rMAF ≥ 0.01 = 0.112 and rMAF ≥ 0.05 = 0.114.
Theory predicts that, in the absence of countervailing confounds, variants which show concordant as opposed to discordant effects across racial groups, will exhibit higher validity in non-discovery populations (Piffer, personal communication, February 3, 2019; [90]). This is because variants which show transracially concordant effects are more likely to be causal and also because causal variants, as opposed to variants in LD with causal ones, are more likely to have transethnic predictivity [89,102]. These predictions are borne out in this sample. Among European-Americans, the predictivity for concordant MTAG_10k eduPGS was higher (rconcordant = 0.223 vs. rdiscordant = 0.145), and among African-Americans, it was even more so (rconcordant = 0.223 vs. rdiscordant = -0.128). Similarly, when we grouped variants by the p value for the interaction between race and the effect on g (with higher p values signifying less discordance in effect), among African-Americans, the variants with higher p values were substantially more predictive of g (rhigh_P = 0.141 vs. rlow_P = 0.035), while among European-Americans, this was not the case (rhigh_P = 0.265 vs. rlow_P = 0.263). Cross-validation confirmed that the concordant PGS had higher predictive validity among the non-discovery population. However, the concordant PGS subset did not seem to have higher predictivity, based on cross-validation, than the combined set. The identical validity for concordant PGS could not be sustained in cross-validation. Thus, we do not use these disaggregated PGS in further analysis.
3.5. Path Analysis
Finally, we depict our results in path model form. As seen in Figure 4, substantial differences exist in the transethnic validity of the eduPGS. We therefore limited our path analysis to monoracial African-Americans. The model was run with the lavaan R package with missing data handled using listwise deletion. (Missing color scores were not MCAR, so we did not impute data.) Results are shown in Figure 5. We leave European ancestry unstandardized, as in previous analyses, while the other variables were standardized. Thus, the total effect of European ancestry on cognitive ability is calculated as (1) the unstandardized path coefficient between European ancestry and cognitive ability (B = 0.512) plus (2) the unstandardized path between European ancestry and color times the standardized path coefficient between color and cognitive ability (−2.209 × −0.066 = 0.146) plus (3) the unstandardized path between European ancestry and eduPGS multiplied by the standardized path coefficient between eduPGS and cognitive ability (2.515 × 0.131 = 0.329).
Table 13 shows the estimates for the different paths. From the table, while European ancestry and eduPGS had significant effects, color did not (although it was trending toward significance, p = 0.12). Additionally, the covariance between color and eduPGS was not significant. The association between European ancestry and g is more substantially mediated by the cognition-related eduPGS than by color scores. An analysis of the effect of color within sibling pairs is included in the supplement but the results are extremely tentative due to a lack of statistical power and the unconfirmed validity of our measure of color.
3.6. The Spearman–Jensen Hypothesis
Spearman’s hypothesis holds that racial differences in cognitive ability are largely the result of differences in g. This theory predicts a strong positive correlation between subtest g loadings and the vector of group differences. We test this theory using Jensen’s method of correlated vectors (MCV; [2]) by examining the correlation between the vector of g loadings, the vector of subtest heritability, and four vectors of group differences. The vector of g loadings is the g loadings for the 10 subtests found to be MI for African and European-Americans. The vector of heritability is the average of the African- and European-American heritabilities reported by Mollon et al. [65]. The vectors of group differences were: (1) the correlation with European ancestry (for the combined sample), (2) the correlation with MTAG 10K eduPGS for the European-American sample, (3) the correlation with MTAG 10k eduPGS for the monoracial African-American sample, and (4) the African-/European-American mean group differences. These results are shown in Table 14.
Spearman’s hypothesis is strongly confirmed in our data. Not only is there a large Jensen effect on European ancestry, there is an equally large Jensen effect for the subtest correlations with the MTAG eduPGS. The correlations with the heritabilities are also positive, although these were estimated based on small samples (as far as behavior genetics goes) and thus this vector correlation is downwardly biased. If one includes the remaining 5 subtests, the correlations are about the same magnitude.
3.7. Assessment of Measure Invariance with Respect to Ancestry
Initially, we confirmed that MI held between self-identified African- and European-Americans. However, it is also possible to examine if MI holds with respect to genetic ancestry using LSEM (see [103]). A finding of MI along the whole range of admixture would preclude many group-specific factors which are commonly proposed to explain potential admixture-ability or other admixture-outcome relationships.
We fit an LSEM on the full African- and European-American sample (n = 7399) using 21 focal points (i.e., 5% ancestry increments ranging from 0% to 100%). From 0% to 100% European ancestry there was no deviation from MI. While the mean levels in g and complex reasoning increased linearly, the mean levels in episodic memory and executive functioning decreased linearly. MI appears to be tenable across the whole range of ancestry and, as well, the relationship between latent abilities and genetic ancestry comport with Spearman’s hypothesis.
We additionally fitted LSEMs with SES. When standardized SES was modeled from its lowest to its greatest value, it showed measurement invariance but failed to account for the differences in the latent means between racial groups despite having a similar, albeit smaller, effect compared to European admixture when modeled as a background variable in the MGCFA model. The important takeaways from the LSEM results are that MI with respect to both SES and admixture is tenable, admixture can fully account for group mean differences in latent abilities while our present measure of SES cannot, and, as MI implies that the differences between groups on tests are due to differences in means and variances alone, this appears to be the case with admixture and race generally.
4. Discussion
We conducted an admixture study to assess the association between cognitive ability and European ancestry in the African- and European-American populations. Earlier researchers (e.g., [51,52]) were unable to detect significant relationships between ancestry and cognitive ability. We, however, found a strong, significant association between European genetic ancestry and cognitive ability, confirming the recent results of both Kirkegaard et al. [24] and Warne [25].
4.1. Global Admixture Analysis and Past Research Findings
The betas we calculated for European ancestry were very similar across models: B = 0.78 for the self-identified monoracial African-American-only sample (Model 1, Table 5) and B = 0.75 for the combined African- and European-American sample (with controls for SIRE; Model 2, Table 6). The former beta corresponds to a bivariate correlation of only r = 0.086 (N = 2179; Table 4). This small correlation is misleading as to its importance. The correlation is small in magnitude simply because the variation in European ancestry in the sample is low (or restricted). As Jensen [104] noted, constrained variability results in attenuated admixture correlations. Because of this, a small correlation within a population with restricted ancestry variance can be consistent with a large overall effect of admixture. For example, our African-American sample averaged 18.7% (SD = 11.7%) European ancestry. Compared with European-Americans (98.6%), this is a difference of (98.6%–18.7%)/11.7% = 6.83 standard deviations of European ancestry. Thus, the predicted difference in cognitive ability between African- and European-Americans (or, rather, African-Americans with the same amount of European ancestry as European-Americans in this sample), based on our observed bivariate association, would be r = 0.086 × 6.83 = 0.587 SD. This is relative to the African-/European-American difference of d = 0.984 in cognitive ability (from Table 1). Thus, this small r = 0.086 correlation is consistent with 60% of the mean difference being explained by genetic ancestry.
Note that the correlation Scarr et al. [52] found was 0.05/0.086 = 58% of the correlation we found. The attenuation in correlation is likely attributable to the reduced validity of their admixture index and the lower heritability of their measure of cognitive ability. Thus, our study largely vindicates Jensen’s [104] reanalysis of the Scarr et al. [52] data.
We found very large Jensen effects for both the African-/European-American difference (r = 0.929) and the association between ancestry and g loadings (r = 0.941). The finding of a Jensen effect on ancestry is also consistent with the results presented by Scarr et al. [52]. As Loehlin [105] seems to have implied, the association between admixture and ability in the Scarr et al. [52] sample comported with the typical weak form of Spearman’s hypothesis in that European ancestry was positively related (r = 0.1) with Raven’s Progressive Matrices scores and negatively related (r = −0.12) with a memory measure. Indeed, using average g loadings provided by Jensen [19] (cf. [106]) the correlation between the African-/European-American score differences and g loadings is r = 0.64, while the correlation between the African-American-only g loadings and the score differences between the most- and least-African in this group is r = 0.84.
The only other study which has examined Spearman’s hypothesis in the context of intra-SIRE ancestry-related differences is Hu et al. [18]. The authors studied participants from the National Longitudinal Survey of Youth 1997. Among African-Americans, Hu et al. [17]) found that darker color was associated with lower g scores while parent-reported European ancestry was associated with higher g scores. Jensen effects were found for both indices of ancestry. It seems that Spearman’s hypothesis generalizes to ancestry-related differences within self-identified racial groups.
Our study goes beyond those of Kirkegaard et al. [24]) and Warne [25]) in that we (as with Hu et al. [17]) established both SFI and the weak form of Spearman’s hypothesis regarding the African-/European-American difference. On the basis of this result we conclude that the SIRE differences in this battery are typically-sized and consistent with prior investigations of ability patterns in African- and European-American samples. Because the test battery is unbiased and it assesses the same traits in both populations, the difference observed here is a real difference in the cognitive abilities being measured.
We go beyond Hu et al. [17] in that we included a measure of both color and genetic ancestry in our regression analyses. As predicted by the human capital model (Hu et al. [17], Prediction 7), we found that color had no incremental validity beyond ancestry. This lack of incremental validity for color is possibly due to power. Color scores were available for only a subset of individuals since several of the arrays did not include all the SNPs needed by the algorithm to compute the scores. Thus, we cannot completely rule out an incremental effect of color in the present dataset. We can, however, conclude that the association between European ancestry and g is not secondary to that between color and g.
It is worth noting that in the path model we did not find a significant association between skin color and eduPGS. This could be due to a lack of statistical power. This may, however, suggest a limited role for assortative mating (or, for that matter, pleiotropy), which has been suggested by some (e.g., [2]) in explaining the color-IQ association among African-Americans.
Beyond color, we also controlled for SES. Although not as strong of a predictor as ancestry, SES was a useful predictor of cognitive ability which modestly attenuated the effect of ancestry on cognitive ability. These results, however, are expected in both genetic and non-genetic models because environmental variables and familial characteristics like SES also reflect genetic influences [2,107,108]. Controlling for these variables may therefore spuriously weaken the overall association between ancestry and the relevant genetic factors that actually explain their influence. Conditions in which cross-sectional data reflect real mediation are exceptional [109] so future investigations should attempt to tease out causality with longitudinal designs and local admixture mapping. A particularly strong research design would be to investigate sibling variation in admixture just as Visscher et al. [110] did with relatedness. Very large samples are needed for this design if using full siblings; if data can be found using half- or adopted-siblings, then the required sample sizes would be more reasonable.
4.2. eduPGS Findings and Past Research
We also evaluated the transethnic validity of eduPGS. We found that the eduPGS with the highest validity for g in both the African- and European-American samples was the MTAG_EA_10K set. Although the validity in the African-American sample was approximately half of that in the European-American sample (rAA = 0.1115; rEA = 0.2269), the relations were statistically significant in both populations (p < 0.0001). As with Piffer [111] we found large African-/European-American differences in these eduPGS (d = 1.89). Using the beta in the African-American sample and controlling for the effect of European ancestry (B = 0.124; Model 1b; Table 10), we estimate that the known eduPGS can naïvely explain as much as 20%–25% of the African-/European-American intelligence gap.
Removing variants with low MAF in African 1000 Genomes lineages had little effect on the validity of MTAG_10K eduPGS among African and European-Americans. Thus, contrary to some arguments, European-specific alleles do not seem to be biasing prediction with eduPGS. Our results corroborate those of Piffer [111] who found a strong ecological correlation between MTAG-derived SNPs and population IQ (r = 0.86). We also found, using both regression and path analysis that, while the eduPGS mediates the association between European ancestry and cognitive ability, skin color scores do not.
4.3. Alternative Explanations and Methods to Further Reduce Uncertainty
At least one researcher has advanced the possibility that admixture designs are hopelessly confounded due to historical assortative mating [112]. This theory supposes that the European ancestors of African-Americans were genetically disposed toward either lower or higher cognitive ability in a systematic way. Since Piffer [111] found that other African descent groups have similarly low eduPGS, this explanation would necessitate that the eduPGS are not indexing genetic differences related to cognitive ability in African groups. Determining if this is the case is important for future research. We can directly investigate this hypothesis and further test the transethnic validity of the eduPGS with local admixture mapping. If the theory implied here is correct, European ancestry segments should have systematically higher or lower eduPGS in African-American samples. Relatedly, if eduPGS lack transethnic validity in Africans, they will not be associated with specific regions of the brain, biological variables, or consistent patterns of gene expression as they are in Europeans.
Our data are compatible with a between-group heritability (variance explained by European ancestry) of between 50% and 70% depending on the model chosen (see Scarr et al.,p. 85 [52]). This estimate of between-group heritability is consistent with Rushton and Jensen’s [9] hereditarian model, according to which 50%–80% of the African-/European-American cognitive difference is due to genetic differences.
While the statistical mediation by PGS scores suggests that genetic factors may be involved, as discussed in detail by Kirkegaard et al. [24], we cannot rule out many types of confounding environmental variables with this research design. Global admixture analysis results are suggestive and should only be considered a first step for investigating the effects of admixture on a trait. We suggest to attempt replication of the current results using a nationally representative sample and then, if these findings are confirmed, proceed to admixture mapping (local admixture analysis). This is the standard approach taken in medical epidemiology.
We suggest two approaches to further reduce the uncertainty regarding the causes of the African-/European-American cognitive ability gap. First, attempts should be made to replicate the current results using other samples (e.g., the Add Health study; [64]). Second, local ancestry analysis/admixture mapping to examine the regions of the genome where the association with ancestry is most pronounced are a natural follow-on project. The rationale of such an analysis has been explained by others (e.g., [17,24,113,114]). It would also be worthwhile to attempt to replicate these results in admixed American populations outside of the United States (e.g., Brazil, Colombia, etc.). This research project can and should be expanded to other ethnic groups both in and outside of the United States. Examples include Aborigines in Australia, Cape Coloureds in South Africa, and the Mestizo population in Mexico. For some groups, it may be of utility to examine differences in broad abilities (e.g., spatial or mathematical ability) instead of general ability as done here, as differences may not be general.
4.4. General Conclusion
Rushton and Jensen [9] called for modern genetic studies to test the hereditarian model. They predicted that “for those Black individuals who possess more White genes, their physical, behavioral, and other characteristics will approach those of Whites” ([9], p. 262). In the present study, we confirmed that this was the case for general cognitive ability. Moreover, we showed that the association between European ancestry and g was substantially mediated by eduPGS rather than skin color PGS. These results provide support for a hereditarian model.
We conducted several analyses aimed at testing a genetic hypothesis for the African-/European-American difference in cognitive ability. We found that European ancestry was a consistent predictor of cognitive ability, even after entering various controls into our models. The large observed eduPGS differences were capable of predicting substantial proportions of the cognitive ability gap, which suggests the possibility of mediation. Future assessments with cross-racially valid PGS should attempt to assess this possibility more clearly. Our global admixture-based results suggest a contribution of admixture to the African-/European-American cognitive ability gap and should encourage future investigations at the level of local admixture.
Supplementary Materials
The following are available online at https://www.mdpi.com/2624-8611/1/1/34/s1.
Author Contributions
Conceptualization, J.L., J.F., E.K.; methodology, J.L., E.K., B.P., J.F.; software, J.L. and E.K.; validation, J.L. and E.K.; formal analysis, J.L., E.K., B.P., and J.F.; investigation, J.L. and E.K.; resources, J.F. and B.P.; data curation, J.F. and B.P.; writing—original draft preparation, J.L.; writing—review and editing, J.L., E.K. and J.F.; visualization, J.L.; supervision, B.P.
Funding
This research received no external funding.
Acknowledgments
Gur, Hakonarson, and collaborators request that publications resulting from these data cite their original publication: [TBD]. Support for the collection of the data sets was provided by grant RC2MH089983 awarded to Raquel Gur and RC2MH089924 awarded to Hakon Hakonarson. All subjects were recruited through the Center for Applied Genomics at The Children’s Hospital in Philadelphia. dbGaP accession phs000607.v1.p1.
Conflicts of Interest
The authors declare no conflict of interest.
References
- Shuey, A. The testing of Negro Intelligence; Social Science Press: New York, NY, USA, 1996. [Google Scholar]
- Jensen, A.R. The g Factor: The Science of Mental Ability; Praeger Publishers/Greenwood Publishing Group: Westport, CT, USA, 1998. [Google Scholar]
- Roth, P.L.; Bevier, C.A.; Bobko, P.; Switzer, F.S.; Tyler, P. ETHNIC GROUP DIFFERENCES IN COGNITIVE ABILITY IN EMPLOYMENT AND EDUCATIONAL SETTINGS: A META-ANALYSIS. Pers. Psychol. 2001, 54, 297–330. [Google Scholar] [CrossRef] [Green Version]
- Pesta, B.P.; Kirkegaard, E.O.; te Nijenhuis, J.; Fuerst, G.R. Racial and Ethnic Group Differences in the Heritability of Intelligence: A Systematic Review and Meta-Analysis. 2019; Manuscript submitted for publication. [Google Scholar]
- Sesardic, N. Making Sense of heritability; Cambridge University Press: Cambridge, UK, 2005. [Google Scholar]
- Jensen, A.R. How much can we boost IQ and scholastic achievement? Harv. Educ. Rev. 1969, 39, 1–123. [Google Scholar] [CrossRef]
- Jensen, A.R. Educability and Group Differences, 1st U.S. ed.; Harper & Row: New York, NY, USA, 1973. [Google Scholar]
- Lynn, R. Race Differences in Intelligence: An Evolutionary Analysis Second Revised Edition; Washington Summit Books: Augusta, GA, USA, 2015. [Google Scholar]
- Rushton, J.P.; Jensen, A.R. Thirty years of research on race differences in cognitive ability. Psychol. Public Policy Law 2005, 11, 235–294. [Google Scholar] [CrossRef]
- Jensen, A.R. Reducing the heredity-environment uncertainty. Harv. Educ. Rev. 1969, 39, 449–483. [Google Scholar] [CrossRef]
- Rowe, D.C. Under the skin: On the impartial treatment of genetic and environmental hypotheses of racial differences. Am. Psychol. 2005, 60, 60–70. [Google Scholar] [CrossRef] [PubMed]
- Scarr, S.; Weinberg, R.A. Intellectual similarities within families of both adopted and biological children. Intelligence 1977, 1, 170–191. [Google Scholar] [CrossRef]
- Weinberg, R.A.; Scarr, S.; Waldman, I.D. The Minnesota transracial adoption study: A follow-up of IQ test performance at adolescence. Intelligence 1992, 16, 117–135. [Google Scholar] [CrossRef]
- Turkheimer, E. Individual and group differences in adoption studies of IQ. Psychol. Bull. 1991, 110, 392–405. [Google Scholar] [CrossRef]
- Thomas, D. Racial IQ Differences among Transracial Adoptees: Fact or Artifact? J. Intell. 2017, 5, 1. [Google Scholar] [CrossRef] [PubMed]
- Murray, C. The Secular Increase in IQ and Longitudinal Changes in the Magnitude of the Black-White Difference: Evidence from the NLSY. In Proceedings of the Behavior Genetics Association Meeting, Vancouver, BC, Canada, 4 July 1999. [Google Scholar]
- Hu, M.; Lasker, J.; Kirkegaard, E.O.; Fuerst, J.G. Filling in the Gaps: The Association between Intelligence and Both Color and Parent-Reported Ancestry in the National Longitudinal Survey of Youth 1997. Psych 2019, 1, 240–261. [Google Scholar] [CrossRef] [Green Version]
- Jensen, A.R. The nature of the black–white difference on various psychometric tests: Spearman’s hypothesis. Behav. Brain Sci. 1985, 8, 193–219. [Google Scholar] [CrossRef]
- McDaniel, M.A.; Kepes, S. An Evaluation of Spearman’s Hypothesis by Manipulating g Saturation. Int. J. Sel. Assess. 2014, 22, 333–342. [Google Scholar] [CrossRef]
- Nijenhuis, J.T.; Hoek, M.V.D.; Dragt, J. A Meta-Analysis of Spearman’s Hypothesis Tested on Latin-American Hispanics, including a New Way to Correct for Imperfectly Measuring the Construct of g. Psych 2019, 1, 101–122. [Google Scholar] [CrossRef]
- Rowe, D.C.; Cleveland, H.H. Academic achievement in Blacks and Whites: Are the developmental processes similar? Intelligence 1996, 23, 205–228. [Google Scholar] [CrossRef]
- Loehlin, J.C.; Lindzey, G.; Spuhler, J.N. Cross-group Comparisons of Intellectual Abilities. In Race Differences in Intelligence; Freeman: San Francisco, CA, USA, 1975; pp. 170–171. [Google Scholar]
- Shockley, W. Possible transfer of metallurgical and astronomical approaches to problem of environment versus ethnic heredity. Science 1966, 154, 148. [Google Scholar]
- Kirkegaard, E.O.W.; Menie, M.W.O.; Williams, R.L.; Fuerst, J.; Meisenberg, G. Biogeographic Ancestry, Cognitive Ability and Socioeconomic Outcomes. Psych 2019, 1, 1–25. [Google Scholar] [CrossRef]
- Warne, R.T. Genetic Ancestry and Cognitive Ability. 2019; Manuscript submitted for publication. [Google Scholar]
- Templeton, A.R. The Genetic and Evolutionary Significance of Human Races. In Race and Intelligence: Separating Science from Myth; Fish, J.M., Ed.; Routledge: Abingdon, UK, 2001. [Google Scholar]
- Reed, T.E. “The genetic hypothesis”: It was not tested but it could have been. Am. Psychol. 1997, 52, 77–78. [Google Scholar] [CrossRef]
- Rushton, J.P.; Jensen, A.R. Race and IQ: A Theory-Based Review of the Research in Richard Nisbett’ s Intelligence and How to Get It. Open Psychol. J. 2010, 3, 9–35. [Google Scholar] [CrossRef]
- Bouchard, T.J. The Wilson Effect: The increase in heritability of IQ with age. Twin Res. Hum. Genet. 2013, 16, 923–930. [Google Scholar] [CrossRef]
- Bouchard, T.J.; McGue, M. Genetic and environmental influences on human psychological differences. J. Neurobiol. 2003, 54, 4–45. [Google Scholar] [CrossRef]
- Briley, D.A.; Tucker-Drob, E.M. Explaining the Increasing Heritability of Cognitive Ability Across Development: A Meta-Analysis of Longitudinal Twin and Adoption Studies. Psychol. Sci. 2013, 24, 1704–1713. [Google Scholar] [CrossRef] [PubMed]
- Becker, N.S.; Verdu, P.; Froment, A.; Le Bomin, S.; Pagezy, H.; Bahuchet, S.; Heyer, E. Indirect evidence for the genetic determination of short stature in African Pygmies. Am. J. Phys. Anthr. 2011, 145, 390–401. [Google Scholar] [CrossRef] [PubMed] [Green Version]
- Jarvis, J.P.; Scheinfeldt, L.B.; Soi, S.; Lambert, C.; Omberg, L.; Ferwerda, B.; Froment, A.; Bodo, J.-M.; Beggs, W.; Hoffman, G.; et al. Patterns of Ancestry, Signatures of Natural Selection, and Genetic Association with Stature in Western African Pygmies. PLoS Genet. 2012, 8, e1002641. [Google Scholar] [CrossRef] [PubMed]
- Romero, I.G.; Leavesley, M.; Sherman, B.T.; Siddle, K.; Kaitokai, E.; Babalu, A.; Belatti, M.; Hopkinshaw, B.; Shaw, C.; Nelis, M.; et al. Evolution of the Pygmy Phenotype: Evidence of Positive Selection from Genome-wide Scans in African, Asian, and Melanesian Pygmies. Hum. Biol. 2013, 85, 251. [Google Scholar]
- Pemberton, T.J.; Verdu, P.; Becker, N.S.; Willer, C.J.; Hewlett, B.S.; Le Bomin, S.; Froment, A.; Rosenberg, N.A.; Heyer, E. A genome scan for genes underlying adult body size differences between Central African hunter-gatherers and farmers. Hum. Genet. 2018, 137, 487–509. [Google Scholar] [CrossRef]
- Perry, G.H.; Foll, M.; Grenier, J.-C.; Patin, E.; Nedelec, Y.; Pacis, A.; Barakatt, M.; Gravel, S.; Zhou, X.; Nsobya, S.L.; et al. Adaptive, convergent origins of the pygmy phenotype in African rainforest hunter-gatherers. Proc. Natl. Acad. Sci. USA 2014, 111, E3596–E3603. [Google Scholar] [CrossRef] [PubMed] [Green Version]
- Cheng, C.-Y.; Reich, D.; Haiman, C.A.; Tandon, A.; Patterson, N.; Elizabeth, S.; Akylbekova, E.L.; Brancati, F.L.; Coresh, J.; Boerwinkle, E.; et al. African Ancestry and Its Correlation to Type 2 Diabetes in African Americans: A Genetic Admixture Analysis in Three U.S. Population Cohorts. PLoS ONE 2012, 7, e32840. [Google Scholar] [CrossRef]
- Williams, R.C.; Long, J.C.; Hanson, R.L.; Sievers, M.L.; Knowler, W.C. Individual Estimates of European Genetic Admixture Associated with Lower Body-Mass Index, Plasma Glucose, and Prevalence of Type 2 Diabetes in Pima Indians. Am. J. Hum. Genet. 2000, 66, 527–538. [Google Scholar] [CrossRef] [Green Version]
- Florez, J.C.; Price, A.L.; Campbell, D.; Riba, L.; Parra, M.V.; Yu, F.; Duque, C.; Saxena, R.; Gallego, N.; Tello-Ruiz, M.; et al. Strong association of socioeconomic status with genetic ancestry in Latinos: Implications for admixture studies of type 2 diabetes. Diabetologia 2009, 52, 1528–1536. [Google Scholar] [CrossRef]
- Kosoy, R.; Qi, L.; Nassir, R.; Garcia, L.; Allison, M.; Shigeta, R.; Seldin, M.F. Relationship between hypertension and admixture in post-menopausal African American and Hispanic American women. J. Hum. Hypertens. 2012, 26, 365–373. [Google Scholar] [CrossRef]
- Jeong, C.; Alkorta-Aranburu, G.; Basnyat, B.; Neupane, M.; Witonsky, D.B.; Pritchard, J.K.; Beall, C.M.; Di Rienzo, A. Admixture facilitates genetic adaptations to high altitude in Tibet. Nat. Commun. 2014, 5, 3281. [Google Scholar] [CrossRef] [PubMed]
- Flores, C.; Ma, S.-F.; Pino-Yanes, M.; Wade, M.S.; Pérez-Méndez, L.; Kittles, R.A.; Wang, D.; Papaiahgari, S.; Ford, J.G.; Kumar, R.; et al. African Ancestry Is Associated with Asthma Risk in African Americans. PLoS ONE 2012, 7, e26807. [Google Scholar] [CrossRef] [PubMed]
- Halder, I.; Matthews, K.A.; Buysse, D.J.; Strollo, P.J.; Causer, V.; Reis, S.E.; Hall, M.H. African Genetic Ancestry is Associated with Sleep Depth in Older African Americans. Sleep 2015, 38, 1185–1193. [Google Scholar] [CrossRef] [Green Version]
- Freedman, M.L.; Haiman, C.A.; Patterson, N.; McDonald, G.J.; Tandon, A.; Waliszewska, A.; Penney, K.; Steen, R.G.; Ardlie, K.; John, E.M.; et al. Admixture mapping identifies 8q24 as a prostate cancer risk locus in African-American men. Proc. Natl. Acad. Sci. USA 2006, 103, 14068–14073. [Google Scholar] [CrossRef] [Green Version]
- Gudmundsson, J.; Sulem, P.; Manolescu, A.; Amundadottir, L.T.; Gudbjartsson, D.; Helgason, A.; Rafnar, T.; Bergthorsson, J.T.; Agnarsson, B.A.; Baker, A.; et al. Genome-wide association study identifies a second prostate cancer susceptibility variant at 8q24. Nat. Genet. 2007, 39, 631–637. [Google Scholar] [CrossRef] [PubMed]
- Yeager, M.; Orr, N.; Hayes, R.B.; Jacobs, K.B.; Kraft, P.; Wacholder, S.; Minichiello, M.J.; Fearnhead, P.; Yu, K.; Chatterjee, N.; et al. Genome-wide association study of prostate cancer identifies a second risk locus at 8q24. Nat. Genet. 2007, 39, 645–649. [Google Scholar] [CrossRef]
- Han, Y.; Rand, K.A.; Hazelett, D.J.; Ingles, S.A.; Kittles, R.A.; Strom, S.S.; Rybicki, B.A.; Nemesure, B.; Isaacs, W.B.; Stanford, J.L.; et al. Prostate Cancer Susceptibility in Men of African Ancestry at 8q24. J. Natl. Cancer Inst. 2016, 108, 431. [Google Scholar] [CrossRef]
- Giri, A.; Edwards, T.L.; Hartmann, K.E.; Torstenson, E.S.; Wellons, M.; Schreiner, P.J.; Edwards, D.R.V. African genetic ancestry interacts with body mass index to modify risk for uterine fibroids. PLoS Genet. 2017, 13, e1006871. [Google Scholar] [CrossRef] [PubMed]
- Paiva, S.G. Fatores de Risco Para Doenças Cardiovasculares em Quilombos Contemporâneos do Brasil Central: Parâmetros Demográficos, Socioeconômicos, Ancestralidade Genética e Saúde. Ph.D. Thesis, University of Brasília, Brasília, Brazil, 2017. [Google Scholar]
- Pearl, J. Causality: Models, Reasoning and Inference, 2nd ed.; Cambridge University Press: Cambridge, UK, 2012. [Google Scholar]
- Loehlin, J.C.; Vandenberg, S.G.; Osborne, R.T. Blood group genes and negro-white ability differences. Behav. Genet. 1973, 3, 263–270. [Google Scholar] [CrossRef]
- Scarr, S.; Pakstis, A.J.; Katz, S.H.; Barker, W.B. Absence of a relationship between degree of white ancestry and intellectual skills within a black population. Hum. Genet. 1997, 39, 69–86. [Google Scholar] [CrossRef] [PubMed]
- Rothhammer, F.; Llop, E. Amerindian descent and intellectual performance in Chilean university students. Hum. Biol. 1976, 48, 455–464. [Google Scholar] [PubMed]
- Valenzuela, C.Y.; Pastene, C.S.; Pérez, C.M. Intelligence and genetic markers in Chilean children. Biol. Res. 1998, 31, 81–92. [Google Scholar] [PubMed]
- Lima-Costa, M.F.; Macinko, J.; Mambrini, J.V.D.M.; Peixoto, S.V.; Pereira, A.C.; Tarazona-Santos, E.; Ribeiro, A.L.P. Genomic African and Native American Ancestry and Chagas Disease: The Bambui (Brazil) Epigen Cohort Study of Aging. PLoS Negl. Trop. Dis. 2016, 10, e0004724. [Google Scholar] [CrossRef] [PubMed]
- Ruiz-Linares, A.; Adhikari, K.; Acuña-Alonzo, V.; Quinto-Sanchéz, M.; Jaramillo, C.; Arias, W.; Fuentes, M.; Pizarro, M.; Everardo, P.; De Avila, F.; et al. Admixture in Latin America: Geographic Structure, Phenotypic Diversity and Self-Perception of Ancestry Based on 7342 Individuals. PLoS Genet. 2014, 10, e1004572. [Google Scholar] [CrossRef] [PubMed]
- Conley, D.; Fletcher, J. The Genome Factor: What the Social Genomics Revolution Reveals about Ourselves, Our History, and the Future; Princeton University Press: Princeton, NJ, USA, 2017. [Google Scholar]
- Condon, D.M.; Revelle, W. The international cognitive ability resource: Development and initial validation of a public-domain measure. Intelligence 2014, 43, 52–64. [Google Scholar] [CrossRef]
- Bryc, K.; Durand, E.Y.; MacPherson, J.M.; Reich, D.; Mountain, J.L. The Genetic Ancestry of African Americans, Latinos, and European Americans across the United States. Am. J. Hum. Genet. 2015, 96, 37–53. [Google Scholar] [CrossRef] [PubMed]
- Adhikari, K.; Chacón-Duque, J.C.; Mendoza-Revilla, J.; Fuentes-Guajardo, M.; Ruiz-Linares, A. The Genetic Diversity of the Americas. Annu. Rev. Genom. Hum. Genet. 2017, 18, 277–296. [Google Scholar] [CrossRef] [PubMed]
- Halder, I.; Shriver, M.; Thomas, M.; Fernandez, J.R.; Frudakis, T. A panel of ancestry informative markers for estimating individual biogeographical ancestry and admixture from four continents: Utility and applications. Hum. Mutat. 2008, 29, 648–658. [Google Scholar] [CrossRef] [PubMed]
- McQueen, M.B.; Boardman, J.D.; Domingue, B.W.; Smolen, A.; Tabor, J.; Killeya-Jones, L.; Mullan Harris, K. The National Longitudinal Study of Adolescent to Adult Health (Add Health) Sibling Pairs Genome-Wide Data. Behav. Genet. 2015, 45, 12–23. [Google Scholar] [CrossRef] [PubMed]
- Nisbett, R.E. Intelligence and How to Get It: Why Schools and Cultures Count; WW Norton & Company: New York, NY, USA, 2009. [Google Scholar]
- Dolan, C.V. Investigating Spearman’s Hypothesis by Means of Multi-Group Confirmatory Factor Analysis. Multivar. Behav. Res. 2000, 35, 21–50. [Google Scholar] [CrossRef] [PubMed]
- Mollon, J.; Knowles, E.E.M.; Mathias, S.R.; Gur, R.; Peralta, J.M.; Weiner, D.J.; Robinson, E.B.; Gur, R.E.; Blangero, J.; Almasy, L.; et al. Genetic influence on cognitive development between childhood and adulthood. Mol. Psychiatry 2018, 1, 1. [Google Scholar] [CrossRef]
- Calkins, M.E.; Merikangas, K.R.; Moore, T.M.; Burstein, M.; Behr, M.A.; Satterthwaite, T.D.; Ruparel, K.; Wolf, D.H.; Roalf, D.R.; Mentch, F.D.; et al. The Philadelphia Neurodevelopmental Cohort: Constructing a deep phenotyping collaborative. J. Child Psychol. Psychiatry 2015, 56, 1356–1369. [Google Scholar] [CrossRef]
- Satterthwaite, T.D.; Connolly, J.J.; Ruparel, K.; Calkins, M.E.; Jackson, C.; Elliott, M.A.; Roalf, D.R.; Hopson, R.; Prabhakaran, K.; Behr, M.; et al. The Philadelphia Neurodevelopmental Cohort: A publicly available resource for the study of normal and abnormal brain development in youth. NeuroImage 2016, 124, 1115–1119. [Google Scholar] [CrossRef] [PubMed]
- Moore, T.M.; Reise, S.P.; Gur, R.E.; Hakonarson, H.; Gur, R.C. Psychometric Properties of the Penn Computerized Neurocognitive Battery. Neuropsychology 2015, 29, 235–246. [Google Scholar] [CrossRef] [PubMed]
- Templ, M.; Kowarik, A.; Alfons, A.; Prantner, B. VIM: Visualization and Imputation of Missing Values (Version 4.8.0). 2019. Available online: https://CRAN.R-project.org/package=VIM (accessed on 1 January 2019).
- Templ, M.; Kowarik, A.; Filzmoser, P. Iterative stepwise regression imputation using standard and robust methods. Comput. Stat. Data Anal. 2011, 55, 2793–2806. [Google Scholar] [CrossRef]
- Dolan, C.V.; Hamaker, E.L. Investigating Black-White differences in psychometric IQ: Multi-group confirmatory factor analyses of the WISC-R and K-ABC and a critique of the method of correlated vectors. In Advances in Psychology Research; Nova Science Publishers: Hauppauge, NY, USA, 2001; Volume 6, pp. 31–59. [Google Scholar]
- Dolan, C.V.; Molenaar, P.C. Testing Specific Hypotheses Concerning Latent Group Differences in Multi-group Covariance Structure Analysis with Structured Means. Multivar. Behav. Res. 1994, 29, 203–222. [Google Scholar] [CrossRef]
- Frisby, C.L.; Beaujean, A.A. Testing Spearman’s hypotheses using a bi-factor model with WAIS-IV/WMS-IV standardization data. Intelligence 2015, 51, 79–97. [Google Scholar] [CrossRef]
- Vyas, S.; Kumaranayake, L. Constructing socio-economic status indices: How to use principal components analysis. Health Policy Plan. 2006, 21, 459–468. [Google Scholar] [CrossRef]
- Rindermann, H.; Ceci, S.J. Parents’ Education Is More Important Than Their Wealth in Shaping Their Children’s Intelligence: Results of 19 Samples in Seven Countries at Different Developmental Levels. J. Educ. Gift. 2018, 41, 298–326. [Google Scholar] [CrossRef]
- Satterthwaite, T.D.; Elliott, M.A.; Ruparel, K.; Loughead, J.; Prabhakaran, K.; Calkins, M.E.; Mentch, F.D. Neuroimaging of the Philadelphia neurodevelopmental cohort. Neuroimage 2014, 86, 544–553. [Google Scholar] [CrossRef]
- Chang, C.C.; Chow, C.C.; Tellier, L.C.; Vattikuti, S.; Purcell, S.M.; Lee, J.J. Second-generation PLINK: Rising to the challenge of larger and richer datasets. GigaScience 2015, 4, 7. [Google Scholar] [CrossRef] [PubMed]
- Alexander, D.H.; Novembre, J.; Lange, K. Fast model-based estimation of ancestry in unrelated individuals. Genome Res. 2009, 19, 1655–1664. [Google Scholar] [CrossRef] [PubMed] [Green Version]
- Chaitanya, L.; Breslin, K.; Zuniga, S.; Wirken, L.; Pośpiech, E.; Kukla-Bartoszek, M.; Sijen, T.; De Knijff, P.; Liu, F.; Branicki, W.; et al. The HIrisPlex-S system for eye, hair and skin colour prediction from DNA: Introduction and forensic developmental validation. Forensic Sci. Int. Genet. 2018, 35, 123–135. [Google Scholar] [CrossRef] [PubMed] [Green Version]
- Dixon, A.R.; Telles, E.E. Skin Color and Colorism: Global Research, Concepts, and Measurement. Annu. Rev. Sociol. 2017, 43, 405–424. [Google Scholar] [CrossRef]
- Marira, T.D.; Mitra, P. Colorism: Ubiquitous Yet Understudied. Ind. Organ. Psychol. 2013, 6, 103–107. [Google Scholar] [CrossRef]
- Parra, E.J.; A Kittles, R.; Shriver, M.D.; Shriver, M. Implications of correlations between skin color and genetic ancestry for biomedical research. Nat. Genet. 2004, 36, S54–S60. [Google Scholar] [CrossRef]
- Leite, T.K.M.; Fonseca, R.M.C.; De França, N.M.; Parra, E.J.; Pereira, R.W. Genomic Ancestry, Self-Reported “Color” and Quantitative Measures of Skin Pigmentation in Brazilian Admixed Siblings. PLoS ONE 2011, 6, e27162. [Google Scholar] [CrossRef] [PubMed]
- Lee, J.J.; Wedow, R.; Okbay, A.; Kong, E.; Maghzian, O.; Zacher, M.; Nguyen-Viet, T.A.; Bowers, P.; Sidorenko, J.; Linnér, R.K.; et al. Gene discovery and polygenic prediction from a 1.1-million-person GWAS of educational attainment. Nat. Genet. 2018, 50, 1112–1121. [Google Scholar] [CrossRef]
- Rosenberg, N.A.; Edge, M.D.; Pritchard, J.K.; Feldman, M.W. Interpreting polygenic scores, polygenic adaptation, and human phenotypic differences. Evol. Med. Public Health 2018, 2019, 26–34. [Google Scholar] [CrossRef] [Green Version]
- Zanetti, D.; Weale, M.E. Transethnic differences in GWAS signals: A simulation study. Ann. Hum. Genet. 2018, 82, 280–286. [Google Scholar] [CrossRef]
- Duncan, L.; Shen, H.; Gelaye, B.; Ressler, K.; Feldman, M.; Peterson, R.; Domingue, B. Analysis of polygenic score usage and performance across diverse human populations. BioRxiv 2018, 398396. [Google Scholar] [CrossRef]
- Spencer, A.V.; Cox, A.; Walters, K. Comparing the efficacy of SNP filtering methods for identifying a single causal SNP in a known association region. Ann. Hum. Genet. 2014, 78, 50–61. [Google Scholar] [CrossRef] [PubMed]
- Wang, X.; Teo, Y.-Y. Trans-ethnic fine-mapping of rare causal variants. In Assessing Rare Variation in Complex Traits; Springer: New York, NY, USA, 2015; pp. 253–261. [Google Scholar]
- Piffer, D. The European-African difference in Cognitive-Educational polygenic scores is moderated by the trans-ethnic validity of the SNPs. (under review).
- Sirin, S.R. Socioeconomic Status and Academic Achievement: A Meta-Analytic Review of Research. Rev. Educ. Res. 2005, 75, 417–453. [Google Scholar] [CrossRef]
- Hunter, J.E.; Schmidt, F.L. Methods of Meta-Analysis: Correcting Error and Bias in Research Findings; Sage: Thousand Oaks, CA, USA, 2004. [Google Scholar]
- Walsh, S.; Chaitanya, L.; Clarisse, L.; Wirken, L.; Draus-Barini, J.; Kovatsi, L.; Maeda, H.; Ishikawa, T.; Sijen, T.; De Knijff, P.; et al. Developmental validation of the HIrisPlex system: DNA-based eye and hair colour prediction for forensic and anthropological usage. Forensic Sci. Int. Genet. 2014, 9, 150–161. [Google Scholar] [CrossRef] [PubMed]
- Lynn, R. Skin Color and Intelligence in African Americans. Popul. Environ. 2002, 23, 365–375. [Google Scholar] [CrossRef]
- Fuerst, J.G.R.; Lynn, R.; Kirkegaard, E.O.W. The Effect of Biracial Status and Color on Crystallized Intelligence in the U.S.-Born African–European American Population. Psych 2019, 1, 44–54. [Google Scholar] [CrossRef]
- Kirkegaard, E.O.W.; Fuerst, J. Admixture in Argentina. Mank. Q. 2017, 57, 542–580. [Google Scholar]
- Woodley, M.A.; Younuskunju, S.; Balan, B.; Piffer, D. Holocene Selection for Variants Associated with General Cognitive Ability: Comparing Ancient and Modern Genomes. Twin Res. Hum. Genet. 2017, 20, 271–280. [Google Scholar] [CrossRef]
- Uricchio, L.H.; Kitano, H.C.; Gusev, A.; Zaitlen, N.A. An evolutionary compass for detecting signals of polygenic selection and mutational bias. Evol. Lett. 2019, 3, 69–79. [Google Scholar] [CrossRef] [Green Version]
- Kim, M.S.; Patel, K.P.; Teng, A.K.; Berens, A.J.; Lachance, J. Genetic disease risks can be misestimated across global populations. Genome Biol. 2018, 19, 179. [Google Scholar] [CrossRef]
- Amer, D.; Sirota, L. Beware the chopsticks gene. Mol. Psychiatry 2000, 5, 11–13. [Google Scholar]
- Thompson, J. Piffer Kicks Against the Pricks. Available online: http://www.unz.com/jthompson/piffer-kicks-against-the-pricks/ (accessed on 2 May 2019).
- Marigorta, U.M.; Navarro, A. High Trans-ethnic Replicability of GWAS Results Implies Common Causal Variants. PLoS Genet. 2013, 9, e1003566. [Google Scholar] [CrossRef] [PubMed]
- Hildebrandt, A.; Lüdtke, O.; Robitzsch, A.; Sommer, C.; Wilhelm, O. Exploring Factor Model Parameters across Continuous Variables with Local Structural Equation Models. Multivar. Behav. Res. 2016, 51, 257–258. [Google Scholar] [CrossRef] [PubMed]
- Jensen, A.R. Obstacles, Problems, and Pitfalls in Differential Psychology. In Race, Social Class, and Individual Differences in IQ; Erlbaum: Hillsdale, NJ, USA, 1981. [Google Scholar]
- Loehlin, J.C. Group differences in intelligence. In Handbook of Intelligence; Cambridge University Press: New York, NY, USA, 2000; pp. 176–193. [Google Scholar]
- Scarr, S. Race, Social Class, and Individual Differences in IQ; Erlbaum: Hillsdale, NJ, USA, 1981. [Google Scholar]
- Plomin, R.; Bergeman, C.S. The nature of nurture: Genetic influence on “environmental” measures. Behav. Brain Sci. 1991, 14, 373–386. [Google Scholar] [CrossRef]
- Vinkhuyzen, A.A.E.; Van Der Sluis, S.; De Geus, E.J.C.; Boomsma, D.I.; Posthuma, D. Genetic influences on ‘environmental’ factors. Genes Brain Behav. 2010, 9, 276–287. [Google Scholar] [CrossRef]
- Cole, D.A.; Maxwell, S.E. Testing Mediational Models with Longitudinal Data: Questions and Tips in the Use of Structural Equation Modeling. J. Abnorm. Psychol. 2003, 112, 558–577. [Google Scholar] [CrossRef] [PubMed]
- Visscher, P.M.; Medland, S.E.; Ferreira, M.A.R.; Morley, K.I.; Zhu, G.; Cornes, B.K.; Montgomery, G.W.; Martin, N.G. Assumption-Free Estimation of Heritability from Genome-Wide Identity-by-Descent Sharing between Full Siblings. PLoS Genet. 2006, 2, e41. [Google Scholar] [CrossRef] [PubMed]
- Piffer, D. Evidence for Recent Polygenic Selection on Educational Attainment and Intelligence Inferred from Gwas Hits: A Replication of Previous Findings Using Recent Data. Psych 2019, 1, 55–75. [Google Scholar] [CrossRef]
- Centerwall, B.S. The use of racial admixture as evidence in intelligence research: A critique. Hum. Genet. 1978, 45, 237–238. [Google Scholar] [CrossRef]
- Shriner, D. Overview of admixture mapping. Curr. Protoc. Hum. Genet. 2013, 76, 1–23. [Google Scholar] [CrossRef]
- Winkler, C.A.; Nelson, G.W.; Smith, M.W. Admixture mapping comes of age. Annu. Rev. Genom. Hum. Genet. 2010, 11, 65–89. [Google Scholar] [CrossRef] [PubMed]
Figure 1.
Probability distribution for identifying as African-, biracial African-European, and European-American as a function of genetic ancestry for the Trajectories of Complex Phenotypes (TCP) sample.
Figure 1.
Probability distribution for identifying as African-, biracial African-European, and European-American as a function of genetic ancestry for the Trajectories of Complex Phenotypes (TCP) sample.
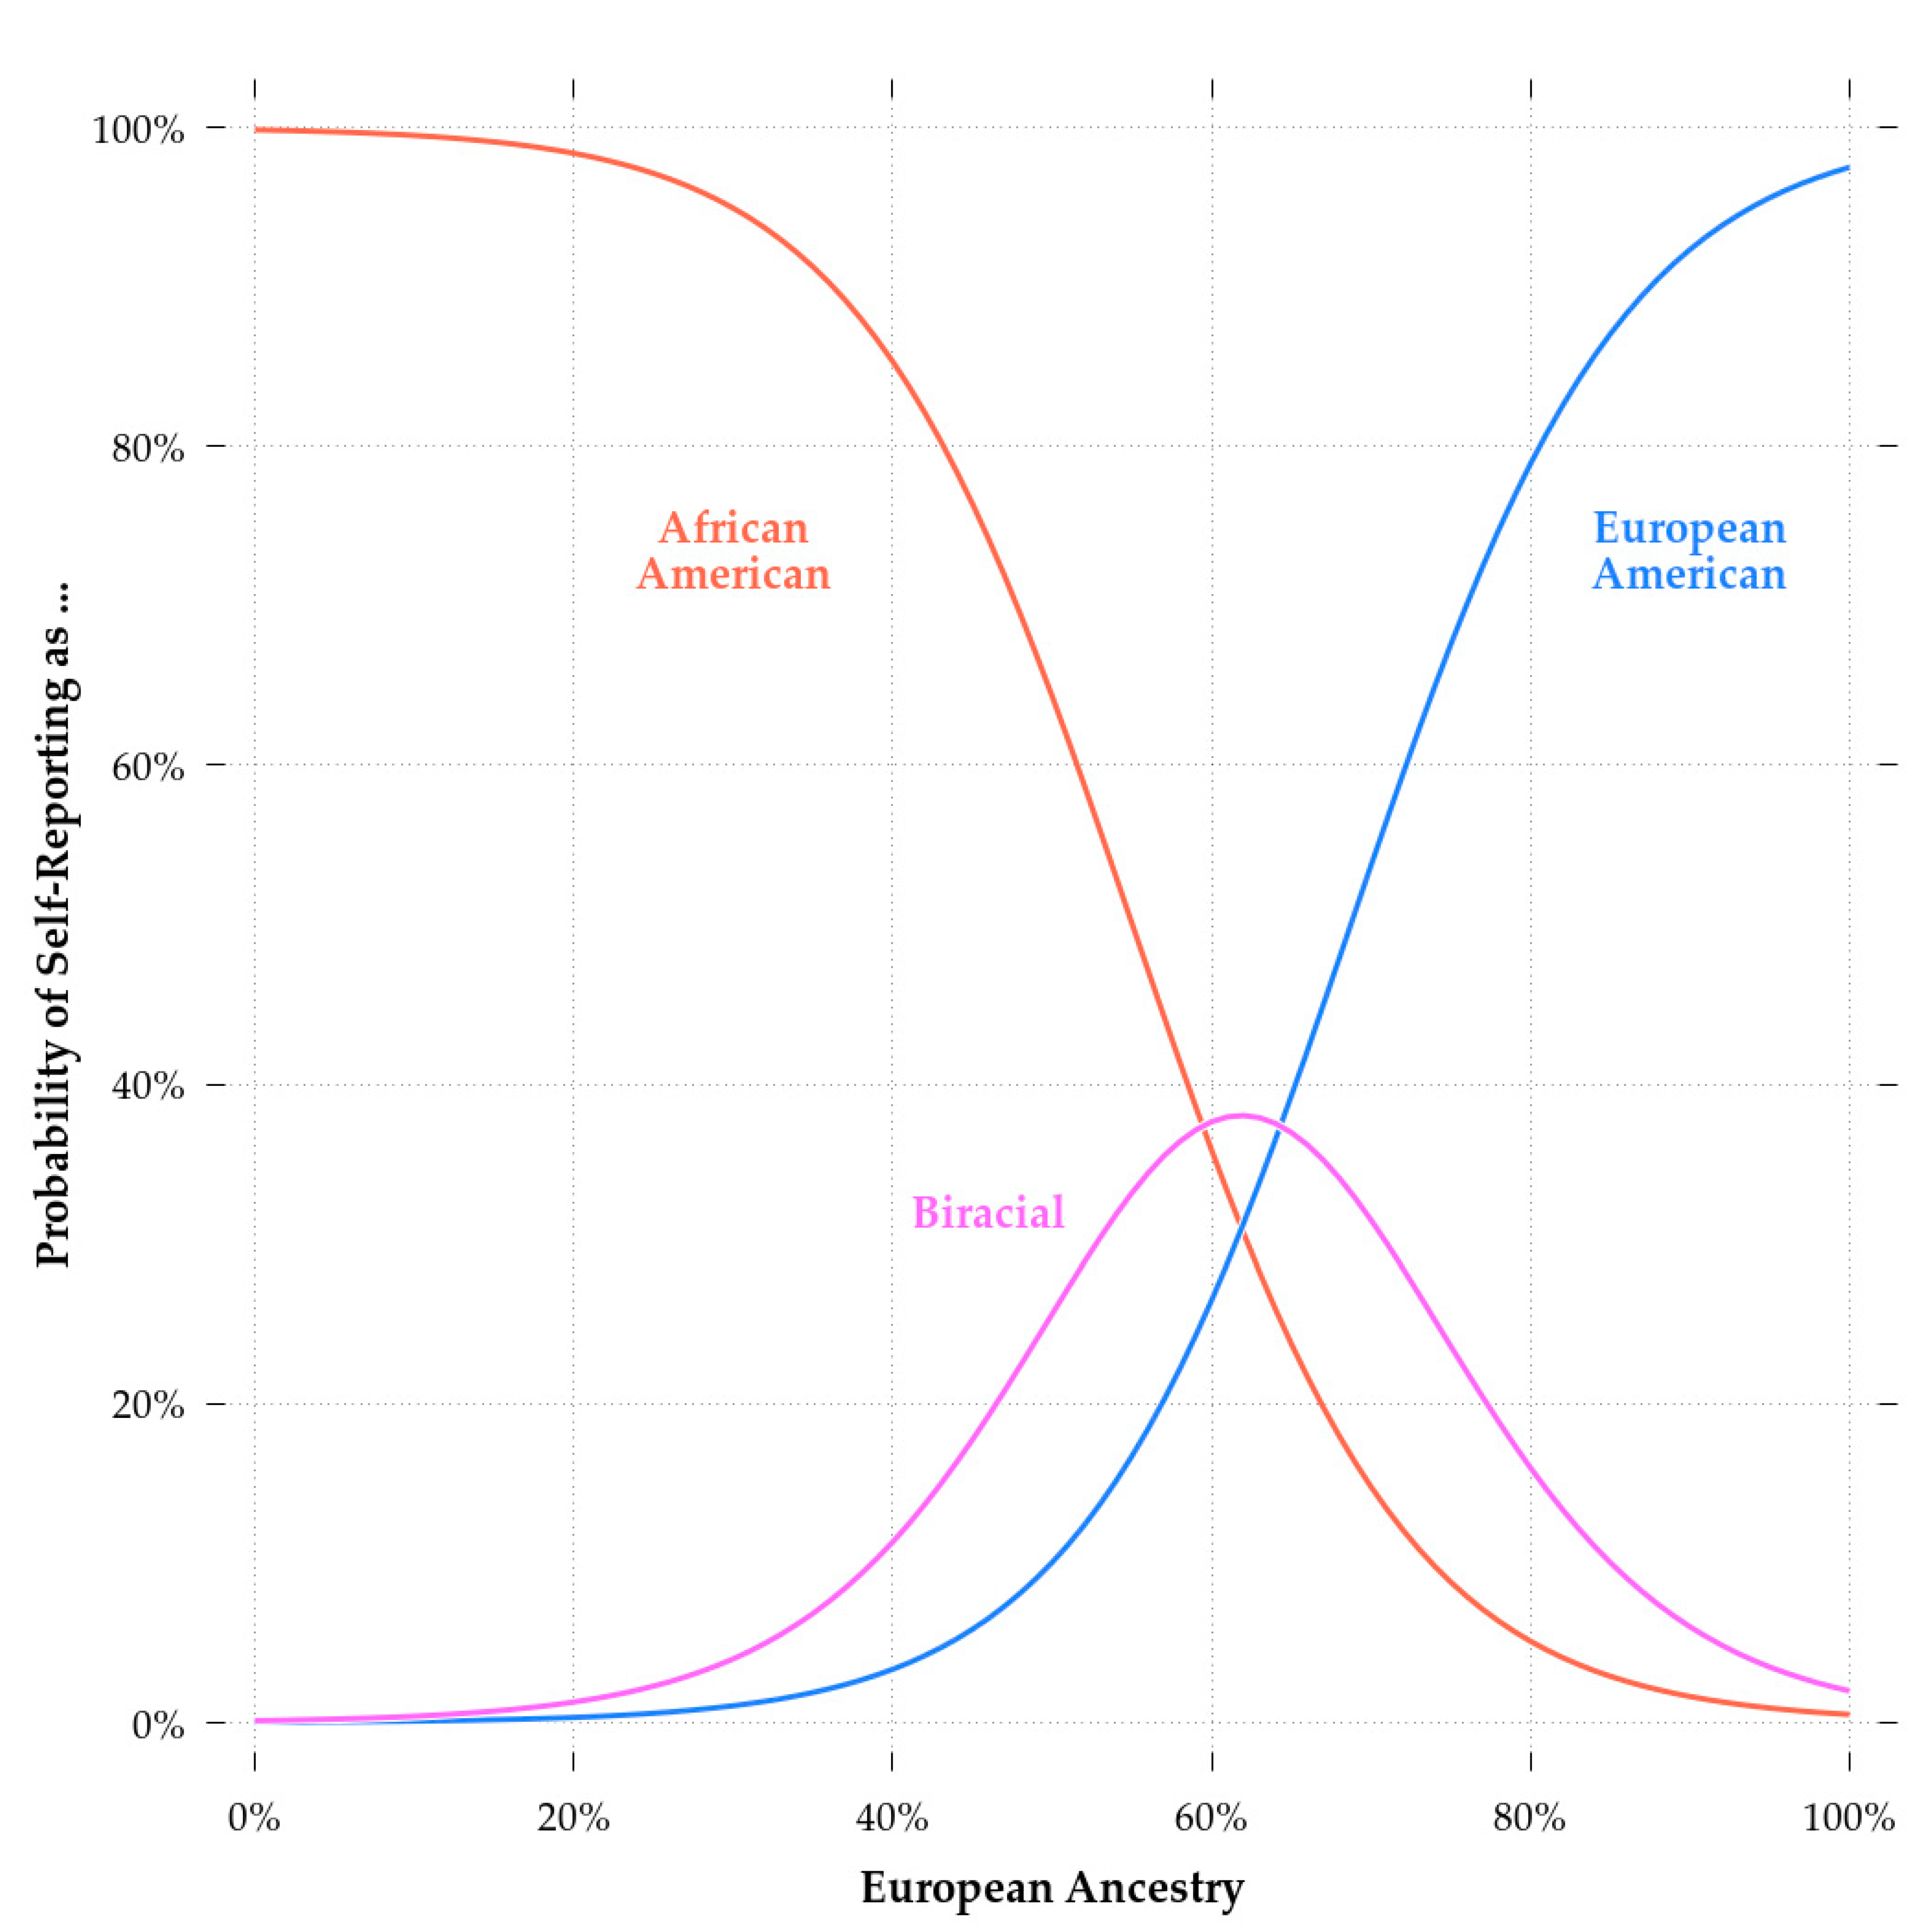
Figure 2.
Regression plot of the relation between color (with higher values indicating darker color) and European genetic ancestry.
Figure 2.
Regression plot of the relation between color (with higher values indicating darker color) and European genetic ancestry.
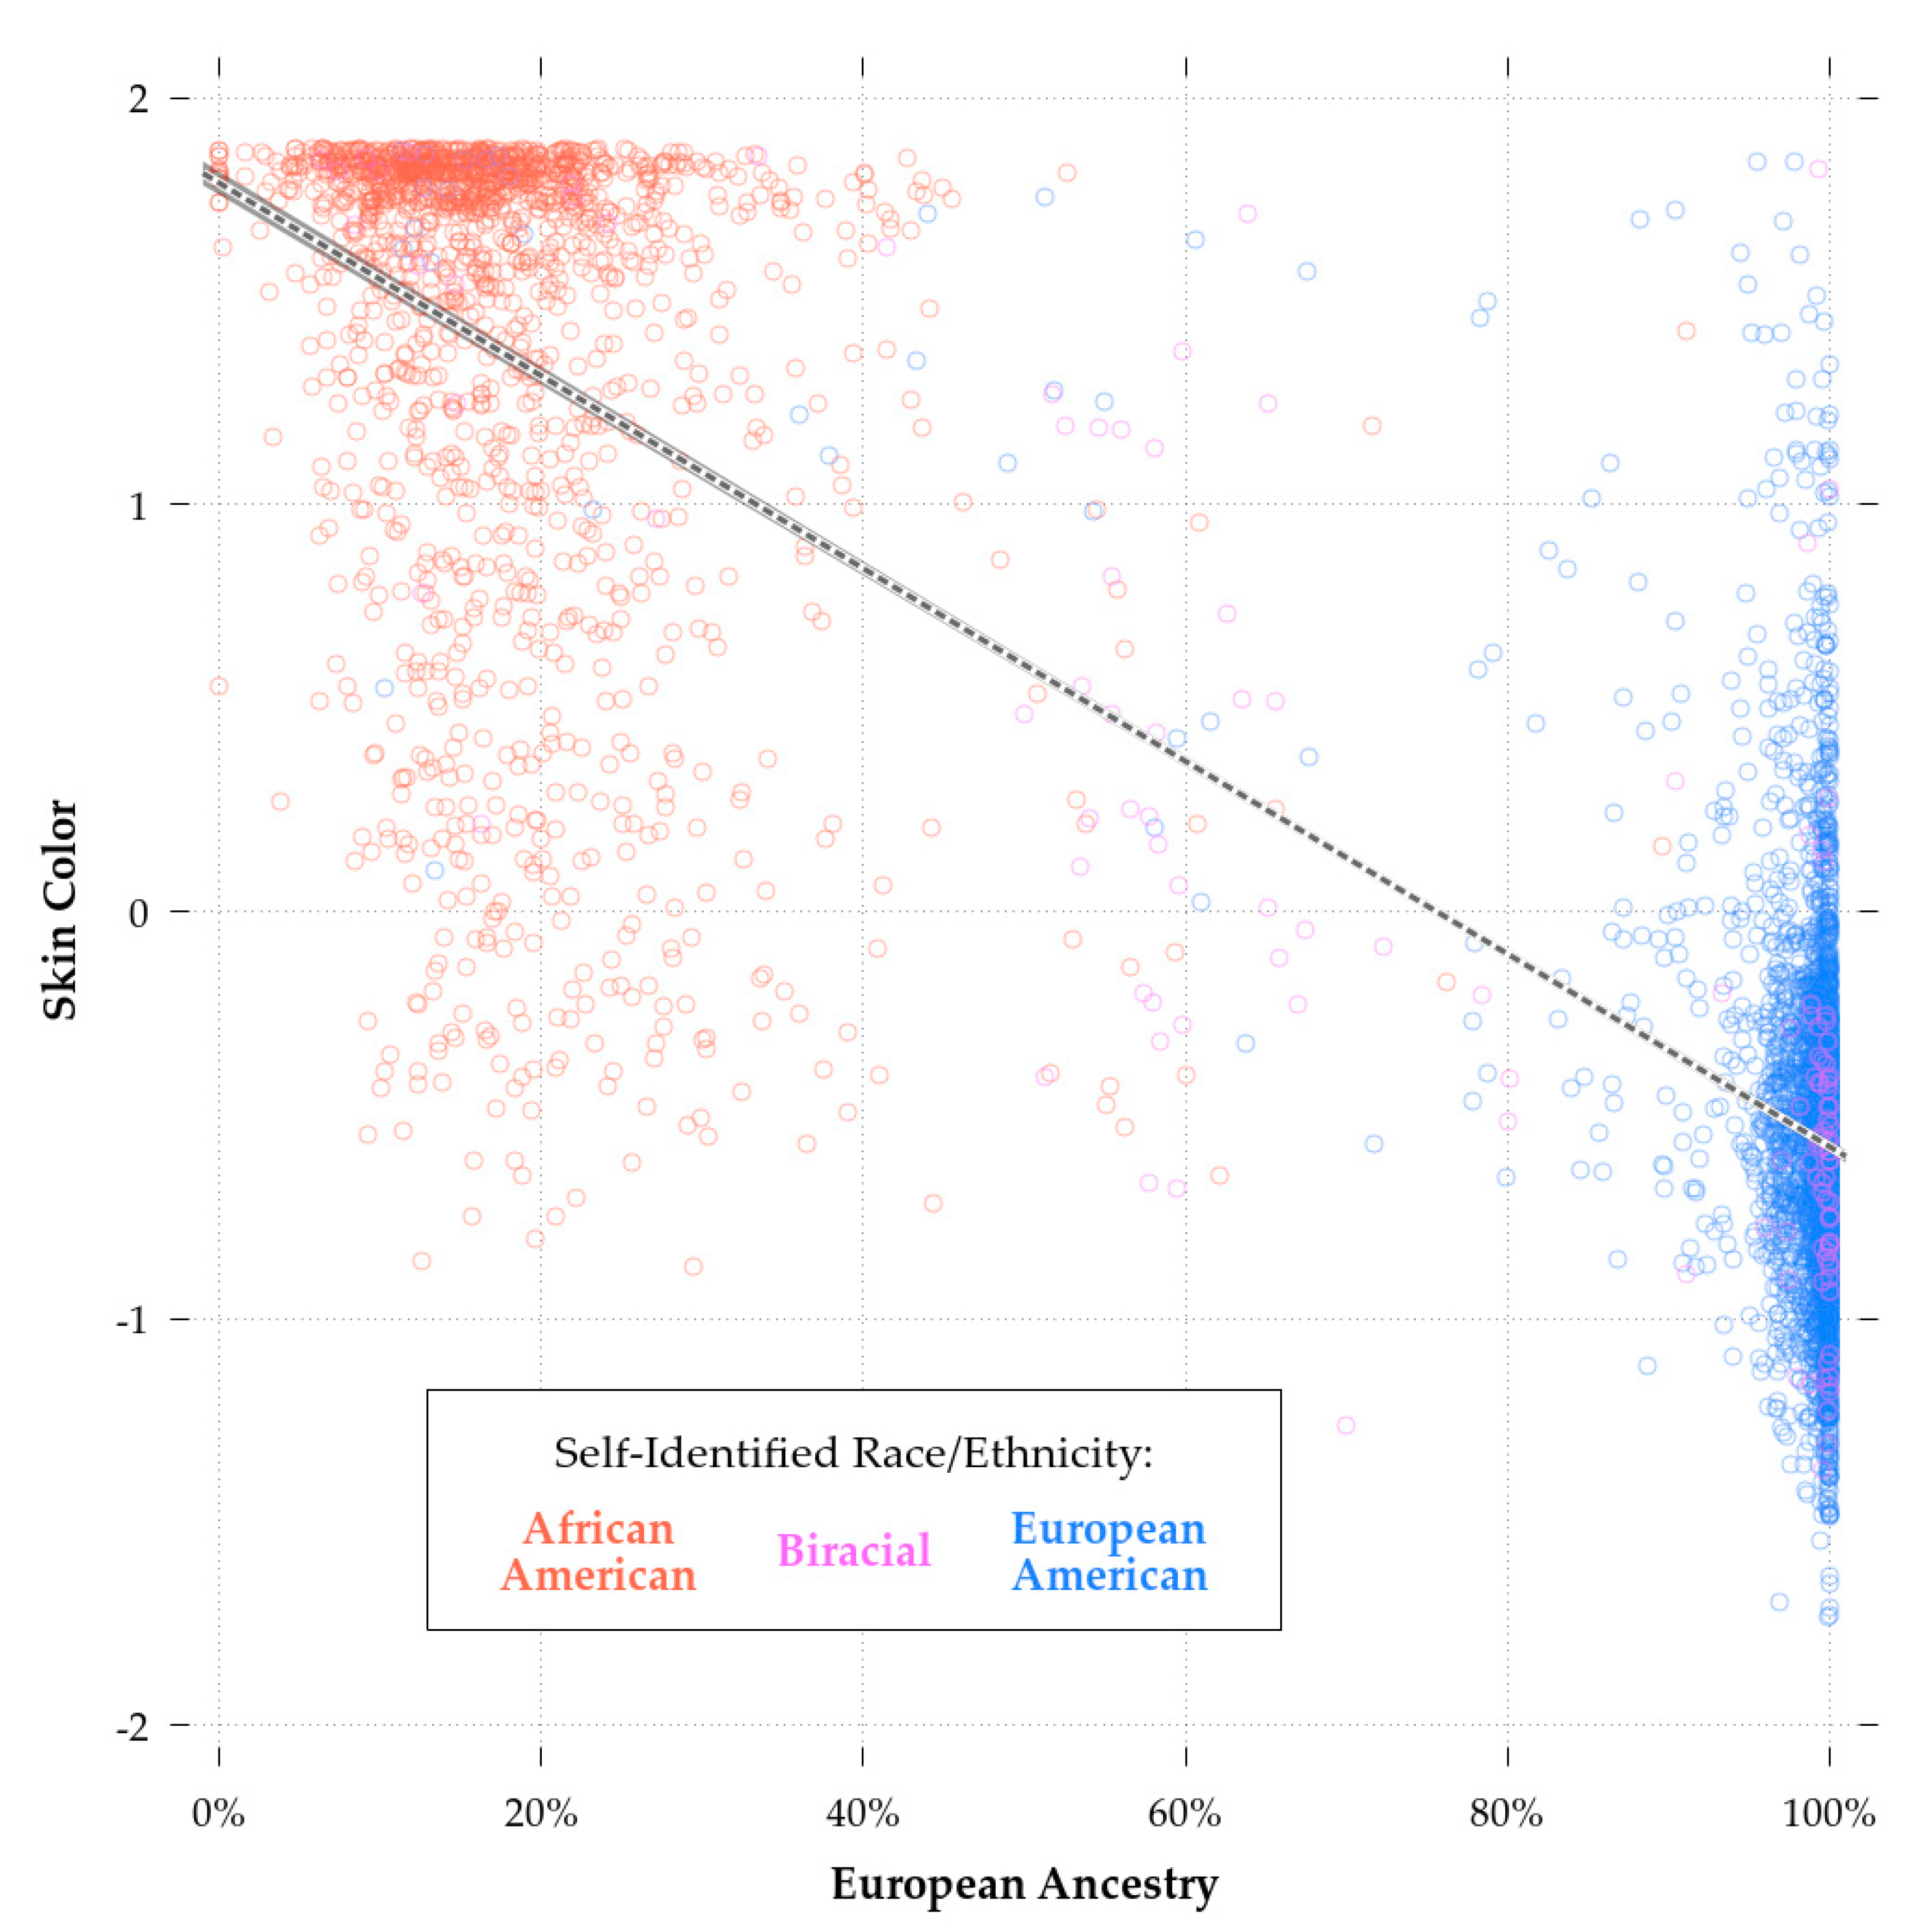
Figure 3.
Regression plot for the relation between g and European ancestry (r = 0.411).
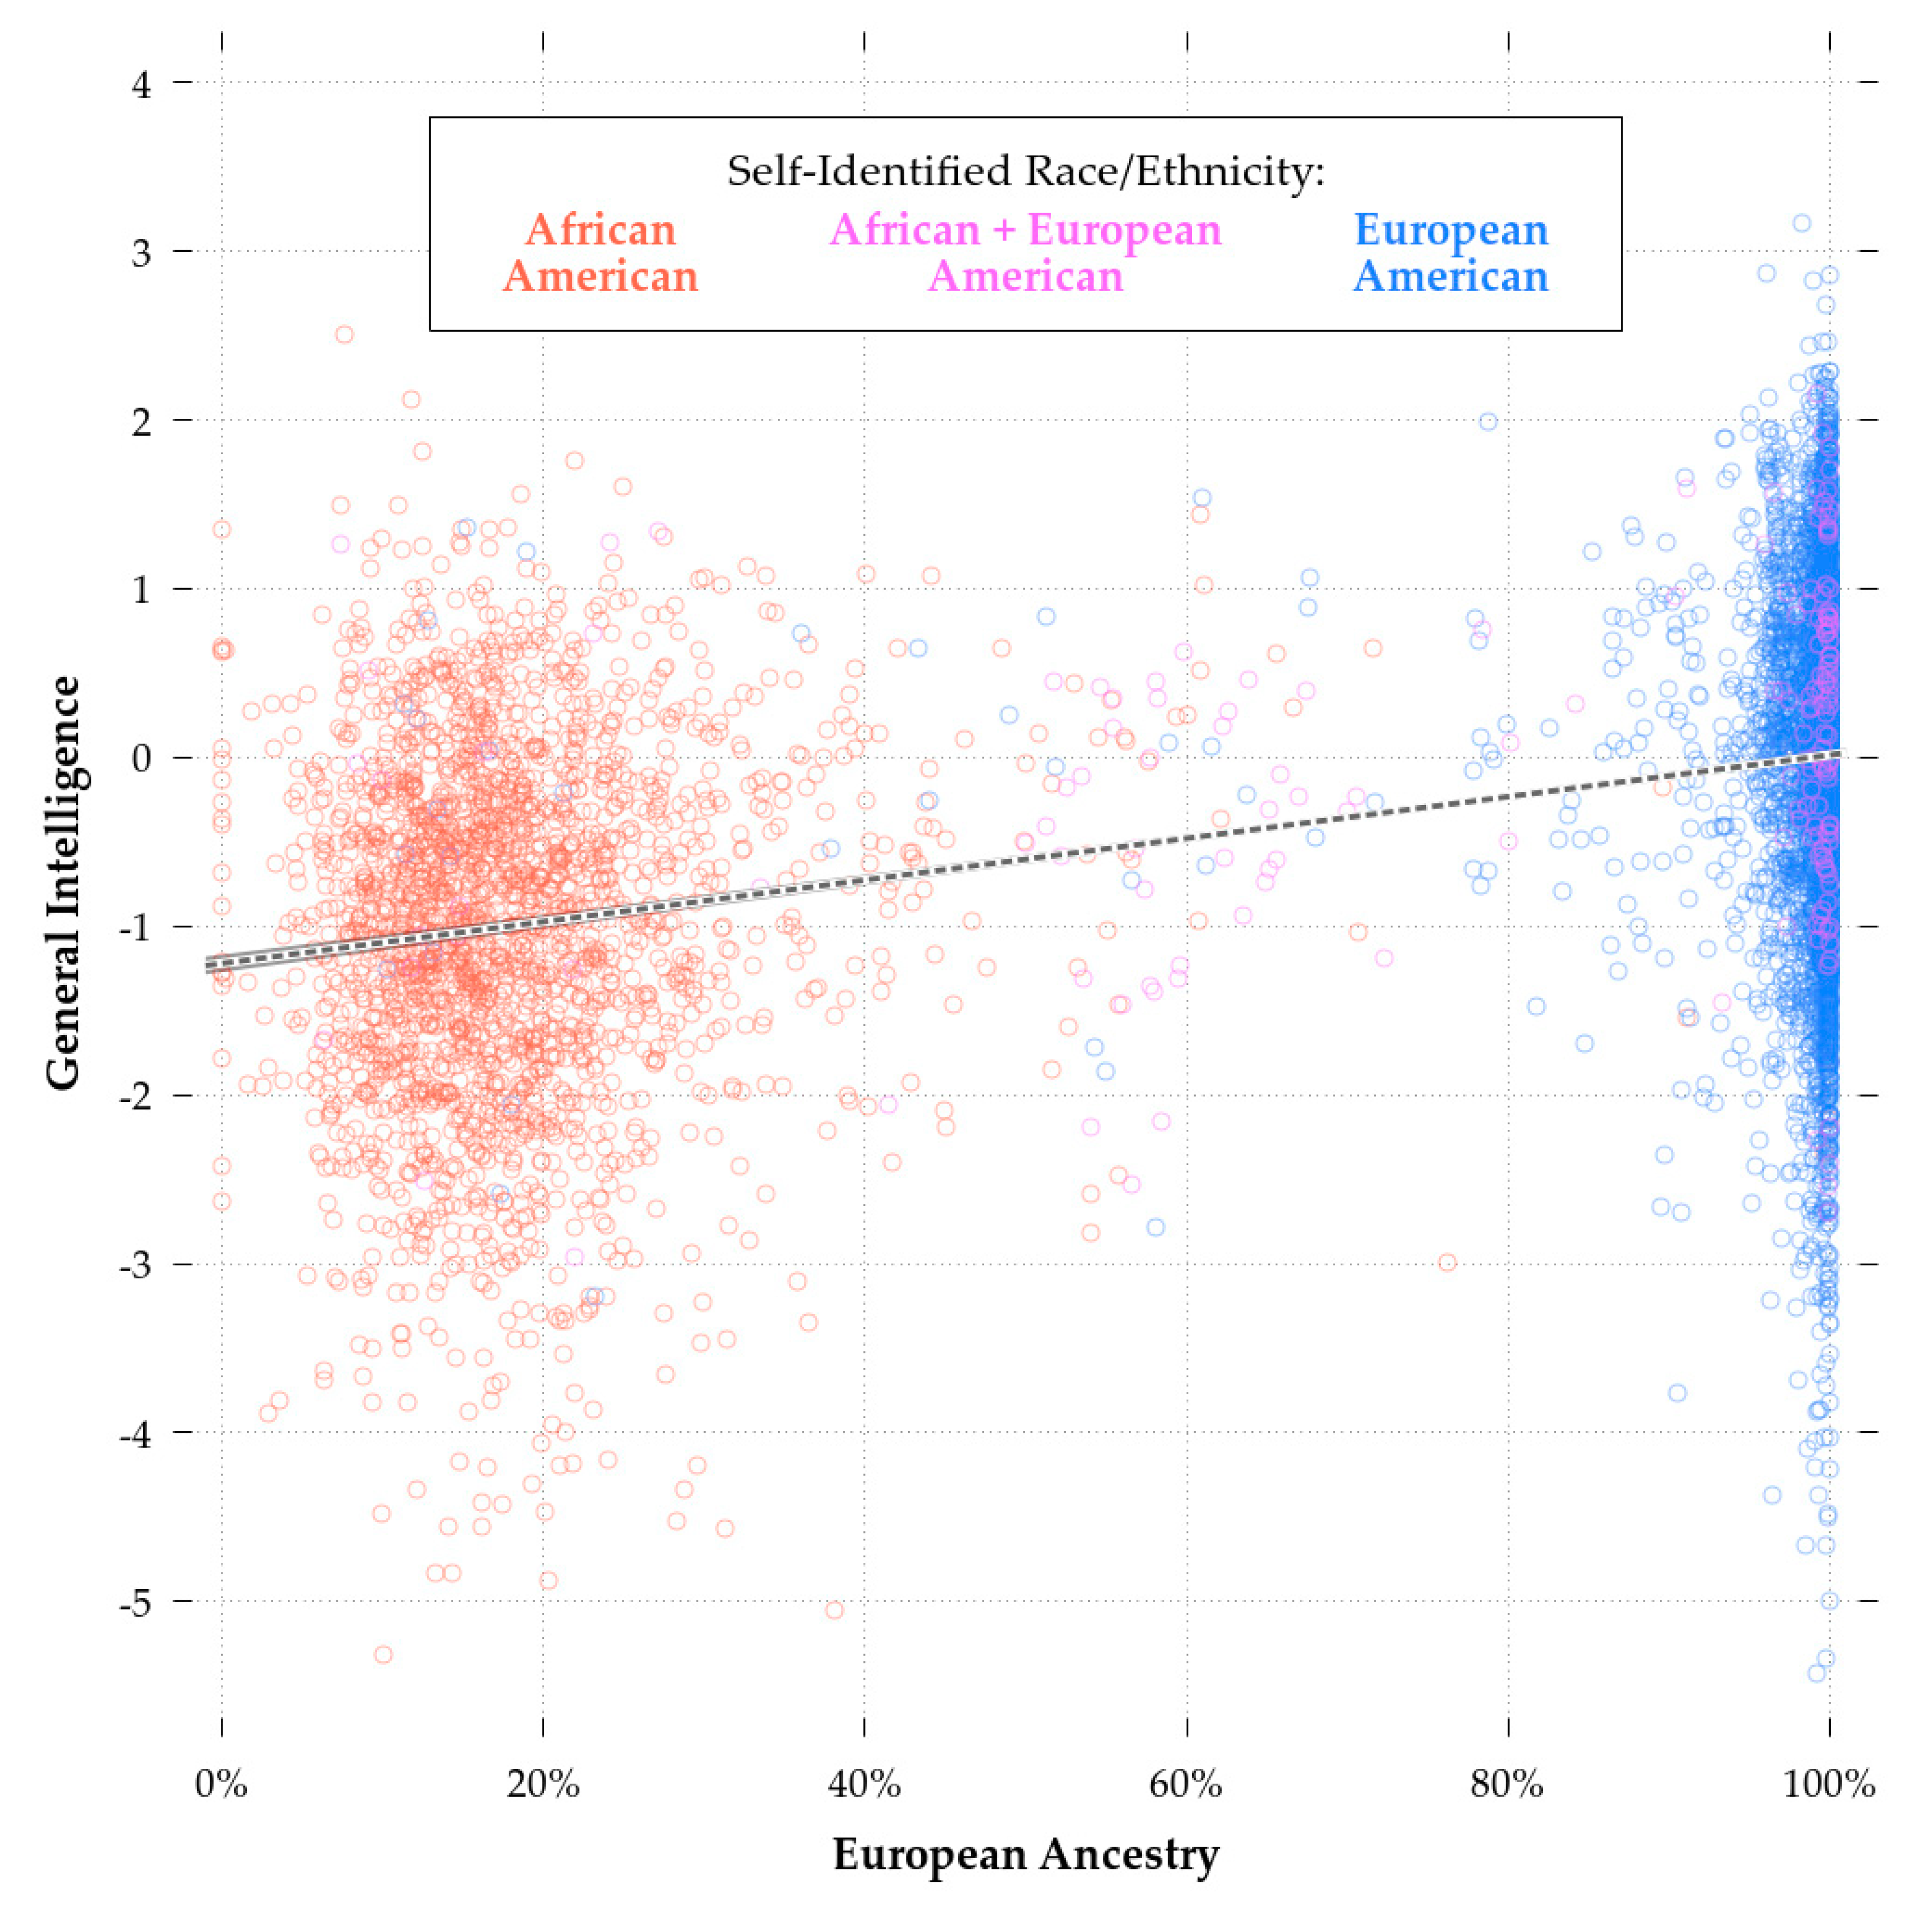
Figure 4.
Regression plot for the predictive validity of MTAG 10k eduPGS with Respect to g in the African-American (Red; r = 0.112) and European-American (Blue; r = 0.227) Samples.
Figure 4.
Regression plot for the predictive validity of MTAG 10k eduPGS with Respect to g in the African-American (Red; r = 0.112) and European-American (Blue; r = 0.227) Samples.
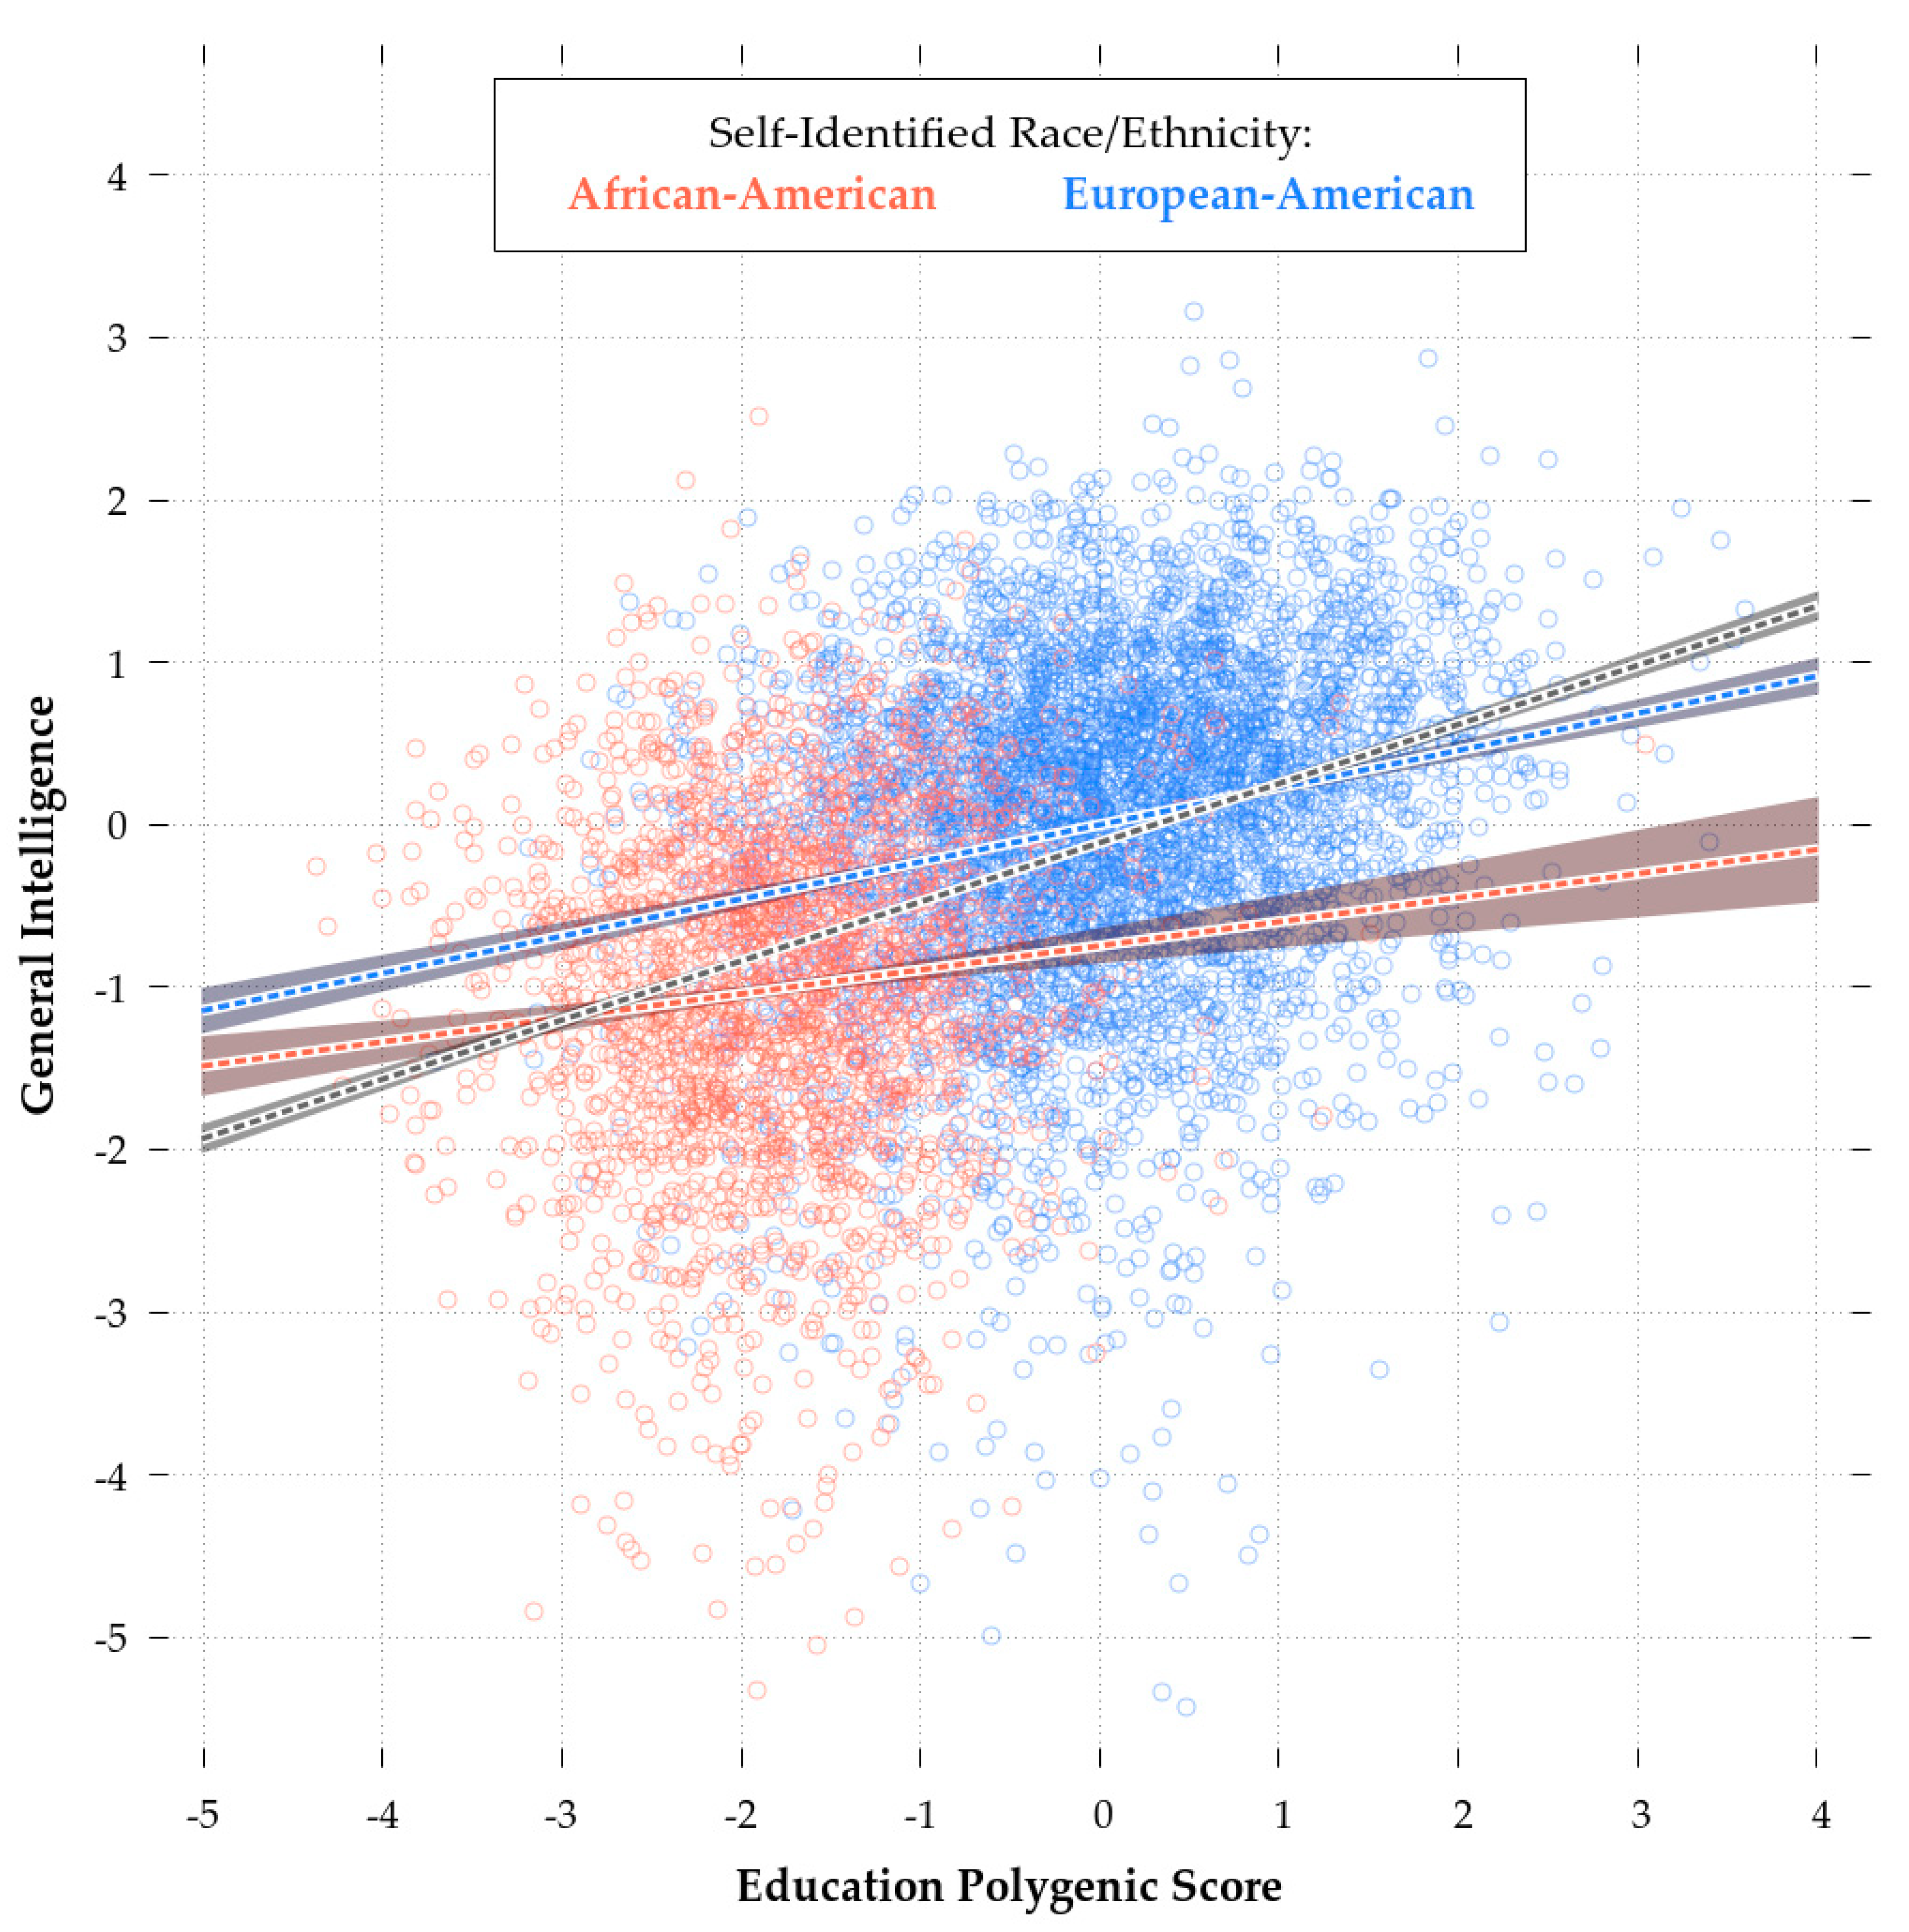
Figure 5.
Path diagram for relation between European Ancestry, color, eduPGS, and g in the African-American sample.
Figure 5.
Path diagram for relation between European Ancestry, color, eduPGS, and g in the African-American sample.
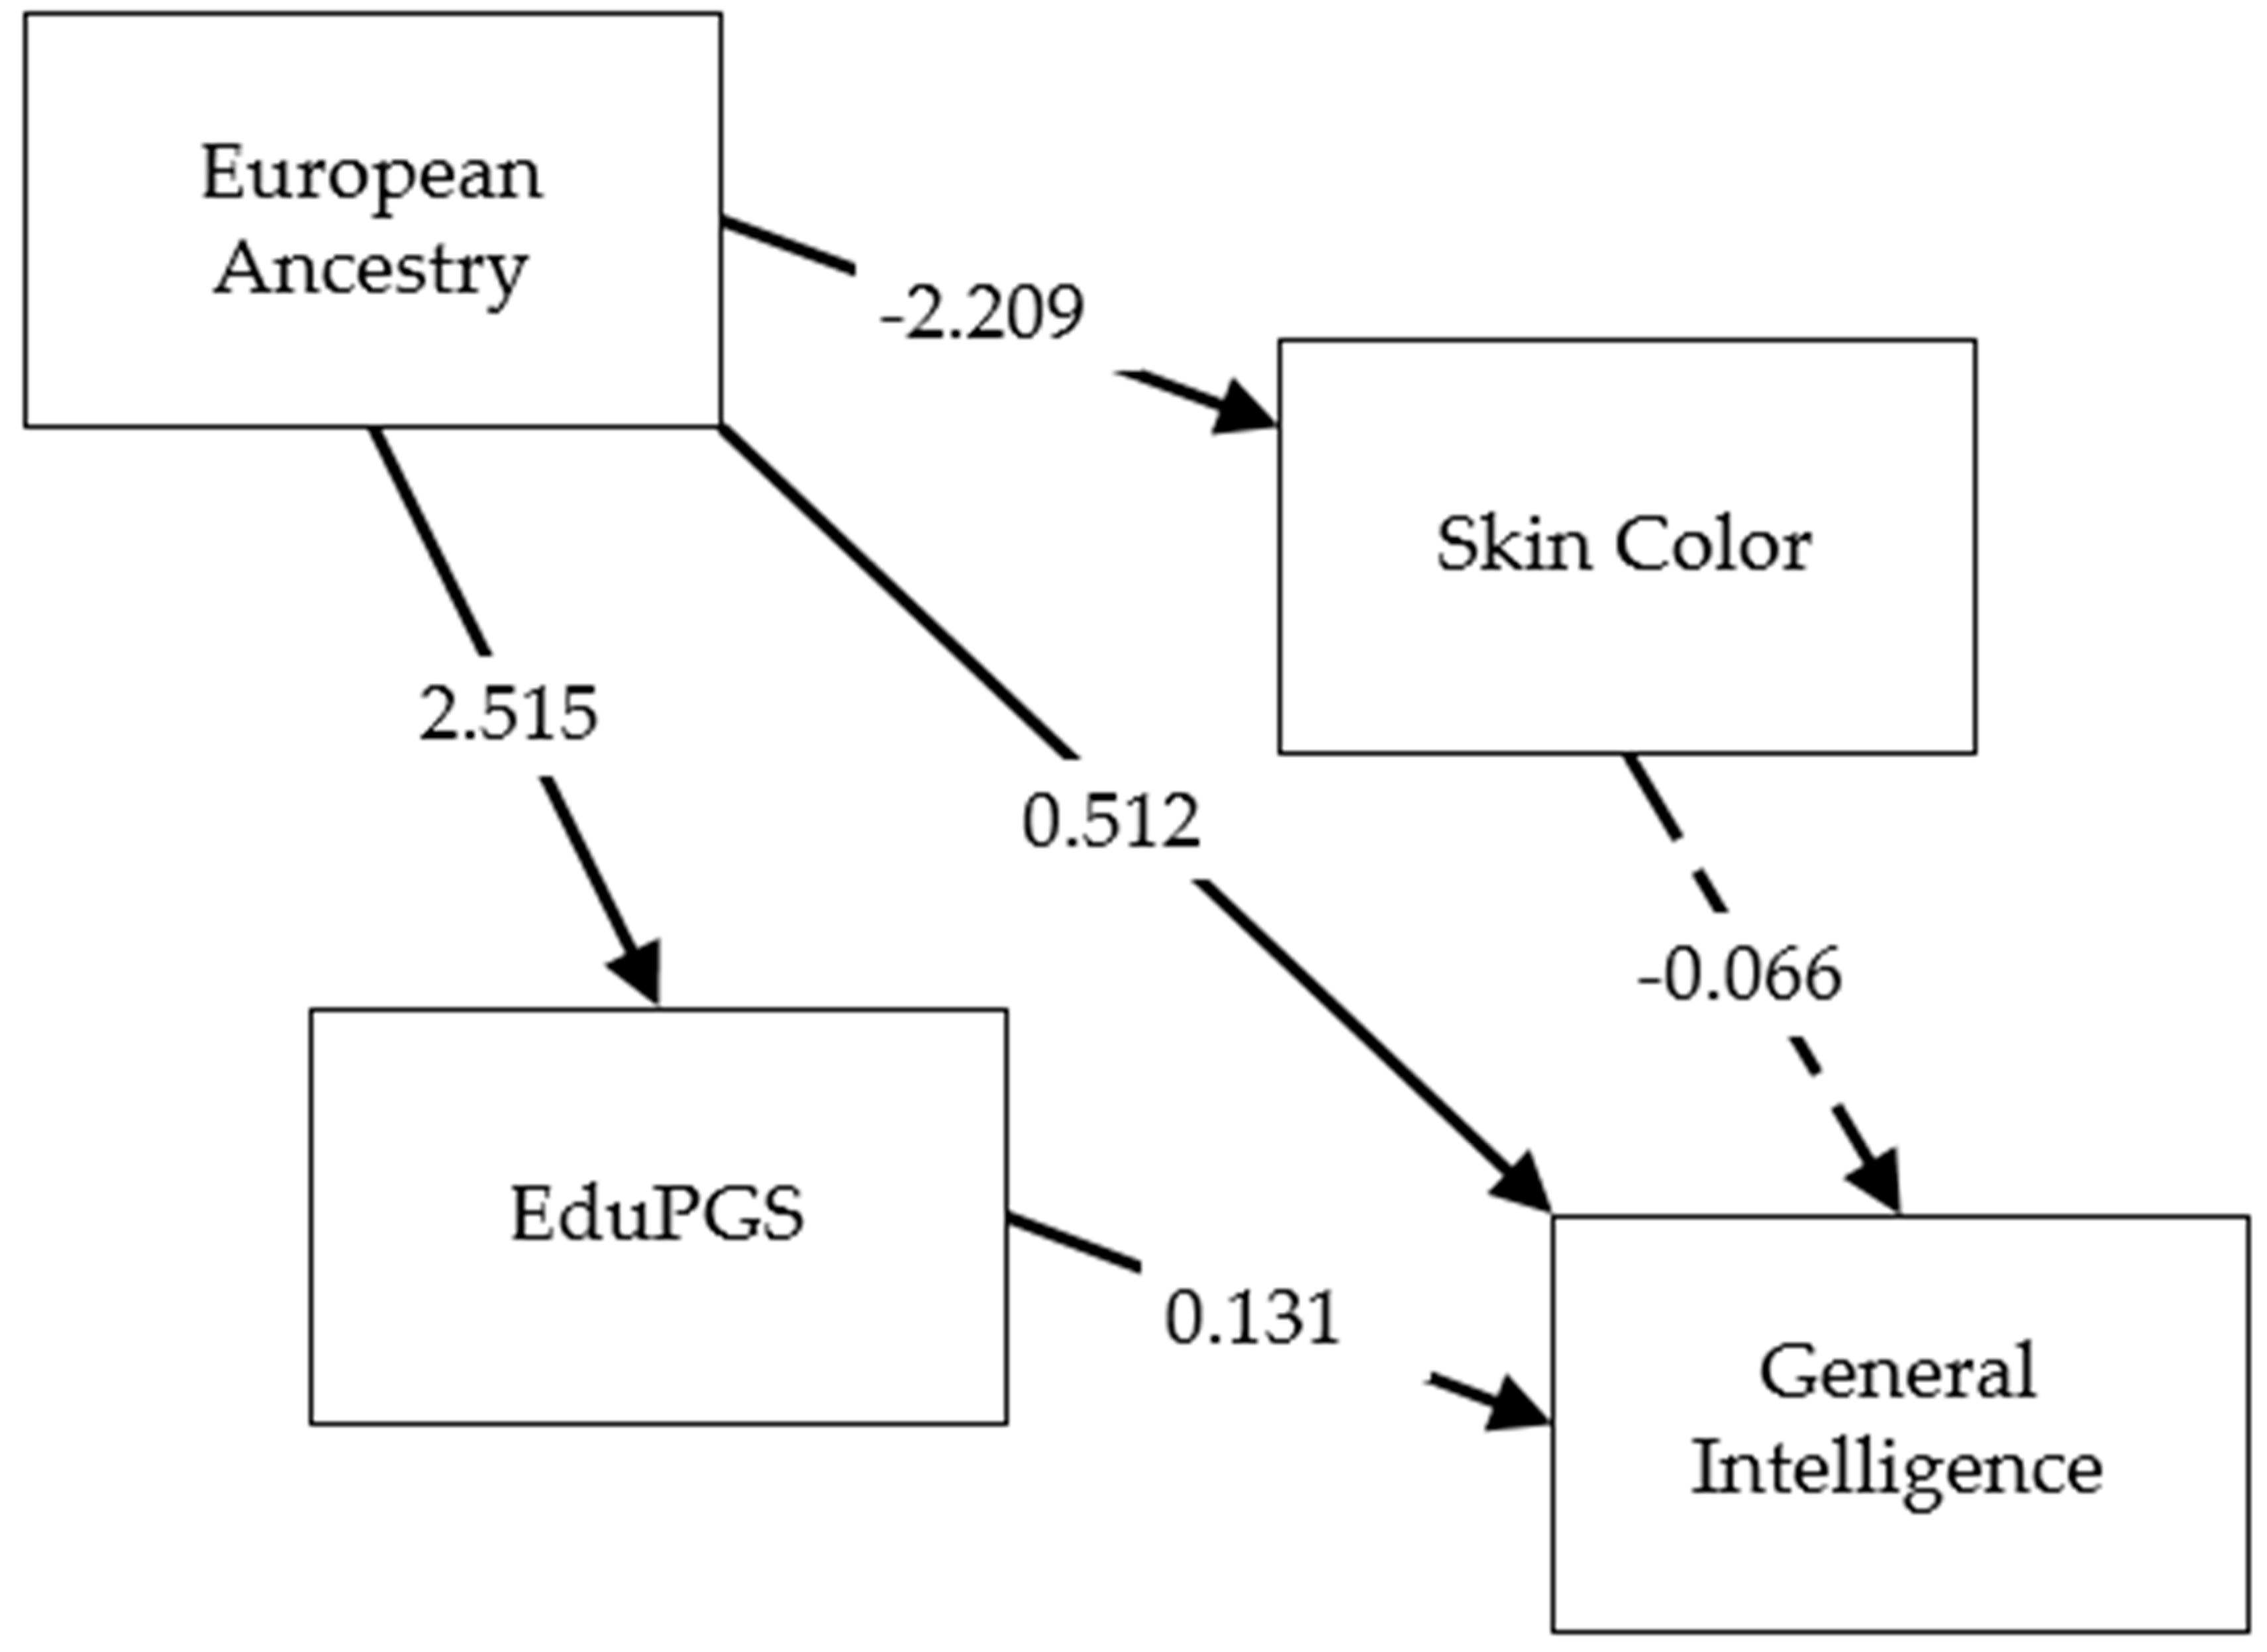

Table 1.
Factor score differences between African and European-Americans based on the Weak Spearman’s Hypothesis Model.
Table 1.
Factor score differences between African and European-Americans based on the Weak Spearman’s Hypothesis Model.
| Factor | Estimate | SE | Lower 95% CI | Upper 95% CI |
|---|---|---|---|---|
| g | 1.046 | 0.020 | 1.007 | 1.085 |
| Complex Reasoning | 0.356 | 0.026 | 0.305 | 0.407 |
| Executive Functioning | −0.055 | 0.028 | −0.109 | −0.0001 |
| Episodic Memory | 0 | - | - | - |
Note: Positive values indicate higher European-American scores and vice-versa. SE = standard error.
Table 2.
Sample characteristics for the African, European, and biracial African-European-American participants.
Table 2.
Sample characteristics for the African, European, and biracial African-European-American participants.
| Age (SD; N) | % European (SD; N) | Mean SES (SD; N) | Mean g Score (SD; N) | Mean Color (SD; N) | |
|---|---|---|---|---|---|
| African | 14.08 (3.75; 2227) | 0.187 (0.117; 2228) | −0.57 (0.77; 2180) | −1.01 (1.07; 2179) | 30.96 (5.87; 1557) |
| Biracial African-European | 13.15 (3.58; 232) | 0.796 (0.289; 232) | 0.16 (0.95; 230) | −0.14 (1.05; 228) | 19.18 (7.61; 166) |
| European | 13.76 (3.64; 4937) | 0.986 (0.059; 4939) | 0.33 (0.96; 4909) | 0.00 (1.01; 4914) | 14.70 (3.84; 3862) |
Note: Standard deviations and sample sizes appear in parentheses. SES = socioeconomic status.
Table 3.
Pairwise correlations among African-, African-European, and European-Americans.
| Cognitive Ability | SES | Euro. Ancestry | Afr. Ancestry | SIRE EA | SIRE AA | Color | EduPGS | |
|---|---|---|---|---|---|---|---|---|
| Cognitive Ability | 1 | |||||||
| SES | 0.406 (7253) | 1 | ||||||
| European Ancestry | 0.411 (7321) | 0.412 (7319) | 1 | |||||
| African Ancestry | −0.411 (7321) | −0.412 (7319) | −1.000 (7399) | 1 | ||||
| SIRE EA | 0.408 (7321) | 0.413 (7319) | 0.964 (7399) | −0.964 (7399) | 1 | |||
| SIRE AA | −0.387 (7321) | −0.395 (7319) | −0.928 (7399) | 0.928 (7399) | -0.930 (7399) | 1 | ||
| Color | −0.359 (5534) | −0.354 (5530) | −0.875 (5585) | 0.875 (5585) | −0.838 (5585) | 0.812 (5585) | 1 | |
| EduPGS | 0.402 (7321) | 0.445 (7319) | 0.672 (7399) | −0.672 (7399) | 0.645 (7399) | −0.630 (7399) | −0.614 (7399) | 1 |
Note: All values significant at p < 0.0001. Pairwise N in parentheses. SES = socioeconomic status, SIRE = self-identified race/ethnicity, eduPGS = education polygenic score.
Table 4.
Pairwise correlations among self-identified monoracial African-American (below the diagonal) and self-identified monoracial and biracial African-European-American (above the diagonal).
Table 4.
Pairwise correlations among self-identified monoracial African-American (below the diagonal) and self-identified monoracial and biracial African-European-American (above the diagonal).
| Cognitive Ability | SES | Euro. Ancestry | Afro. Ancestry | Color | EduPGS | |
|---|---|---|---|---|---|---|
| Cognitive Ability | 1 | 0.315 * (2367) | 0.251 * (2407) | −0.251 * (2407) | −0.188 * (1690) | 0.212 * (2407) |
| SES | 0.256 * (2140) | 1 | 0.276 * (2410) | −0.276 * (2410) | −0.184 * (1690) | 0.244 * (2410) |
| European Ancestry | 0.086 * (2179) | 0.054 * (2180) | 1 | −1.000 * (2460) | −0.639 * (1723) | 0.522 * (2460) |
| African Ancestry | −0.086 * (2179) | −0.054 * (2180) | −1.000 * (1854) | 1 | 0.639 * (1723) | −0.522 * (2460) |
| Color | −0.084 * (1526) | −0.047 (1524) | −0.389 * (1557) | 0.389 * (1557) | 1 | −0.394 * (1723) |
| EduPGS | 0.112 * (2179) | 0.119 * (2180) | 0.328 * (2228) | −0.328 * (2228) | −0.187 * (1557) | 1 |
Note: * Significant at p < 0.01. Pairwise N in parentheses. SES = socioeconomic status, eduPGS = education polygenic score.
Table 5.
Regression analysis for European ancestry as a predictor of g among monoracial African-Americans with controls for skin color (Model 2), and SES (Model 3) added.
Table 5.
Regression analysis for European ancestry as a predictor of g among monoracial African-Americans with controls for skin color (Model 2), and SES (Model 3) added.
| Model 1 | Model 1b | Model 2 | Model 3 | |||||||||
|---|---|---|---|---|---|---|---|---|---|---|---|---|
| Predictor | B | SE | β | B | SE | β | B | SE | β | B | SE | β |
| Intercept | −1.16 | 0.04 | −1.01 | −0.82 | 0.06 | −0.997 | −1.05 | 0.09 | −0.996 | −0.83 | 0.09 | −0.995 |
| EUR | 0.78 *** | 0.19 | 0.09 *** | 0.83 *** | 0.24 | 0.10 *** | 0.67 ** | 0.23 | 0.08 ** | |||
| Skin Color | −0.13 *** | 0.04 | −0.09 *** | −0.07 | 0.04 | −0.05 | −0.06 | 0.04 | −0.04 | |||
| SES | 0.36 *** | 0.03 | 0.28 *** | |||||||||
| Adjusted R2 | 0.007 | 0.006 | 0.013 | 0.082 | ||||||||
| N | 2179 | 1526 | 1526 | 1500 | ||||||||
Note: * p < 0.05, ** p < 0.01, *** p < 0.001. Model 1b shows the results with color as an alternative predictor. EUR = European ancestry. SES = socioeconomic status.
Table 6.
Regression analysis for European ancestry as a predictor of g among monoracial and biracial African-European-Americans with controls for SIRE (Model 2), skin color (Model 3b), and SES (Model 4) added.
Table 6.
Regression analysis for European ancestry as a predictor of g among monoracial and biracial African-European-Americans with controls for SIRE (Model 2), skin color (Model 3b), and SES (Model 4) added.
| Model 1 | Model 2 | Model 3a | Model 3b | Model 4 | ||||||
|---|---|---|---|---|---|---|---|---|---|---|
| Predictor | B | SE | B | SE | B | SE | B | SE | B | SE |
| Intercept | −1.22 | 0.03 | −1.17 | 0.04 | −0.62 | 0.05 | −1.07 | 0.08 | −0.83 | 0.08 |
| EUR | 1.21 *** | 0.09 | 0.85 *** | 0.15 | 0.80 *** | 0.19 | 0.55 ** | 0.19 | ||
| SIRE: EA | 0.35 ** | 0.12 | 0.27 * | 0.13 | 0.18 | 0.13 | ||||
| Skin Color | −0.25 *** | 0.03 | −0.06 | 0.04 | −0.05 | 0.04 | ||||
| SES | 0.37 | 0.03 | ||||||||
| Adjusted R2 | 0.063 | 0.066 | 0.035 | 0.065 | 0.134 | |||||
| N | 2407 | 2407 | 1690 | 1690 | 1664 | |||||
Note: * p < 0.05, ** p < 0.01, *** p < 0.001. EUR = European ancestry. SES = socioeconomic status, SIRE = self-identified race/ethnicity.
Table 7.
Regression analysis for European ancestry as a predictor of g among African-, European-, and biracial African-European-Americans with controls for SIRE (Model 2) skin color (Model 3), and SES (Model 4) Added.
Table 7.
Regression analysis for European ancestry as a predictor of g among African-, European-, and biracial African-European-Americans with controls for SIRE (Model 2) skin color (Model 3), and SES (Model 4) Added.
| Model 1 | Model 2 | Model 3a | Model 3b | Model 4 | ||||||
|---|---|---|---|---|---|---|---|---|---|---|
| Predictor | B | SE | B | SE | B | SE | B | SE | B | SE |
| Intercept | −1.22 | 0.03 | −1.15 | 0.09 | −0.28 | 0.01 | −1.09 | 0.11 | −0.91 | 0.11 |
| EUR | 1.23 *** | 0.03 | 0.75 *** | 0.13 | 0.74 *** | 0.16 | 0.59 *** | 0.15 | ||
| SIRE: EA | 0.41 *** | 0.11 | 0.35 ** | 0.12 | 0.22 * | 0.11 | ||||
| SIRE: AA | 0.00 | 0.08 | −0.02 | 0.09 | 0.01 | 0.08 | ||||
| Skin Color | −0.40 *** | 0.01 | −0.02 | 0.03 | −0.01 | 0.03 | ||||
| SES | 0.34 *** | 0.01 | ||||||||
| Adjusted R2 | 0.169 | 0.170 | 0.129 | 0.166 | 0.238 | |||||
| N | 7321 | 7321 | 5534 | 5534 | 5488 | |||||
Note: * p < 0.05, ** p < 0.01, *** p < 0.001. EUR = European ancestry. SES = socioeconomic status, SIRE = self-identified race/ethnicity.
Table 8.
Pairwise correlations between cognitive ability and education/intelligence-related polygenic scores (European-American above the diagonal, African-American below).
Table 8.
Pairwise correlations between cognitive ability and education/intelligence-related polygenic scores (European-American above the diagonal, African-American below).
| Cognitive Ability | Putative Causal | GWAS_edu PGS | MTAG_10K_eduPGS | MTAG_Lead eduPGS | |
|---|---|---|---|---|---|
| Cognitive Ability | 1 | 0.058 *** (4914) | 0.225 *** (4914) | 0.227 *** (4914) | 0.210 *** (4914) |
| Putative Causal_edu PGS | 0.031 (2179) | 1 | 0.216 *** (4939) | 0.315 *** (4939) | 0.348 *** (4939) |
| GWAS_edu PGS | 0.044 * (2179) | 0.135 *** (2228) | 1 | 0.645 *** (4939) | 0.574 *** (4939) |
| MTAG_10K_eduPGS | 0.112 *** (2179) | 0.228 *** (2228) | 0.484 *** (2228) | 1 | 0.837 *** (4939) |
| MTAG_Lead_PGS | 0.094 *** (2179) | 0.266 *** (2228) | 0.453 *** (2228) | 0.801 *** (2228) | 1 |
Note: * Significant at p < 0.05; ** Significant at p < 0.01; *** Significant at p < 0.001. N in parentheses. GWAS = genome-wide association study (standard one-at-a-time regression), MTAG = multi-trait analysis of GWAS, eduPGS = education polygenic score, lead = genome wide-significant hits only.
Table 9.
Mean racial differences in eduPGS (MTAG_10k).
| N | M | SD | |
|---|---|---|---|
| European-American | 4939 | 0.00 | 1.00 |
| Biracial African-European-American | 232 | −0.59 | 1.15 |
| African-American | 2228 | −1.79 | 0.81 |
Table 10.
Regression results for the effect of eduPGS on cognitive ability among monoracial African-Americans.
Table 10.
Regression results for the effect of eduPGS on cognitive ability among monoracial African-Americans.
| Model 1b | Model 2b | |||
|---|---|---|---|---|
| Predictor | B | SE | B | SE |
| Intercept | −0.88 | 0.08 | −0.75 | 0.12 |
| EUR | 0.50 * | 0.21 | 0.51 * | 0.25 |
| eduPGS | 0.12 *** | 0.03 | 0.13 *** | 0.04 |
| Color | −0.07 | 0.04 | ||
| Adjusted R2 | 0.014 | 0.021 | ||
| N | 2179 | 1526 |
Note: * p < 0.05, ** p < 0.01, *** p < 0.001. EUR = European ancestry. eduPGS = education polygenic score.
Table 11.
Regression results for the effect of eduPGS on cognitive ability among African, biracial African-European, and European-Americans.
Table 11.
Regression results for the effect of eduPGS on cognitive ability among African, biracial African-European, and European-Americans.
| Model 1b | Model 2b | |||
|---|---|---|---|---|
| Predictor | B | SE | B | SE |
| Intercept | −0.73 | 0.09 | −0.64 | 0.12 |
| EUR | 0.29 * | 0.13 | 0.27 | 0.16 |
| SIRE: EA | 0.44 *** | 0.10 | 0.37 ** | 0.11 |
| SIRE: AA | 0.04 | 0.07 | 0.01 | 0.09 |
| eduPGS | 0.21 *** | 0.01 | 0.20 *** | 0.01 |
| Color | −0.01 | 0.03 | ||
| Adjusted R2 | 0.200 | 0.196 | ||
| N | 7321 | 5534 |
Note: * p < 0.05, ** p < 0.01, *** p < 0.001. EUR = European ancestry. SES = socioeconomic status, SIRE = self-identified race/ethnicity, eduPGS = education polygenic score.
Table 12.
Regression results for the effect of eduPGS on cognitive ability among European-Americans.
Table 12.
Regression results for the effect of eduPGS on cognitive ability among European-Americans.
| Model 1 | Model 2 | Model 3 | ||||
|---|---|---|---|---|---|---|
| Predictor | B | SE | B | SE | B | SE |
| Intercept | −0.45 | 0.25 | 0.02 | 0.24 | −0.03 | 0.27 |
| EUR | 0.45 | 0.25 | −0.02 | 0.24 | 0.04 | 0.28 |
| eduPGS | 0.23 *** | 0.01 | 0.22 *** | 0.02 | ||
| Color | 0.02 | 0.04 | ||||
| Adjusted R2 | 0.000 | 0.051 | 0.50 | |||
| N | 4914 | 4914 | 3844 | |||
Note: * p < 0.05, ** p < 0.01, ** p < 0.001. EUR = European ancestry. SES = socioeconomic status, SIRE = self-identified race/ethnicity, eduPGS = education polygenic score.
Table 13.
Detailed results for path diagram.
| Unstandardized Estimate | S.E. | P value | Lower 95% CI | Upper 95% CI | Standardized Estimate | |||
|---|---|---|---|---|---|---|---|---|
| EUR | ➜ | G | 0.512 | 0.255 | 0.045 | 0.013 | 1.012 | 0.059 |
| EUR | ➜ | eduPGS | 2.515 | 0.156 | 0.000 | 2.209 | 2.821 | 0.381 |
| eduPGS | ➜ | G | 0.131 | 0.036 | 0.000 | 0.060 | 0.202 | 0.099 |
| Skin Color | ➜ | G | −0.066 | 0.043 | 0.120 | −0.150 | 0.017 | 0.043 |
| EUR | ➜ | Skin Color | −2.209 | 0.133 | 0.000 | −2.469 | −1.949 | −0.392 |
| Skin Color | ~ | eduPGS | −0.020 | 0.012 | 0.089 | −0.044 | 0.003 | −0.044 |
Note: EUR = European ancestry.
Table 14.
Results from Jensen’s Method of Correlated Vectors.
| g Loading | B-W h2 | Ancestry r | eduPGS r (European-American) | eduPGS r (African American) | African/European Gap | |
|---|---|---|---|---|---|---|
| g loading | 1 | |||||
| B-W h2 | 0.372 | 1 | ||||
| Ancestry r | 0.941 | 0.467 | 1 | |||
| eduPGS r (European-American) | 0.892 | 0.604 | 0.993 | 1 | ||
| eduPGS r (African-American) | 0.901 | 0.600 | 0.836 | 0.846 | 1 | |
| African/European gap | 0.929 | 0.478 | 0.997 | 0.926 | 0.813 | 1 |
Note: N (subtest) = 10. eduPGS = education polygenic score, h² = heritability.
© 2019 by the authors. Licensee MDPI, Basel, Switzerland. This article is an open access article distributed under the terms and conditions of the Creative Commons Attribution (CC BY) license (http://creativecommons.org/licenses/by/4.0/).
Share and Cite
MDPI and ACS Style
Lasker, J.; Pesta, B.J.; Fuerst, J.G.R.; Kirkegaard, E.O.W. Global Ancestry and Cognitive Ability. Psych 2019, 1, 431-459. https://doi.org/10.3390/psych1010034
AMA Style
Lasker J, Pesta BJ, Fuerst JGR, Kirkegaard EOW. Global Ancestry and Cognitive Ability. Psych. 2019; 1(1):431-459. https://doi.org/10.3390/psych1010034
Chicago/Turabian StyleLasker, Jordan, Bryan J. Pesta, John G. R. Fuerst, and Emil O. W. Kirkegaard. 2019. "Global Ancestry and Cognitive Ability" Psych 1, no. 1: 431-459. https://doi.org/10.3390/psych1010034