Article

ACAT1 Benchmark of RANS-Informed Analytical Methods for Fan Broadband Noise Prediction: Part II—Influence of the Acoustic Models

1
Department of Engine Acoustics, Institute of Propulsion Technology, German Aerospace Center (DLR), 10623 Berlin, Germany
2
Department of Engine Propulsion and Fluid Dynamics, Universidad Politécnica de Madrid (UPM), 28040 Madrid, Spain
3
Aerodynamic Technology Department, ITP Aero, 28108 Alcobendas, Spain
4
Aerodynamics and Acoustics Department, Safran Aircraft Engines, 77550 Moissy-Cramayel, France
5
CNRS, Laboratoire de Mécanique des Fluides et d’Acoustique, INSA Lyon, Univ. Lyon, Université Claude Bernard Lyon I, École Centrale de Lyon, 69134 Écully, France
6
Institute of Sound and Vibration Research, University of Southampton, Southampton SO17 1BJ, UK
7
Department of Aerodynamics, Aeroelasticity, and Acoustics, ONERA—The French Aerospace Lab, 92322 Châtillon, France
8
Airbus Commercial Aircraft, Acoustics Methods, 31060 Toulouse, France
*
Author to whom correspondence should be addressed.
Acoustics 2020, 2(3), 617-649; https://doi.org/10.3390/acoustics2030033
Submission received: 19 June 2020 / Revised: 11 August 2020 / Accepted: 13 August 2020 / Published: 16 August 2020
(This article belongs to the Special Issue Aeroacoustics of Turbomachines)

Abstract

:
A benchmark dedicated to RANS-informed analytical methods for the prediction of turbofan rotor–stator interaction broadband noise was organised within the framework of the European project TurboNoiseBB. The second part of this benchmark focuses on the impact of the acoustic models. Twelve different approaches implemented in seven different acoustic solvers are compared. Some of the methods resort to the acoustic analogy, while some use a direct approach bypassing the calculation of a source term. Due to differing application objectives, the studied methods vary in terms of complexity to represent the turbulence, to calculate the acoustic response of the stator and to model the boundary and flow conditions for the generation and propagation of the acoustic waves. This diversity of approaches constitutes the unique quality of this work. The overall agreement of the predicted sound power spectra is satisfactory. While the comparison between the models show significant deviations at low frequency, the power levels vary within an interval of ±3 dB at mid and high frequencies. The trends predicted by increasing the rotor speed are similar for almost all models. However, most predicted levels are some decibels lower than the experimental results. This comparison is not completely fair—particularly at low frequency—because of the presence of noise sources in the experimental results, which were not considered in the simulations.

1. Introduction

Research and development activities regarding the design of turbomachinery components of commercial aero-engines call for reliable and efficient methods to predict the noise emission. Hybrid RANS-informed analytical methods can help to reach that objective. RANS simulations are indeed powerful methods, which are standardly applied in the field of engineering. A dedicated post-processing of the RANS results can be applied to reconstruct the input needed by analytical models of fan noise. Thus, if the method works, an acoustic prediction could be achieved as a by-product of a RANS simulation. However two main questions arise regarding that approach—(i) Is RANS able to properly predict the input for the acoustic models, in particular the crucial turbulence statistics needed for broadband noise prediction? (ii) Are analytical models, which tend to strongly simplify reality, sensitive enough to capture the effects of the sough-after design modifications.
The benchmark organised as part of the European project TurboNoiseBB is a contribution to the assessment of RANS-informed analytical methods applied to rotor–stator interaction (RSI) broadband noise. While a first part reported in the companion paper by Kissner et al. [1] focuses on the effect of the RANS model, the present work focuses on the impact of the acoustic model.
For several reasons, the low-pressure compressor of an aero-engine, the so-called fan, is the ideal candidate for testing RANS-informed analytical approaches for turbomachines. Firstly, it is composed of a single rotor–stator stage unlike high-pressure compressors or turbines, which combine several blade rows interacting in a very complex manner. Secondly, blades have a high-aspect ratio; this minimises the contribution of endwall effects, which are difficult to predict. Thirdly, because the duct contours are slowly varying and the mean flow is predominantly axial, weakly sheared and moderately swirling, the sound propagation can be reasonably approximated by analytical models, whose complexity can be increased for more accurate results [2]. Finally, contrary to turbine blades, the airfoils of transonic fan stages are thin and only slightly cambered, which are favourable conditions when using the flat plate (zero camber and zero thickness) hypothesis. Specifically, rotor–stator interaction broadband noise occurs in subsonic conditions so that turbulence–shock noise [3] does not have to be considered. Furthermore, the stochastic nature of turbulence is expected to make RSI broadband noise well suited for analytical modelling.
The development of analytical models for fan noise prediction has a long tradition, which is detailed in many papers, for example, by Posson et al. [4] and Moreau [5]. Therefore, the intent of the subsequent review is not to be exhaustive but rather to highlight references that help to specifically understand the models included in this benchmark. Note that the references are not introduced in chronological order. Instead, the focus is on the works of Amiet [6] and Hanson [7], which are typical of two different modelling approaches, valid for a single isolated airfoil and a cascade of airfoils, respectively.
The notations introduced in Figure 1 will be used throughout the paper.
  • ( x , y , z ) and ( x , r , θ ) refer respectively to a cartesian and a cylindrical coordinate system, where the x-axis corresponds to the duct axis.
  • ( 1 , 2 , 3 ) are indexes referring to the streamwise, upwash and spanwise components of flow.
  • The variable K refers to convective wavenumbers (of the incoming gust).
  • The variable k refers to acoustic wavenumbers (of the radiated pressure waves).
In this context, an oblique gust is understood to be a vortical disturbances featuring a spanwise wavenumber component, that is, K 3 0 . On the contrary, K 3 is equal to zero for parallel gusts (the wavefront is parallel to the leading edge of the blades). Finally, regardless of the dimension of the turbulence wavenumber spectrum, the same notation Φ 22 is used to denote the upwash velocity component. The dimension of the function is indicated by the number of dependent variables.
The first comprehensive theory to predict turbulence–airfoil interaction noise was formulated by Amiet [6] (1975). The author considered the case of homogeneous, isotropic turbulence impinging onto an isolated flate plate at zero mean-flow incidence. Amiet adhered to the acoustic analogy, specifically to the findings of Curle [8]. Consequently, he assumed that the unsteady lift produced by the upwash velocity component was the principal noise source mechanism. Amiet developped a formulation and an understanding of the problem, which is still the foundation for many of today’s models used to predict fan noise. If the turbulence is frozenly convected, Amiet showed that the turbulence representation required for the acoustic models can be simplified to a two-dimensional wavenumber spectrum obtained by integrating the three-dimensional wavenumber spectrum along its wavenumber component normal to the airfoil. For airfoils with a large aspect ratio, he further showed that the acoustic pressure in the plane at midspan can be calculated by only considering the component of the turbulence oriented parallel to the leading edge. The two-dimensional wavenumber spectrum retaining only parallel gust components is actually equal to the one-dimensional wavenumber spectrum multiplied by the spanwise correlation length of the upwash velocity component and by a factor 1 / π . As the one-dimensional wavenumber spectrum is easily measured by hot-wire anemometry, it is a useful turbulence representation to work with. To calculate the unsteady pressure jump, Amiet used a closed-formed expression [9] based on the Sears function [10] for low frequencies and a successive approximation solution [11] for high frequencies. Amiet’s work demonstrated that a prediction of turbulence–airfoil interaction noise is achievable as long as the kinetic energy and integral length scale of the incoming turbulence are known.
An important milestone to consider more representative cases of turbomachines was marked by the work of Glegg in 1999 [12]. The author generalised previous analytical works on two-dimensional cascades of airfoils to derive a theory for three-dimensional rectilinear cascade of infinite-span swept blades interacting with three-dimensional harmonic gusts convected in a uniform cross-flow. Glegg solved the problem with the Wiener–Hopf technique. In that approach, the acoustic pressure is obtained directly without resorting to the acoustic analogy. To calculate sound power, an integration of the acoustic intensity [13] over the faces of the cascade was performed. For a given gust mode, Glegg identified an effective frequency, below which the generated pressure waves are evanescent. The cutoff–cuton transition is delayed when the spanwise component of the incoming gust or the blade sweep increase. Both effects are similar and are potentially beneficial for noise reduction. This was also shown in previous works by Graham [14] for an infinite, isolated plate. Graham proved that an oblique gust sweeping the airfoil’s leading edge at supersonic speed emits sound waves efficiently, while acoustic waves are evanescent if the trace speed is subsonic.
Based on Glegg’s cascade model, Hanson [7] (2001) developed a comprehensive theory to predict the broadband noise radiated by a cascade of blades with lean and sweep. As a first step, Hanson extended Glegg’s cascade theory to turbulent gusts. Hanson introduced several coordinate transformations to convert a cascade of blades as arranged in an annular duct into a cascade of rectilinear blades. Besides isotropic turbulence, he also considered the case of axisymmetric turbulence using the model proposed by Kerschen and Gliebe [15]. He further extended the method to integrate the case of inhomegeneous turbulence distribution featuring a higher level of turbulence in the rotor wakes. Finally, he generalised the solution to rotating blades. Hanson proposed to apply a strip-based approach, which consists in dividing the stator into radial slices, in order to take into account the radial variation of the turbulence characteristics and of the geometry. The sound power is obtained by summing up the contribution of all strips. Hanson performed comparisons of his calculations (made for a typical radial position) to the experimental data of several fans covering a large range of parameters. Because of a lack of experimental data, turbulence intensity and integrale length scales were chosen to minimise the offset between predicted and experimental results. As an alternative to this method of reverse engineering, Hanson identified the possibility of using RANS inputs for future investigations.
Before Glegg’s model was introduced, methods considering the cascade effect or blade-to-blade interaction had relied on two-dimensional solutions in the plane ( e 1 , e 2 ) . This option had been pursued by Ventres et al. [16] (1982). In their approach, the acoustic analogy was applied using the fluctuating load on the blades as source mechanism. As a benefit, the chosen approach enabled to consider the duct acoustic effect by using the Green’s function for an infinite annular duct expressed as an infinite series of normal modes [13]. The strip theory approximation was applied. Thus, the rest of the problem had been reduced to the calculation of the pressure jump on each strip as though it were a linear cascade of two-dimensional, thin, flat plates. To obtain the blade pressure distribution, Ventres and co-authors applied a numerical method solving an integral equation relating the source strength of dipoles distributed on the plates to the velocity disturbance. The angle of the plates was assumed to match the incoming mean flow angle. The turbulent velocity field was modelled by the product of three Gaussian functions representing the spatial correlation of the turbulence in the three directions. Thus, the strips were cross-correlated in the radial direction ( e 3 ) via the radial correlation of the turbulence velocity, while the blade response remained two-dimensional.
In 2005, Nallasamy and Envia [17] first published a study dedicated to the prediction of fan broadband noise based on a RANS-informed analytical approach. The Source Diagnostic Test (SDT) fan rig equipped with three different designs of stator was used as a test case for the validation. The comparisons were done at three operating points relevant for the acoustic certification: Approach, Cutback and Sideline. The turbulence kinetic energy and the turbulence length scale at the stator leading edge position were extracted from RANS k ϵ simulations. The integral length scales were defined based on standard hypotheses for homogeneous isotropic turbulence. The used acoustic model corresponded to an extension of the Ventres’ method, which cannot account for the effect of oblique gust as mentioned before. Nallasamy and Envia were able to reproduce the general trends observed experimentally although the slope at high frequency was overpredicted due to the use of Gaussian functions to model the turbulence rather than the more physically realistic Liepmann or von Kármán turbulence models.
Based on a similar approach to Nallasamy and Envia and still using the SDT case for validation, Grace and co-authors published a series of papers, in which they investigated the sensitivity of the analytical models regarding some of the assumptions. Thus, in 2012, Grace et al. [18] showed that the method may create peaks with a high amplitude in the predicted noise spectra, which are not present in the measurements. These peaks are linked to resonances of the two-dimensional cascade model, that are much weaker for non-parallel blades. Grace et al. also started to investigate the validity of their formulation, in which the three-dimensional wavenumber spectrum Φ 22 ( K 1 , K 2 , K 3 ) is replaced by a two-dimensional wavenumber spectrum multiplied by a radial correlation function, denoted by Φ 22 ( K 1 , K 2 ) R r ( r ) . For one example, they found results that were significantly different between the two approaches. The computation of the three-dimensional cascade response, required for the exact approach, was a time-consuming process at high frequency, which explains the few frequencies considered in the study. In the same paper, Grace et al. found that modeling the inhomogeneity of the turbulence in terms of energy and length scale across the passage is not important (provided that an appropriate turbulence averaging is applied as recently showed by Kissner et al. [19] by applying an hybrid numerical method coupling the generation of synthetic turbulence and the linearised Euler equations). An analysis of the correlation lengths by Grace et al. indicated that none of the known isotropic models of turbulence could well reproduce the experimental data. They concluded that anisotropy is important. Finally, they showed that whatever the choice of the stagger angle representing the cambered airfoil was—either the metal angle at the leading edge, at the trailing edge or a combination of both values, no good agreement in amplitude and phase between the analytically calculated pressure jump across the blade surface and an accurate numerical solution accounting for the real blade geometry could be observed.
One year earlier, Grace et al. [20] published a sensitivity study of the RANS turbulence model, in which they highlighted the fact that an accurate prediction of the turbulence intensity and turbulent length scale of background turbulence can be of importance to obtain a good match with the measurements. They found that the plate angle have a significant impact on the noise prediction. Note that the difference of angle between the leading edge and the trailing edge of a stator depends on the fan loading as explained, for example, by Moreau and Guérin [21]. For the SDT as for the ACAT1 fan, this difference is about 30 to 40 ° . By choosing the trailing edge rather than the leading edge to fix the angle of the plate, Grace and co-authors found that the broadband noise levels measured at the exhaust position were lowered at low frequency but increased at high frequency. On the upstream side, the impact can be more substantial as shown by Jaron et al. [22], who reported a global decrease of the noise of several decibels. An explanation for that behaviour, which is linked to the orientation of the dipole sources with respect to the duct cross-section, was proposed by Blandeau et al. [23]. Grace and co-authors were also interested in the definition of the length scales for RANS simulations. They evidenced its importance for the acoustic results.
In 2015, Grace [24] extended once again Ventres’s solution to three-dimensional gusts. This time, the unsteady response of the cascade to a three-dimensional vortical disturbance was solved by using the integral equation approach of Ventres together with the similarity rules proposed by Graham [14]. Graham’s similarity rules relate a three-dimensional gust to a two-dimensional problem. Grace showed that only considering parallel gusts (i.e., only retaining the contributions for K 3 = 0 ) led to a strong underestimation of the sound power levels by about 20 dB over the relevant frequency range. Setting the unsteady vane response to the same value as that obtained for K 3 = 0 ( K 3 ) produced a good agreement at high frequency but an overprediction at low frequency. A similar result was achieved by using the two-dimensional solution.
Adopting an approach similar to Ventres, but using a three-dimensional solution [4] for the unsteady blade loading derived from an extension of Glegg’s model, Posson et al. [25] (2011) first developed a method to account for three-dimensional gusts in annular ducts. The unsteady loading was used as a distribution of dipole sources in the acoustic analogy together with the strip theory approach. To avoid having some of the drawbacks linked to the rectilinear cascade hypothesis, Posson et al. [26] proposed some corrections, in particular to minimise the resonance effects related to the presence of parallel, adjacent blades. As the hub-to-tip ratio decreases, the formulation is increasingly less exact and the solution is more prone to resonances. Finally, it should be noted that comparisons between Posson’s model and some of the other models cited above (Ventres, Hanson, Amiet) using the SDT experimental results for validation were presented, for example, by de Laborderie [27] and Lewis et al. [28]. Their results evidenced discrepancies between the models, especially at low frequency. Accounting for the cascade effect for skewed gusts greatly improved the prediction compared to solutions calculated either with a two-dimensional cascade model or with an isolated-airfoil model. The presence of the duct proved to be important too.
As shown by the literature review, the validation of RANS-informed analytical methods has been mostly restricted to the SDT data provided by NASA. The present study uses a new, independent data set obtained in 2018 at AneCom AeroTest during a test campaign organised in the framework of the European project TurboNoiseBB [29]. These data give the opportunity to further assess the RANS-informed analytical method. With the two questions raised at the beginning of the introduction in mind, a benchmark was organised reconsidering the impact of the two main ingredients of the method—(1) the RANS calculation (in particular the choice of the turbulence model) and (2) the aeroacoustic models. While the first part of the study is addressed in a companion paper by Kissner et al. [1], this second part deals with the impact of the acoustic models. The benchmark character is unique as more than ten independent European institutions using different CFD and acoustic solvers were involved. This large diversity guarantees that several key aspects of the RANS-informed analytical approach for fan broadband noise will be addressed.
The paper is structured as follows. The methodology to prepare the benchmark is described and the common input data for the noise calculation are presented. Then the acoustic prediction models are briefly introduced. Finally, the results are analysed in terms of the prediction of absolute levels and trends.

2. Benchmark Preparation

Section 2 provides some relevant information regarding the benchmark, including an overview of the data delivered to the participants.

2.1. ACAT1 Fan Benchmark Data

2.1.1. Tests at AneCom AeroTest

A short description of the TurboNoiseBB test campaign, which provided the validation data for the benchmark, was given by Guérin et al. [30]. Specific details on the instrumentation and data post-processing can be found in several publications [31,32]. The ACAT1 fan is a transonic fan composed of 20 rotor blades and 44 stator vanes. A longitudinal cut of the AneCom test rig is shown in Figure 2. The noise instrumentation is highlighted in red. Two configurations with different rotor–stator gaps were measured in the project TurboNoiseBB but only the short gap variant was considered for the benchmark. Furthermore, the focus was restricted to the three operating conditions relevant for acoustic certification: Approach, Cutback and Sideline. These points were distributed along a single, the so-called “Sea Level Static” working line. Note that the stator geometry was simple, with no lean and nearly no sweep. According to Hanson [7], sweep has no significant effect for low angles as the impact on the peak amplitude P W L p e a k is approximately proportional to the cosine of the sweep angle ϕ s w e e p , hence Δ P W L p e a k = 10 log 10 ( cos ϕ s w e e p ) .

2.1.2. Acoustic Data

The acoustic and aerodynamic tests were conducted separately in order to avoid a contamination of the acoustic results by the instrumentation (hot-wire probes and total pressure sensor rakes mounted along the stator leading edge). The noise results for the bypass duct are based on measurement data provided by the line array of condenser microphones AX1 indicated in Figure 2. The microphones were wall-flush mounted in a section of constant radii located far downstream of the stator. The microphone signals were filtered using an axial wavenumber decomposition technique to efficiently separate hydrodynamic and acoustic pressure fluctuations [33]. The signals were synchronised with the rotor shaft so that the rotor-locked part of the fluctuations could be removed [34]. The model used to deduce the sound power spectra based on the sound pressure assumes an equal energy density distribution between the propagating acoustic modes of the same frequency band [33,35]. Very similar results were obtained by Pereira and Jacob [36].
The results in the forward arc are less prone to uncertainty. They were obtained by processing the sound pressure spectra measured by the 25 far-field microphones arranged in a broken semicircle inside the large anechoic chamber (see Figure 2). The bypass and core flows of the UFFA rig are piped outside of the anechoic chamber. Furthermore, the intake of the rig protrudes inside the anechoic chamber from one sidewall. Thus, the far-field microphones of the UFFA rig measure only the noise component radiated through the inlet. As the ambient flow velocity in the plenum was very small during the test, it was neglected for the calculation of the sound power. Contrary to the in-duct results, the far-field measurements were not rotor-synchronised. Therefore, the tones are (strongly) present in the spectra.
The acoustic results for the Sideline conditions are shown in Figure 3. Two curves were drawn per hand on one of the graphs to exemplary suggest the presence of at least another source of broadband noise besides rotor–stator interaction (RSI) broadband noise. The peak frequency of RSI noise is approximately 3 times the blade passing frequency (BPF), which is close to the empirical factor of 2.5 proposed by Heidmann [37]. The Strouhal number S t given in x-axis of the graphs in Figure 3 is defined in accordance with Kissner et al. [1]: S t = f R / W 0 , with f the frequency, R 4.23 m the radius at the duct casing upstream of the stator leading edge, and W 0 (≈240 m/s at Sideline) the averaged flow velocity upstream of the stator. The second non-dimensional number k R shown on the top x-axis of the graphs corresponds to the Helmholtz number. This number permits to identify the frequency range within which pressure peaks, produced by acoustic duct modes while they become cut-on, are likely to be visible (typically for k R < 10 ).

2.2. Input for the Analytical Models

2.2.1. RANS Calculations

As the flow Mach number is one of the key parameter for fan noise, it was decided to extend the benchmark, which was focused on the condition Approach in Part I, to two more operating conditions, namely Cutback and Sideline. The corresponding values of rotation speed and mass flow are provided in Table 1. The structure of the flow differed significantly between the three operating conditions (see Guérin et al. [30]). At Approach, the flow detached at the leading edge as the rotor was highly loaded. This flow separation observed in the RANS calculations could not be evidenced as such by the experimental data. Due to a reduced rotor loading, no flow detachment was found at the highest investigated speed.
As shown in Part I of the benchmark, the choice of the turbulence model has a substantial impact on the predicted acoustic levels. All the RANS solutions used in Part II were produced by DLR with the CFD solver TRACE [38] using the Shear-Stress-Tensor (SST) k ω turbulence model from Menter [39]. For Approach, this corresponds to solution RANS #2 presented in the Part I paper [1]. This turbulence model seems to be predominantely used in the community. In fact, the study of Part I has shown that the agreement between CFD and the hot wire measurements is not satisfactory for any of the studied turbulence models. The hot-wire measurements data could not be used either, because of the current uncertainty in the data, in particular at high speed. As a consequence, the goal of the present benchmark was not to find out the most suitable acoustic model, but to investigate the relative impact of the model assumptions on the acoustic predictions and to quantify the variations.

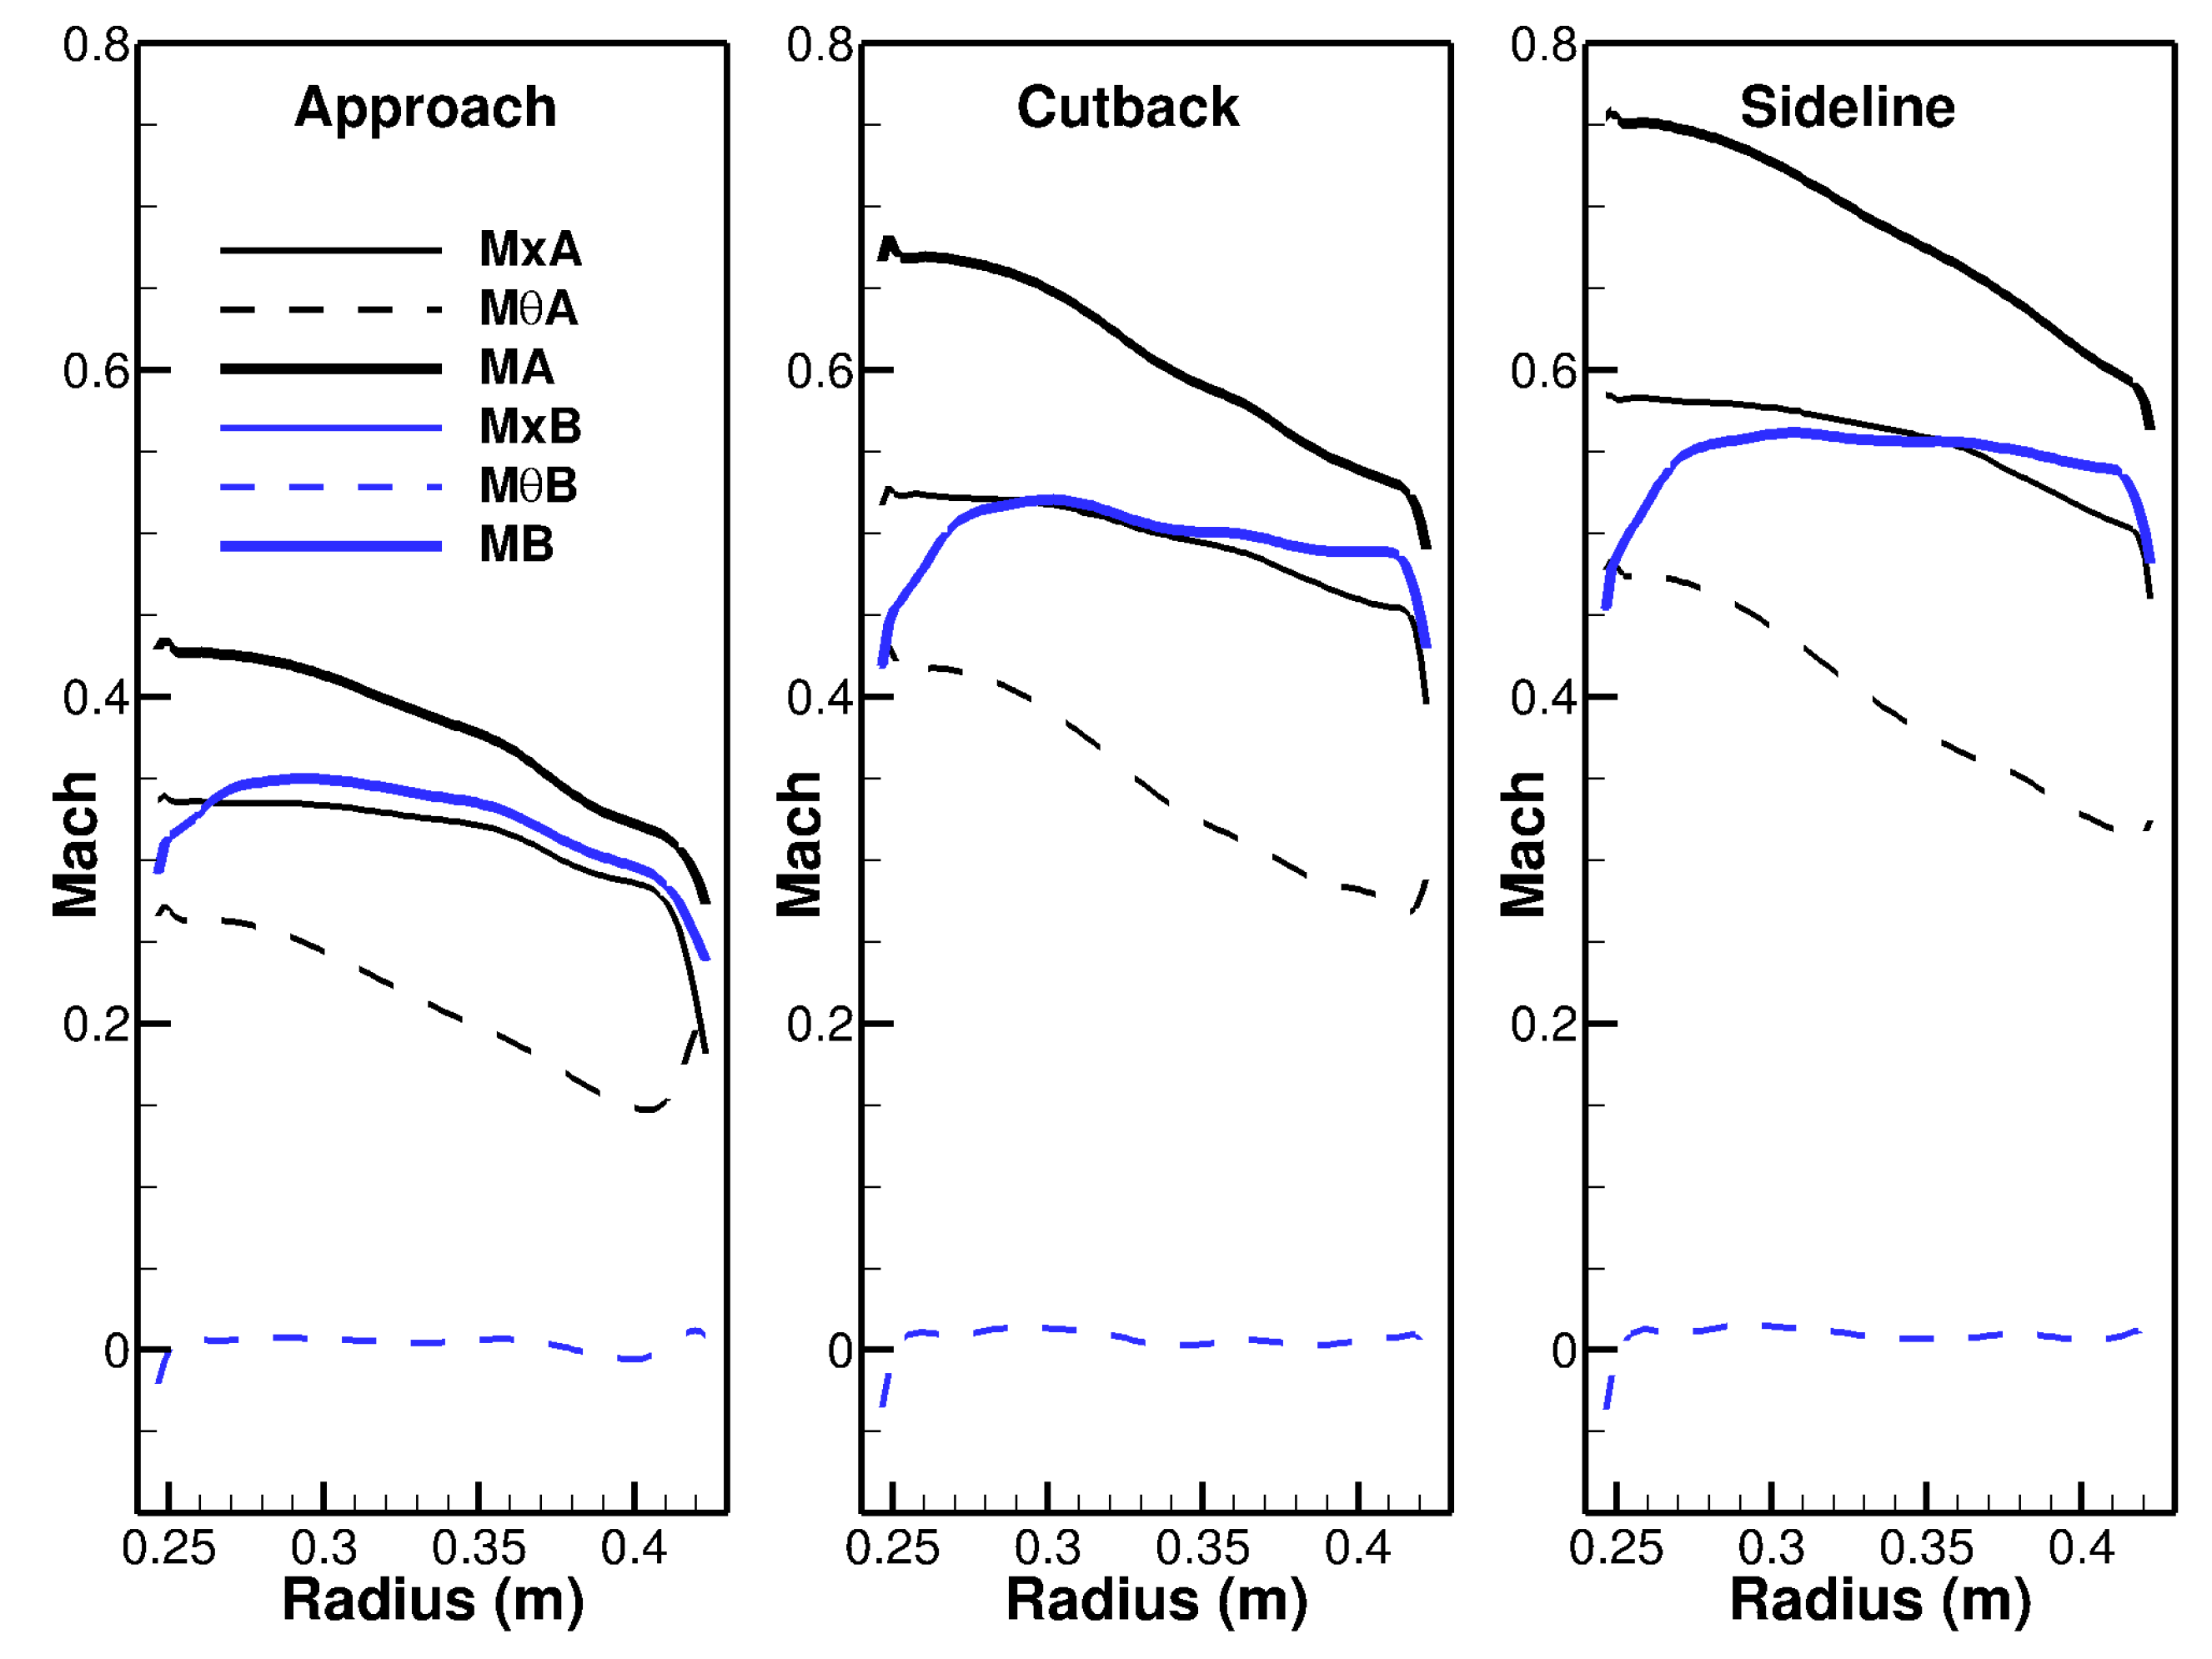
2.2.2. RANS Data Processing

For a given operating point, all the acoustic simulations were based on the same input obtained by analysing the geometry and the flow solution of the RANS calculation. The data analysis—done with the DLR in-house tool C3D_T2P [40]—was conducted at 97 radial positions equally distributed along the whole span (see Figure 4). The streamline positions in the ( x , r ) -plane were determined after having circumferentially averaged the mean flow. Only the part of the flow going into the bypass duct was considered in the prediction. Thus, the interaction with the Engine Support Stator (ESS) located at the core entry was ignored. For each radial position of the stator, the following values were provided: the axial and tangential speeds up- and downstream of the stator (see Figure 5), the turbulent kinetic energy and the turbulence length scale (see Figure 6). Additionally, averaged values of the speed of sound and of the mean flow density calculated upstream of the leading edge were provided. Only one acoustic code was able to consider the real profile of the airfoil. In the other models, the stator vanes were discretised into flat thin plates, whose stagger angle varied along the span (see Figure 7).
Background and wake turbulence contributions were averaged and modelled by one single contribution having equivalent TKE and TLS values.
The turbulence kinetic energy k ¯ RANS was circumferentially area-averaged and the turbulence length scale Λ ¯ RANS was weighted by the local value of TKE as proposed by Jaron et al. [22]:
k ¯ RANS ( r ) = 1 Δ θ 0 Δ θ k RANS ( r , θ ) d θ ,
Λ ¯ RANS ( r ) = 1 Δ θ k ¯ RANS ( r ) 0 Δ θ k RANS ( r , θ ) Λ RANS ( r , θ ) d θ .
From RANS, only a single integral length scale can be calculated locally. It corresponds to the average size of the largest energy containing eddy. The local value of the turbulence length scale Λ RANS was calculated based on the local values of k and ω * , where ω * is the specific turbulence dissipation rate [41]. The following relationship was applied:
Λ RANS ( r , θ ) = C Λ k RANS ( r , θ ) C μ · ω RANS * ( r , θ ) ,
with the two constants C μ = 0.09 and C Λ 0.4 . As a consequence of this averaging technique, background and wake turbulence are mixed. Further ways to determine the turbulence integral length scale are discussed in the companion paper [1].
Note that the turbulence characteristics were extrapolated downstream of the mixing plane up to the stator leading edge position by using the reconstruction method based on a semi-empirical model proposed by Jaron [40]. This extrapolation aimed at improving the comparison to the experimental data. Indeed as the turbulence in the rotor wakes is convected towards the stator, its intensity tends to decrease, while its length scale tends to increase. These two effects shift the peak frequency to a lower value and produce a slight increase of the peak amplitude as shown in Part I.

3. Acoustic Models

Some general features of the acoustic models of the benchmark are presented in preamble to a more detailed analysis of the models.

3.1. Preamble

  • All methods of the benchmark are formulated in the frequency domain. They target a representation of broadband noise in the form of a frequency spectrum but not as a time signal.
  • It was assumed that broadband noise was generated by the interaction of the incoming turbulence with the blades. Other sources of broadband noise like rotor self-noise, stator self-noise and rotor–ESS interaction noise were ignored for the benchmark.
  • The turbulence was assumed to be homogeneous, isotropic turbulence at each radial position/for each strip. In all calculations, the turbulence was imposed as if it were a background turbulence but of course using the equivalent TKE and TLS values of the benchmark, which include the wake and background contributions.
  • Either the von Kármán or the Liepmann model was used to describe the turbulence. The difference between the two models is rather small. In fact, the differences are smaller than 1 dB for the one-dimenional wavenumber spectrum. As observed by Grace [24], the agreement with experiments is better using the Liepmann model than using the Gaussian model.
  • Most of the methods are mathematical expressions containing integrals and summations. A few methods resort to a very complex modelling of RSI noise, which has a direct impact on computation time. The latter can potentially exceed one day as reported by Grace [24]. The solution labelled BB1 is partly numerical as it used a CAA solver to calculate the acoustic response of the stator. That method was the only one able to account for the real blade profile including the effects from the mean flow.
  • All other methods replaced the stator vanes by flat plates as isolated airfoils or arranged in a cascade. The “flat plate” hypothesis implies that the most representative stagger angle is used. All the methods relied on the angle at the leading edge except for results TA1 and TA2, which considered the inflow angle. As the flow incidence is small at the stator leading edge, no strong effect is expected from that choice, even though the stagger angle is known to be a sensitive modelling parameter.

3.2. Classification of the Methods

The methods used for the benchmark were classified into two different categories. The result of that classification is shown in Figure 8. One group contains methods that explicitly refer to the acoustic analogy, while the other group contains methods that rely on a direct calculation of the pressure cascade response:
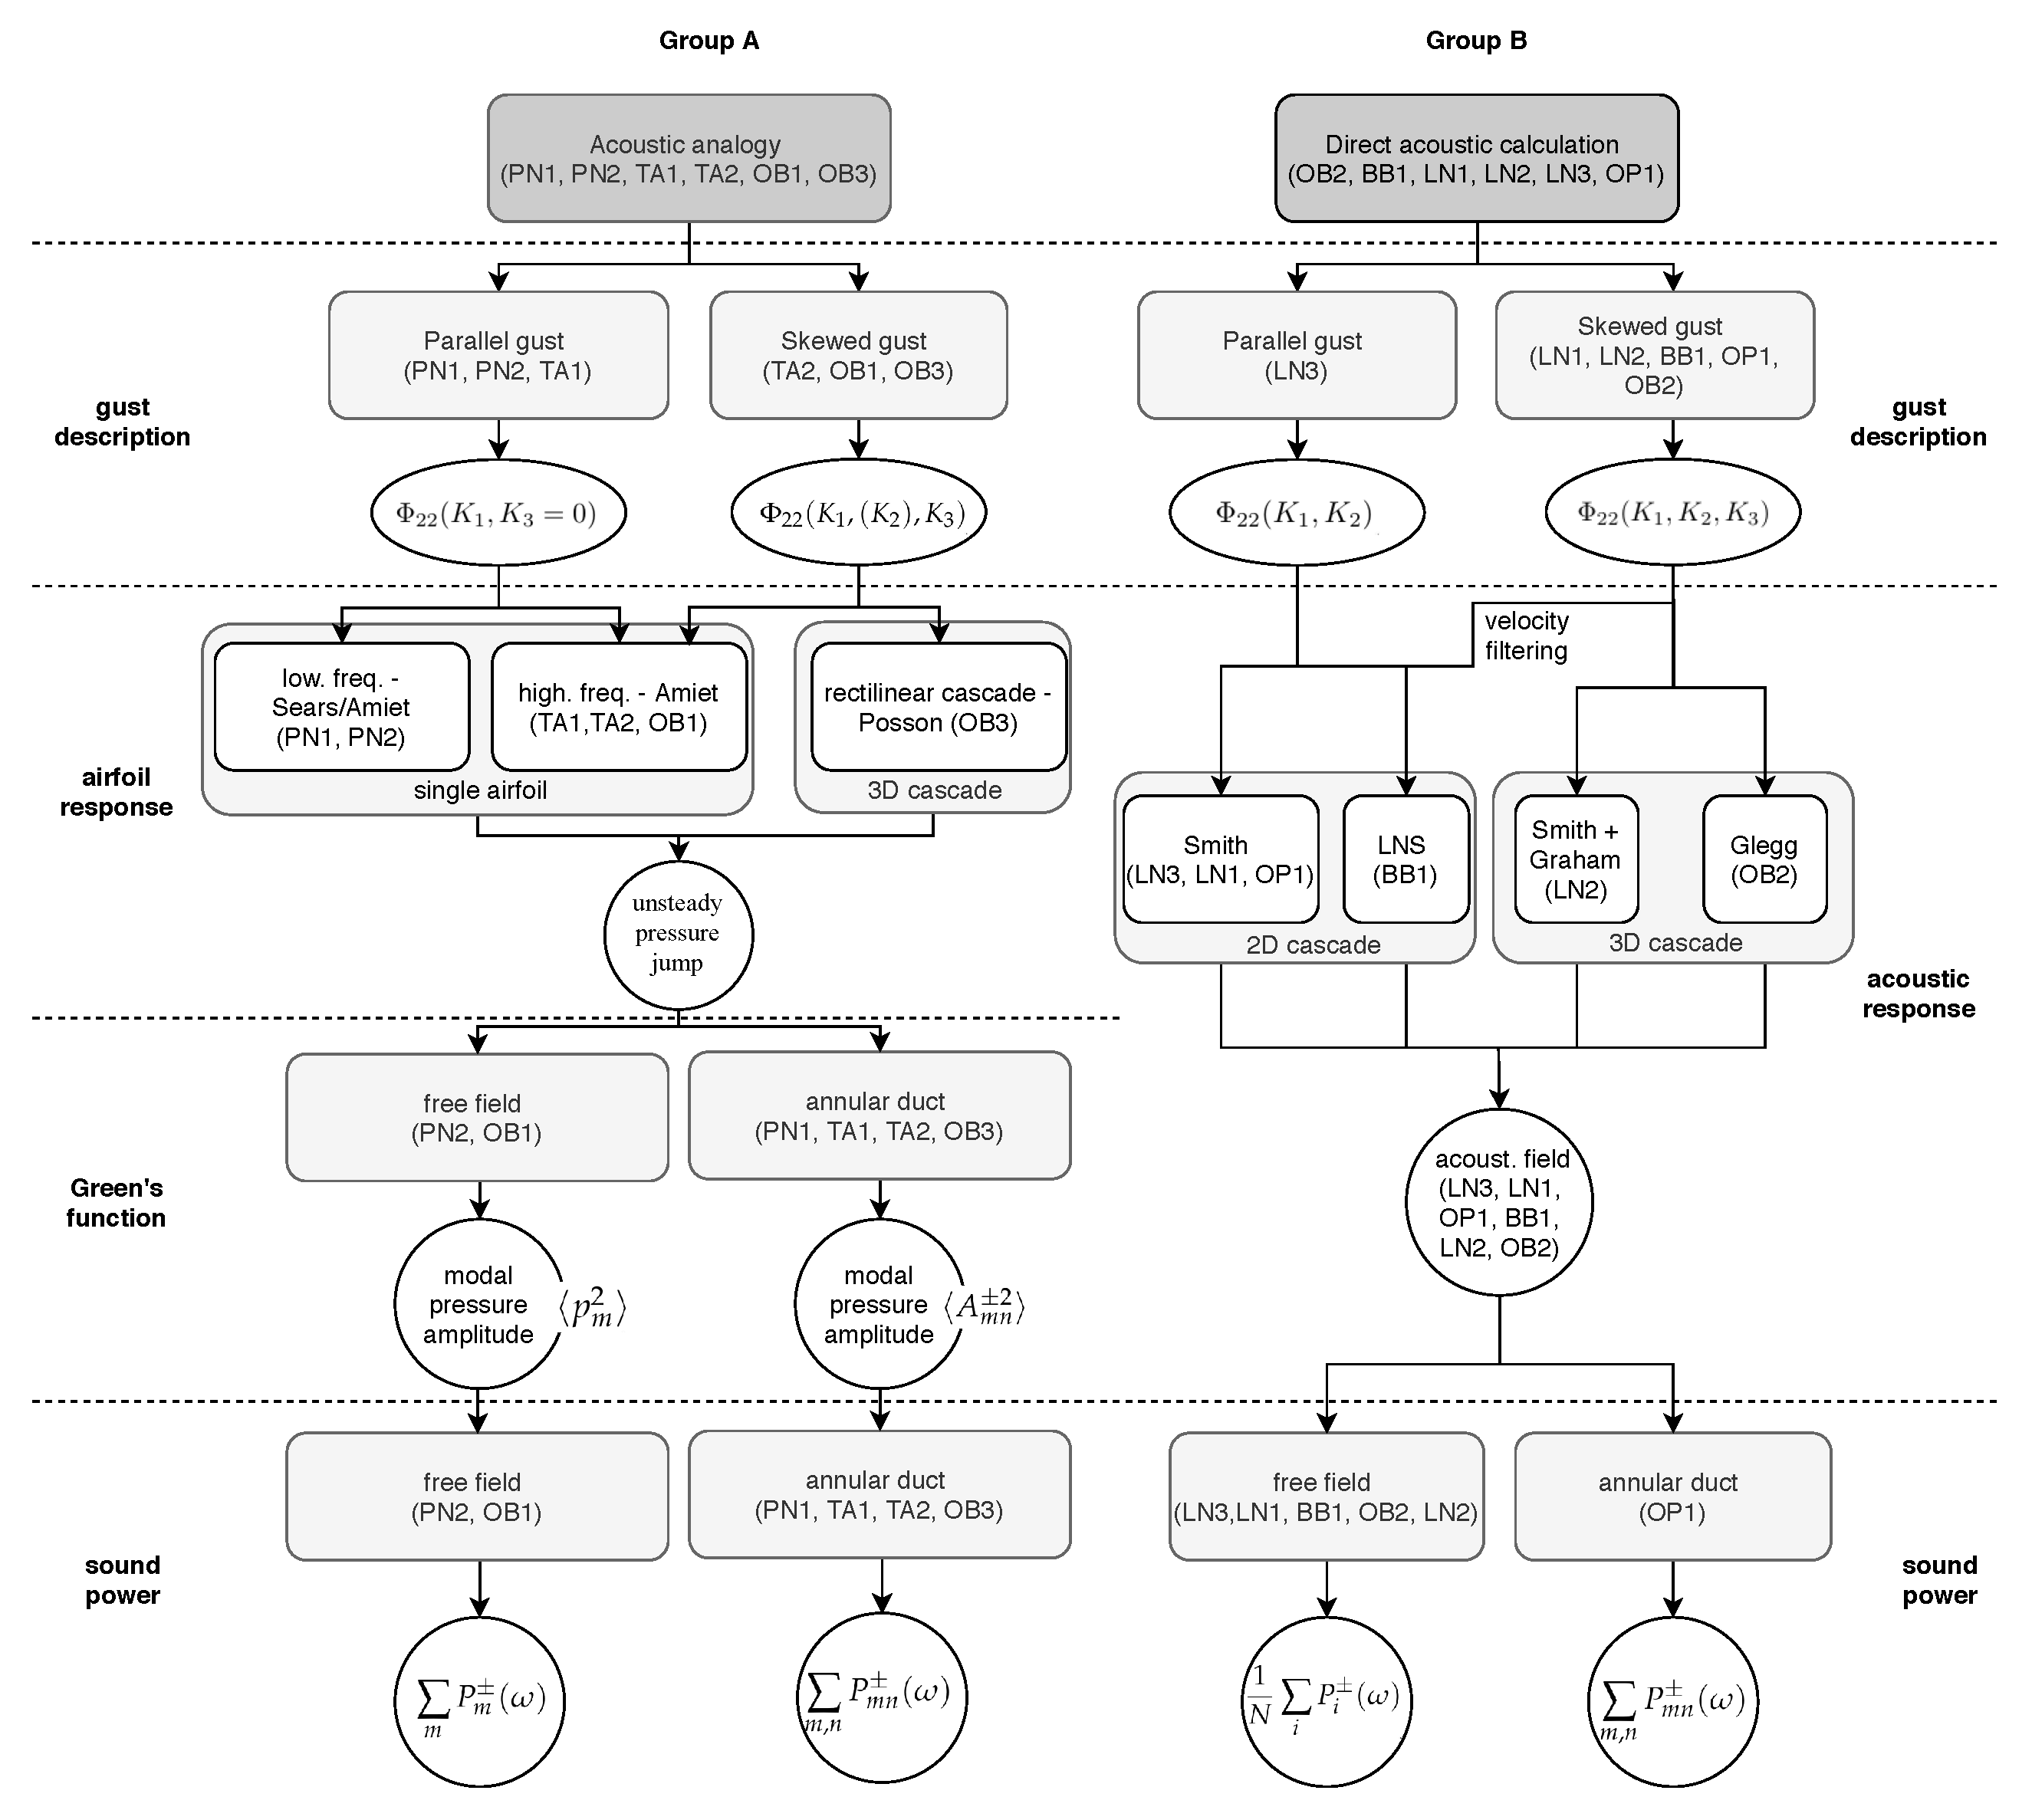
  • Methods based on the acoustic analogy were assembled in Group A. The models use a source term (the unsteady lift produced by the turbulence on the blade surface) in combination with a Green’s function to calculate the acoustic pressure. They either make the assumption of a single, isolated airfoil or consider a cascade of airfoils.
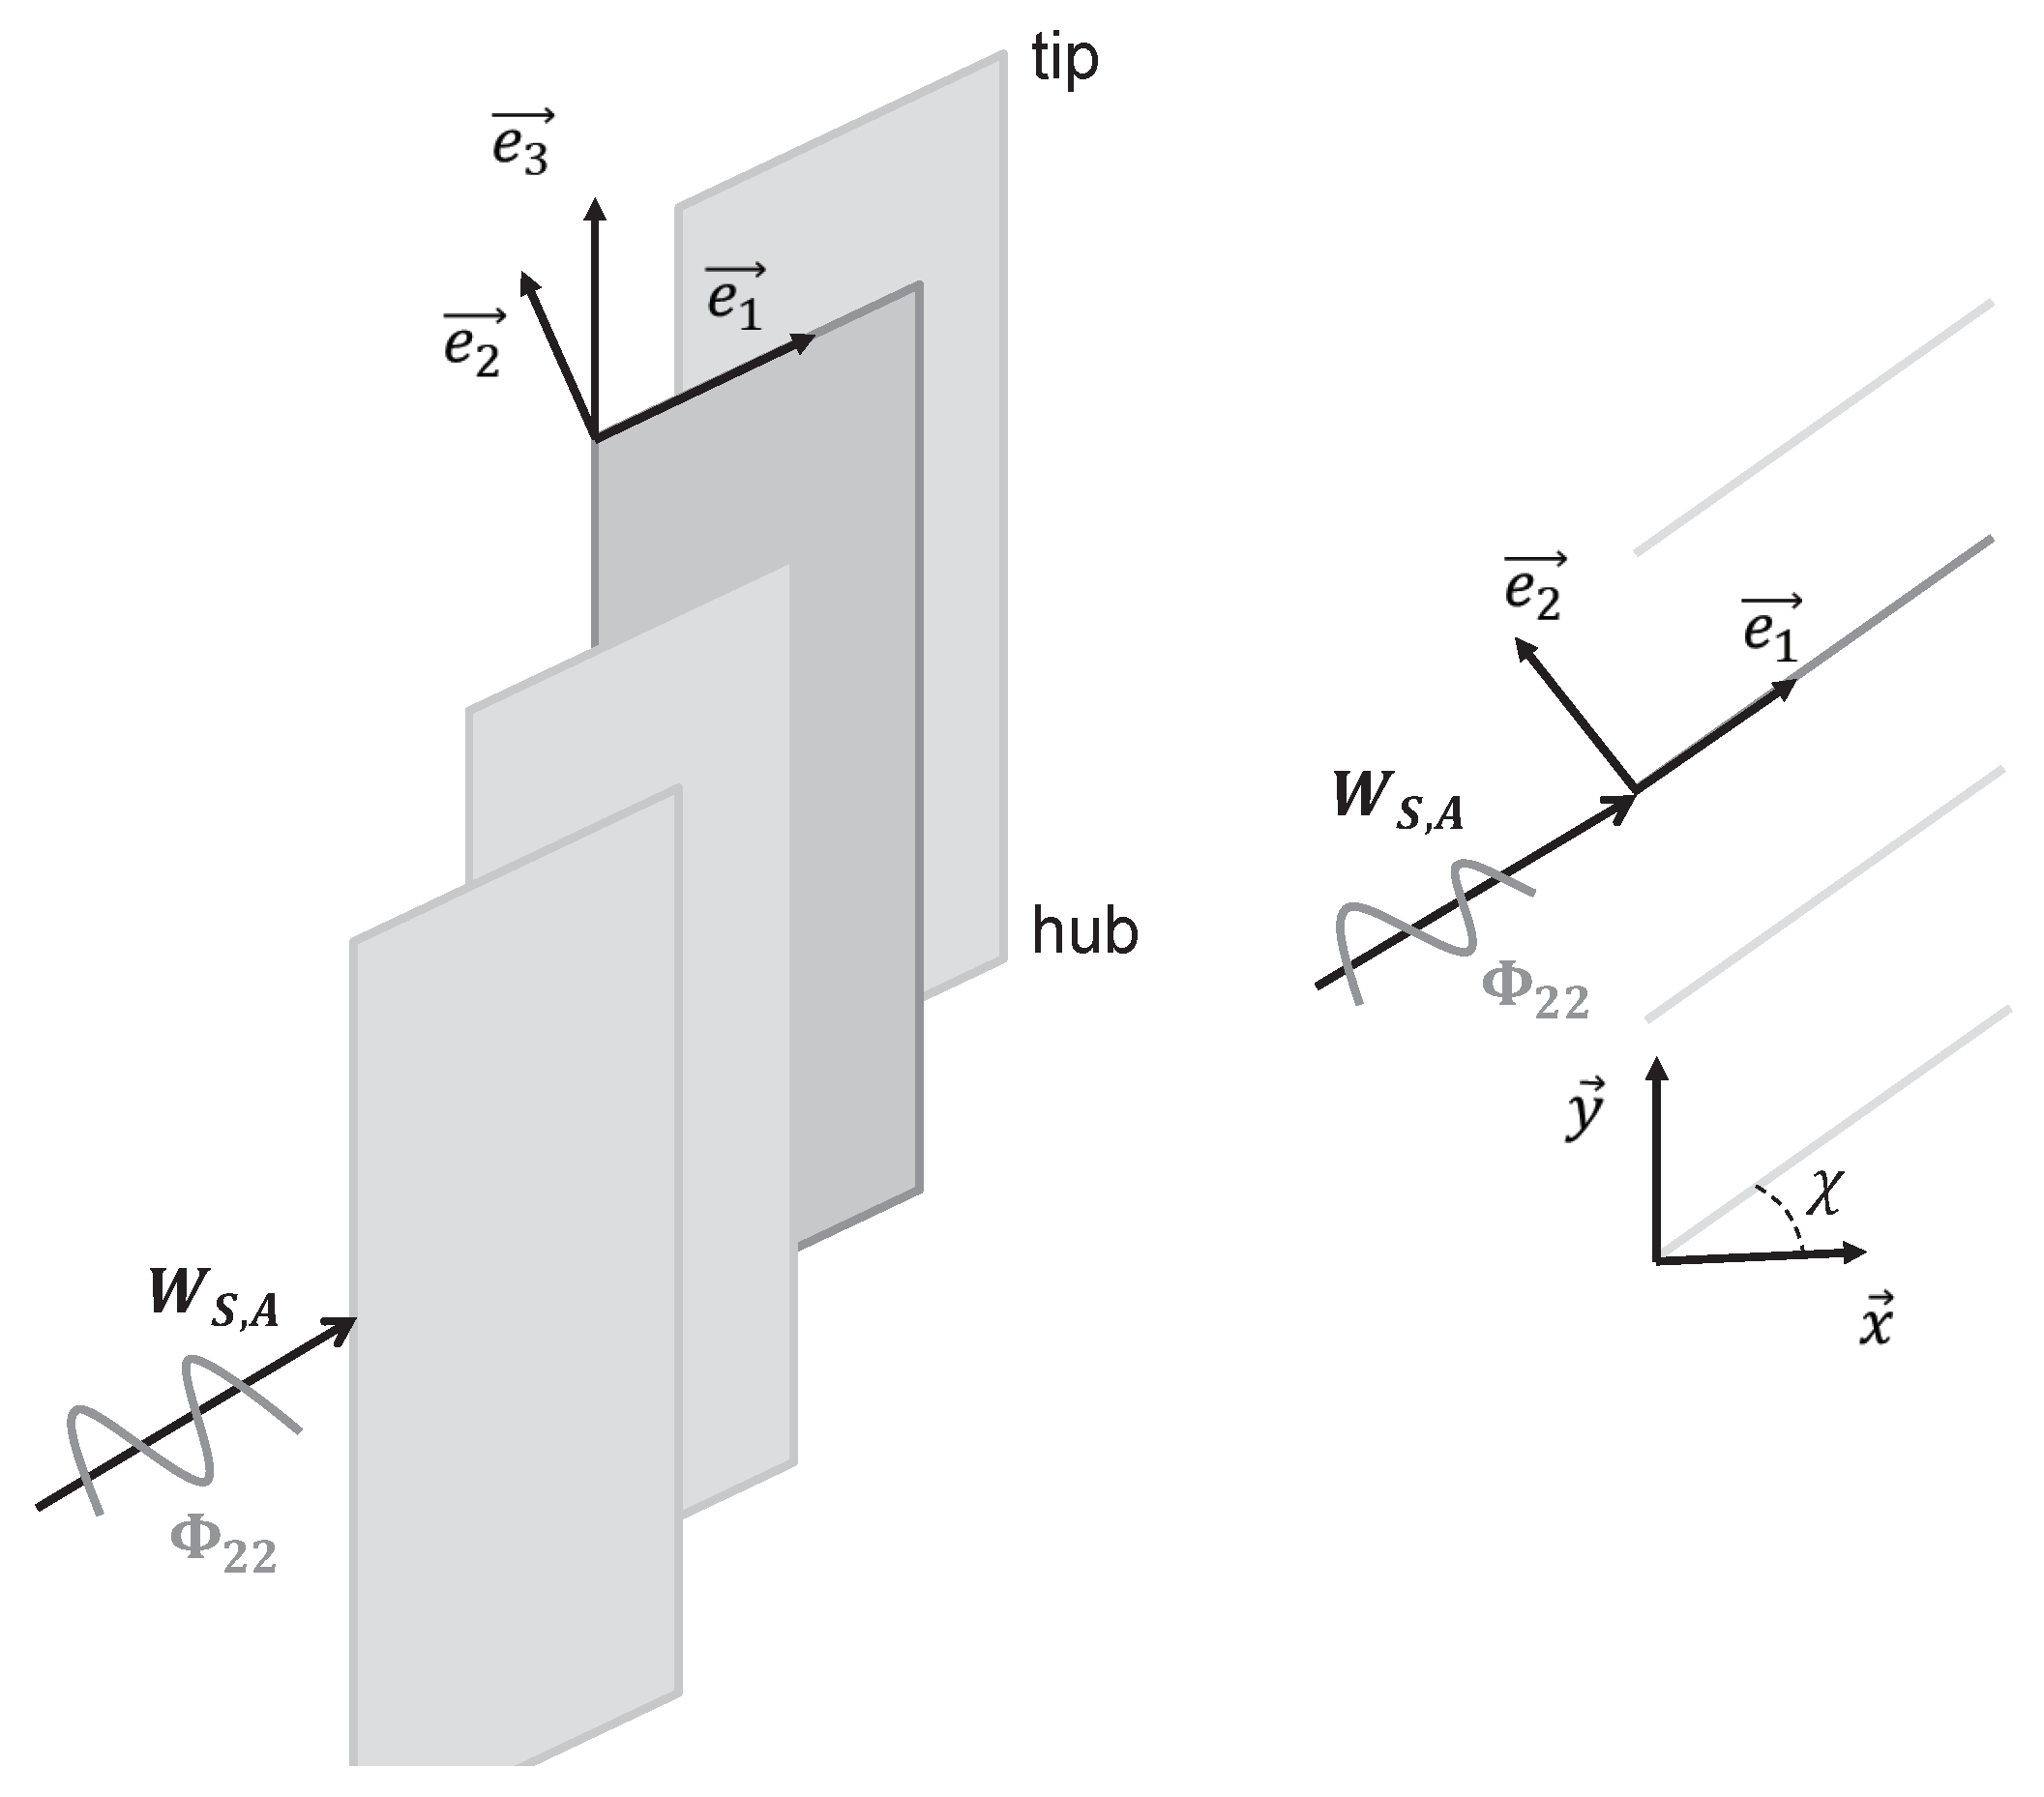
  • The methods of Group B follow a different approach. They rely on a direct calculation of the acoustic pressure response of the cascade of blades without requiring a source term. Therefore there is one step less in the workflow represented in Figure 8. All of the studied methods account for the cascade by considering separate radial strips. These strips are then unwrapped to match the theoretical case.
Table A1 and Table A2 in Appendix A summarise some important characteristics of the models and refer to the publications where more details can be found.

3.3. Methods Based on the Acoustic Analogy (Group A)

Approaches of Group A all rely on the acoustic analogy as mentioned before. To get an acoustic pressure, two main steps are necessary—(1) the calculation of the unsteady pressure distribution on the plates created by the vortical disturbance and (2) the integration along the stator radius of the source term multiplied by the appropriate Green’s function. The result is a distribution of the pressure at any point in space, which can then be used to calculate the sound power. Two options are possible regarding the calculation of the pressure jump on the surface of the plates. Five of the six methods considered that the blades are isolated but used different unsteady lift response models. The sixth method considered the cascade effect, that is, accounted for the blade-to-blade interactions. Regarding turbulence, three solutions assumed that the gusts impinged parallel to the leading edge, while the other three methods accounted for the oblique component. Concerning the choice of the Green’s function, two options were tested in the benchmark. Two solutions considered the Green’s function in free-field with a uniform axial mean flow as if there were no hub and no casing surrounding the stator. Four solutions resorted to the Green’s function for an infinitely long annular duct with a uniform axial mean flow. This last Green’s function is expanded in normal modes [2,13].
The methods of Group A are now described, starting with the one implemented in the solver PropNoise. The latter is presented in more detail than the other methods as it was used to perform all the noise calculations presented in Part I of the benchmark [1]. Even though all methods in Group A are different, they must follow the same key steps.

3.3.1. Solutions PN1 and PN2

The methods implemented in the DLR in-house code PropNoise [42] is among the simpler methods used in the benchmark. It is subsequently presented using the formalism of Moreau and Guérin [43]. The objective is to enumerate the various steps necessary in order to obtain a noise prediction based on RANS data and to illustrate the ambiguity and complexity of some choices.
As mentioned before, the acoustic prediction relies on the acoustic analogy. For the prediction of RSI noise, only the source term related to the vane unsteady loading mechanism is considered. The other contributions for example, due to the turbulence–potential-field interaction are not modelled. The unsteady loading is calculated by assuming that the vanes are isolated, which means that blade-to-blade interactions are not considered.
For a harmonic gust, Moreau and Guérin [43] showed that the pressure complex amplitude A m n of the in-duct acoustic mode with azimuthal and radial orders m and n, at angular frequency ω = 2 π f , can be written as
A m n ± ( ω ) = i V η R R g ^ m n ( ω , r ) exp ( i k x x S , A ( r ) i m θ S , A ( r ) ) σ m n ( ω , r ) d r ,
with the superscript ± indicating the direction of progagation of the waves (“−” for upstream and “+” for downstream), V the number of vanes, R the tip radius at the vane, η the hub-to-tip ratio, r the radial position, x S , A and θ S , A , respectively the axial and circumferential positions of the leading edge, g ^ the radial shape function, σ the source term and k x the axial, acoustic wavenumber.
Broadband noise is represented by the expectation values · of the pressure modes:
A m n ± 2 ( ω ) = V η R R | g ^ m n ( ω , r ) | 2 σ m n 2 ( ω , r ) l r ( ω , r ) d r ,
where it was assumed that the radial correlation length of the source term l r is small compared to the radial variations of g ^ and σ . Later, the correlation of the source term will be equated to the radial correlation length of the upwash component of the turbulence. For the derivation of Equation (5), it was also assumed that turbulence is frozenly convected and that the vanes are uncorrelated. The derived equation is similar to what Ventres et al. [16] or Nallasamy and Envia [17] proposed as solution to describe the background turbulence contribution. Differences are essentially due to the fact that the cascade effect is ignored in PropNoise, which greatly simplifies the solution.
The source term σ in Equation (5) is given by:
σ m n 2 ( ω , r ) = | k , m n ( r ) c ( r ) | 2 · 1 2 ρ 0 W S , A 2 ( r ) 2 C L 2 ( ω . r ) · | Ψ m n ( ω , r ) | 2 ,
where k is the component of the acoustic wavenumber normal to the vane in the ( x , r θ ) -plane, ρ 0 is the mean flow density, c is the vane chord, W S , A is the incident velocity at the stator leading edge, C L is the unsteady lift coefficient, and Ψ is a chordwise correlation function.
The indices ( m , n ) are dropped in the following as well as the dependency upon r to simplify the writing style.
The vane is replaced by a flat plate whose stagger angle is assumed to be equal to the metal angle at the leading edge ( χ S , A ). The wavenumbers k and k l , respectively normal and parallel to the blade chord, are calculated by projecting the axial ( k x ) and azimuthal ( k θ = m / r ) components of the wavenumbers of each acoustic mode into a system of coordinates relative to the flat plate [43]. This yields the following relationships between the wavenumbers:
k = k x sin ( χ S , A ) k θ cos ( χ S , A ) ,
k l = k x cos ( χ S , A ) k θ s i n ( χ S , A ) .
For a harmonic gust, the unsteady lift coefficient C L is calculated as follows:
C L ( ω ) = 2 π u ( ω ) W s , A S ( ω ) ,
where u is the normal component of the gust relative to the vane and S ( ω ) is the incompressible Sears function [10]. Using the Sears’ solution means that the velocity disturbances are assumed to be vertical to the vane surface and to travel parallel to the leading edge. The following solution is obtained for turbulent gusts:
C L 2 ( ω ) = 4 π 2 Φ 22 ( ω ) W S , A 2 S 2 ( ω ) .
Hereby, it was assumed that the transverse component of the wake turbulence corresponds to the normal component to the flat plate. The spectrum Φ 22 corresponds to the one-dimensional wavenumber spectrum. The Sears function [10] in its low-frequency approximation form [13] is equal to
S ( ω ) 1 1 + 2 π κ ,
where κ = ( ω / W s , A ) ( c / 2 ) is a reduced frequency.
The chordwise correlation function (a concept introduced by Hanson [44]) enables to account for the fact that the source is not acoustically compact [9]. This term is defined by
Ψ L ( ω ) = 1 c l = 0 c h L ( l ) e i k l l d l ,
where h L is the non-dimensional chordwise distribution of the loading ( 1 / c l = 0 c h L ( l ) d l = 1 ). Admittedly, the distribution of the unsteady load is strictly valid for a compact gust but the use of an acoustic, non-compact term leads to correct trends at high frequency as shown by Jaron et al. [22]. The distribution of chordwise lift is assumed to be real, constant and independent of frequency as proposed by Sears:
h L ( l ) = 2 π c l l .
Thus we obtain the following analytical expression for Ψ L ,
Ψ L ( ω ) = J 0 k l c 2 i J 1 k l c 2 e i k l c 2 ,
where J ν is the Bessel function of first kind and order ν . The blade response model implemented in PropNoise is limited by two factors—(1) it inherently contains the hypothesis that only parallel gusts are relevant for broadband noise following Amiet’s findings at midspan for an infinite long isolated airfoil in free field and (2) it uses the Sear’s function as the blade response function, which is only correct at very low frequency.
The modal Green function g ^ m n is given by
g ^ m n ( ω , r ) = i 4 π R f m n ( r ) k R α m n ,
where f m n is the normalised radial eigenfunction, α m n a cut-on factor, and k = ω / c 0 . All these quantities as well as the derivation of acoustic power are defined in Appendix B. Note that an equivalent solid body swirl of rotational angular speed Ω s is also considered. Its value is defined so that the swirl Mach number at the tip is the same for the velocity distribution of a free-vortex flow. The Green’s function extension—valid for low swirl Mach numbers—has an impact on the cut-on frequency of the acoustic modes.
The turbulence is considered to be homogeneous and isotropic for each strip. Of course, this contradicts the radial variation of TKE and TLS observed in the simulations. However, since the radial correlation length is small compared to the distance over which significant variations of TKE and TLS happen, the assumption is presumed to be acceptable. The turbulence is convected by the main flow. The vector of velocity perturbations can be split into three components, u = ( u 1 , u 2 , u 3 ) . As illustrated in Figure 1, index 1 denotes the streamwise direction, and indexes 2 and 3 define the other two directions. For simplicity, we define component 2 as the direction normal to the vane surface and component 3 as the radial or spanwise direction. Additionally, a three-dimensional wavenumber vector K = ( K 1 , K 2 , K 3 ) is defined to represent the spatial evolution of the turbulence.
In PropNoise, only the upwash component u 2 of the turbulence is considered in the calculation of the blade response function. The spectrum Φ 22 used in Equation (10) is obtained by integrating the three-dimensional wavenumber spectrum along the wavenumber components K 2 and K 3 :
Φ 22 ( K 1 ) = Φ 22 ( K 1 , K 2 , K 3 ) d K 2 d K 3 .
As the turbulence is convected by the mean flow, the wavenumber K 1 satisfies the following relationship: K 1 = ω / W S , A . If Φ 22 is a power spectral density, then it follows:
Φ 22 ( ω ) = 2 Φ 22 ( K 1 ) W S , A .
The factor 2 is attributed to the fact that unlike Φ 22 ( K 1 ) , Φ 22 ( ω ) is a one-sided spectrum. The square of the rms value of the upswash velocity u 2 2 satisfies:
u 2 2 = 0 Φ 22 ( ω ) d ω .
The spectrum Φ 22 is an interesting quantity as it is easily measurable for example, by hot wire anemometry.
As shown by Amiet [6], the two-dimensional wavenumber spectrum for the parallel gust components, Φ 22 ( K 1 , K 3 = 0 ) , is related to the product of the one-dimensional wavenumber spectrum Φ 22 ( K 1 ) and the radial correlation length l r :
Φ 22 ( K 1 , 0 ) = 1 π Φ 22 ( K 1 ) l r ( ω ) .
This product appears in PropNoise, therefore its final formulation is equivalent to considering only parallel gusts.
For each strip, a spectrum Φ 22 ( ω ) is calculated by means of the von Kármán isotropic turbulence model. Velocity amplitudes are obtained by assuming
k ¯ RANS = 3 2 u 2 ,
where u 2 = u 1 2 = u 2 2 = u 3 2 for isotropic turbulence. The integral length scale Λ is set equal to the CFD value Λ ¯ R A N S . The one-dimensional wavenumber spectrum for the von Kármán model [6] is given by
Φ 22 ( ω ) = u 2 2 · 2 Λ 2 π W R , B 1 + ( 8 / 3 ) z 2 ( 1 + z 2 ) 11 / 6 ,
where z = S t / S t 0 is a normalised frequency so that S t = ω Λ / W R , B and S t 0 = π Γ ( 5 / 6 ) / Γ ( 1 / 3 ) . The relative speed at the rotor exit W R , B is used to account for the fact that the wake turbulence is produced by the rotor. While passing from the rotor frame to the fixed stator frame, no Doppler effect is included. The radial correlation length l r ( ω ) is determined using the following equation [6]:
l r ( ω ) = Λ 8 3 Γ ( 1 / 3 ) Γ ( 5 / 6 ) 2 z 2 1 + z 2 ( 3 + 8 z 2 ) .
The correlation length l r reaches approximately the value Λ at its peak and tends to zero in the two directions ω 0 and ω . The correlation length is one of the most sensitive parameters of the modelling as the noise amplitude is directly proportional to it and the peak frequency is inversely proportional to it. The integral length scale, the rms value of the velocity, the one-dimensional spectrum and the radial correlation length are all related by the following integral equation:
Λ 2 = 1 u 2 2 0 Φ 22 ( ω ) l r ( ω ) d ω .
The results PN1 and PN2 differ in the applied Green’s function used. The in-duct solution was applied for PN1 and the free-field formulation for PN2. Once the pressure is known it is straightforward to derive the sound power as the flow is assumed to be homentropic and irrotational.
  • In-duct formulation (PN1): Based on A m n ± 2 , a modal power amplitude P m n ± is calculated for each cut-on mode ( m , n ) using the equations in Appendix B. For each frequency, the sound power is obtained by summing the modal contributions: P ± ( ω ) = m , n P m n ± ( ω ) .
  • Free-field formulation (PN2): The pressure amplitude p m 2 for the azimuthal mode m is used to calculate the sound power P m by integrating the sound intensity along the polar arc. The sound intensity is obtained by applying the Blokhintsev invariant technique [43,45]. The sound power integrated between the polar angle ψ = 0 and π / 2 corresponds to the downstream radiation, and the part between π / 2 and π to the upstream one. The sound power for each frequency is integrated by summation over m: P ± ( ω ) = m P m ± ( ω ) .

3.3.2. Solutions TA1 and TA2

The results TA1 and TA2 were calculated respectively by the codes TinA1D and TinA2D, which were both developed at ONERA. A detailed description of the implemented models can be found in for example, Reboul et al. [46,47]. The results TA1 were obtained following a method that is in many respects similar to the one used for obtaining the solution PN1, including the use of the parallel gust assumption modelled by the product Φ 22 ( K 1 ) l r ( K 1 ) . The principal difference between TA1 and PN1 concerns the choice of the unsteady lift response function. While PropNoise relies on the low frequency approximation of Sears [10] enhanced by an acoustic, non-compact term, TinA1D uses the high-frequency approximation proposed by Amiet [48]. The latest method also enables the consideration of oblique components as required by TinA2D. For single harmonic gusts, the Amiet based solution is expected to be more accurate over a large part of the frequency range.
For the results TA2, the spanwise component of the gusts was considered. Indeed, the formulation implemented in TinA2D uses the two-dimensional wavenumber representation of the turbulence spectrum Φ 22 ( K 1 , K 3 ) . Amiet showed that under certain assumptions (simple flat plate of infinite span, spanwise constant mean flow and turbulence) the acoustic pressure across a vertical plane at midspan is the same for strictly parallel and oblique gusts. However, it is not clear how this equivalence can be transposed to RSI broadband noise as there are spanwise variations of the mean velocity, of the turbulence characteristics and of the airfoil geometry. Furthermore, the amplitude of the triggered in-duct acoustic modes strongly depends on the position and orientation of the dipole source. For example, the amplitude is null if the source is located at a node of the mode or if it is oriented such as the dipole axis is perpendicular to the phase angle of propagation of the mode [49].

3.3.3. Solution OB1

The results OB1 were obtained using the method proposed by Amiet et al. [50], which is implemented in the code OPTIBRUI. That method resembles the one used for calculating the results TA2 but uses the free-field formulation of the Green’s function instead of the solution for an annular duct. As an additional difference, a Liepmann spectrum was used to model the turbulence and the metal angle at the leading edge was chosen to equal the plate inclination rather than the flow angle.

3.3.4. Solution OB3

The model developed by Posson et al. [25,26], implemented in OPTIBRUI, was used to produce the results labelled OB3. This model was presented in the introduction of the paper. It can account for complex effects, while still relying to the acoustic analogy approach. Contrary to the other solutions of Group A, Posson’s model accounts for the cascade effect for three-dimensional gusts (based on a strip approach) using an extension of Glegg’s solution [12]. This is the only model of the benchmark that combines a three-dimensional cascade approach and the Green’s induct formulation.

3.4. Methods Based on a Direct Calculation of the Acoustics (Group B)

As mentioned above, the methods classified in Group B bypass the calculation of an acoustic source term; they determine a cascade response function R, which directly links the vortical disturbance to a velocity potential fluctuation and eventually to an acoustic pressure. For a harmonic gust, which can be either two- or three-dimensional,
u μ ( x , ω ) = u ^ μ e i K μ · x ,
the pressure field created by the interaction with the cascade can be written in short-hand notation as
p μ ± ( x , ω ) = ρ 0 U 0 u ^ μ ν = R ν ± ( K μ ) e i k · x ,
where ν is a scattering index. This solution can be extended to turbulent gusts.
The cascade response is calculated using either the three-dimensional (3D) solution for a rectilinear cascade of blades derived by Glegg [12] or the two-dimensional (2D) solution, which can be calculated by several methods. The methods of Group B are facing specific problems. With Glegg’s approach, a strip approach is needed for turbomachine applications because (i) the geometry varies along the span (blades can be twisted), (ii) non-parallelism is not considered, and (iii) the mean flow and turbulence values vary radially. For two-dimensional approaches, the question arises of how passing to a three-dimensional solution and/or to a sound power amplitude. Several corrections, applied either before or after the calculation of the acoustic cascade response, were tried to counterbalance the fact that two-dimensional formulations do not account for oblique components.

3.4.1. Solution OB2

The results labelled OB2 were obtained with OPTIBRUI by applying Hanson’s method [7,51] as described in the introduction. Hanson’s approach relies on Glegg’s cascade response for three-dimensional gusts. Away from the blades, the acoustic waves propagate in a free field with an axial and a tangential mean flow corresponding to a flow field parallel to the flat plate modelling the blade. The acoustic intensity is calculated by integrating the velocity potential over the upstream (resp. downstream) faces of the cascade. Eventually, the problem is reduced to the calculation of a direct transfer function between turbulence and sound power spectrum for each strip. The final acoustic power is obtained by averaging the contribution of all strips.

3.4.2. Solution LN3

The method applied for the results labelled LN3 was presented by Cheong et al. [52]. It relies on the two-dimensional cascade response model implemented by Whitehead [53] in the code LINSUB. That model is based on Smith’s work [54]. An integral equation, which relates the source strength to the velocity disturbance, is solved by using a collocation procedure. The applied turbulence spectrum is the two-dimensional spectrum Φ 22 ( K 1 , K 2 ) obtained by integrating the 3D wavenumber spectrum Φ 22 ( K 1 , K 2 , K 3 ) over its spanwise component K 3 . Through this integration, the contribution of subcritical waves such as
| K 3 | > | K 1 | M 1 M 2 ,
are included even though they are acoustically cut-off.
Cheong and co-authors showed that there is a critical frequency below which the interaction between neighbouring blades is important to include. Above this frequency, the blades can be considered acoustically isolated.

3.4.3. Solution LN1

The results labelled LN1 were also obtained with the solver LINSUB (see Blázquez and Corral [55]). Thus, the method to calculate the acoustic pressure relies on the same algorithm as for LN3. In order to minimise the just mentioned drawbacks of the 2D approach, the authors performed a filtering of the velocity spectrum prior to the acoustic calculation. The applied corrections are explained in the subsequent paragraph describing the method used for BB1. Note that the simulations were good converged despite using only 5 strips. Indeed, instead of using the values at the mean radius of the strip, the authors performed some radial averaging beforehand.

3.4.4. Solution BB1

The method applied to obtain the results BB1 was described by Blázquez and Corral [56]. It is similar in many respects to LN1. The main difference is the use of a linearized Navier-Stokes (LNS) solver called M u 2 s 2 T L [57] to calculate the acoustic response instead of LINSUB. The objective of the BBNANEMS code is to work for turbomachine components like turbines, where for example, the infinitely thin flat plate approximation is no longer satisfying. This way, the blade shape (camber and thickness) and its effect on the mean flow (overspeed at the leading edge and flow deviation between leading and trailing edge) can be considered. To save computation time, the calculations are done on a reduced number of 2D strips equally distributed in the radial direction. In principle, the method could be extended to 3D blade geometry but at the expense of a dramatic increase in computational cost. Notice that the LNS solver works with harmonic gusts and not with time-domain synthesized turbulence as done by for example, Wohlbrandt et al. [58]. While the cascade response function R is calculated in two dimensions, the three-dimensional formulation of Equation (25) is still retained, which means that the authors have to make some further assumptions:
  • The cascade response is independent of the value K 3 and is set equal to the response obtained for K 3 = 0 . Grace [24] showed that using that simplification leads to a good agreement at high frequency but an overestimation of the sound power at low frequency.
  • To counteract that effect, convective modes that are acoustically cut-off (subcritical waves) are discarded to avoid having their contribution included.
  • The resulting pressure is assumed constant over the radius.
  • The sound power is calculated through the integration of the intensity over the cascade faces without accounting for the presence of the duct.
A sound power spectrum is calculated for each strip. The final power spectrum is obtained by averaging all the contributions.

3.4.5. Solution LN2

The solution LN2 was obtained by extending the 2D method used for LN1 to the three-dimensional wavenumber spectrum by using Graham’s similarity rules [14], a technique also applied by Grace [24]. This allows to properly account for the contribution of the oblique gusts in the calculation of the cascade response function R. The sound power is calculated as for BB1.

3.4.6. Solution OP1

The method to obtain the result OP1 is implemented in the code Orpheus of ITP. Its principle was described by Carrasco and Serrano [59]. The method is based on a 2D cascade response following Smith [54]. Contrary to the methods described previously, it aims to include the duct effect. If needed, the code Orpheus uses the technique of Nallasamy and Envia [17] to distinguish between background turbulence and wake turbulence.
For the present calculation, the turbulence was distributed uniformly along the azimuth as it were a background turbulence. The question of how to proceed in order to overcome the drawback of a 2D cascade response is addressed in 2 steps.
Three different options to represent the turbulence were proposed by the authors:
(1)
The simplest approach uses a 2D ( K 1 , K 2 ) -wavenumber spectrum obtained by integrating Liepmann’s 3D wavenumber spectrum over the spanwise component K 3 .
(2)
An a priori correction is applied, which consists in filtering the 2D wavenumber spectrum by discarding gusts, whose contributions are known to be acoustically cut-off. This automatically lowers acoustic levels.
(3)
The results of three-dimensional CAA calculations performed for few selected gust modes and frequencies are combined to develop an a priori correction of the turbulence content.
To calculate the sound power, there were also three different options:
(a)
The 2D acoustic power is calculated and then assumed to be constant over the span. The final solution is obtained by statistically averaging the contributions of all strips.
(b)
The pressure amplitudes are averaged and then distributed in acoustic duct modes ( m , n ) according to a certain model (equal energy distribution, equal energy density distribution, etc.). This emulates the approach used to determine sound power based on experimental data.
(c)
An acoustic mean pressure is calculated by averaging the results of all the strips. The radial pressure distribution is represented by a complex function, whose amplitude is constant to the averaged value and the phase is randomly varied along the span. This radial pressure is fitted to the basis of induct acoustic eigenmodes in order to determine the amplitudes A m n . Finally, the modal sound power P m n is calculated following the method described in Appendix A.
The authors investigated different combinations of the presented options. They showed that option (3,c) provides the closest results to experimental data, but several CAA computations need to be performed in order to find the proper correction for the turbulence content. Results based on option (1) are significantly overestimated, in particular at low frequency. Method (2) provides fair results but the low- and high-frequency trends are better reproduced with method (3).

4. Results and Discussion

The results of Part II of the TurboNoiseBB benchmark using the solvers presented in the previous sections are now presented. As the same RANS inputs were used for all simulations, the different acoustic codes can be directly and fairly compared. However, it should be noted that differences between simulations and experimental values should be interpreted very carefully as the acoustic models are sensitive to the RANS input and the way the integral length scale is calculated, as shown in Part I [1]. Furthermore, the experimental data are not limited to fan–OGV interaction broadband noise but rather contain all aerodynamic noise sources of the test rig as briefly discussed in Section 2.1.2.

4.1. Overall Comparisons

At first, measured and predicted sound power spectra for the three operating points are compared (see Figure 9). Note that some codes were only applied for the Approach operating condition. The following observations can be made:
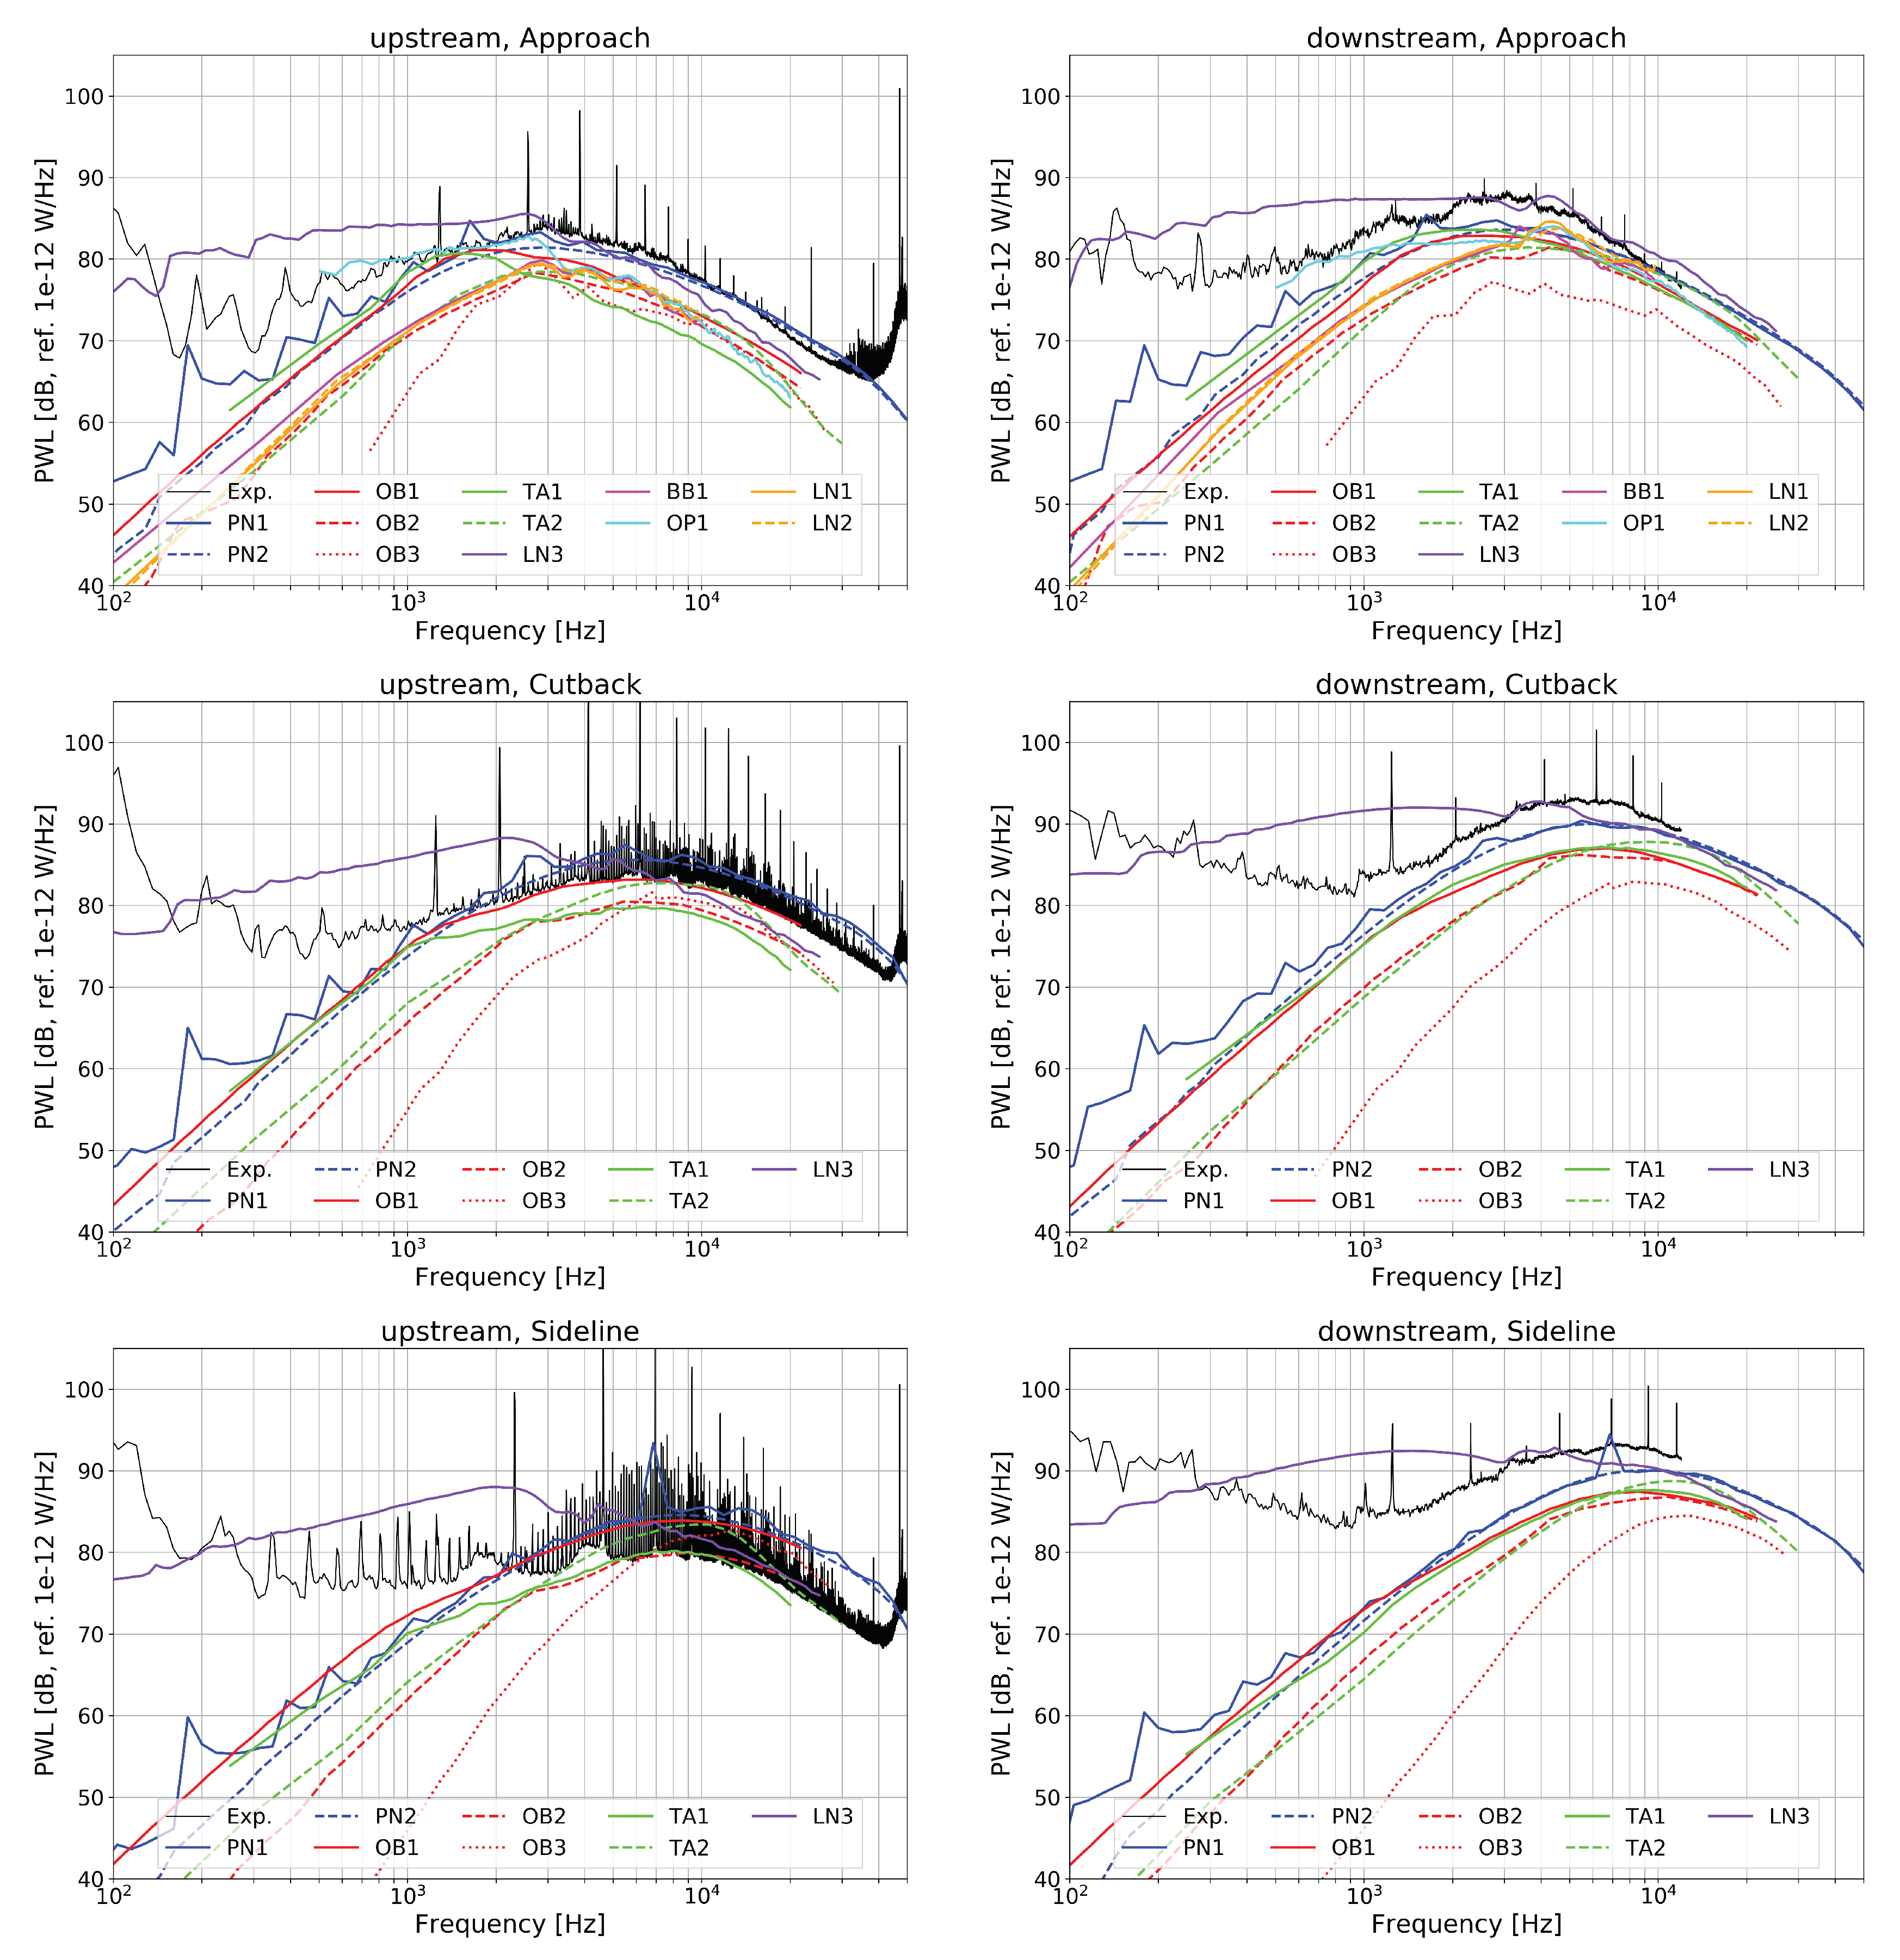
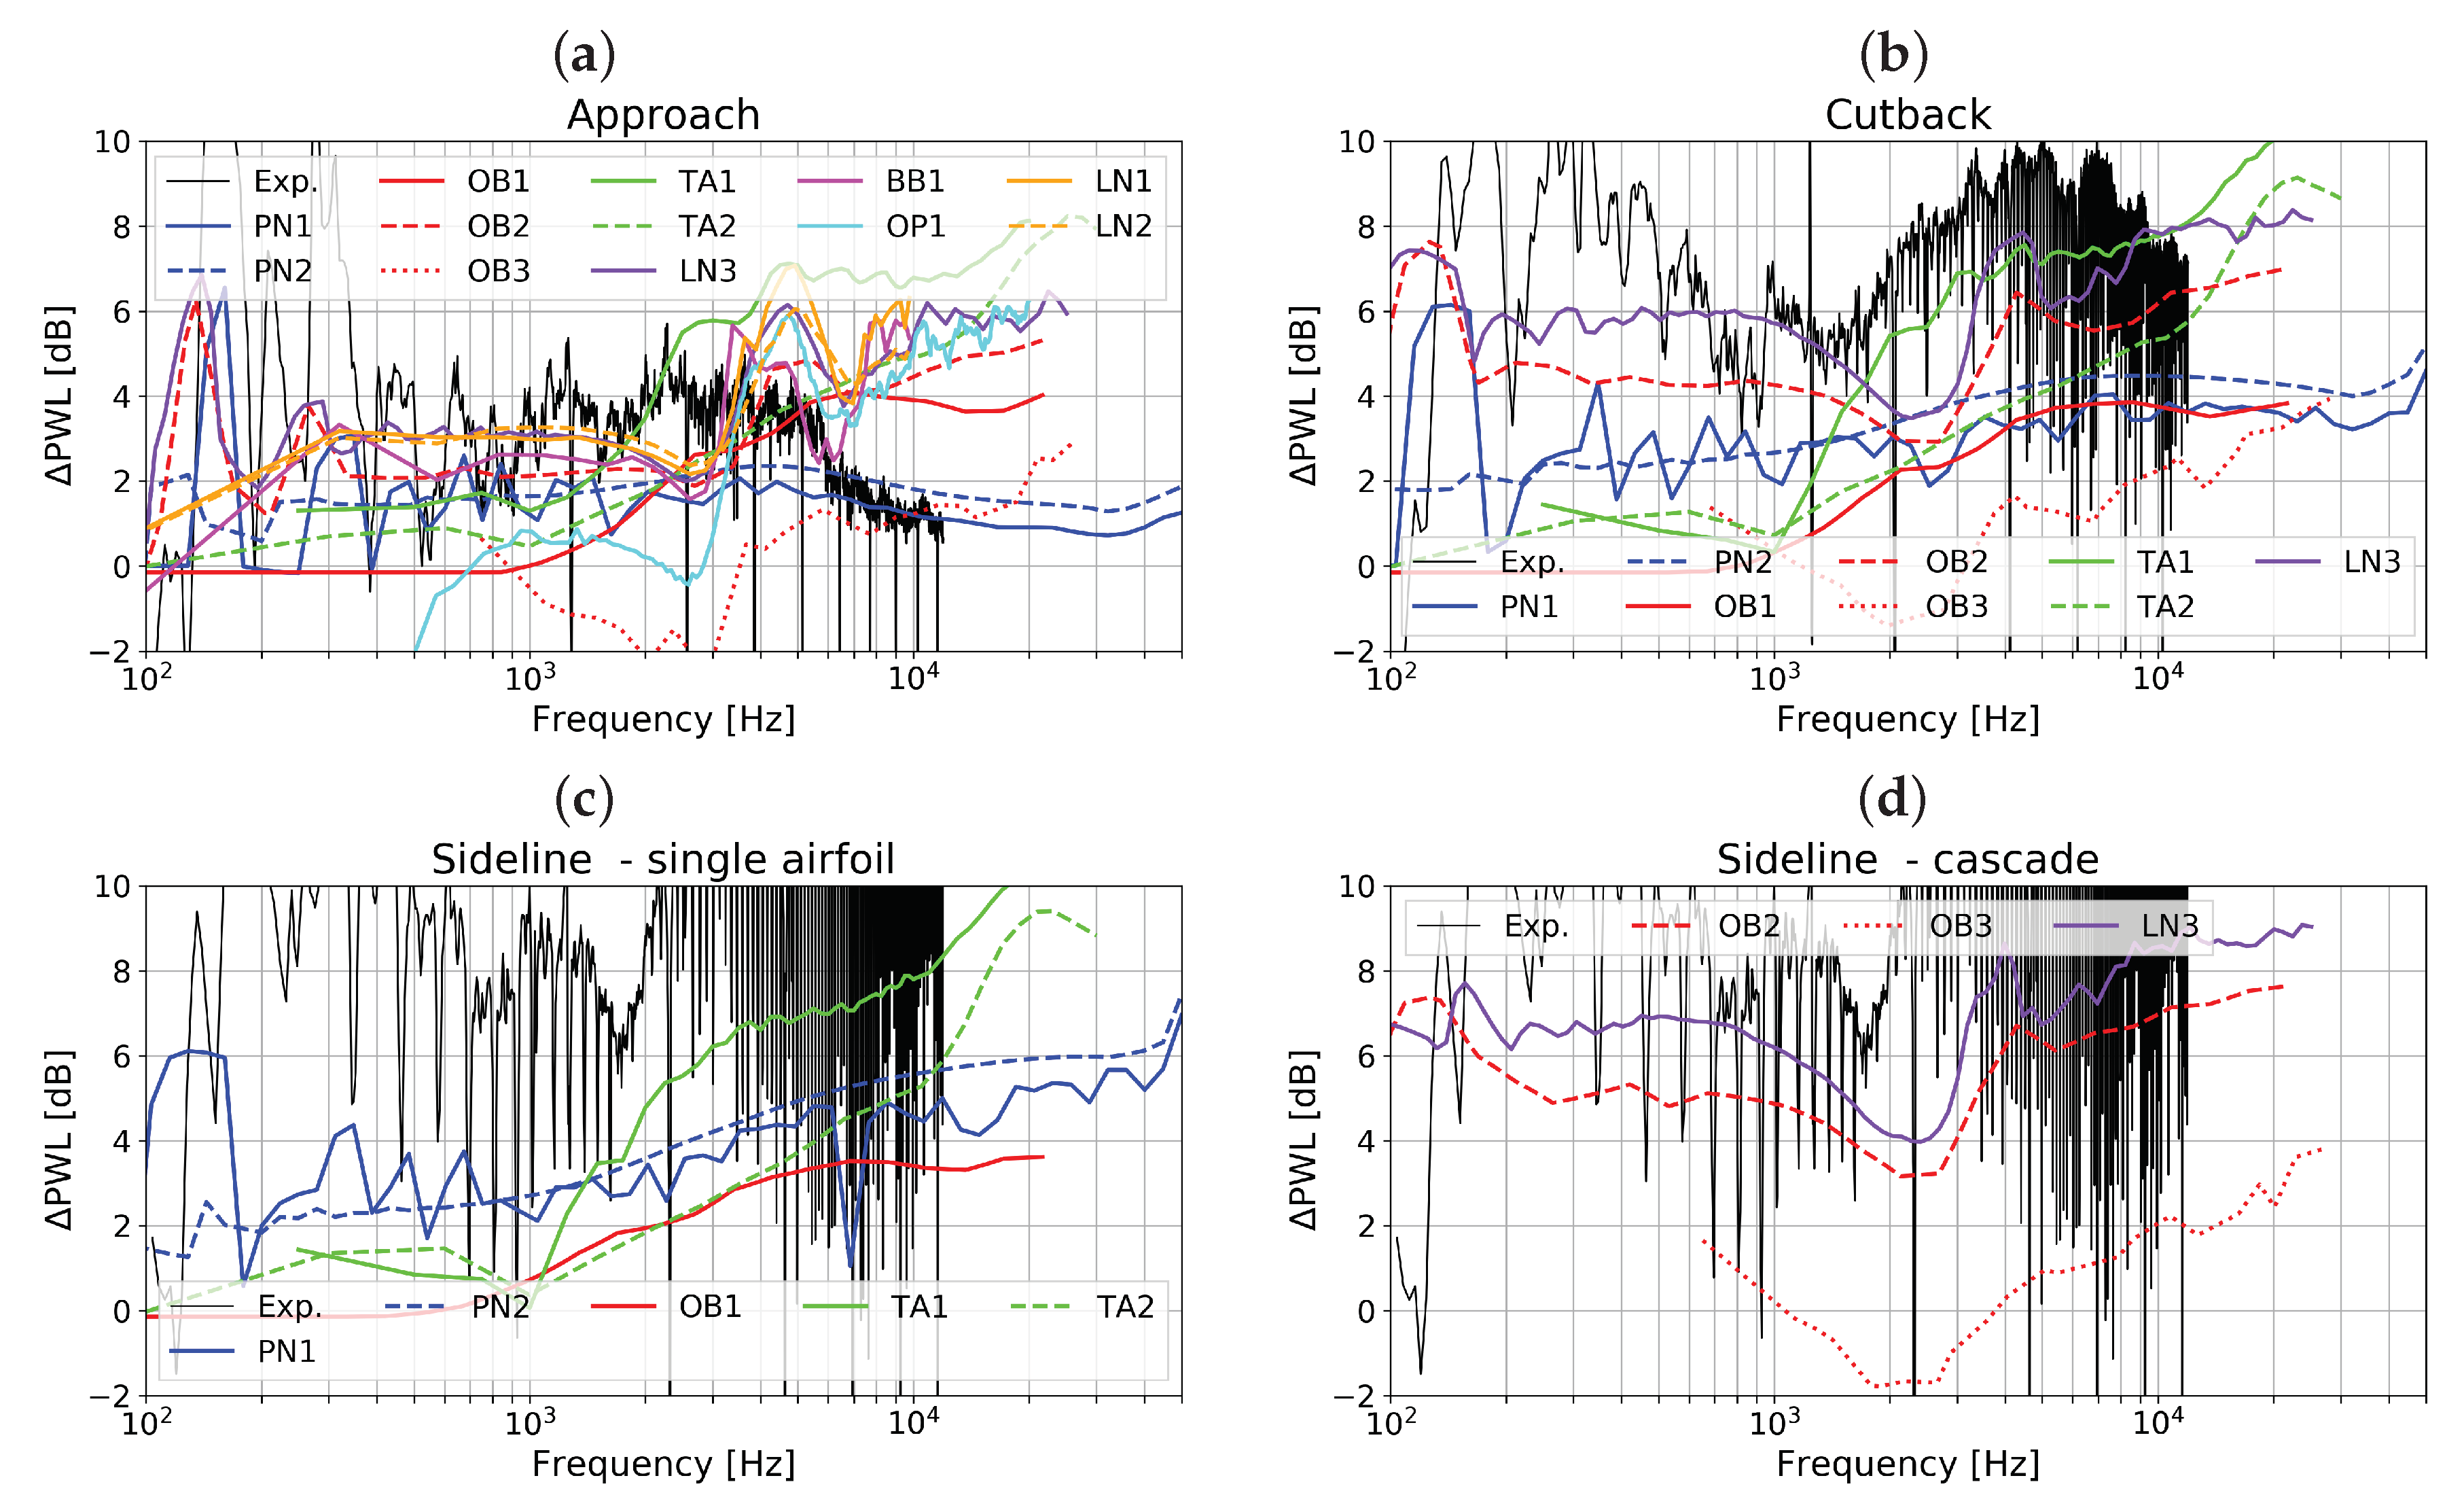
  • The prediction curves match satisfactorily with the experimental results at mid and high frequencies. All but one result deviate by less than ±3 dB in that frequency range compared to a hypothetic median solution. The predicted peak frequency agrees with the experimental data, indicating that the RANS prediction of the integral length scale was acceptable.
  • Greater differences are visible at low frequencies, yet most results remain within a similar range. The solutions LN3 and OB3 represent two extrema, respectively much higher and lower than the other ones.
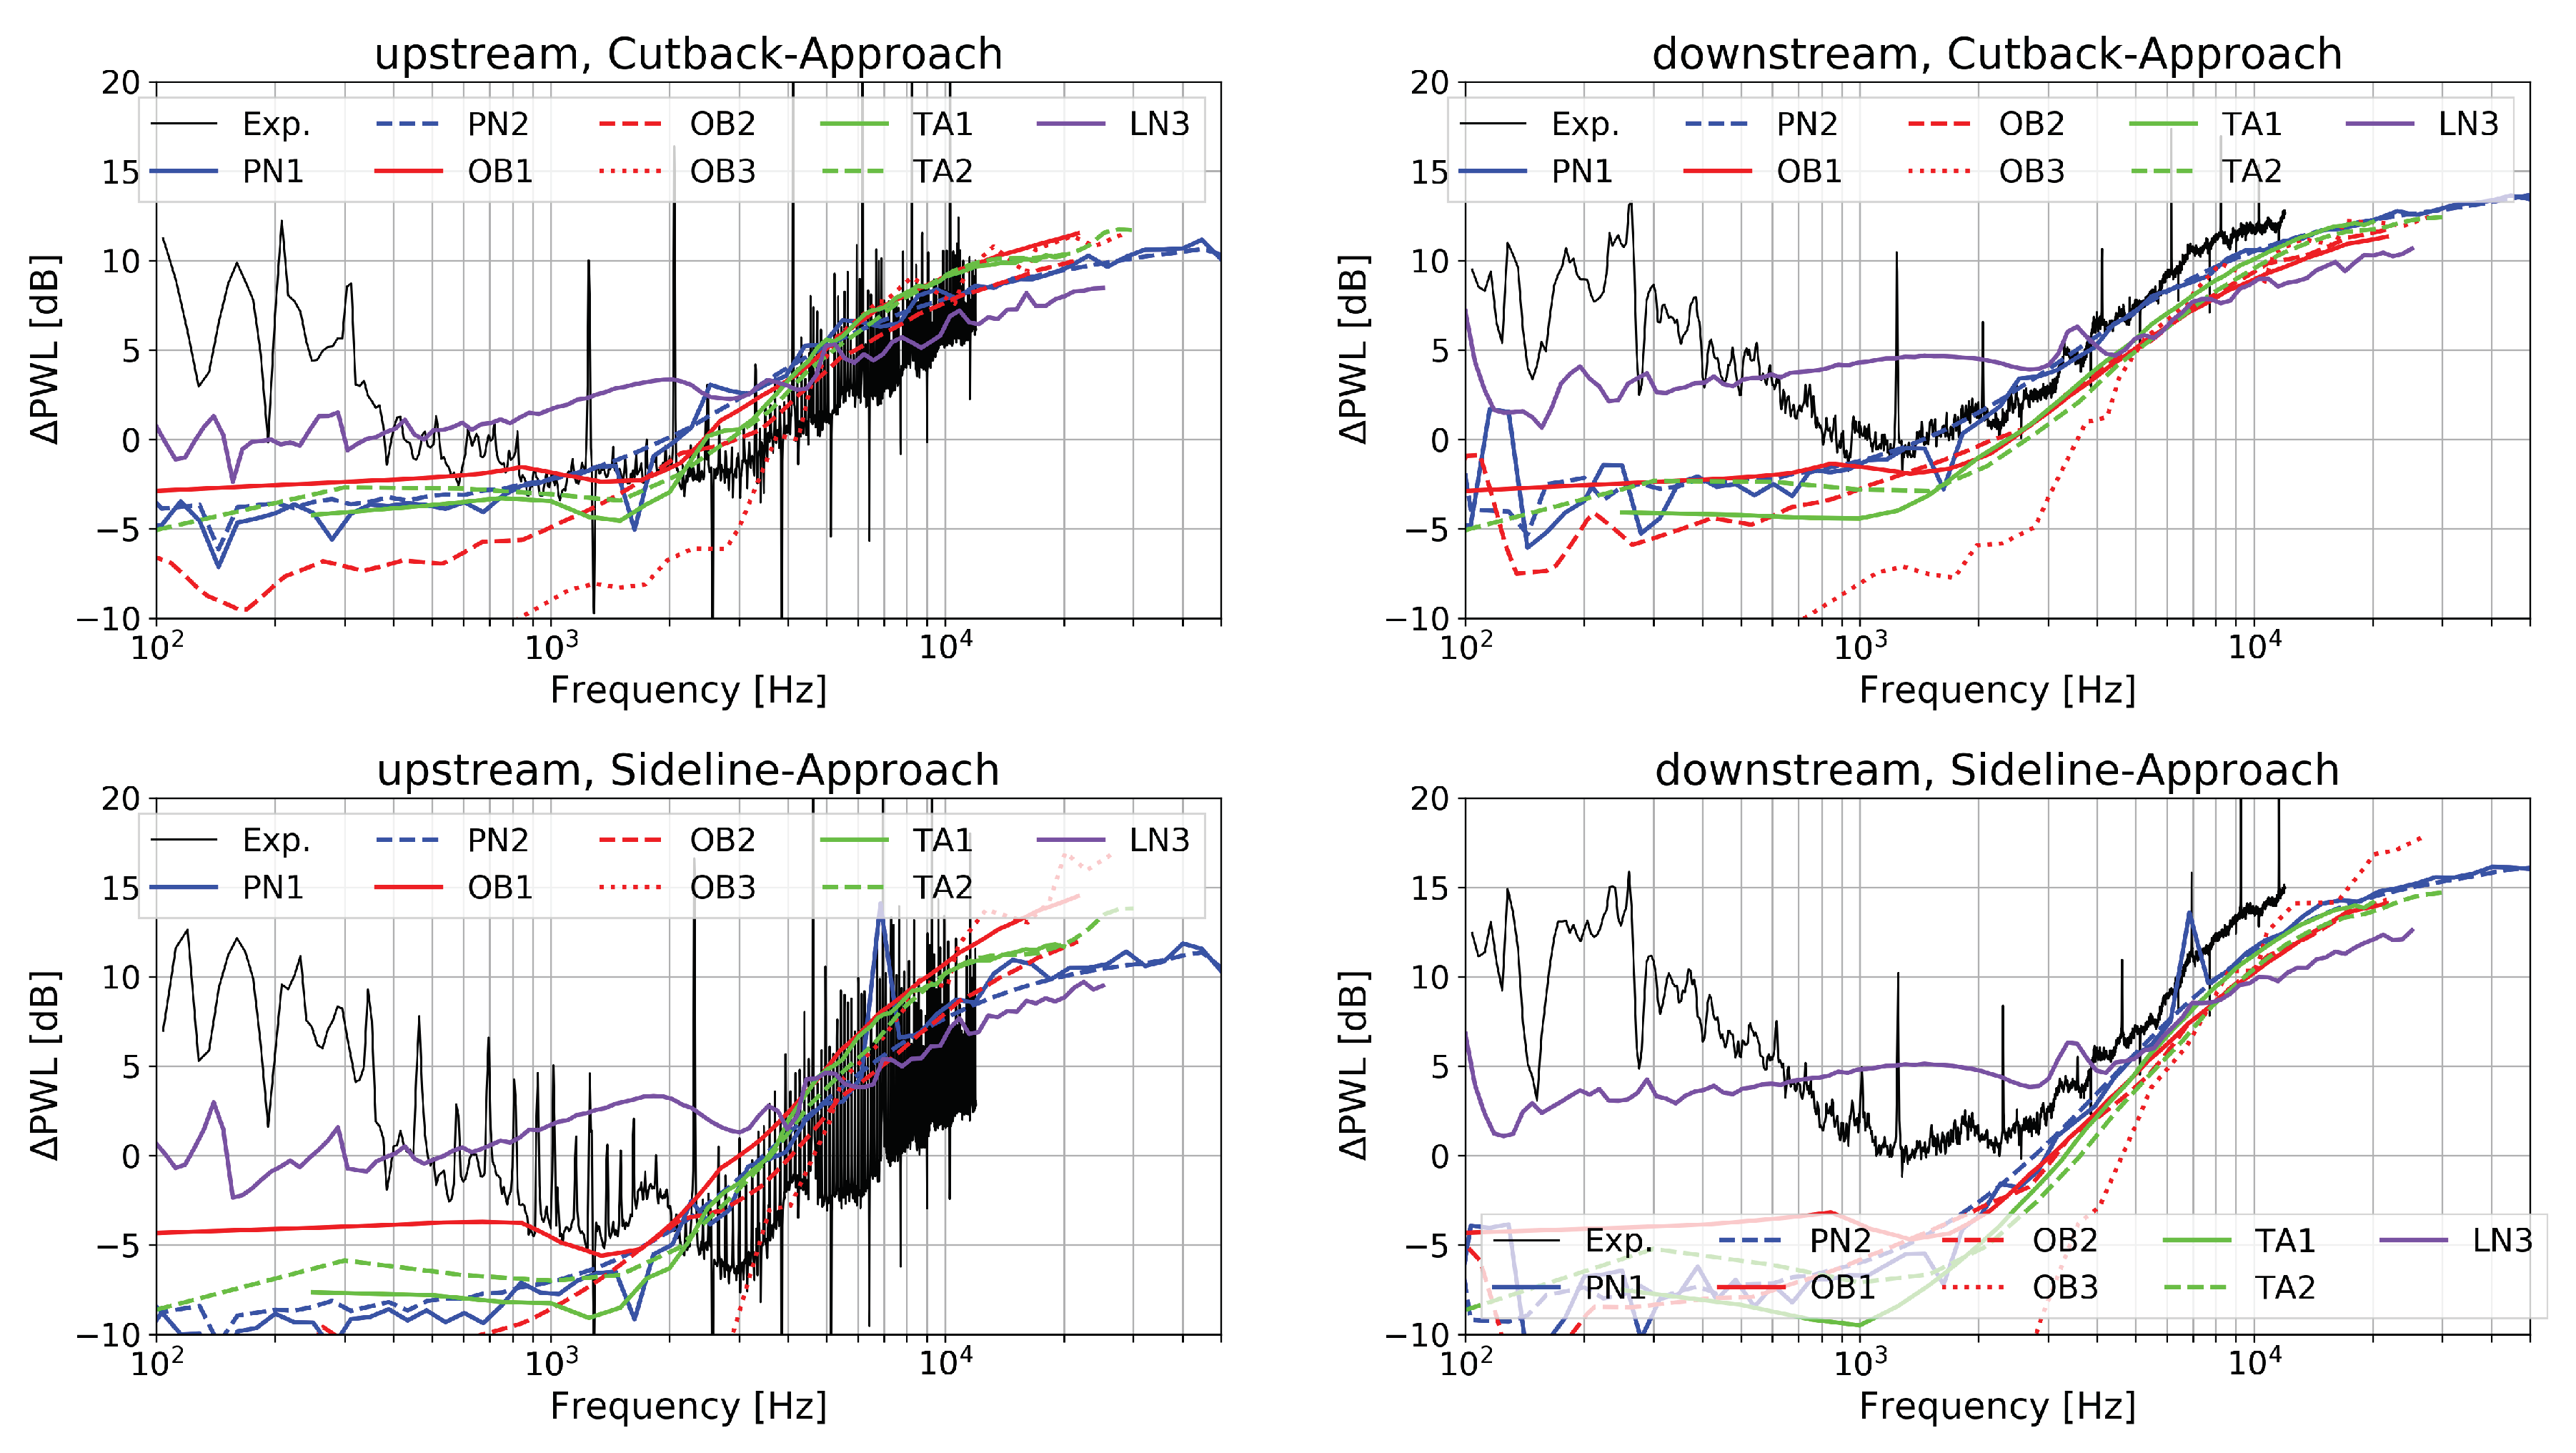
  • In general, the differences between two prediction curves remain the same for the up- and downstream positions.
  • Compared to the experimental data, the predicted levels are underestimated downstream of the stator, except for LN3. At the upstream position, amplitudes are slightly overestimated in some of the results at high speed. This is possibly related to the fact that rotor shielding was not included in any of the simulations. At the higher speeds, the formation of shocks on the rotor blades blocks the transmission of RSI noise in the direction of the inlet (see the investigation by Blázquez and Corral [56] regarding the importance of blockage for the ACAT1 fan). This effect explains that the amplitudes measured at Sideline in the forward arc are lower than those obtained at Cutback. A model accounting for rotor shielding would be necessary to improve the comparison with the far-field data in the forward arc.

4.2. Trends in Sound Power Split and by Speed Variation

Two further comparisons are done regarding (i) the split of the sound power level between up- and downstream (see Figure 10) and (ii) the change in acoustic power by increasing the rotation speed (see Figure 11). Experimental trends were not included in these analyses as a meaningful comparison cannot be realised because of the aforementioned rotor shielding and the presence of other noise sources included in the experimental data.
Regarding the power split between up- and downstream radiation, defined by Δ P d B = 10 log 10 ( P + / P ) , three effects can have an impact on the results:
(1)
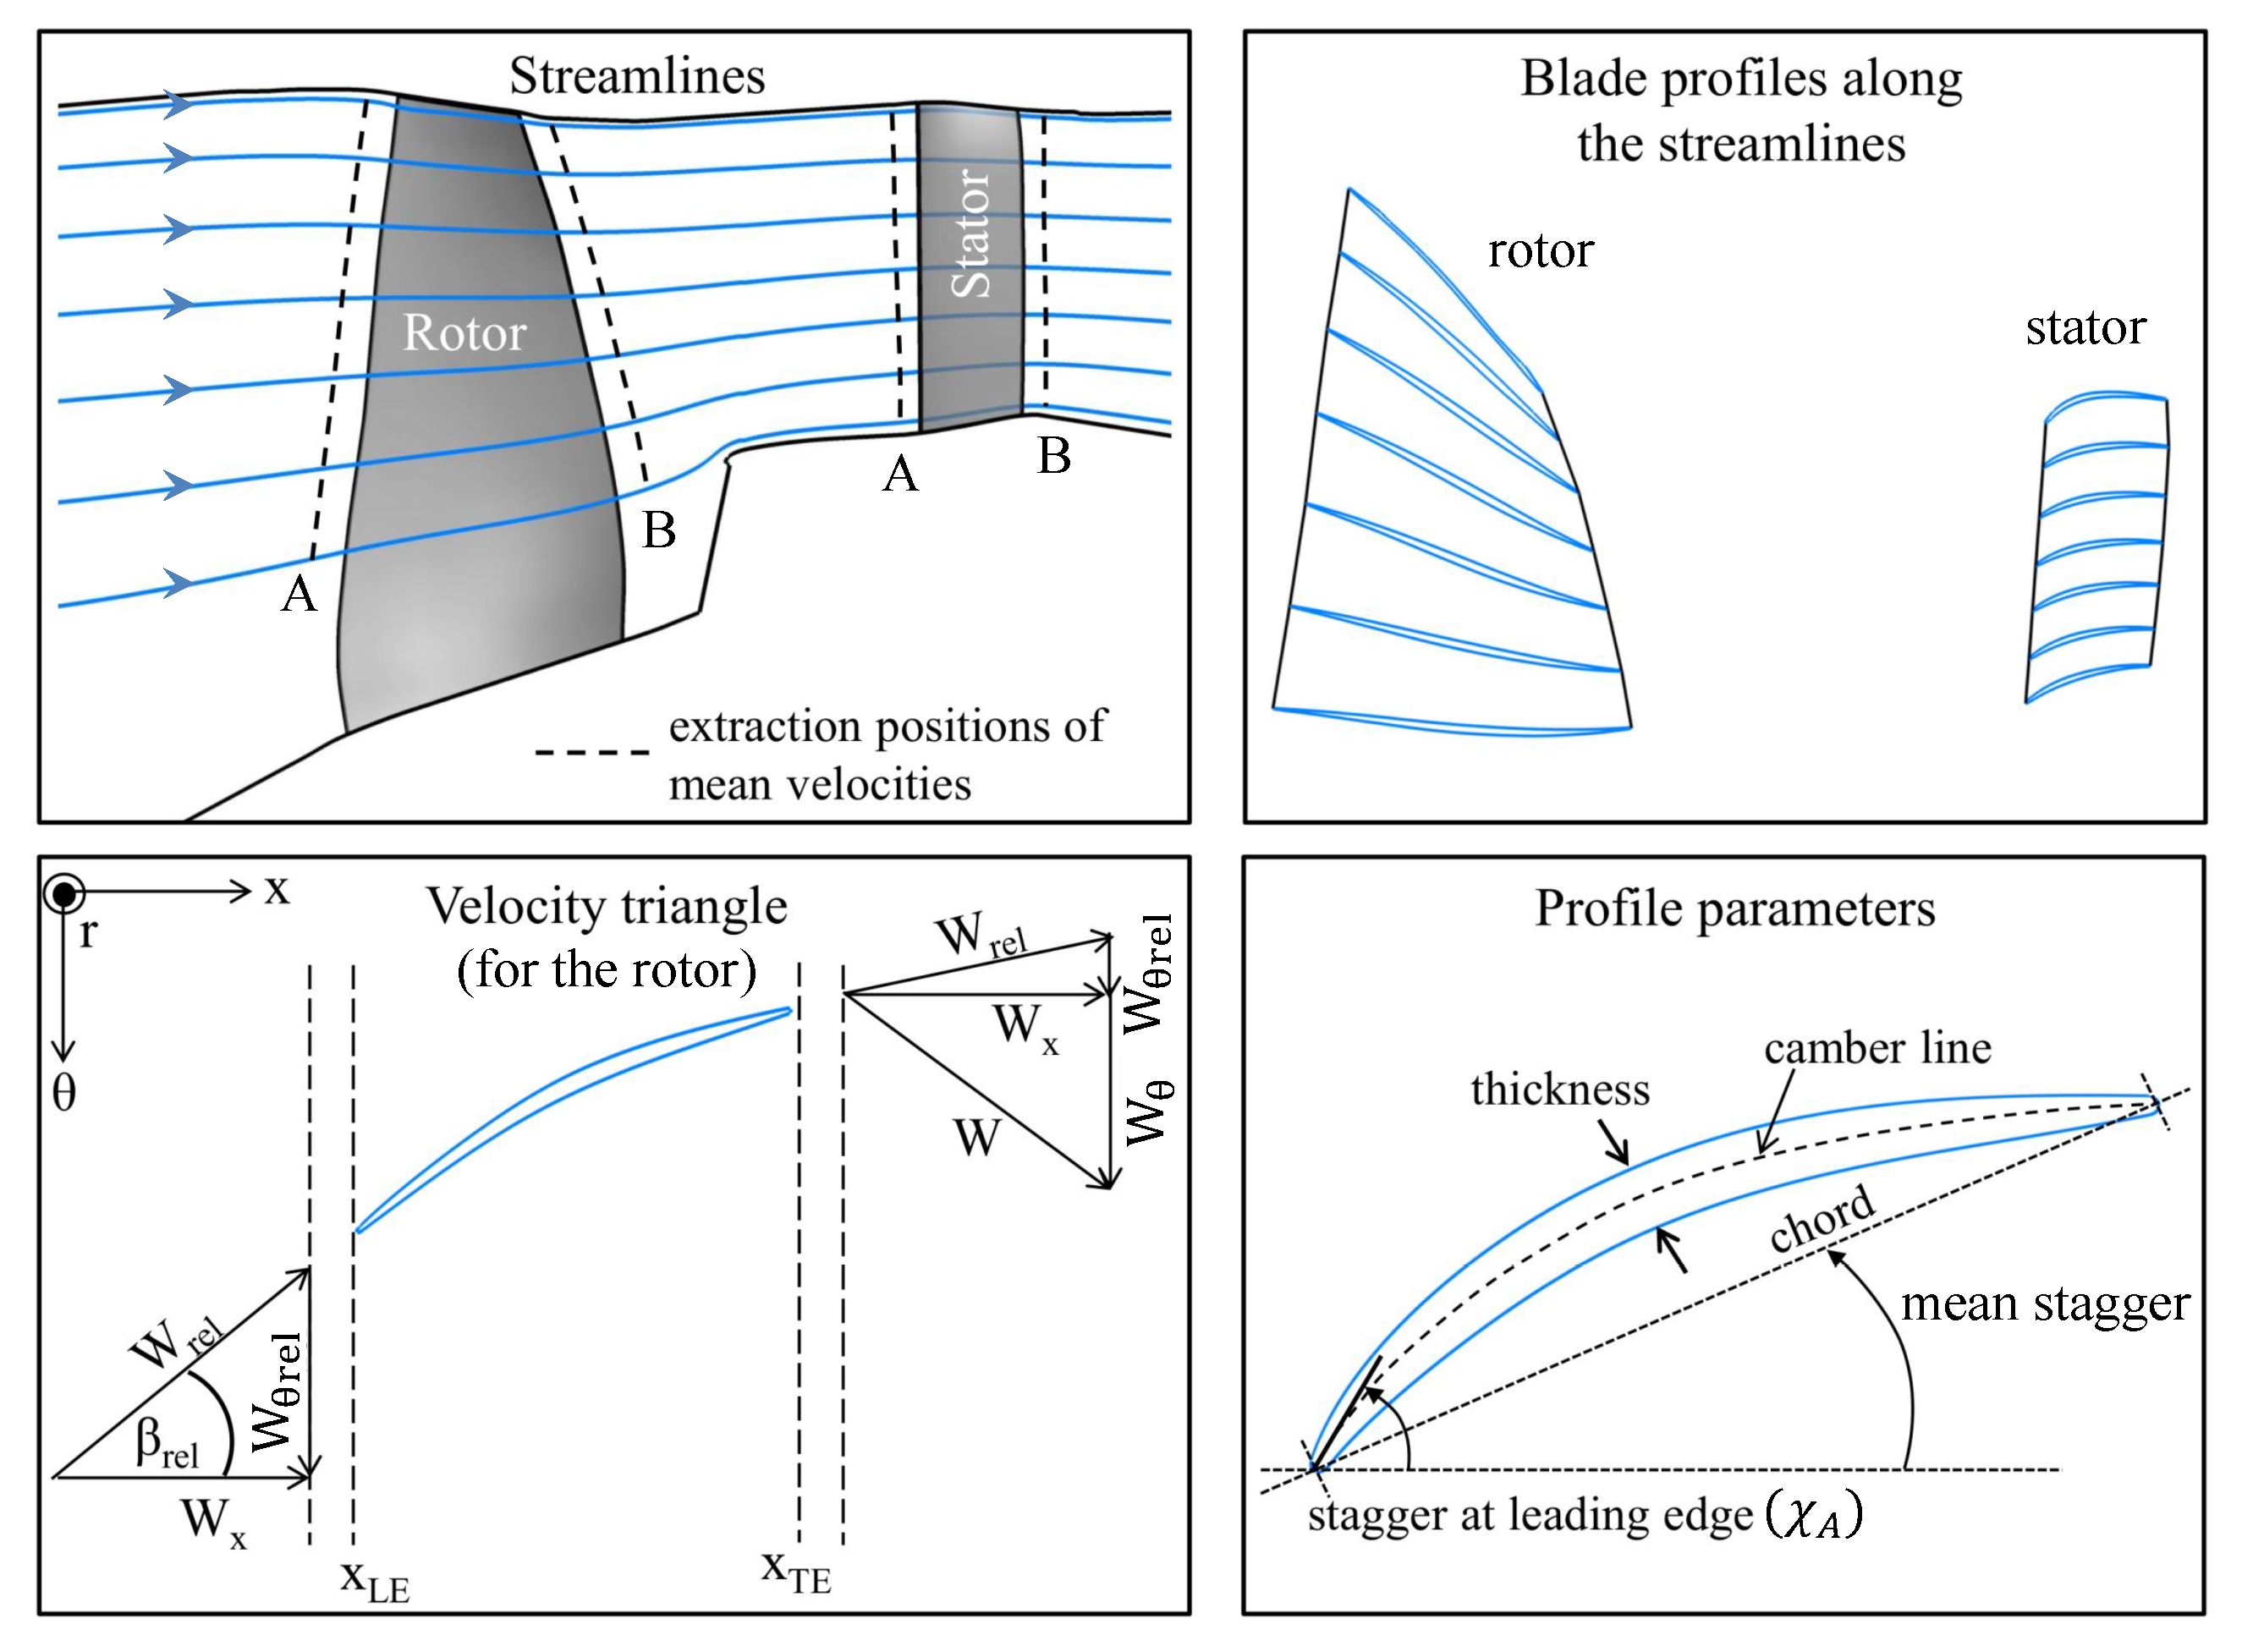
Previous studies [7,20,22,23,24] showed the sensitivity of sound power to the choice of the stagger angle, in particular in the upstream direction. The flat plate assumption with the use of the leading edge stagger angle for inclination tends to overestimate the upstream contribution and underestimate the downstream contribution.
(2)
The rotor shielding and to a lesser extent the swirl effect influence the balance in energy between the upstream and downstream radiations too.
(3)
Finally, the mismatch between the unsteady loading formulation and the Green’s function in methods of Group A is also a source of error.
As expected, the present benchmark indicates higher PWL values at the downstream side. The solution OB3 (Posson’s model) is an interesting case as it deviates from the other predictions by its low difference between the upstream and downstream levels. Compared to the other predictions of Group A, this distinct behaviour may be attributed to the issue with the stagger angle, since effects (2) and (3) are common assumptions for all of the methods of Group A. Indeed, the stagger angle definition has three consequences: it impacts the streamwise component of the mean flow, the orientation of the dipole sources, and the cascade effect in the interblade channel. For isolated airfoils, only the first two effects are present, not the third one. Nevertheless, this differing behaviour is not observed for the OB2 results (Hanson), even though the effect in the interblade channel is modelled too. Thus, it remains an unsolved issue. By separately analysing the solutions calculated with the single airfoil theory and those calculated with cascade models, one observes the following result: Using single airfoil models, the relative contribution of the downstream part increases with frequency. For some models, the difference Δ P d B grows up to 10 dB at the upper frequency limit. With a decreasing frequency, the offset asymptotically approaches a value of zero. OB1 provides a good example for that trend. The solutions obtained using cascade models produce an interesting result: A minimum is present at a frequency around 2–3 kHz. This trend is most definitively visible at Sideline. On both side of the deep, the downstream contribution is superior to the upstream one. Unlike for single airfoil models, a tendency of Δ P d B towards zero at low frequencies is not observed for the simulations performed with the cascade models. The results of Blandeau et al. [23] clearly indicate such a convergence—abrupt—but at very low frequency. For the ACAT1 fan, this convergence probably occurs at a frequency lower than the minimum frequency of 100 Hz considered in the benchmark, therefore it could not be documented.
The trends due to the increase in rotational speed are much more harmonious as shown in Figure 11. Those are principally driven by the change in the spectral shape of the prescribed velocity spectrum due to the changing turbulence characteristics. As all the partners used similar models to represent the spectral content of the turbulence, the agreement is reassuring but not surprising. Nevertheless, the fact that LN3 and OB3 follow contradictory trends and deviate significantly from all other solutions needs to be emphasised. Neglecting the rotor transmission effect, Hanson [7] observed that noise increases faster downstream—where the peak amplitude of sound power varies proportionally to M 5 —than upstream—where the peak amplitude varies proportionally to M 4.5 . This tendency is also clear in the benchmark results but no effort was made to quantify the exponents.

4.3. Detailed Comparisons

The analysis below goes into more detail regarding some of the effects identified before as possibly impacting predictions. It does not explicitly refer to the classification of the models into Group A and Group B as the focus is on the differences in the models assumptions rather than on the differences in the methods. Even though the two are closely related, they are not the same.

4.3.1. Effect of Acoustic Boundary Conditions

  • The solutions PN1 and PN2 based on the in-duct and free-field formulations for the Green’s function converge asymptotically at high frequency (see Figure 9, Figure 10 and Figure 11) as expected from for example, Moreau and Guérin [43]. The in-duct solution PN1 exhibits some peaks in the low-frequency range, which occur when new in-duct acoustic modes become cut-on. These peaks are clearly visible in the measurements, not only in the in-duct data downstream but also in the far-field data upstream.
  • Unfortunately, the comparison between TA1 and PN1 does not allow for a definite conclusion regarding the importance of swirl as the two solutions also differ with respect to the Green’s function, the stagger angle, and the blade response. The agreement between TA1 and PN1 is generally good (within 1–2 dB) at low frequency and fair (within 3 dB) at the downstream position at high frequency. In the upstream direction, the mismatch is significant at high frequency exceeding up to 8 dB. Supposedly, this behaviour is due to the different definition of the stagger angle and the use of a different blade response function and is likely not related to the effect of swirl.
  • The swirl effect accounted for in the solution PN1 has no significant impact on the predicted noise spectra. Compared to PN2, only a slight noise increase is observed at low frequency. By considering the swirl, the acoustic modal content is changed. For example, swirl shifts the cut-on limit of acoustic modes (see Equation A7). But once the modal contributions of the same frequency band are summed up, the impact on the resulting broadband noise spectrum is rather small at medium and high frequencies due to the statistically large number of cut-on modes. Based on this result, the authors argue that accounting for the swirl may not be essential to achieve a reasonable prediction of RSI broadband noise levels. (This statement does not hold for the prediction of RSI tones since they can be composed of only a few propagative modes.) This finding conflicts with the results presented by Moreau [5] about the extension of Posson’s model to sheared swirling flow. A noise diminution of up to 4–5 dB was reported over a large frequency range in the forward arc for the SDT fan at the Approach condition.

4.3.2. Effect of Gusts Model

  • The simulations TA1 and TA2 differ in the wavenumber representation of the gusts. In the first simulation, all gusts are assumed to impinge on the stator with a wavefront parallel to the leading edge ( K 3 = 0 ). For the second case the spanwise component K 3 is included in the simulations. The two models produce results, which differ significantly, in particular at low frequency. Considering the oblique component leads to a decrease in sound power level by more than 5 dB at low frequency and an increase by up to 3 dB in the mid range. The inversion point is located slightly below the peak frequency. At high frequencies, the two solutions are more alike. A similar trend was reported by Reboul [47] for a single airfoil in free field with a low aspect ratio. Thus, the assumption that the contribution of oblique gusts is negligible as proposed by Amiet [6] is not applicable to our case. Presumably, the levels are lower at low frequency in TA2, because subcritical gusts are properly considered. Such an effect was also observed on cascade models when accounting or removing subcritical gusts on the SDT case [24,25].
  • A similar comparison can be done between the results LN1 (parallel gusts) and LN2 (oblique gusts) for the cascade model. Contrary to the previous example, the results are close. This is due to the fact that the subcritical gusts were removed a priori from the two-dimensional wavenumber velocity spectrum Φ 22 ( K 1 , K 2 ) used to calculate the solution LN1.
  • The agreement between LN3 (two-dimensional representation of the turbulence spectrum) and LN1 (two-dimensional representation of the turbulence spectrum with filtering of the subcritical gusts) is good at high frequency but poor at low frequency, which supports the previous claims. Note that the trends at low frequency presented by Cheong et al. [52] for a model test may seem to be different from those shown here using the same code: unlike for the present ACAT1 benchmark, the shape of the spectra corresponded to an inverse parabolic curve, typical of RSI broadband noise. Compared to the present study, the only differences in Cheong’s paper were (i) the representation in one-third octave bands, which changes the trend at low frequency compared to a representation in narrow bands, and (ii) the fact that turbulence length-scale and intensity were adjusted to provide the best possible match to the measured data at high frequencies.

4.3.3. Impact of Airfoil-Response Model

  • In-duct Isolated Airfoil: The results PN1 and TA1 can be analysed regarding the impact of the lift-response function. For that, the effect of swirl on the in-duct Green’s function must be assumed neglected. The solution PN1 applies the low-frequency Sears’ model enhanced by an acoustic, non-compact term [9], whereas TA1 relies on the Amiet’s high-frequency approximation [48]. In the downstream section of the duct, there is a difference of approximately 3–4 dB between the two results. In the upstream section, the discrepancy is larger and increases with the Mach number. It is not clear whether it is due to the lift-response function or to the definition of the stagger angle, which is a sensitive parameter for the upstream results as alluded before. Recall that PropNoise uses the leading-edge angle and TinA1D the mean flow angle to define the inclination of the plate (see Table A1).
  • Free-field Isolated Airfoil: The comparison between PN2 and OB1 allows to further compare Sears and Amiet. One additional difference is that, unlike PN2, OB1 works with the two-dimensional wavenumber spectrum. The two results are in good agreement for all simulations in both directions of propagation. The discrepancy does not exceed 3 dB.
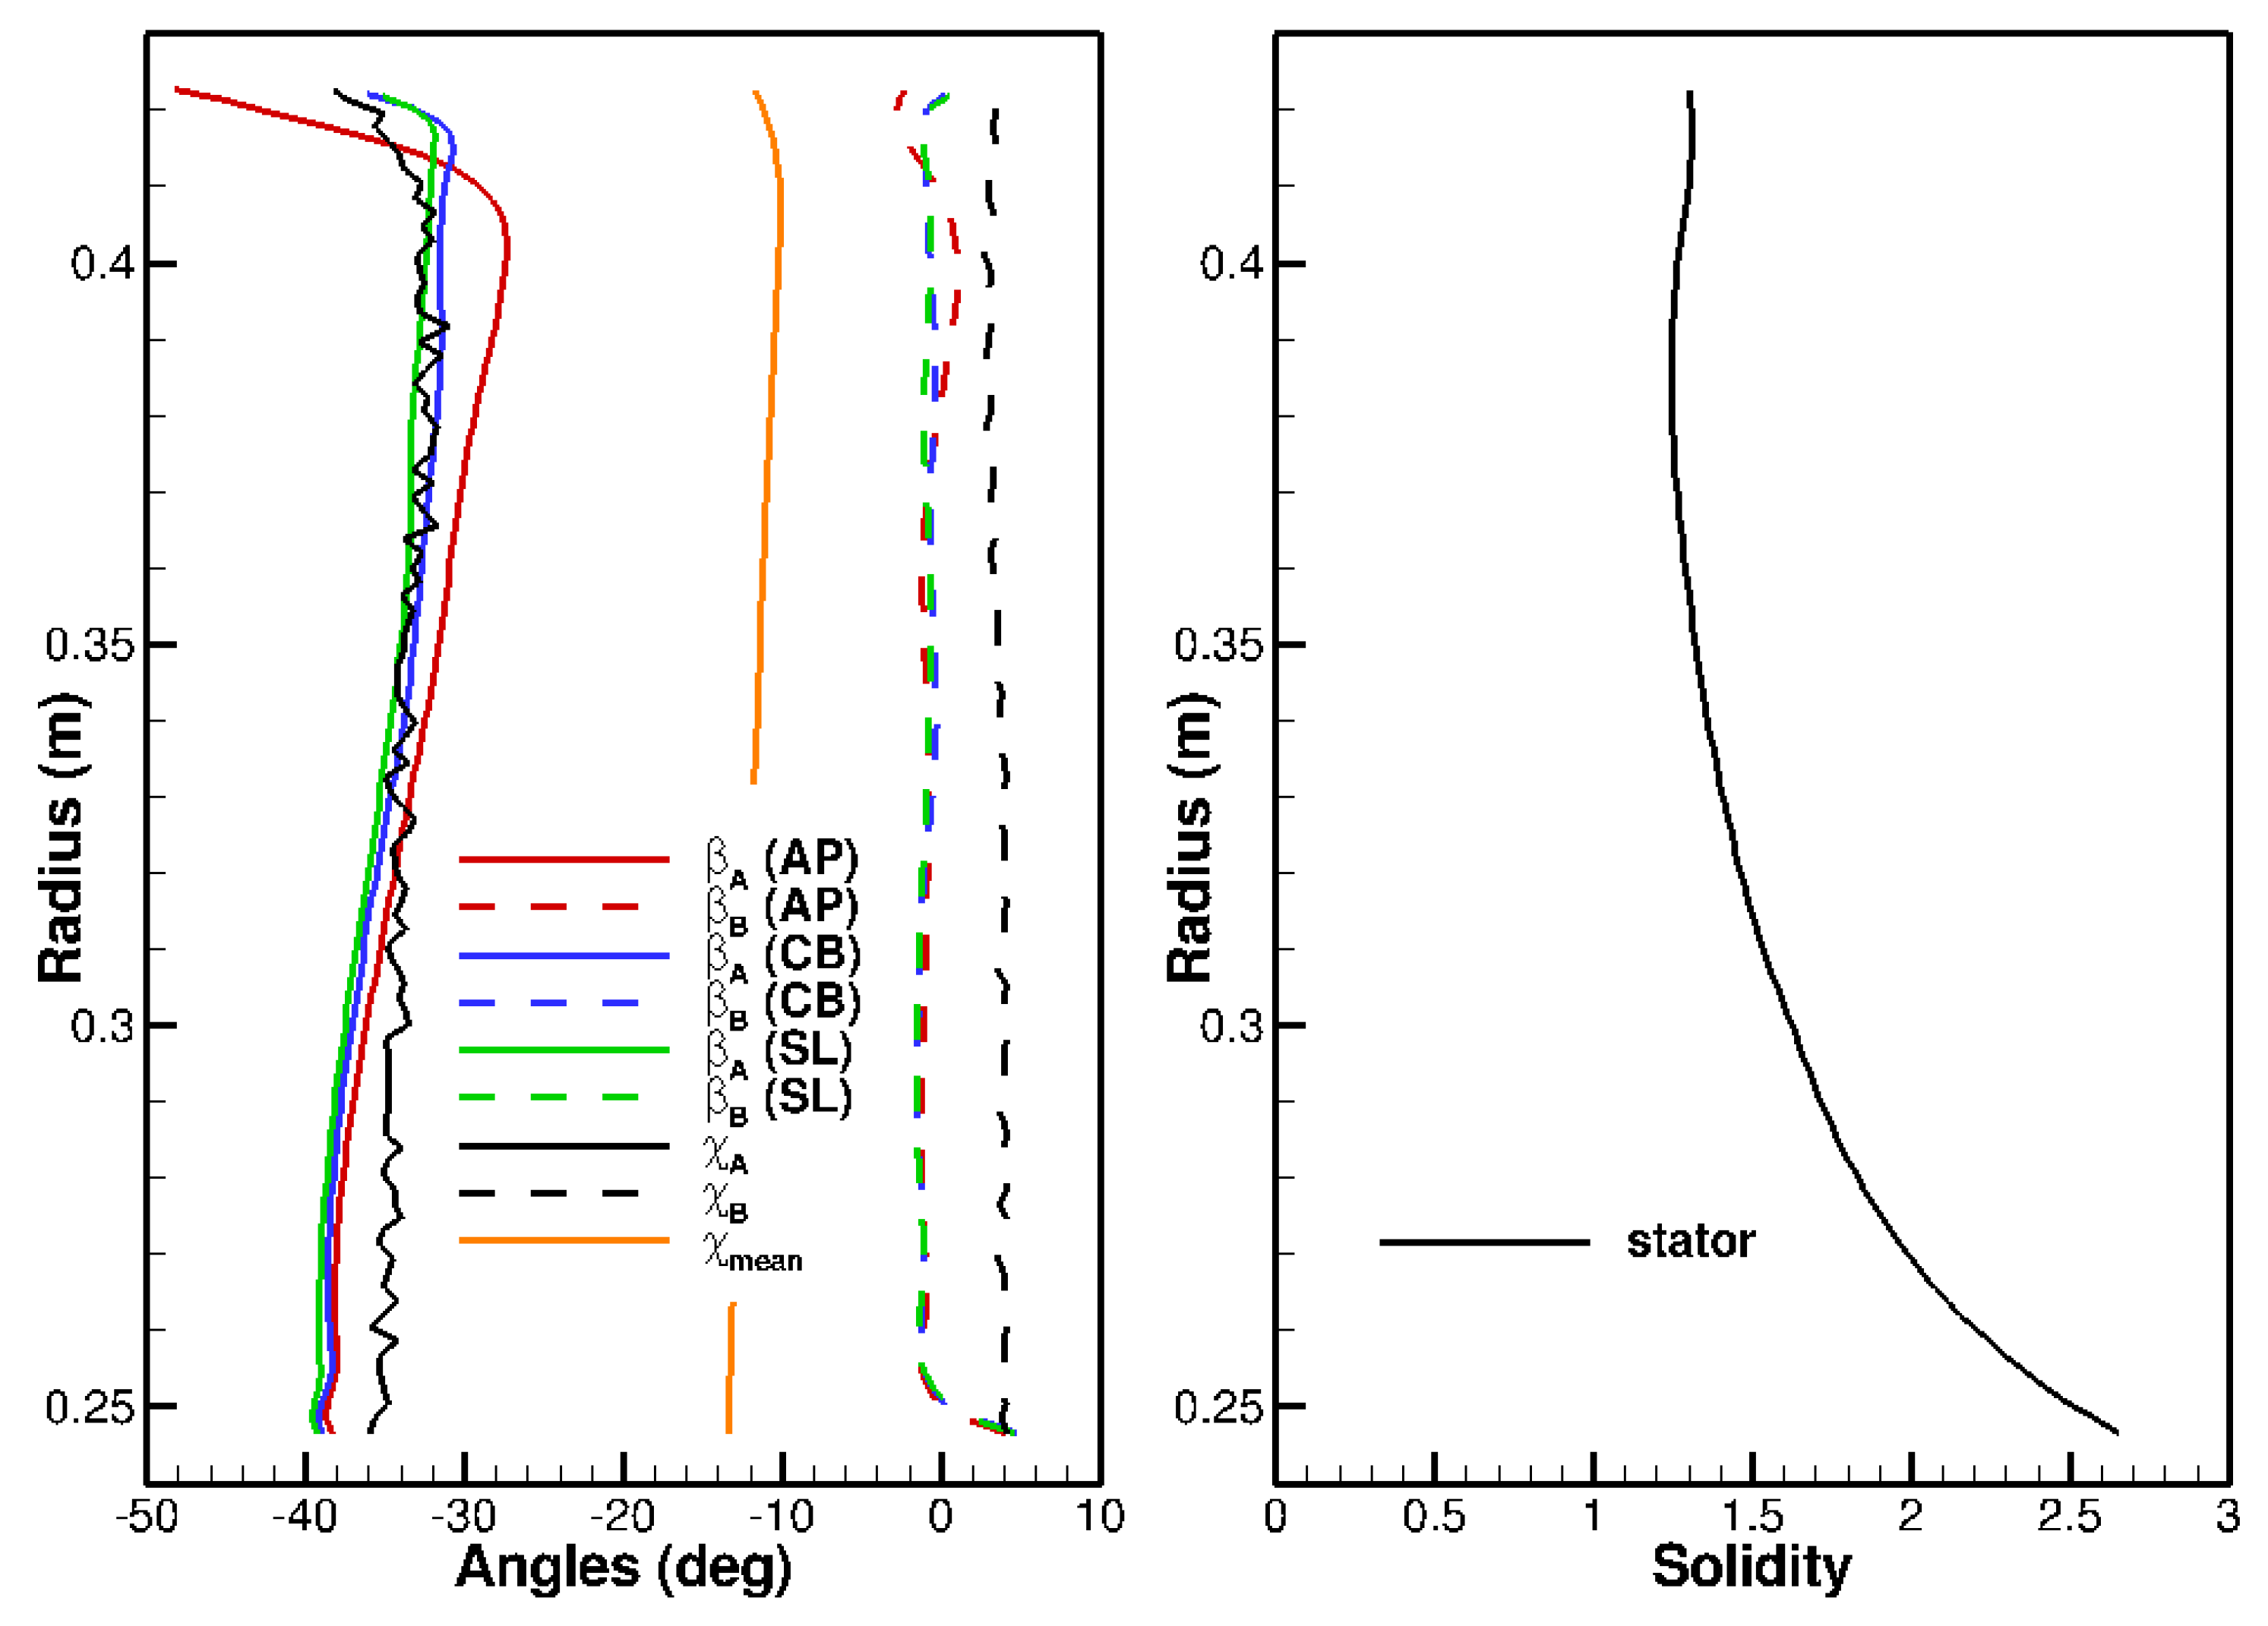
  • Isolated Airfoil vs. Cascade of Airfoils: As the solidity (chord-to-pitch ratio) grows, the cascade effect is expected to play an increasing role in noise. Moreau and Roger [60] considered that the isolated-airfoil approximation should be applicable for values of solidity below one and without overlap. When these conditions are not satisfied, they recommend the use of the cascade response. Note that this analysis does not include the wavenumber of the incoming gust and as a consequence does not account for the potentially differing trends towards low and high frequency. The stator solidity of the ACAT1 stator varies between 2.5 at the hub and 1.4 at the tip (see Figure 7) and the overlap, which depends on the choice of the stagger angle, is positive. According to Moreau and Roger’s criteria, it should be preferable to account for the cascade effect for the ACAT1. Concerning the role of the cascade effect in broadband noise, contrary trends between open and in-duct configurations, two and three-dimensional simulations can be found in the literature. Hanson [7], using the three-dimensional cascade-response model in free field, found little impact on his results, even at low frequency, when he varied the solidity in the range 0.8 to 2.5, while keeping the blade count constant. These findings are not in agreement with Grace’s results [61] for a shrouded configuration. Indeed, she observed differences superior to 5 dB at high frequency on the baseline configuration of the SDT fan but comparable levels at low frequency. The same conclusion can be drawn from de Laborderie’s results [27] for the same fan. Comparing the single airfoil model to the cascade model in 2D, Blandeau et al. [23] reported potentially severe differences between the two solutions at frequencies below a critical value. Above that critical frequency, blade-to-blade interactions are weak and the contribution of all blades to the radiated sound power are additive. By neglecting the cascade effect, the results obtained below the critical limit become increasingly unsuitable as the solidity augments. For a 2D cascade, the critical frequency [52] is given by:
    f c = 1 M 2 M θ + 1 M x 2 c 0 s ,
    where M x and M t are the axial and tangential Mach numbers, M = M x 2 + M θ 2 , and s is the pitch. At the Approach condition, the following values are found in the benchmark data at midspan: M x 0.33 , M θ 0.21 , c 0 343 m/s and s 4.85 × 10 2 m. This yields as critical frequency f c 4600 Hz. A convergence at high frequency, starting in a frequency range not too far from that predicted by Cheong et al. is observed between OB1 (single airfoil) and OB2 (3D cascade). The solution OB3 (3D cascade) also converges to the isolated case but at a much higher frequency. A reduction of the noise levels in the low-frequency range is observable for the OB2, OB3, LN1 and LN2 simulations but not for the LN3 and OP1 curves. The LN3 solution is 2D, which produces the difference as already explained. Concerning OP1, no strong reduction of the noise levels in the low-frequency range is observed because the number of CAA calculations used to derive the a priori correction of the turbulence content were not enough. Only a small amount of CAA simulations were performed and it seems that those were sufficient to reproduce the results at high frequency but insufficient to better account for the low-frequency behaviour. Also note that the TA2 results, which do not consider the cascade effect but do account for the oblique gusts, are very similar to OB2. Thus, it is not clear whether the effect of oblique gusts is dominant over the cascade effect.
  • Cascade of Flat Plates vs. Cascade of Thick, Cambered Airfoils: The comparison between BB1 and LN1 at the condition Approach indicates that considering the real blade geometry does not significantly modify the results. Using a solution valid upstream of the cascade, Evers and Peake [62] also found that considering thickness and camber has a relatively small impact on broadband noise, which is no longer true for tonal noise. Grace [61], using the asymptotic solution for an isolated single blade provided by Ayton and Peake [63], investigated the effect of thickness, camber and angle of attack. For a realistic choice of parameters, the differences reported by Grace did not exceed 3 dB. Using a synthetic turbulence method coupled to a CAA solver, Gea-Aguilera et al. [64] found similar results for fan RSI noise.

5. Conclusions

A benchmark concerning RANS-informed analytical methods applied to rotor–stator interaction broadband noise of turbofan was organised within the framework of the European project TurboNoiseBB. The objective was twofold: (i) to analyse the impact of the Reynolds-Averaged Navier-Stokes calculation on the intermediate turbulence statistics and the final acoustic prediction, (ii) to quantify and assess the influence of the acoustic models. The first question was addressed in the companion paper [1] considering various turbulence models while the same acoustic code was used to predict the noise. For this second part, an inverse strategy was applied: the acoustic models were varied while the same RANS solutions were used as input.
The experimental data of the benchmark were obtained for the transonic fan ACAT1 of AneCom AeroTest. The benchmark made use of the data recorded at the three operating conditions, Approach, Cutback and Sideline along the sea level static working line.
The acoustic tools of the benchmark have differing application objectives and therefore do not need the same accuracy. This explains the very broad range of measured computation time: between one minute and more than one day per acoustic simulation. A classification of the models in two categories was proposed. Group A contains methods based on the acoustic analogy and Group B, the direct acoustic methods bypassing the calculation of a source term. Regarding methods of type A, the following issues were identified: (1) a mismatch between the source model and the Green’s function (swirl was considered either with a simplified model or not at all), (2) significant variations of the power radiation with the choice of the stagger angle, (3) an uncertainty regarding the consideration of the oblique, spanwise gust component in results using a 2D cascade unsteady lift response. Methods of type B exhibited the following issues: (1) a noise overestimation, in particular at low frequency, for the methods based on a 2D acoustic cascade response because spanwise variations of the gust cannot be considered, (2) no straightforward solution to account for the presence of the annular duct, which should mostly impact the low frequency behaviour too. A direct comparison of the acoustic results was difficult as oftentimes models differed from each other in more than one aspect. Nevertheless, the benchmarking activity on the fan ACAT1 led to the following findings:
  • Similar to the RANS turbulence model, the chosen approach to model acoustics may have a significant impact on the predictions of RSI broadband noise. At frequencies higher than the peak frequency, differences of up to ±3 dB were observed between the results and the median solution. At lower frequencies, the deviation was even more substantial, mainly for two reasons: the presence of subcritical gusts and the cut-off effect of acoustic modes, which are both important to consider when the number of contributing waves is small.
  • Compared to experiments, the predicted levels were usually lower by some decibels, even though the turbulence intensity was overestimated by the RANS simulations.
  • The choice of the turbulence spectrum (whether Liepmann or von Kármán) was not of primary importance for the results.
  • Depending whether the open or the in-duct formulation was used for the Green’s function, the results differed at low frequency. The relative impact due to the choice of the Green’s function was found to be stronger by considering the cascade effect.
  • For the case investigated at the lowest Mach number, it could be shown that replacing the real blade geometry by a flat plate is an acceptable assumption for broadband noise. This is likely totally different for tonal noise predictions as the chordwise distribution of the pressure jump is known to be different for real airfoils.
  • The trends predicted by increasing the rotor speed were similar for almost all models. They were principally driven by the changes in the turbulence velocity spectrum.
  • Two-dimensional cascade-based models have inherent difficulties to account for the third, that is, the spanwise, dimension. Several solutions were developed by the participants to overcome that problem. Without these corrections, broadband noise is overestimated at low frequency. With this respect, the single airfoil theory considering the oblique component produces better results.
  • The split between the up- and downstream power levels exhibited different trends for the single-airfoil and the cascade response results.
It was not possible to determine the best combination of models in terms of accuracy because of the uncertainties regarding (i) the turbulence statistics issued from the RANS calculations used to feed the acoustic models, and (ii) the acoustic validation data, as these included the contribution of all acoustic sources in the test rig—particularly strong at low frequency—and not solely rotor–stator interaction noise. Furthermore, rotor shielding is clearly visible in the experimental data measured in the forward arc but was not accounted for in the simulations.
In the benchmark, the turbulence was considered as isotropic. However, the hot-wire measurements in the interstage indicate that this assumption is no more suitable near the casing wall due to the rotor tip vortex and the boundary layer. Reconsidering the way the turbulence is modelled—at least in the regions near the walls—could be necessary to achieve more accurate predictions.
Since one of the principal objectives of RANS-informed analytical methods for fan noise is to properly predict acoustic trends, it would be necessary to conduct further benchmark activities treating more complex vane geometries. Certain model features, which are seemingly negligible for the investigated case, may be essential for such cases.

Author Contributions

Conceptualization, S.G. and C.K.; methodology, S.G. and C.K.; software, S.G., C.K., P.S., R.B., P.C.L., H.d.L., D.L., P.C., C.P., J.T.; validation, S.G., C.K., P.S., R.B., P.C.L., H.d.L., D.L., P.C., C.P., J.T.; formal analysis, S.G., P.S. and C.K.; investigation, S.G., C.K. and P.S.; resources, S.G., C.K., P.S., R.B., P.C.L., H.d.L., D.L., P.C., C.P., J.T.; data curation, S.G., P.S. and C.K.; writing—original draft preparation, S.G.; writing—review and editing, S.G., C.K., P.S., R.B., P.C.L., H.d.L., D.L., P.C., C.P., J.T.; visualization, S.G. and P.S.; supervision, S.G. and C.K. All authors have read and agreed to the published version of the manuscript.

Funding

This work was conducted in the frame of the project TurboNoiseBB, which has received funding from the European Union’s Horizon 2020 research and innovation programme under grant agreement No. 690714.

Acknowledgments

The authors would like to gratefully acknowledge the support of following people: Azucena Pintado and Thomas Nodé-Langlois (AIRBUS), Marc Jacob and Stéphane Moreau (ECL), Maximilian Behn and Sebastian Hakansson (DLR), Phil Joseph (ISVR), and Adolfo Serrano (ITP Aero).

Conflicts of Interest

The authors declare no conflict of interest.

Nomenclature

The following symbols and abbreviations are used in this manuscript:
Abbreviations
ACAT1AneCom AeroTest Rotor 1
APApproach
BPFBlade Passing Frequency
CAAComputational AeroAcoustics
CBCutback
CFDComputational Fluid Dynamics
ESSEngine Support Stator
HWHot Wire (anemometry)
LELeading edge
NASANational Aeronautics and Space Administration
PWLSound Power Level
RANSReynolds Averaged Navier-Stokes
rpmround per minute
RSIRotor–Stator Interaction
SDTSource Diagnostic Test (fan rig)
SLSideline
SLSSea Level Static (working line)
TETrailing edge
TKETurbulence Kinetic Energy
TLSTurbulence Length Scale
TNBBEU founded project TurboNoiseBB
UFFAUniversal Fan Facility for Acoustics
Latin letters
Apressure mode amplitude (Pa)
cspeed of sound (m/s) or blade chord (m)
C L unsteady lift coefficient (-)
ffrequency (1/s)
gGreen’s function
kacoustic wavenumber (1/m) or turbulence kinetic energy (m2/s2)
k RANS turbulence kinetic energy from RANS (m2/s2)
Kconvective wavenumber (1/m)
l r radial correlation length (m)
MMach number (-)
Nnumber of strips (-)
Psound power (W)
rradial position (m)
Rduct radius (m) or cascade response function
spitch (m) (for stator: s = 2 π r/V)
SSears function
S t Strouhal number (-)
u turbulent velocity fluctuation (m/s)
Vnumber of stator vanes (-)
Wmean flow velocity (m/s)
xaxial position (m)
Greek letters
α cut-on factor (-)
β mean flow angle relative to blade (deg)
δ swirl factor (-)
ϵ turbulence dissipation rate (m2/s3)
η hub-to-tip ratio (-)
θ azimuthal angle (deg)
Λ RANS turbulence integral length scale from RANS (m)
ρ density (kg/m3)
σ source term (Pa)
Φ turbulence spectrum (m2/s2)
ψ polar angle (deg)
Ψ chordwise correlation (-)
χ stagger angle (deg)
ω angular frequency (rad/s)
ω * specific turbulence dissipation rate (1/s)
Ω s rotational angular speed of a solid body swirl (rad/s)
Subscripts
0ambient mean flow value
1, 2, 3streamwise, upwash, spanwise
A, Bat/upstream of LE, at/downstream of TE
Lunsteady loading
m , n azimuthal, radial mode order
relrelative to blade
R, Srotor, stator
x, r, θ axial, radial, tangential
⊥, lnormal, parallel to blade chord
Superscripts
±direction of propagation: (+) downstream, (−) upstream
. ¯ averaged value

Appendix A. Summary of the Acoustic Models

Table A1. Characteristics of the acoustic models and principal references.
CodeIDTurbulence
Spectrum
Blade
Model
GustAcoustic Conditions
Mean FlowBoundaries
PropNoise
[42,43]
PN1v. Kármánisolated flat
plate with χ S , A [9]
parallelaxial uniform +
solid body swirl
infinite duct
with hard walls
PN2axial uniformfree
field
OPTIBRUI
[27]
OB1 [50]Liepmannisolated flat
plate with χ S , A [9]
obliqueaxial uniformfree
field
OB2 [7]cascade of flat
plates with χ S , A [12]
stripwise
swirling flow
OB3 [25]axial uniforminfinite duct
with hard walls
BBNANEMSBB1 [56]Liepmanncascade of real
blades [57]
parallelstripwise
swirling flow
free
field
LN1 [55]cascade of flat
plates with χ S , A [53]
LN2cascade of flat
plates with χ S , A [14,53]
oblique
TinA
[46,47]
TA1v. Kármánisolated flat
plate with β S , A [9]
parallelaxial uniforminfinite duct
with hard walls
TA2oblique
Orpheus
[59]
OP1Liepmanncascade of flat
plates with χ S , A [53]
obliqueaxial uniform
strip based
infinite duct
with hard walls
LINSUBLN3 [52]Liepmanncascade of flat
plates with χ S , A [53]
parallelstripwise
swirling flow
free
field
Table A2. Further information about the simulations.
IDNumber of StripsNumber of FrequenciesApproximate
Computation Time
PN1971001 min
PN2971001 min
OB125251 min
OB225253 h on 24 cores
OB325252 h on 240 cores
BB1539170 GPU h/8500 CPU h
LN15392 min
LN253910 min
TA197241 min
TA210241 h
OP1931525 min
LN3491008 h

Appendix B. Modal Sound Power Amplitude

A time-harmonic variation such as p ( x , t ) = p ^ ( x , ω ) e i ω t is considered. In mean swirling flows with a constant axial velocity (Mach number: M x ) and a small solid-body rotation at angular velocity Ω s , the pressure field can be decomposed into a sum of orthogonal eigenmodes of azimuthal and radial orders m and n:
p ( x , ω ) = m , n A m n ± e i k x , m n ± x e i m θ f m n ( r ) .
The function f m n describes the radial variation of the pressure of the mode. Its solution is obtained by solving a second-order ordinary differential equation on the pressure. In annular ducts, the function f m n is composed of a sum of Bessel ( J m ) and Newmann ( Y m ) functions of order m [65]:
f m n ( r ) = 1 F m n J m σ m n r R + Q m n Y m σ m n r R ,
with
Q m n = J m ( σ m n ) Y m ( σ m n ) .
The symbol “ ” denotes radial derivatives. The function f m n is normalised with F m n such as
1 2 π R 2 0 2 π η R R | f m n ( r ) | 2 r d r d θ = 1 .
For hard walls, the factor σ m n is defined so that the equality
f m n ( r ) r = η R , R = 0
is satisfied at the hub and casing walls. The axial wavenumber k x , m n ± and the cut-on factor α m are defined as follows:
k x , m n ± = k δ m 1 M x 2 M x ± α m n ,
α m n = 1 ( 1 M x 2 ) δ m 2 σ m n 2 ( k R ) 2 .
The swirl factor δ m ,
δ m = 1 m M s k R ,
accounts for the presence of the rigid body swirl [66]. The swirl Mach number M s = Ω s R / c 0 is calculated at the tip wall. It should satisfy M s 1 . The modal sound power is given by
P m n ± = π R 2 α m n ρ 0 c 0 δ m C m n ± | A m n ± | 2 ,
with
C m n ± = ( 1 M x 2 ) 2 ( 1 α m n M x ) 2 .
Notice that in the current derivation A m n is a peak amplitude, whereas A m n corresponds to a root-mean square value in Equation (5). As a consequence the modal sound power in Equation (A9) has to be multiplied by a factor 2 when applied to broadband noise. The sound power spectrum P ± is obtained by summing the contributions of all cut-on modes at the same frequency:
P ± ( ω ) = m , n P m n ± ( ω ) .

References

  1. Kissner, C.; Guérin, S.; Seeler, P.; Billson, M.; Chaitanya, P.; Laraña, P.C.; de Laborderie, H.; François, B.; Lefarth, K.; Lewis, D.; et al. ACAT1 benchmark of RANS-informed analytical methods for fan noise prediction: Part I—Influence of the RANS Simulation. Acoustics 2020, 2, 539–578. [Google Scholar] [CrossRef]
  2. Rienstra, S. Sound transmission in slowly varying circular and annular lined ducts with flow ducts. J. Fluid Mech. 1999, 380, 279–296. [Google Scholar] [CrossRef] [Green Version]
  3. Ribner, H.S. Shock-Turbulence Interaction and the Generation of Noise; NACA Technical Note 3255; NACA: Washington, DC, USA, 1954. [Google Scholar]
  4. Posson, H.; Roger, M.; Moreau, S. On a uniformly valid analytical rectilinear cascade response function. J. Fluid Mech. 2010, 663, 22–52. [Google Scholar] [CrossRef] [Green Version]
  5. Moreau, S. Turbomachinery Noise Predictions: Present and Future. Acoustics 2019, 1, 92–116. [Google Scholar] [CrossRef] [Green Version]
  6. Amiet, R. Acoustic radiation from an airfoil in a turbulent stream. J. Sound Vib. 1975, 41, 407–420. [Google Scholar] [CrossRef]
  7. Hanson, D. Theory for Broadband Noise of Rotor and Stator Cascades with Inhomogeneous Inflow Turbulence Including Effects of Lean and Sweep; NASA CR-2001-210762; NASA: Cleveland, OH, USA, 2001. [Google Scholar]
  8. Curle, N. The influence of solid boundaries upon aerodynamic sound. Proc. R. Soc. 1955, 231, 505–514. [Google Scholar]
  9. Amiet, R. Compressibility effects in unsteady thin-airfoil theory. AIAA J. 1974, 12, 252–254. [Google Scholar] [CrossRef]
  10. Sears, W. Some aspects of non-stationary airfoil theory and its practical applications. J. Aeronaut. Sci. 1941, 8, 104–108. [Google Scholar] [CrossRef]
  11. Adamczyk, J.J. The Passage of an Infinite Swept Airfoil through an Oblique Gust; NASA CR-2395; NASA: Wahington, DC, USA, 1974. [Google Scholar]
  12. Glegg, S. The response of a swept blade row to a three-dimensional gust. J. Sound Vib. 1999, 227, 29–64. [Google Scholar] [CrossRef]
  13. Goldstein, M. Aeroacoustics; McGraw-Hill: New York, NY, USA, 1976. [Google Scholar]
  14. Graham, J. Similarity rules for thin aerofoils in non-stationary subsonic flows. J. Fluid Mech. 1970, 43, 753–766. [Google Scholar] [CrossRef]
  15. Kerschen, E.; Gliebe, P. Fan Noise Caused by Ingestion of Anisotropic Turbulence—A Model Based on Axisymmetric Turbulence Theory. In Proceedings of the 6th AIAA Aeroacoustics Conference, Hartford, CT, USA, 4–6 June 1980. [Google Scholar]
  16. Ventres, C.; Theobald, M.; Mark, W. Turbofan Noise Generation. Volume 1: Analysis; NASA CR-167952; NASA: Cleveland, OH, USA, 1982. [Google Scholar]
  17. Nallasamy, M.; Envia, E. Computation of rotor wake turbulence noise. J. Sound Vib. 2005, 282, 649–678. [Google Scholar] [CrossRef]
  18. Grace, S.; Wixom, A.; Winkler, J.; Sondak, D.; Logue, M.M. Fan Broadband Interaction Noise Modeling. In Proceedings of the 18th AIAA/CEAS Aeroacoustics Conference, Colorado Springs, CO, USA, 4–6 June 2012. [Google Scholar]
  19. Kissner, C.A.; Guérin, S. Influence of Wake and Background Turbulence on Predicted Fan Broadband Noise. AIAA J. 2019, 58. [Google Scholar] [CrossRef] [Green Version]
  20. Grace, S.; Maunus, J.; Sondak, D. Effect of CFD Wake Prediction in a Hybrid Simulation of Fan Broadband Interaction Noise. In Proceedings of the 17th AIAA/CEAS Aeroacoustics Conference, Portland, OR, USA, 5–8 June 2011. [Google Scholar]
  21. Moreau, A.; Guérin, S. The impact of low-speed fan design on noise: An exploratory study. J. Turbomach. 2016, 138, 081006. [Google Scholar] [CrossRef]
  22. Jaron, R.; Herthum, H.; Franke, M.; Moreau, A.; Guérin, S. Impact of turbulence models on RANS-informed prediction of fan broadband noise. In Proceedings of the 12th European Conference on Turbomachinery Fluid dynamics and Thermodynamics, Stockholm, Sweden, 3–7 April 2017. [Google Scholar]
  23. Blandeau, V.P.; Joseph, P.F.; Jenkins, G.; Powles, C.J. Comparison of sound power radiation from isolated airfoils and cascades in a turbulent flow. J Acoust. Soc. Am. 2011, 129, 3521–3530. [Google Scholar] [CrossRef] [PubMed]
  24. Grace, S. Fan broadband interaction noise modeling using a low-order method. J. Sound Vib. 2015, 346, 402–423. [Google Scholar] [CrossRef]
  25. Posson, H.; Moreau, S.; Roger, M. Broadband noise prediction of fan outlet guide vane using a cascade response function. J. Sound Vib. 2011, 330, 6153–6183. [Google Scholar] [CrossRef]
  26. Posson, H.; Moreau, S.; Roger, M. On the use of a uniformly valid analytical cascade response function for fan broadband noise predictions. J. Sound Vib. 2011, 329, 3721–3743. [Google Scholar] [CrossRef]
  27. de Laborderie, J. Approches Analytiques et NuméRiques pour la PréDiction du Bruit Tonal et Large Bande de Soufflantes de Turboréacteurs. Ph.D. Thesis, Université de Sherbrooke, Sherbrooke, QC, Canada, 2013. [Google Scholar]
  28. Lewis, D.; Moreau, S.; Jacob, M. On the use of RANS-informed analytical models to perform broadband rotor-stator interaction noise predictions. In Proceedings of the 25th AIAA/CEAS Aeroacoustics Conference, Delft, The Netherlands, 20–23 May 2019. [Google Scholar]
  29. TurboNoiseBB. European Union’s Horizon 2020 Research and Innovation Programme. Available online: http://dlr.de/at/turbonoisebb (accessed on 9 May 2020).
  30. Guérin, S.; Kissner, C.; Kajasa, B.; Jaron, R.; Behn, M.; Hakansson, S.; Pardowitz, B.; Tapken, U.; Meyer, R.; Enghardt, L. Noise prediction of the ACAT1 fan with a RANS-informed analytical method: Success and challenge. In Proceedings of the 25th AIAA/CEAS Aeroacoustics Conference, Delft, The Netherlands, 20–23 May 2019. [Google Scholar]
  31. Meyer, R.; Hakansson, S.; Hage, W.; Enghardt, L. Instantaneous flow field measurements in the interstage section between a fan and the outlet guiding vanes at different axial positions. In Proceedings of the 13th European Conference on Turbomachinery Fluid Dynamics and Thermodynamics, Lausanne, Switzerland, 8–12 April 2019. [Google Scholar]
  32. Tapken, U.; Behn, M.; Spitalny, M.; Pardowitz, B. Radial mode breakdown of the ACAT1 fan broadband noise generation in the bypass duct using a sparse sensor array. In Proceedings of the 25th AIAA/CEAS Aeroacoustics Conference, Delft, The Netherlands, 20–23 May 2019. [Google Scholar]
  33. Tapken, U.; Pardowitz, B.; Behn, M. Radial mode analysis of fan broadband noise. In Proceedings of the 23rd AIAA/CEAS Aeroacoustics Conference, Denver, CO, USA, 5–9 June 2017. [Google Scholar]
  34. Behn, M.; Pardowitz, B.; Tapken, U. Separation of tonal and broadband noise components by cyclostationary analysis of the modal sound field in a low-speed fan test rig. In Proceedings of the International Conference of Fan Noise, Aerodynamics, Applications and Systems 2018, Darmstadt, Germany, 18–20 April 2018. [Google Scholar]
  35. Joseph, P.; Morfey, C.; Lowis, C. Multi-mode sound transmission in duts with flow. J. Sound Vib. 2003, 264, 523–544. [Google Scholar] [CrossRef]
  36. Pereira, A.; Jacob, M. Experimental assessement of in-duct modal content of fan broadband noise via iterative Bayesian inverse approach. In Proceedings of the Berlin Beamforming Conference, Berlin, Germany, 2–3 March 2020. [Google Scholar]
  37. Heidmann, M. Interim Prediction Method for Fan and Compressor Source Noise; NASA TM X-71763; NASA: Cleveland, OH, USA, 1979. [Google Scholar]
  38. Becker, K.; Heitkamp, K.; Kügeler, E. Recent Progress in a Hybrid Grid CFD Solver for Turbomachinery Flows. In Proceedings of the Fifth European Conference on Computational Fluid Dynamics, Lisbon, Portugal, 14–17 June 2010. [Google Scholar]
  39. Menter, F.R. Two-equation eddy-viscosity turbulence models for engineering applications. AIAA J. 1994, 32, 1598–1605. [Google Scholar] [CrossRef] [Green Version]
  40. Jaron, R. Aeroakustische Auslegung Von Triebwerksfans Mittels Multidisziplinärer Optimierungen. Ph.D. Thesis, Technische Universität Berlin, Berlin, Germany, 2018. [Google Scholar]
  41. Pope, S. Turbulent Flows; Cambridge University Press: Cambridge, UK, 2011. [Google Scholar]
  42. Moreau, A. A Unified Analytical Approach for the Acoustic Conceptual Design of Fans of Modern Aero-Engines. Ph.D. Thesis, Technische Universität Berlin, Berlin, Germany, 2017. [Google Scholar]
  43. Moreau, A.; Guérin, S. Similarities of the in-duct and free-field formulations in rotor noise problems. In Proceedings of the 17th AIAA/CEAS Aeroacoustics Conference, Portland, OR, USA, 5–8 June 2011. [Google Scholar]
  44. Hanson, D.B. Helicoidal surface theory for harmonic noise of propellers in the far field. AIAA J. 1980, 18, 1213–1220. [Google Scholar] [CrossRef]
  45. Blokhinstev, D. The propagation of sound in an inhomogeneous and moving medium. J. Acoust. Soc. Am. 1946, 18, 322–328. [Google Scholar] [CrossRef]
  46. Reboul, G.; Polacsek, C.; Léwy, S.; Heib, S. Ducted-Fan Broadband Noise Simulations Using Unsteady or Averaged Data. In Proceedings of the 37th International Congress and Exposition on Noise Control Engineering, Shanghai, China, 26–29 October 2008. [Google Scholar]
  47. Reboul, G. Modélisation du Bruit à Large Bande de Soufflante de Turboréacteur. Ph.D. Thesis, École Centrale de Lyon, Lyon, France, 2010. [Google Scholar]
  48. Amiet, R. High-frequency thin-airfoil theory for subsonic flow. AIAA J. 1976, 14, 1076–1082. [Google Scholar] [CrossRef]
  49. Guérin, S.; Moreau, A.; Tapken, U. Relation between source models and acoustic duct modes. In Proceedings of the 15th AIAA/CEAS Aeroacoustics Conference, Miami, FL, USA, 11–13 May 2009. [Google Scholar]
  50. Amiet, R.; Egolf, C.; Simonich, J. Noise Produced by Turbulent Flow into a Rotor: Users Manual for Noise Calculation; NASA CR-181790; NASA: Hampton, VA, USA, 1989. [Google Scholar]
  51. Hanson, D.; Horan, K. Turbulence/cascade interaction, spectra of inflow, cascade response, and noise. In Proceedings of the AIAA/CEAS Aeroacoustics Conference, Toulouse, France, 2–4 June 1998. [Google Scholar]
  52. Cheong, C.; Joseph, P.; Lee, S. High frequency formulation for the acoustic power spectrum due to cascade-turbulence interaction. J. Acoust. Soc. Am. 2006, 119, 108–122. [Google Scholar] [CrossRef] [PubMed] [Green Version]
  53. Whitehead, D. AGARD Manual on Aeroelasticity in Axial-Flow Turbomachines. Volume 1: Unsteady Turbomachinery Aerodynamics, Classical Two-Dimensional Methods; AGARD-AG-298; AGARD: Neuilly sur Seine, France, 1987. [Google Scholar]
  54. Smith, S.N. Discrete Frequency Sound Generation in Axial Flow Turbomachines; Aeronautical Research Council Reports and Memoranda; Reports and Memoranda No. 3709; Her Majesty’s Stationery Office: London, UK, 1970. [Google Scholar]
  55. Blázquez, R.; Corral, R. Efficient Fan Broadband Noise Prediction using Navier-Stokes Linearized Analysis. In Proceedings of the 25th AIAA/CEAS Aeroacoustics Conference, Delft, The Netherlands, 20–23 May 2019. [Google Scholar]
  56. Blázquez, R.; Corral, R. Prediction of fan acoustic blockage on fan-outlet guide vanes broadband interaction noise. In Proceedings of the 15th Turbomachinery Technical Conference and Exposition, London, UK, 22–26 June 2020. [Google Scholar]
  57. Corral, R.; Escribano, A.; Gisbert, F.; Serrano, A.; Vasco, C. Validation of a linear multigrid accelerated un structured Navier-Stokes solver for the computation of turbine blades on hybrid grids. In Proceedings of the 9th AIAA/CEAS Aeroa Coustics Conference, Hilton Head, SC, USA, 12–14 May 2003. [Google Scholar]
  58. Wohlbrandt, A.; Kissner, C.; Guérin, S. Impact of cyclostationarity on fan broadband noise prediction. J. Sound Vib. 2018, 420, 142–164. [Google Scholar] [CrossRef] [Green Version]
  59. Carrasco Laraña, P.C.; Serrano, A. A Frequency Domain Model for Turbine Interaction Broadband Noise: Comparison with Measurements. In Proceedings of the 24th AIAA/CEAS Aeroacoustics Conference, Atlanta, GA, USA, 25–29 June 2018. [Google Scholar]
  60. Moreau, S.; Roger, M. Advanced noise modeling for future propulsion systems. Int. J. Aeroacoust. 2018, 17, 576–599. [Google Scholar] [CrossRef]
  61. Grace, S. Further Investigations into a Low-Order Model of Fan Broadband Noise. In Proceedings of the 21st AIAA/CEAS Aeroacoustics Conference, Dallas, TX, USA, 22–26 June 2015. [Google Scholar]
  62. Evers, I.; Peake, N. On sound generation by the interaction between turbulence and a cascade of airfoils with non-uniform mean flow. J. Fluid Mech. 2002, 463, 25–52. [Google Scholar] [CrossRef]
  63. Ayton, L.J.; Peake, N. On high-frequency noise scattering by aerofoils in Flow. J. Fluid Mech. 2013, 734, 144–182. [Google Scholar] [CrossRef]
  64. Gea-Aguilera, F.; Gill, J.; Zhang, X. On the effects of fan wake modelling and vane design on cascade noise. J. Sound Vib. 2019, 459, 114859. [Google Scholar] [CrossRef]
  65. Morse, M.; Ingard, K. Theoretical Acoustics; Princeton University Press: Princeton, NJ, USA, 1986. [Google Scholar]
  66. Morfey, C. Sound transmission and generation in ducts with flow. J. Sound Vib. 1971, 14, 37–55. [Google Scholar] [CrossRef]
Figure 1. Notations as used in this paper for a rectilinear cascade of flat plates.
Acoustics 02 00033 g001
Figure 2. UFFA rig of AneCom AeroTest with the acoustic instrumentation as used during the TurboNoiseBB tests (TurboNoiseBB consortium, reprint with permission).
Acoustics 02 00033 g002
Figure 3. Sound power spectra at Sideline used for the comparison with the predictions: (top) (black line) result obtained from the far-field microphones located in the forward arc of the test rig as illustrated in Figure 2, (bottom) (black line) result obtained from the line array AX1 located in the bypass duct after the rotor-locked contribution and the hydrodynamic pressure component had been removed; (dashed red lines) hand drawn curves suggesting the presence of an additional, dominant source of noise at low frequency.
Acoustics 02 00033 g003
Figure 4. Extraction of geometry and flow parameters from RANS simulations by means of the post-processing method implemented in C3D_T2P (adapted from Jaron [40]).
Acoustics 02 00033 g004
Figure 5. Spanwise distribution of the axial ( M x ), tangential ( M θ ) and absolute (M) Mach numbers obtained by circumferential averaging at positions A and B, respectively located at one quarter chord length upstream of the stator leading edge and one quarter chord length downstream of the trailing edge (see positions A and B approximately indicated in Figure 4).
Acoustics 02 00033 g005
Figure 6. Turbulent kinetic energy k ¯ RANS (top) and turbulence length scale Λ ¯ RANS (bottom) reconstructed at the stator leading edge for the three investigated operationg points: Approach (AP), Cutback (CB) and Sideline (SL).
Acoustics 02 00033 g006
Figure 7. Spanwise distribution of (left) the flow ( β ) and stator ( χ ) angles, and of (right) the stator solidity (chord-to-pitch ratio).
Acoustics 02 00033 g007
Figure 8. Classification of the models used in Part II of the TurboNoiseBB benchmark.
Acoustics 02 00033 g008
Figure 9. Acoustic results of the benchmark: (left) upstream PWL, (right) downstream PWL.
Acoustics 02 00033 g009
Figure 10. Sound power difference Δ P d B ( f ) = PWL d o w n ( f ) PWL u p ( f ) ; (a) Approach, (b) Cutback, (c,d) Sideline.
Acoustics 02 00033 g010
Figure 11. Acoustic change by increased speed: (left) upstream PWL, (right) downstream PWL.
Acoustics 02 00033 g011
Table 1. True and corrected operating conditions on the SLS working line as measured during the acoustic tests.
Short GapApproach (AP)Cutback (CB)Sideline (SL)
rpm
massflow (kg/s)
3856.1 (50%)
54.85
6175.1 (80%)
88.80
6945.7 (90%)
101.32
corr. rpm
corr. massflow (kg/s)
3797.9
56.48
6077.3
91.61
6836.5
104.53

