The Effect of Deviation Due to the Manufacturing Accuracy in the Parameters of an MPP on Its Acoustic Properties: Trial Production of MPPs of Different Hole Shapes Using 3D Printing


Abstract
:1. Introduction
1.1. Background
1.2. Sound Absorption Performance of MPPs and Manufacturing Accuracy
1.3. Purpose of the Present Study
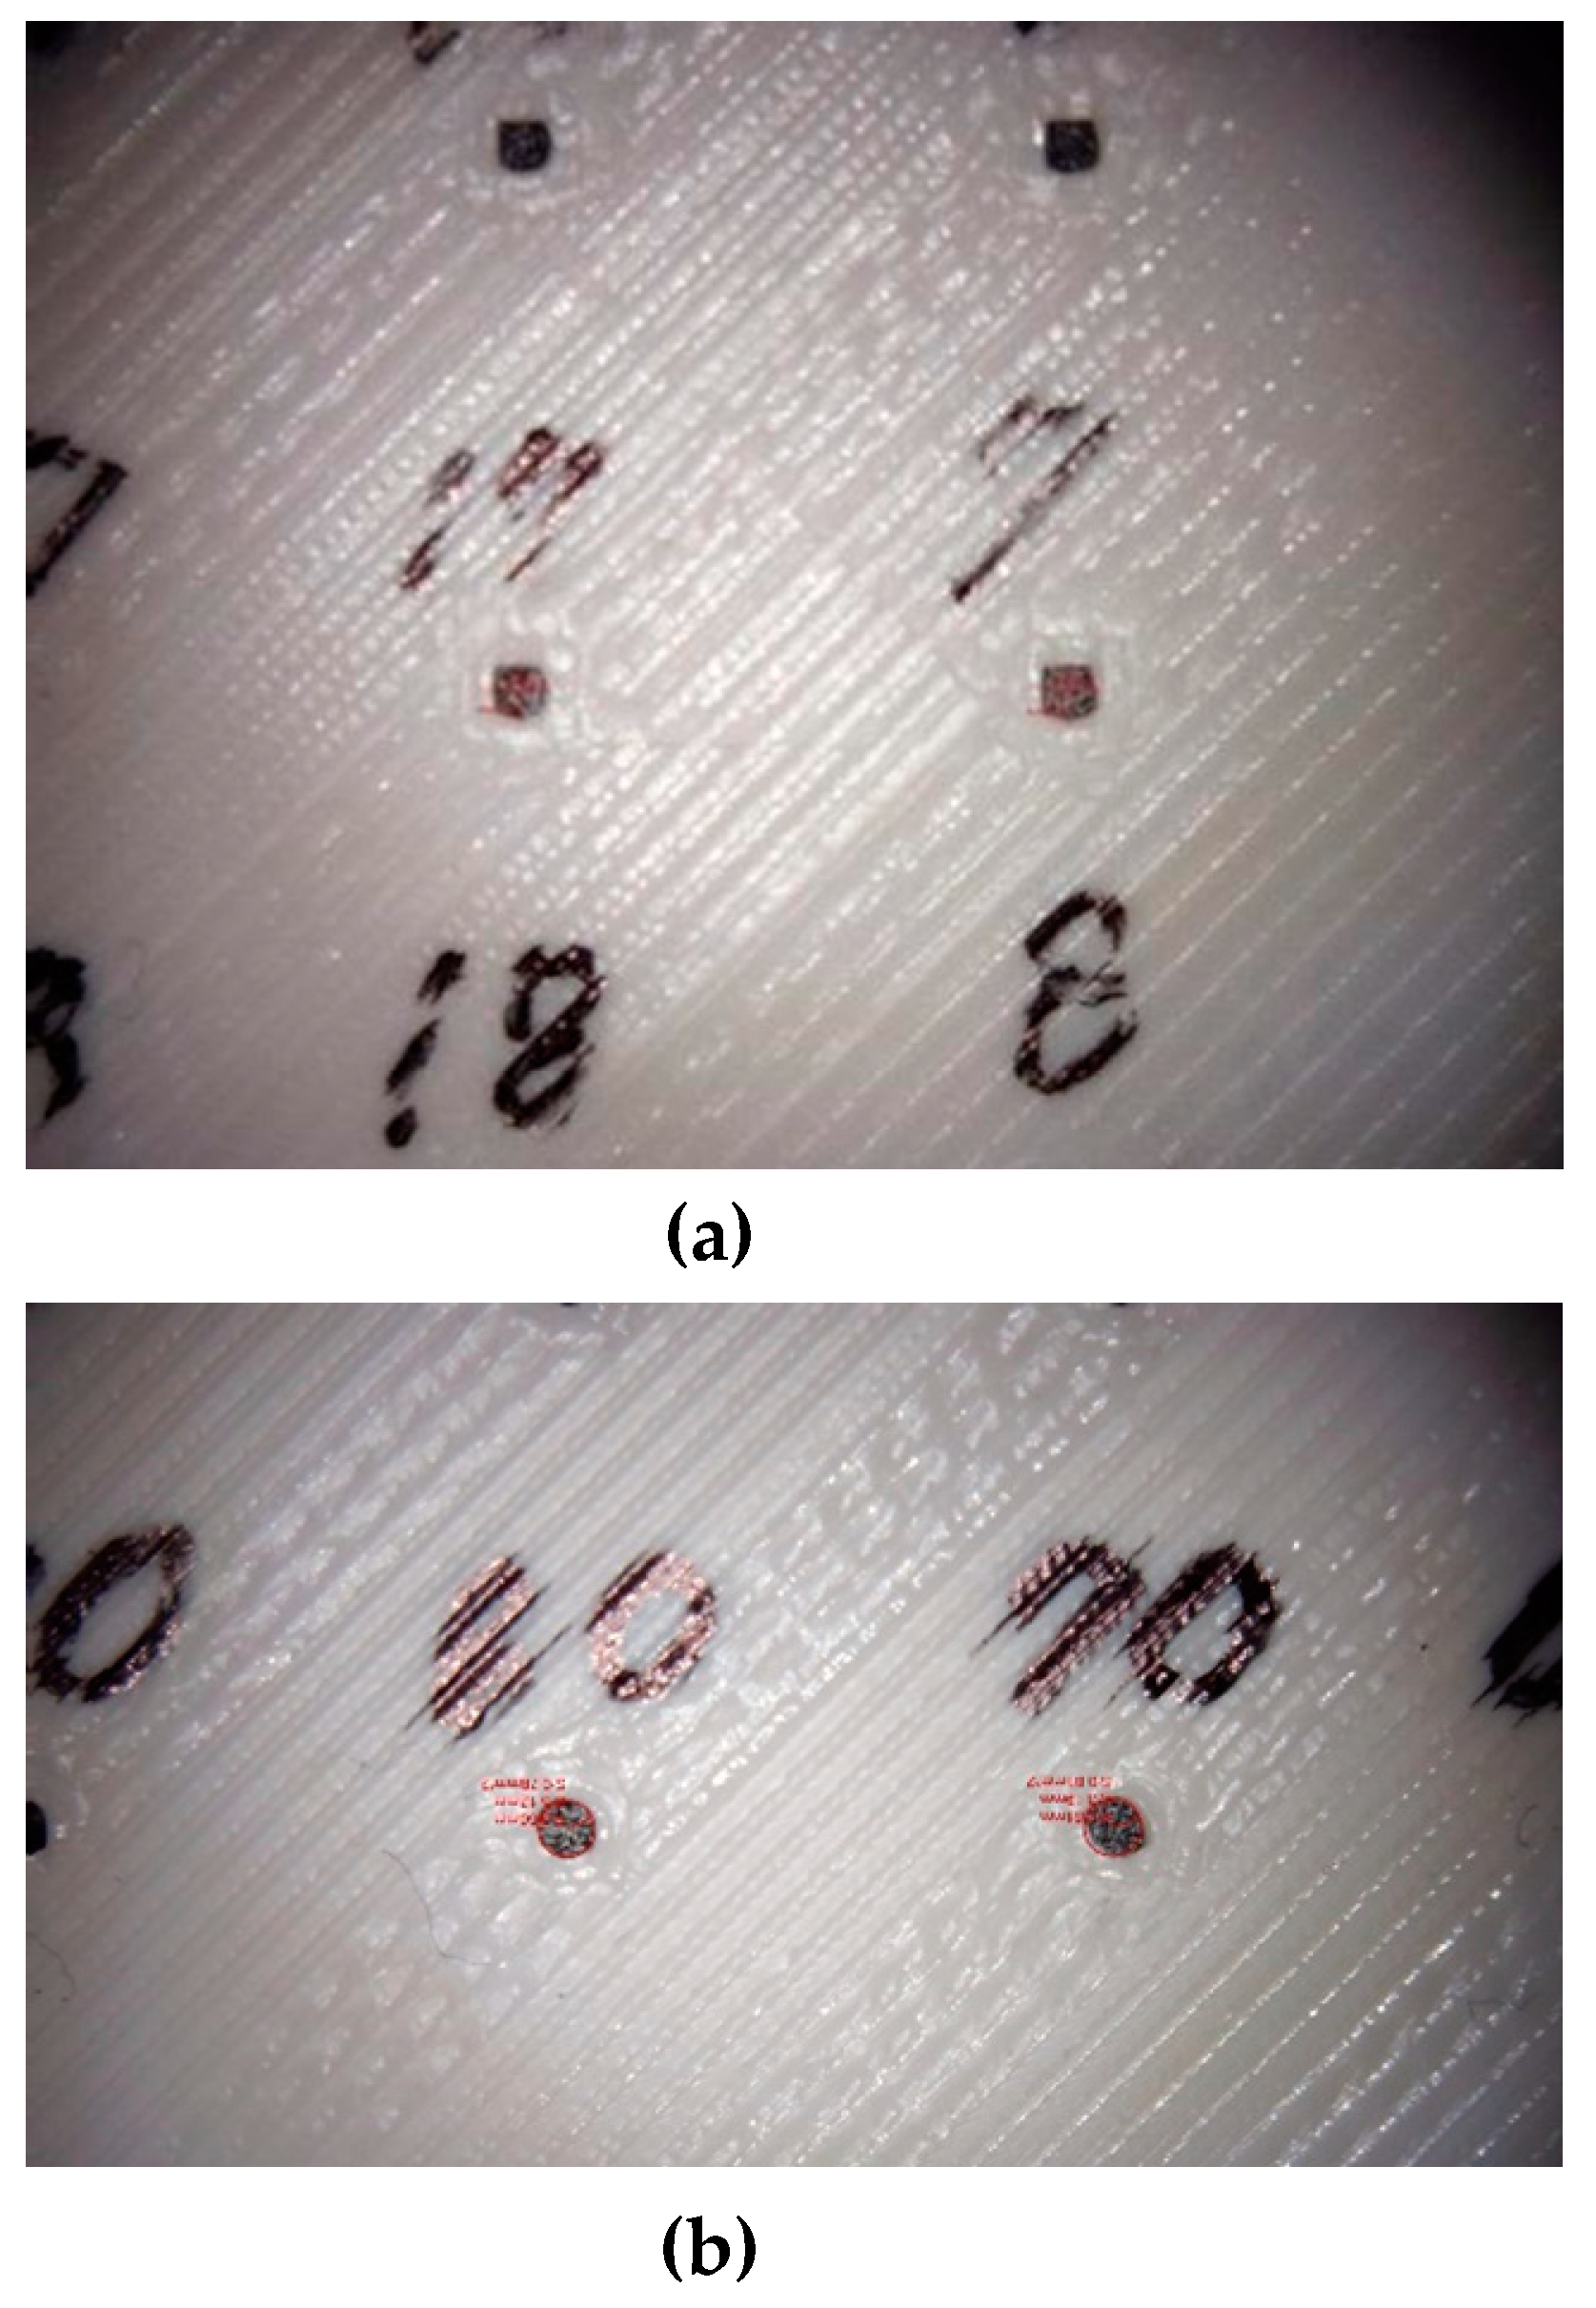
2. Preparation of the Specimens
3. Measurement in an Impedance Tube and Theoretical Prediction
3.1. Outline of Measurement Method
3.2. Prediction by Guo’s Model
4. Results and Discussion
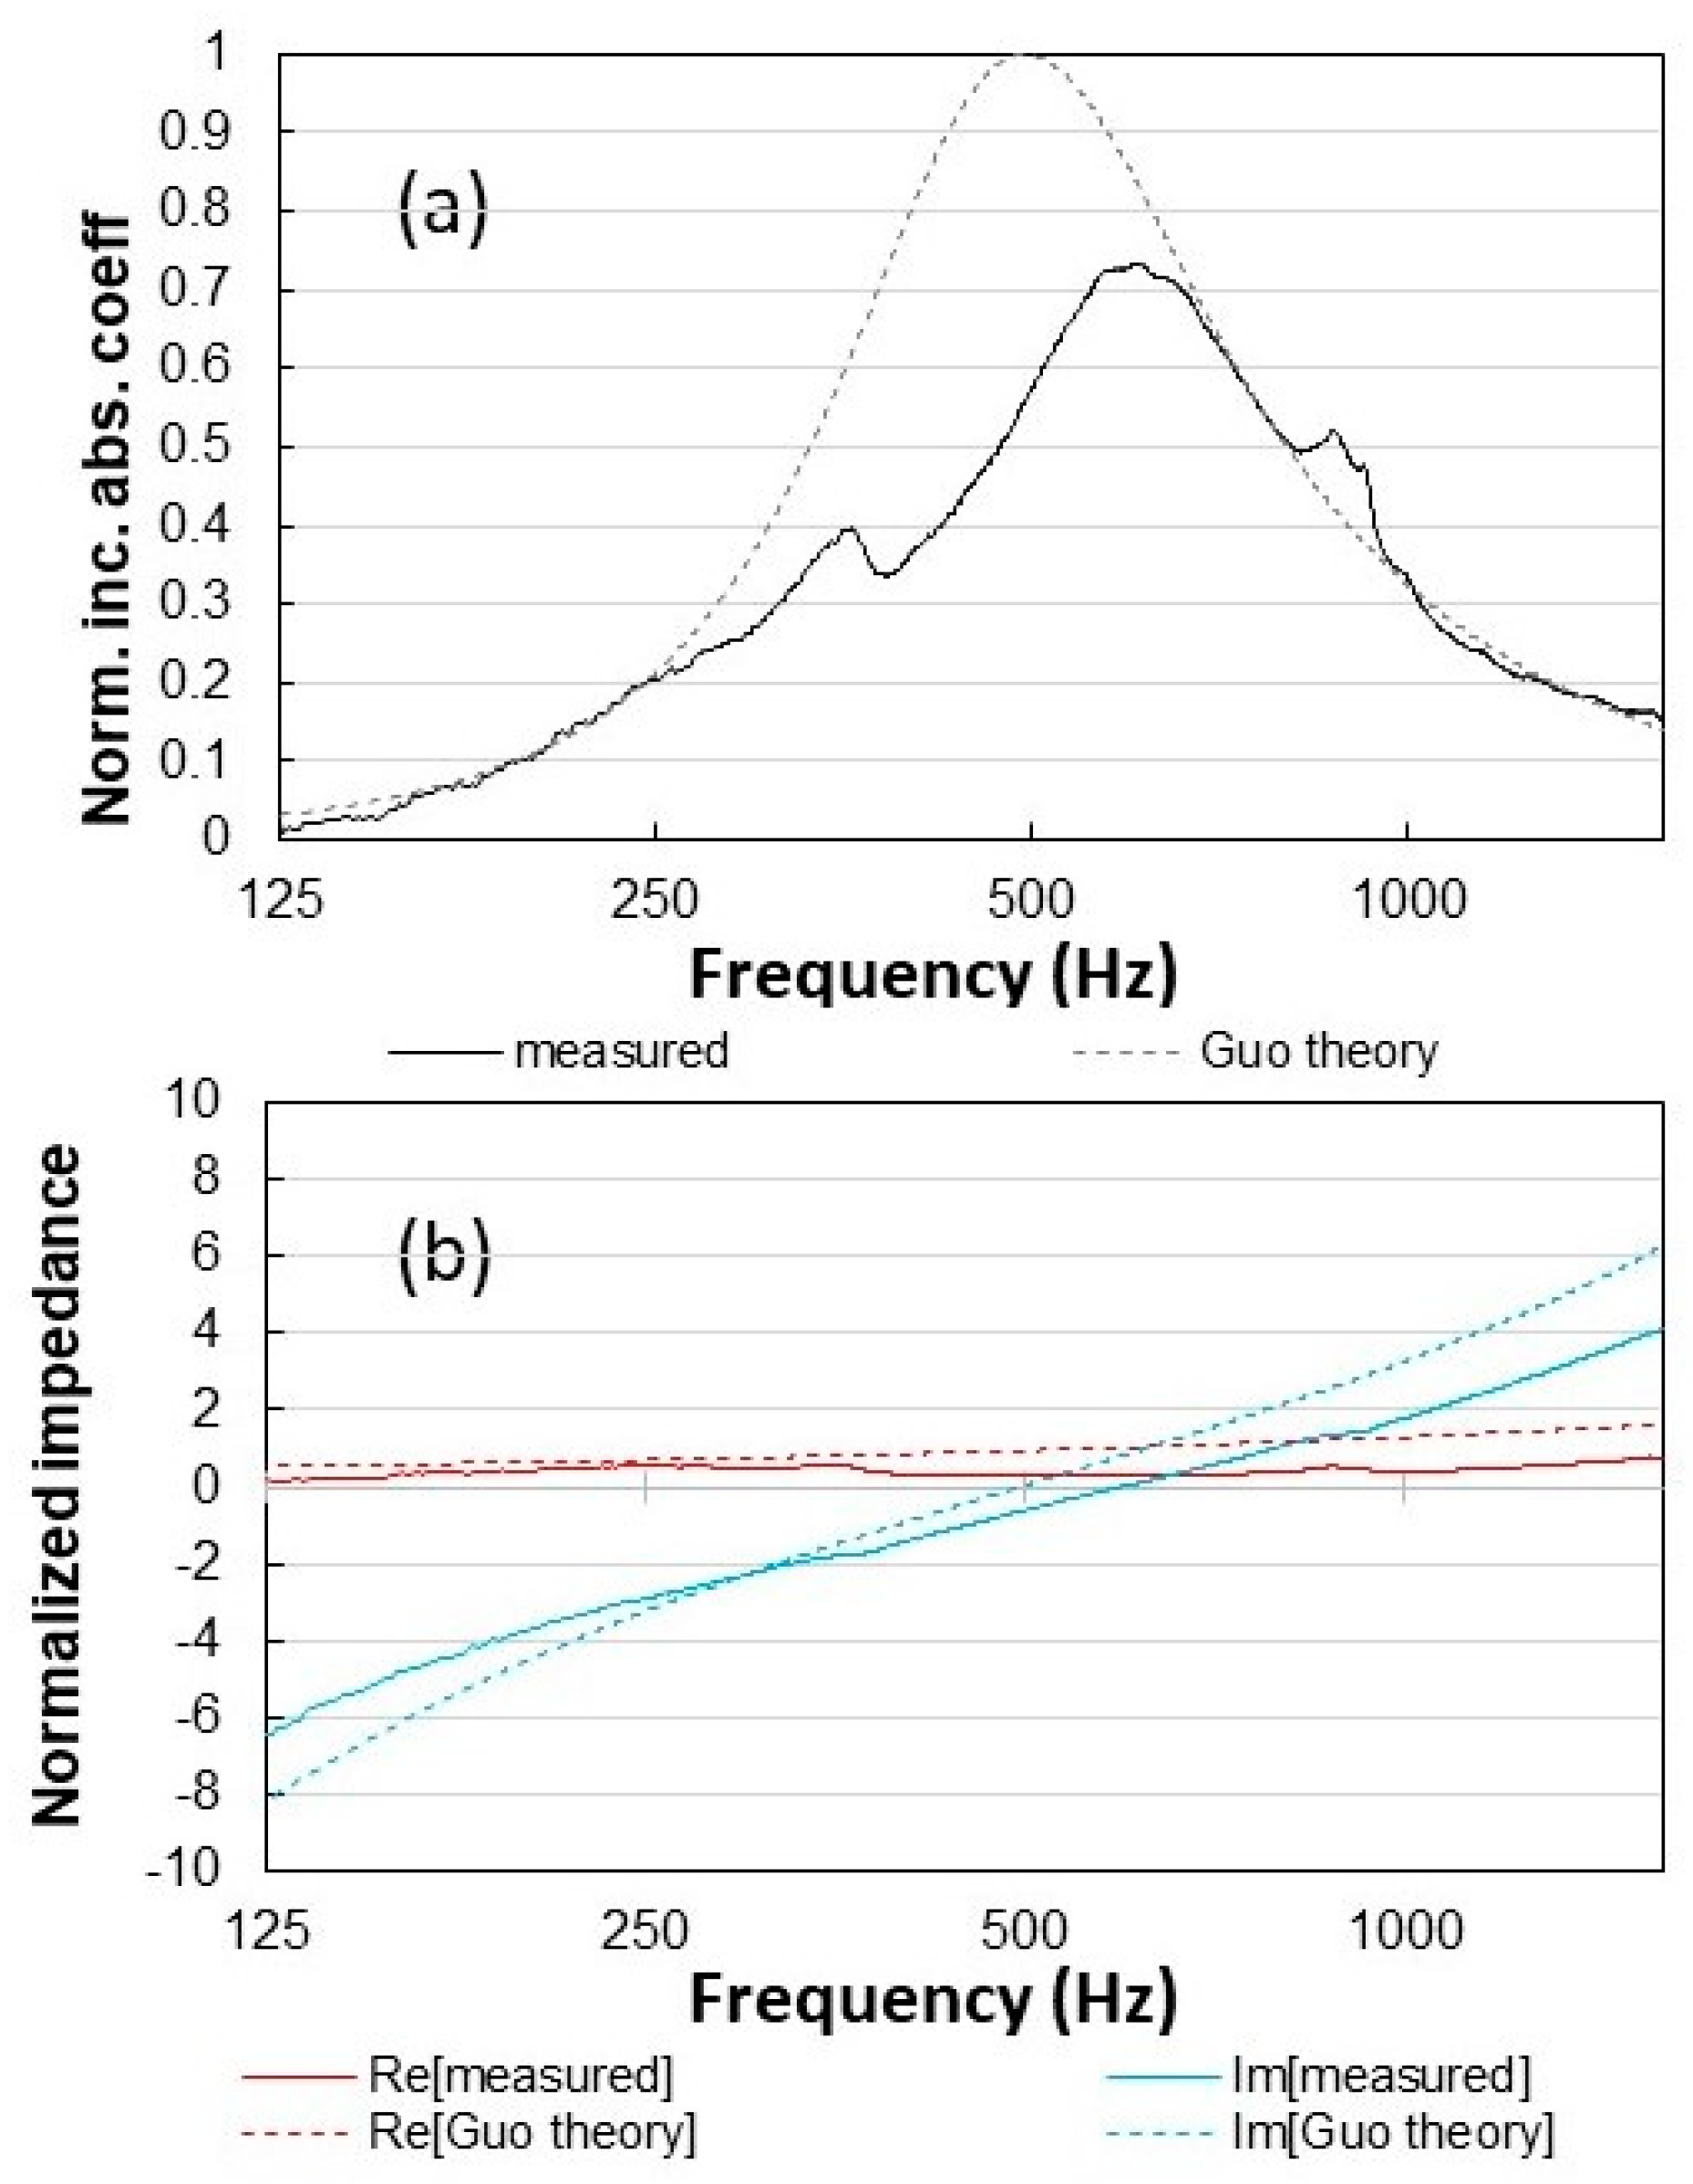
4.1. Specimen No. 1
4.2. Specimen No. 2
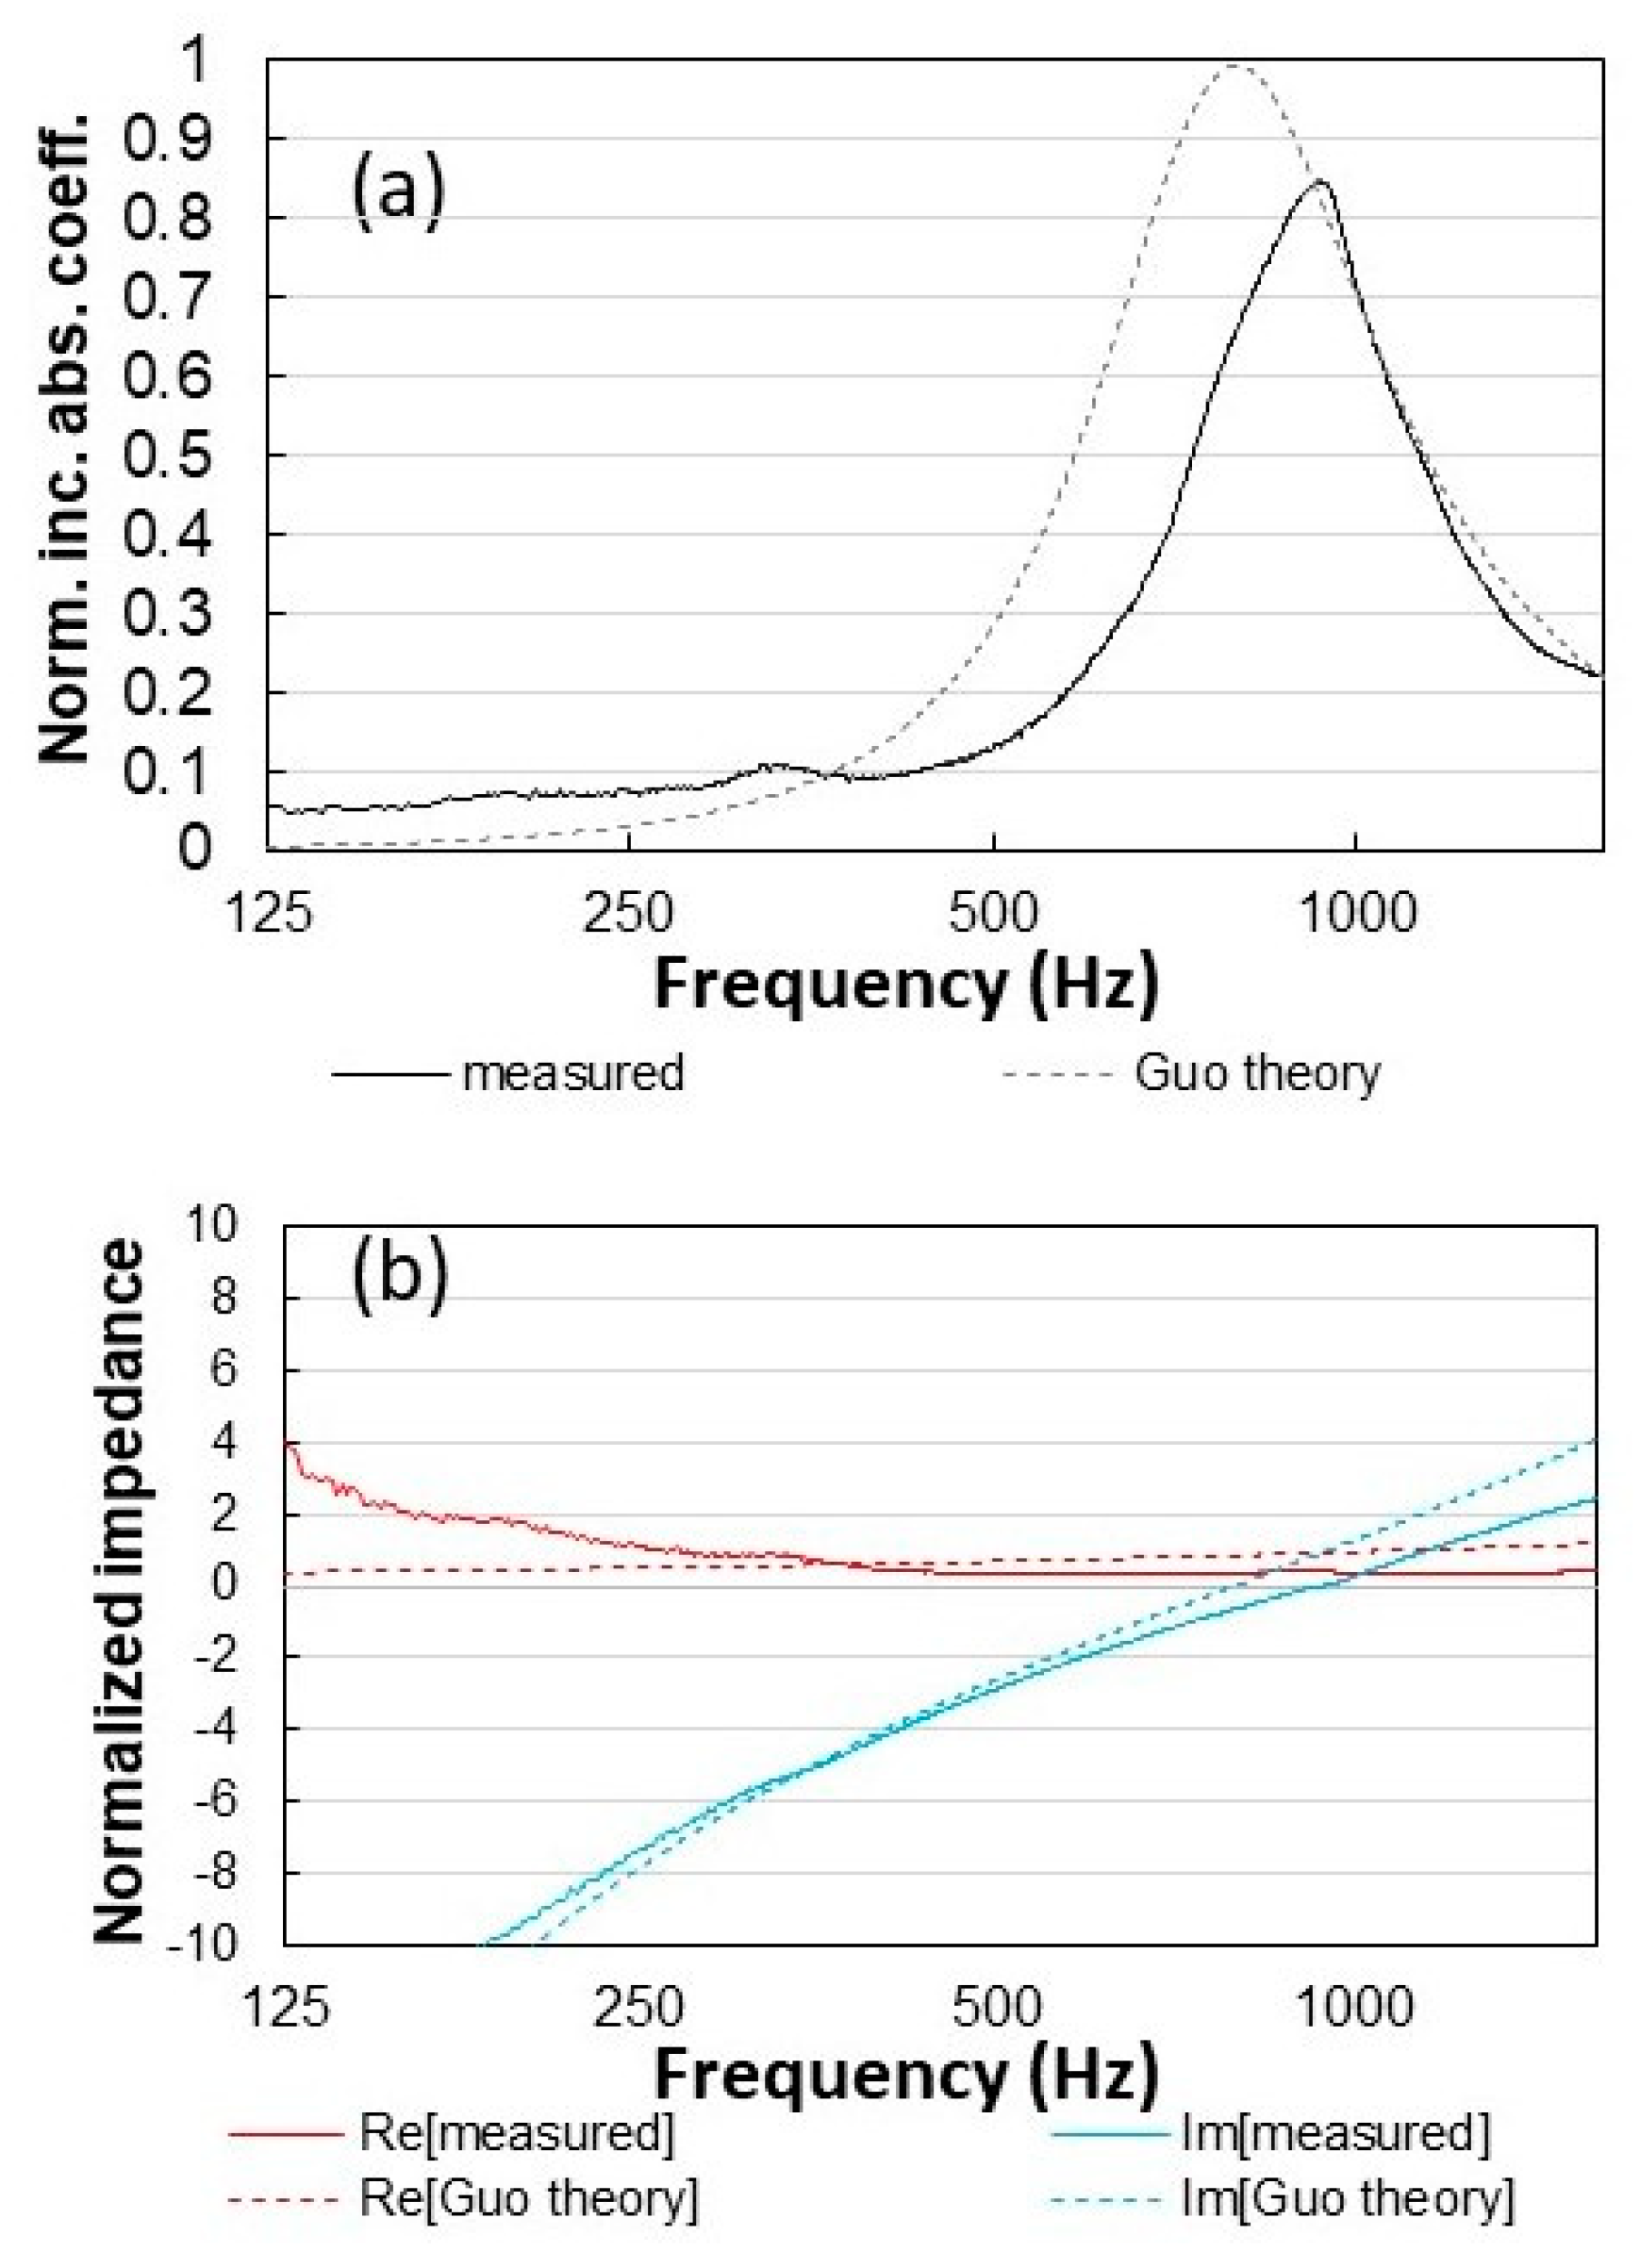
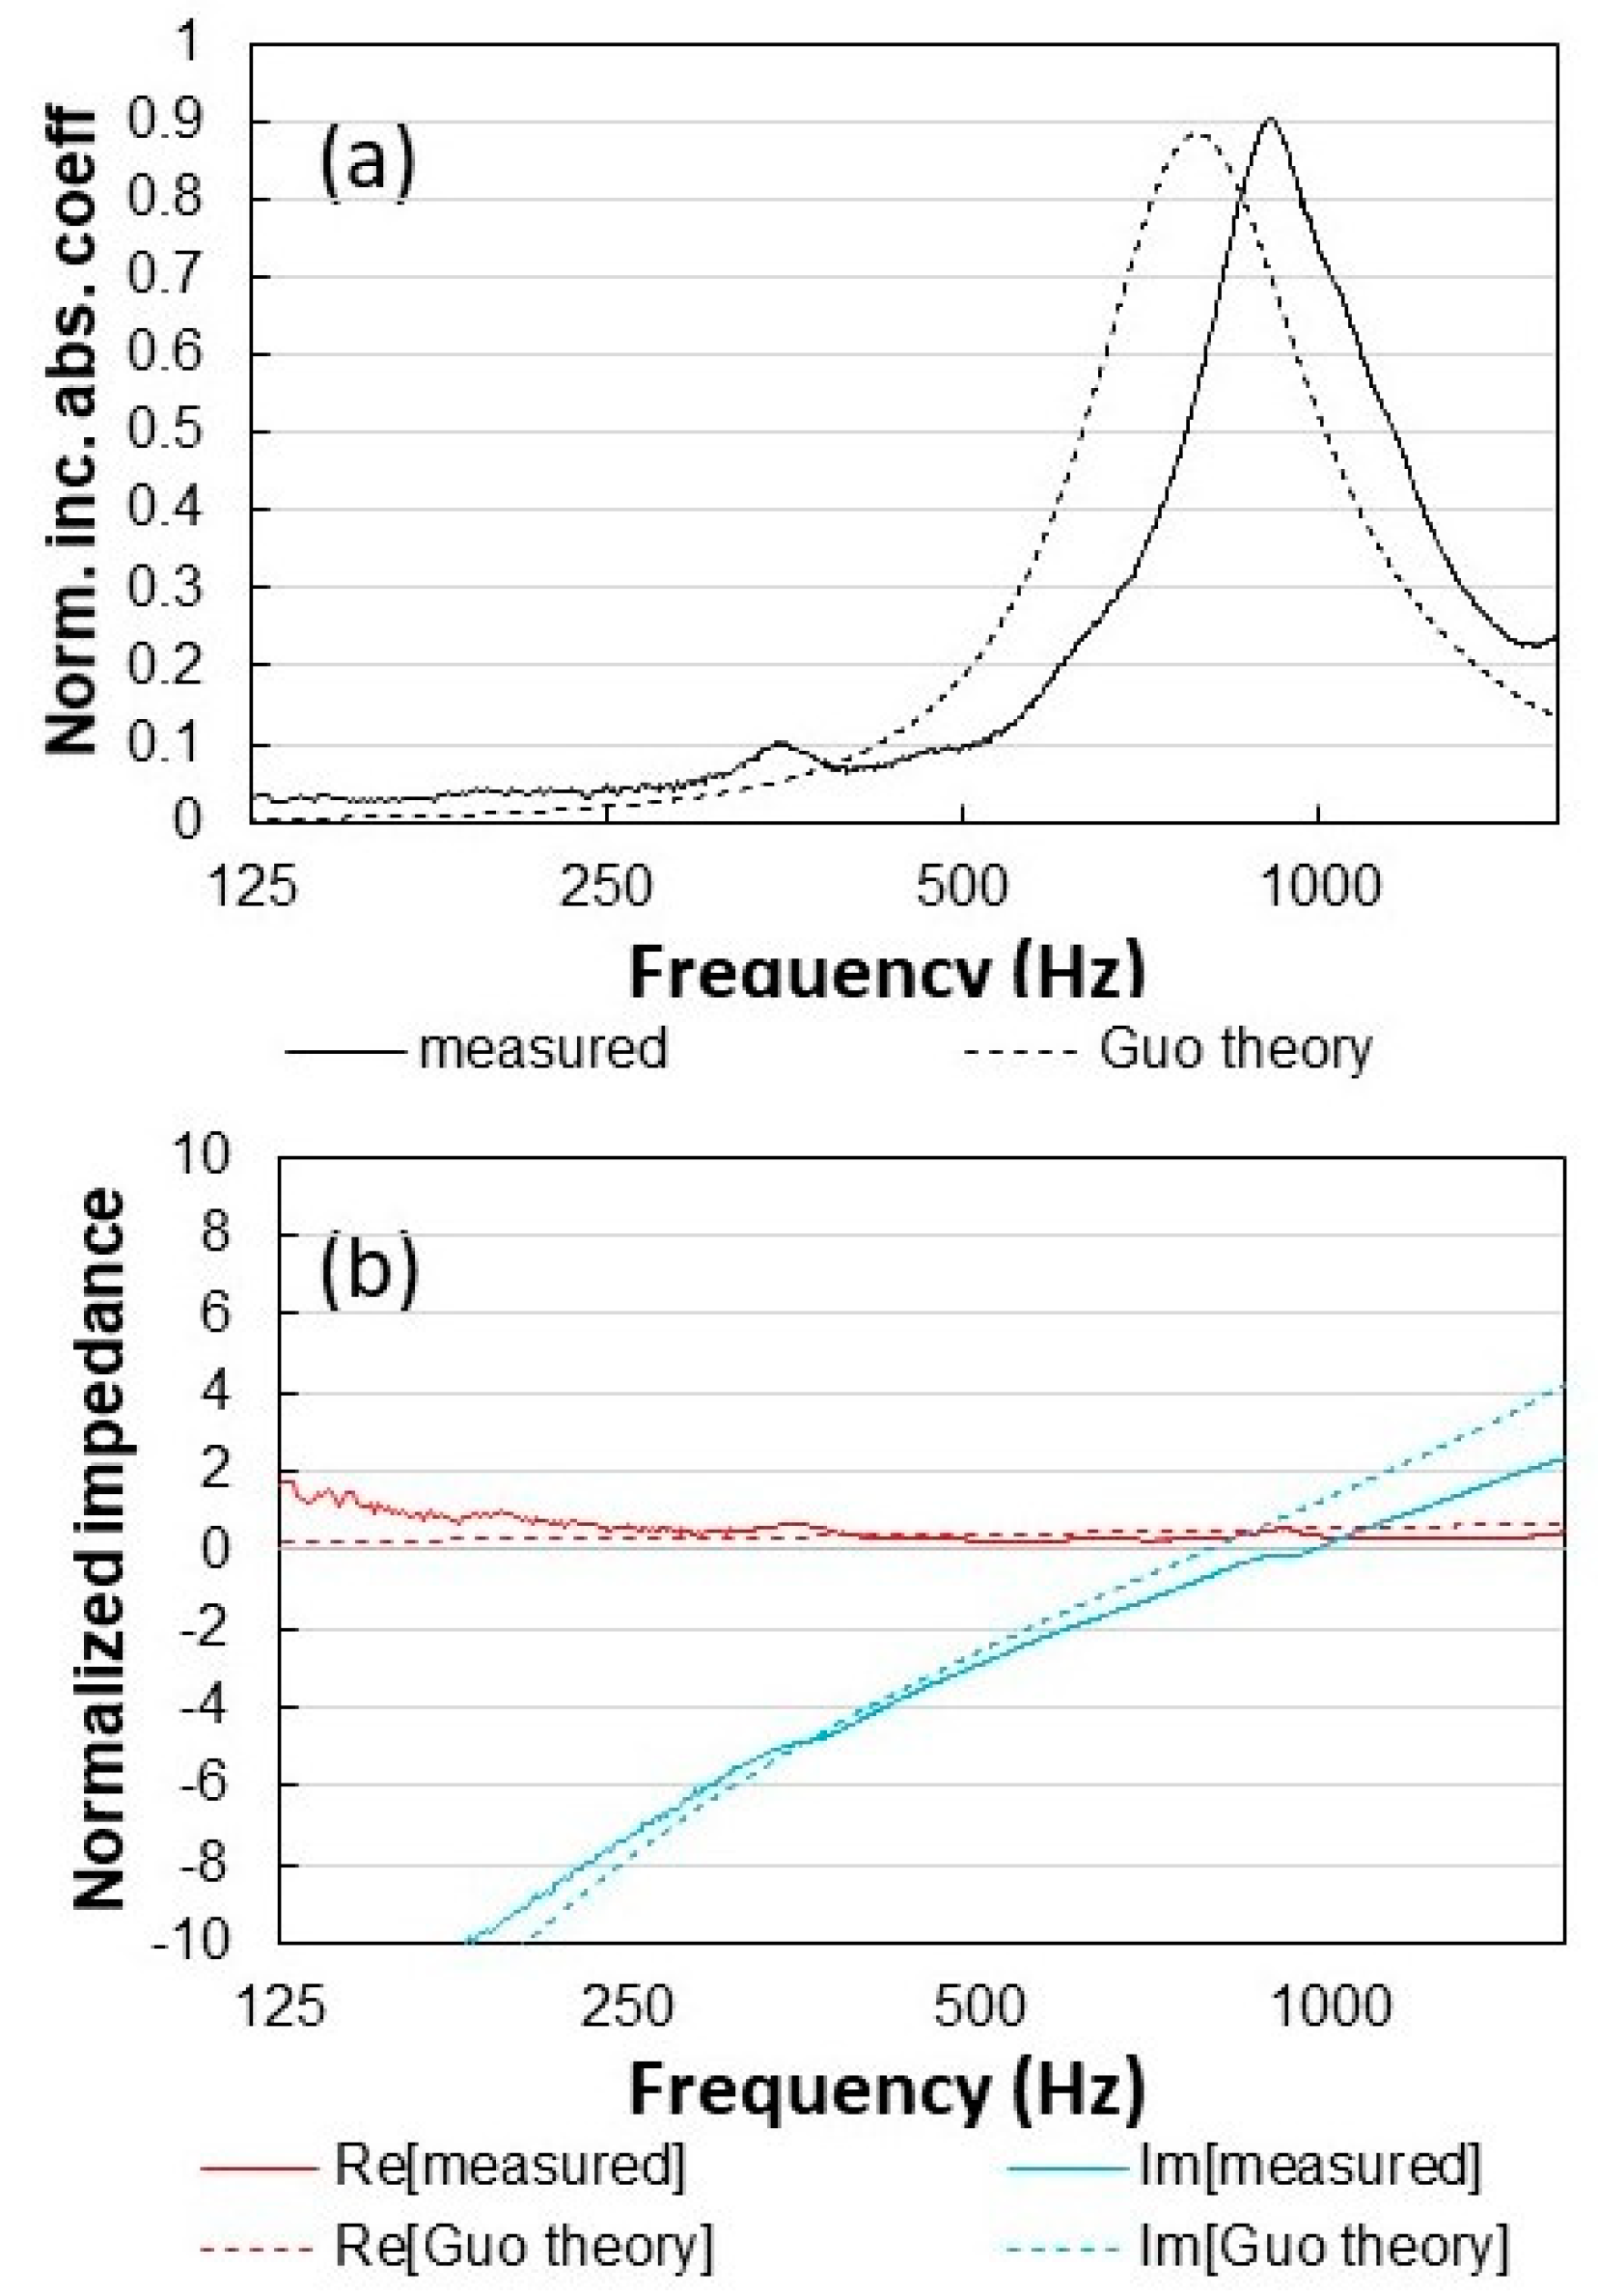
4.3. Specimen No. 3
5. Concluding Remarks
- In this study, two MPPs with square holes, and one with circular holes were produced and studied. In all cases, the sizes of the holes and the thickness showed deviations. The deviation was larger in the case of square hole MPPs than for circular hole MPPs, in the present study. However, in all cases, the absorption characteristics were similar to those of a typical MPP and showed reasonably high absorption performance. Therefore, it is possible in practice to use the MPPs manufactured by additive manufacturing 3D printers.
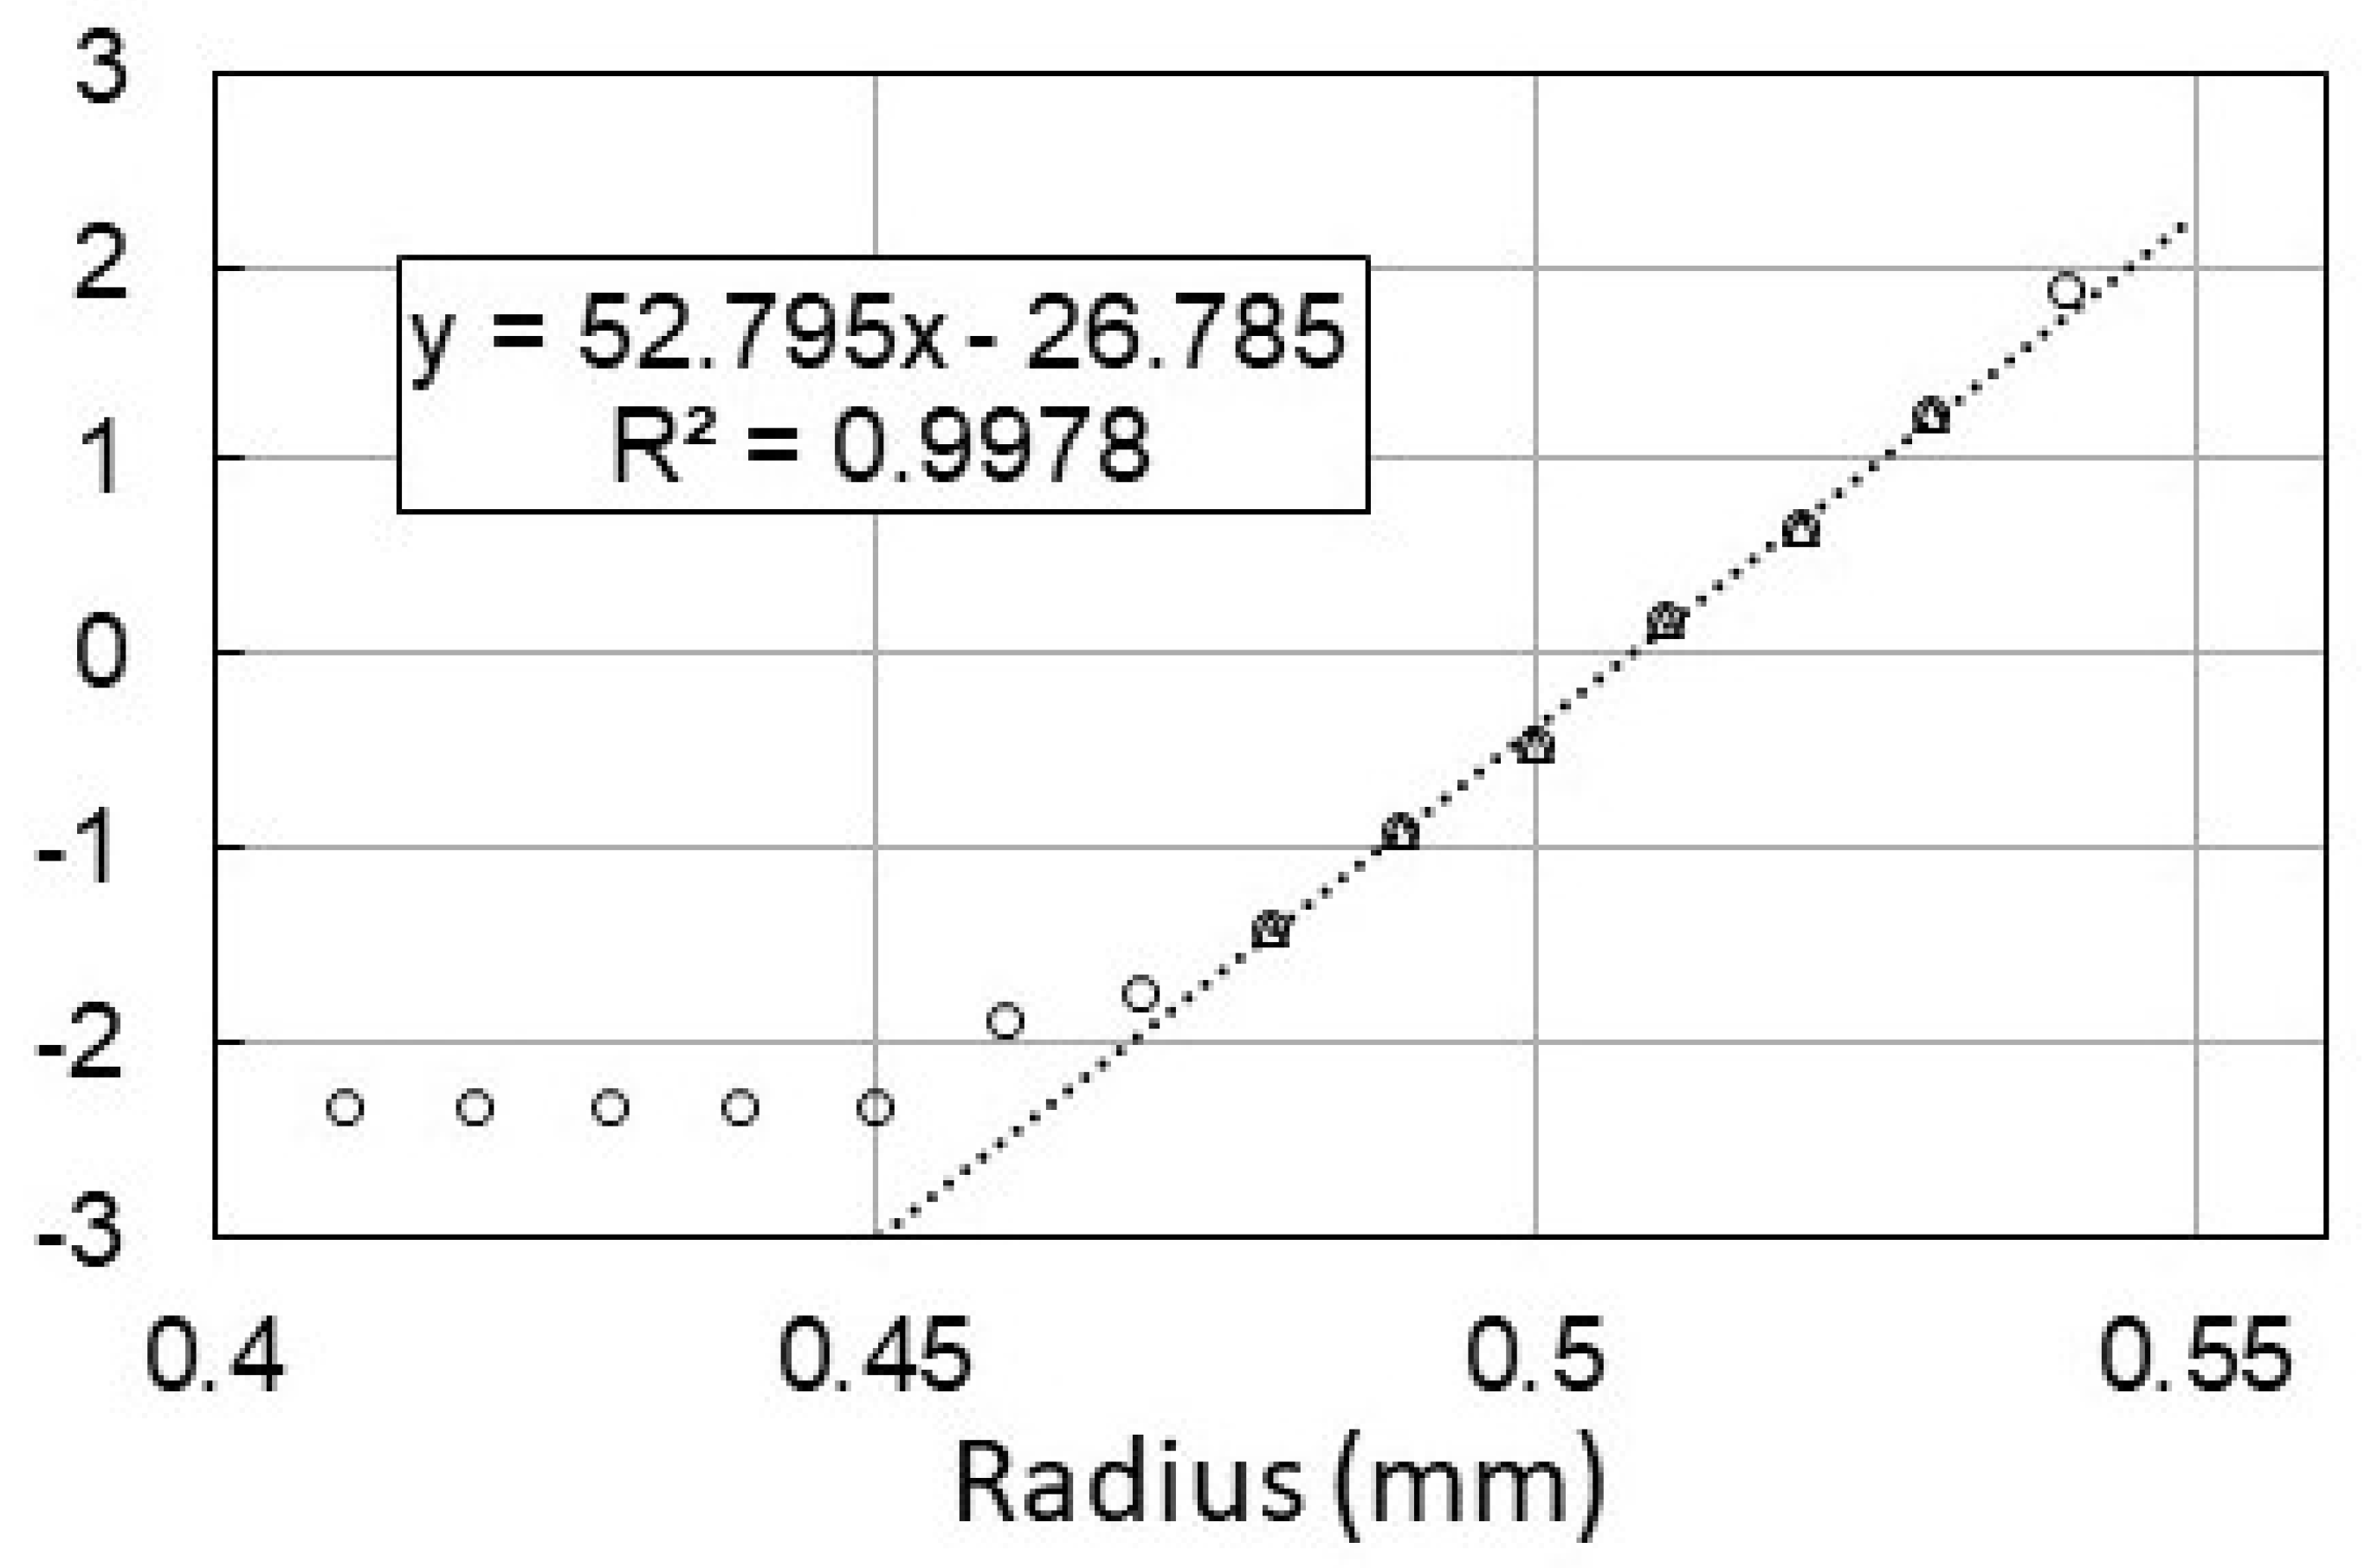
- Although the deviation of the parameters was smaller in the case of circular hole MPPs, the deviation of the parameters made theoretical predictions using averaged parameters difficult. This is because, in the theory, the surface is assumed to be homogeneous; however, in reality, with the deviation of the parameters, the surface is no longer homogeneous.
Author Contributions
Funding
Conflicts of Interest
References
- Maa, D.Y. Theory and design of microperforated panel sound absorbing constructions. Scientia Sinica 1975, 18, 55–71. [Google Scholar]
- Maa, D.Y. Microperforated-panel wideband absorber. Noise Contr. Eng. J. 1987, 29, 77–84. [Google Scholar] [CrossRef]
- Maa, D.Y. Potential of microperforated panel absorber. J. Acoust. Soc. Am. 1998, 104, 2861–2866. [Google Scholar] [CrossRef]
- Kang, J.; Fuchs, H.V. Predicting absorption of open weave textiles and micro-perforated membranes backed by an air space. J. Sound. Vib. 1999, 220, 905–920. [Google Scholar] [CrossRef]
- Fuchs, H.V.; Zha, X.; Drotleff, H.D. Creating low-noise environments in communication rooms. Appl. Acoust. 2001, 62, 1375–1396. [Google Scholar] [CrossRef]
- Zha, X.; Fuchs, H.V.; Drotleff, H.D. Improving the acoustic working conditions for musicians in small spaces. Appl. Acoust. 2002, 63, 203–221. [Google Scholar] [CrossRef]
- Adams, T. Sound Materials: A Compendium of Sound Absorbing Materials for Architecture and Design; Frame Pub.: New York, NY, USA, 2017. [Google Scholar]
- Herrin, D.; Liu, J.; Seybert, A. Properties and applications of microperforated panel. Sound Vib. 2011, 45, 6–9. [Google Scholar]
- Herrin, D. A guide to the applications of microperforated panel absorbers. Sound Vib. 2017, 51, 12–18. [Google Scholar]
- Sakagami, K. Some examples of usage of microperforated panel absorbers. Archit. Acoust. Noise Contr. 2019, 188, 1–7. (In Japanese) [Google Scholar]
- Liu, Z.; Zhan, J.; Fard, M.; Davy, J.L. Acoustic properties of multilayer sound absorbers with a 3D printed micro-perforated pane. Appl. Acoust. 2017, 121, 25–32. [Google Scholar] [CrossRef]
- Boulvert, J.; Costa-Baptista, J.; Cavalier, T.; Perna, M.; Fotsing, E.R.; Romero-Garcia, V.; Ross, A.; Mardjono, J.; Groby, J.-P. Acoustic modelling of micro-lattice obtained by additive manufacturing. Appl. Acoust. 2020, 164, 107244. [Google Scholar] [CrossRef] [Green Version]
- Carbajo, J.; Mosanenzadeh, S.G.; Kim, S.; Fang, N.X. Sound absorption of acoustic resonators with oblique perforations. Appl. Phys. Lett. 2020, 116, 054101. [Google Scholar] [CrossRef]
- Nakanishi, S. Sound Absorption of Helmholtz Resonator Included a Winding Built-in Neck Extension; INTER-NOISE and NOISE-CON Congress and Conference Proceedings: Hamburg, Germany, 2016. [Google Scholar]
- Pan, L.; Martellotta, F. A parametric study of the acoustic performance of resonant absorbers made of micro-perforated membranes and perforated panels. Appl. Sci. 2020, 10, 1581. [Google Scholar] [CrossRef] [Green Version]
- Guo, Y.; Allam, S.; Abom, M. Micro-perforated plates for vehicle applications. In Proceedings of the 2008 Congress and exposition of noise control engineering, Inter-Noise 2008, Shanghai, China, 26–29 October 2008. [Google Scholar]
- Bolton, J.S.; Kim, N. Use of CFD to calculate the dynamic resistive end correction for microperforated materials. Acoust. Aust. 2010, 38, 134–144. [Google Scholar]
- Herdtle, T.; Bolton, J.S.; Kim, N.; Alexander, J.H.; Gerdes, R.W. Transfer impedance of microperforated materials with tapered holes. J. Acoust. Soc. Am. 2013, 134, 4752–4762. [Google Scholar] [CrossRef] [PubMed]
- Okuzono, T.; Nitta, T.; Sakagami, K. Note on microperforated panel model using equivalent-fluid-based absorption elements. Acoust. Sci. Technol. 2019, 40, 221–224. [Google Scholar] [CrossRef] [Green Version]
- Cox, T.J.; D’Antonio, P. Acoustic Absorbers and Diffusers: Theory, Design and Application, 3rd ed.; CRC Press: New York, NY, USA, 2017; p. 243. [Google Scholar]


| Specimen | Hole Shape | Side Length (mm) | Radius (mm) | Thickness (mm) | Perforation Ratio (%) |
|---|---|---|---|---|---|
| No.1 | Square | 0.5 | - | 0.5 | 0.25 |
| No.2 | Square | 1.0 | - | 0.5 | 1.0 |
| No.3 | Circular | - | 0.5 | 0.5 | 0.785 |
| Specimen | Hole Shape | Side Length (mm) | Radius (mm) | Thickness (mm) | Perforation Ratio (%) |
|---|---|---|---|---|---|
| No.1 | Square | 0.767 | - | 0.608 | 0.587 |
| No.2 | Square | 0.883 | - | 0.644 | 0.781 |
| No.3 | Circular | - | 0.511 | 0.645 | 0.823 |
© 2020 by the authors. Licensee MDPI, Basel, Switzerland. This article is an open access article distributed under the terms and conditions of the Creative Commons Attribution (CC BY) license (http://creativecommons.org/licenses/by/4.0/).
Share and Cite
Sakagami, K.; Kusaka, M.; Okuzono, T.; Nakanishi, S. The Effect of Deviation Due to the Manufacturing Accuracy in the Parameters of an MPP on Its Acoustic Properties: Trial Production of MPPs of Different Hole Shapes Using 3D Printing. Acoustics 2020, 2, 605-616. https://doi.org/10.3390/acoustics2030032
Sakagami K, Kusaka M, Okuzono T, Nakanishi S. The Effect of Deviation Due to the Manufacturing Accuracy in the Parameters of an MPP on Its Acoustic Properties: Trial Production of MPPs of Different Hole Shapes Using 3D Printing. Acoustics. 2020; 2(3):605-616. https://doi.org/10.3390/acoustics2030032
Chicago/Turabian StyleSakagami, Kimihiro, Midori Kusaka, Takeshi Okuzono, and Shinsuke Nakanishi. 2020. "The Effect of Deviation Due to the Manufacturing Accuracy in the Parameters of an MPP on Its Acoustic Properties: Trial Production of MPPs of Different Hole Shapes Using 3D Printing" Acoustics 2, no. 3: 605-616. https://doi.org/10.3390/acoustics2030032