
Structure and Properties of Supercritical Water: Experimental and Theoretical Characterizations


1
Department of Chemistry, Graduate School of Science, Kyushu University, Fukuoka 819-0052, Japan
2
Faculty of Liberal Arts, National Institute of Technology (KOSEN), Kumamoto College, Kumamoto 861-1102, Japan
3
Department of Pharmaceutical Sciences, Himeji Dokkyo University, Himeji 670-8521, Japan
4
Toyota Physical and Chemical Research Institute, Nagakute 480-1192, Japan
5
Institute for Molecular Science, National Institute of Natural Sciences, Okazaki 444-8585, Japan
*
Authors to whom correspondence should be addressed.
J 2021, 4(4), 698-726; https://doi.org/10.3390/j4040049
Submission received: 1 October 2021
/
Revised: 25 October 2021
/
Accepted: 27 October 2021
/
Published: 2 November 2021
(This article belongs to the Special Issue Advance in Molecular Thermodynamics)
Abstract
:Water in the supercritical region of the phase diagram exhibits a markedly different structure and properties from that at ambient conditions, which is useful in controlling chemical reactions. Nonetheless, the experimental, as well as theoretical, characterization of the substance is not easy because the region is next to the critical point. This article reviews the experimental as well as theoretical studies on water in the supercritical region and its properties as a solvent for chemical reactions, as carried out by the authors and based on small-angle X-ray scattering and the statistical mechanics theory of molecular liquids, also known as reference interaction-site model (RISM) theory.
1. Introduction
One of the reasons that supercritical water (SCW) has attracted so much attention lies in its potential as a solvent in green chemistry [1]. Compared to ambient water (AW), the outstanding property of SCW is the high solubility of organic molecules, thus allowing the latter to be used as an alternative to organic solvents. Most solvents used in the chemical industry for material conversion in the past have been almost exclusively organic solvents. The reason was that most of the chemical compounds involved in the material conversion, both reactants and products, were organic compounds produced mainly from fossil fuels: coal and petroleum. The solvent used in the chemical process inevitably becomes a waste that is harmful to the environment. SCW is free from such a harmful effect on the environment because it is nothing but a thermodynamic state of water. SCW is quite effective as a solvent for organic synthesis because it dissolves organic compounds quite well. Furthermore, the product of the reaction may be separated easily from the solvent just by cooling it to ambient conditions because the solubility of organic compounds in AW is usually very low.
SCW also has significant potential in terms of its use in the energy production and conversion processes. In fact, SCW is used as a coolant for the light water reactor, known as a supercritical water reactor [2,3,4]. SCW does not show a “boiling” phenomenon because it continuously changes from a water-like state to a steam-like state, so there is no need to separate water and steam, which simplifies the plant system. And it shows higher thermal efficiency compared with current light water reactors.
There is further motivation to investigate SCW, which is related to the origin of life. Let us imagine an ancient time of the earth before life was born [5,6]. It may be reasonable to assume that there was an environment in the ocean that produced small organic molecules including amino acids and nucleotides from inorganic compounds such as water, carbon dioxide, ammonia, and formaldehyde. A candidate for such an environment is a submarine volcano that might have played the role of the reactor for the chemical reactions to produce biomolecules such as amino acids and nucleotides. The environment of a submarine volcano is considered to be ideal for chemical reactions. The water around the volcano would vary in temperature from nearly 0 °C to supercritical condition, depending on the distance from the crater. The water also contains many kinds of minerals from volcanoes including metal ions, which may serve as catalysts for chemical reactions. It is not very hard to imagine that all sorts of chemical reactions take place in such conditions, which may include reactions to produce biomolecules.
Despite the importance of SCW, it is not a trivial problem to characterize the state of water both in experimental and theoretical studies. Two reasons make the characterization of SCW so difficult. One of those is density fluctuations, which become increasingly larger as the thermodynamic state approaches the critical point. Of course, density fluctuation becomes a macroscopic scale at the critical point, and the compressibility diverges accordingly. The phenomenon is rephrased in the liquid-structural language as “the correlation length diverges in the thermodynamic limit.” Although the correlation length does not diverge in SCW, it still has an extremely long correlation length on a mesoscopic scale. The long correlation order prevents an ordinary characterization of the liquid structure based on wide-angle X-ray scattering and molecular simulations.
The other source that makes the characterization of SCW difficult is the electronic structure of water molecules in extreme conditions. Even in ambient conditions, water is not a pure liquid, but an equilibrium mixture of three species, H2O, H3O+, and OH−, that is, 2H2O = H3O+ + OH−, the equilibrium constant of which is KW = [H3O+][OH−]/[H2O]2. The equilibrium constant is determined in general by the thermodynamic conditions and the electronic structure of the species. In SCW, the thermodynamic state, namely temperature, density, and pressure, has a significant effect on the electronic structure. Therefore, KW in the supercritical region suffers from the combined effect of thermodynamic conditions and the electronic structure. The analysis of such a combined effect is a nontrivial problem, especially theoretically, because the conventional theory of electronic structure, or quantum chemistry, has long been practiced for isolated molecules, which disregards the thermodynamic state.
In the present article, we review the experimental and theoretical work carried out by two research groups in Japan. In the following section, the experimental characterization of the SCW region of the phase diagram, carried out by Nishikawa’s group, is reviewed. The theoretical characterization of SCW, performed by Hirata’s group based on the reference interaction site-model (RISM)–Kovalenko-Hirata (KH) theory, is reviewed in Section 3. Section 4 and Section 5 are devoted to the combined quantum and thermodynamic effects in SCW, clarified using the RISM–SCF theory. In Section 6, we review our work on the Diels–Alder reaction in SCW as an example of green chemistry.
This article focuses mainly on density fluctuation and isothermal compressibility as physical quantities that characterize the anomaly of SCW. The above two quantities are related to the second derivative of Gibbs free energy with respect to pressure. It is noted that the specific heat is also the second derivative of the Gibbs energy by temperature [7], and has the anomalies as shown in some studies [8]. In the above-mentioned SCW reactor, this anomaly in the specific heat is exploited and is the reason for the high efficiency.
2. Experimental Studies on Density Fluctuation and Correlation Length of SCW
Supercritical fluids are characterized by an inhomogeneous distribution of molecules, and it is not too much to say that the inhomogeneity determines almost all intrinsic properties of supercritical fluids [9,10,11]. Inhomogeneity can be described in various terms depending on the experimental methods and the scale of observation, such as local density enhancement [9,11], formation of clusters of various sizes, and large fluctuations [12,13,14,15]. Among several experimental methods to perceive the inhomogeneity directly, small-angle scattering experiments are the most useful. This is because the results give us quantitative information on the inhomogeneity as a density fluctuation and the correlation length [12,13]. The former describes the variation in the number of molecules in the volume of interest, whereas the latter gives the size of molecular aggregation [7].
Nishikawa experienced the limits of the radial distribution function (RDF) obtained from wide-angle X-ray scattering experiments when it was applied to the discussion on the structure of supercritical fluids [16]. This is because the structural fluctuation ranges up to mesoscopic scale, whereas the radial distribution shows the values averaged in a microscopic scale. It is considered that “describing the drastic disorder of molecular distribution as it is” is essential for the structural investigation of supercritical fluids. Then, direct structural information of supercritical fluids started to be obtained from the viewpoint of fluctuations, which is obtained by small-angle X-ray scattering (SAXS) experiments. The first and second samples were supercritical carbon dioxide (CO2) [17,18] and trifluoromethane (CF3H) [19], respectively. From the investigation of the two samples, the following facts were found [12,13,17,18,19].
- (1)
- The density fluctuation forms a ridge when the contour map of their values is drawn on the ρ–T phase diagram (ρ: density, T: absolute temperature). The ridge is the locus formed by the points at which the values of density fluctuation are their maximum in an isothermal change. The ridge does not coincide with but slightly deviates from the critical isodensity line.
- (2)
- The ridge corresponds to a trajectory of the maximum or minimum values of various physical quantities associated with the second derivative of Gibbs free energy, such as response functions of isothermal compressibility, heat capacity, and isobaric thermal expansion.
- (3)
- When the isothermal curves of density fluctuations and the ridges of supercritical CO2 and CF3H are drawn in the reduced variables such as , , and , they coincide with each other. This suggests the generality principle of the density fluctuation and ridge.
- (4)
- The same statements (1)–(3) apply to the correlation length.
Therefore, SCW was chosen as the third sample in the investigation of substance dependence in density fluctuations and the correlation length [20]. Because water is unique even at room temperature and pressure, it is interesting to compare water with other substances in supercritical states.
2.1. Experiment
The concepts of fluctuation and correlation length are useful in considering disordered systems. We will briefly explain the experimental method to obtain them.
An instantaneous variation of the number of molecules is described by
where N and <N> are the number of molecules in a volume V of interest and its average value, respectively. The value of is an extensive quantity. Dividing it by <N>, we obtain the density fluctuation as an intensive quantity, which can quantitatively describe the inhomogeneity of the molecular distribution in the system. The density fluctuation is related to the zero-angle X-ray scattering intensity per molecule as [7]
where Z is the number of electrons in the molecule. The density fluctuation is thermodynamically related to the value of as [7]
where is the Boltzmann constant and is the isothermal compressibility given by
According to the Ornstein–Zernike theory, the small-angle scattering intensity of a sample, I(s), near the critical point is represented by [7]
where I(0) is the scattering intensity at and is the Ornstein–Zernike correlation length. Here, s is the absolute value of the scattering vector given by
where 2 is the scattering angle and is the X-ray wavelength. If the statement in Equation (5) is valid, the Ornstein–Zernike plot of 1/I(s) versus s2 will be a straight line. We obtain the correlation length from the slope and the I(0) value from the intercept of the plot.
Compared with small-angle scattering experiments for other purposes, the most important aspect of an experiment to determine fluctuations is that the scattering intensity data of the sample must be obtained on an absolute scale, down to the smallest possible s-value, without parasitic scattering. Therefore, it is essential to obtain the scattering intensity of the sample by separating it from the hem of the very strong incident X-rays. In terms of X-ray sources, the use of synchrotron radiation (SR) is desirable. This is because the scattering intensity from the sample in the supercritical state drastically and sensitively changes depending on the thermodynamic state, so it is necessary to measure the scattering intensity in a short accumulation time using a strong X-ray source. That the SR is extremely focused is also an intrinsic merit. Details of the SAXS measurement to obtain fluctuations and the correlation length were described in other papers [21].
SAXS measurements of SCW were performed using an instrument installed at the BL-15A station of the Photon Factory at the High Energy Accelerator Research Organization in Tsukuba, Japan [22]. The incident X-ray beam was monochromatized to λ = 1.50 Å and focused to 1.0 × 1.0 mm2 using a bent Si monochromator and a bent mirror. The scattered intensity (I) was detected with a position-sensitive proportional counter. The camera length was set to 2000 mm. In this case, the observable s-region was 0.015–0.18 Å−1.
Because of the stringent experimental conditions of SCW, special care had to be taken for the sample cell. The critical temperature, Tc, of water is 647.1 K and the critical pressure, Pc, is 22.06 MPa. Moreover, SCW is highly chemically active and corrodes even stainless steel. Therefore, Nishikawa’s group fabricated a sample cell specifically for SCW to set the sample to the exact conditions of temperature and pressure [23]. All parts of the sample holder are made of titanium, which is resistant to SCW. The sample cell was equipped with two diamond windows with a thickness of 0.7 mm and a diameter of 4.5 mm. Gold gaskets and gold spacers were introduced to seal the windows. The values of the thermal expansion coefficients of the materials used were important because of the necessity to vary the temperature over a wide range. The designed and fabricated sample cell was able to withstand temperatures up to 720 K and pressures up to 40 MPa. Other details can be found in the original paper [20].
The accumulation time of each run was 300 s. The temperature of the sample was controlled using a proportional–integral–derivative controller connected to a flexible main heater and an auxiliary cartridge heater, and measured using a thermocouple with a cover of Inconel 600 that could withstand SCW. The thermocouple was immersed in the fluid and its top was placed very close to the diamond window to measure the temperature of the X-ray irradiated area. A high-pressure liquid chromatography pump was used to pressurize the sample, and the value was measured with a strain gauge. The sample cell was enclosed in a copper block to keep the temperature of the entire holder constant. The copper block and the sample holder were encased in a thermal insulator. During the measurement, the temperature and pressure changes were constant within ±0.2 K and ±0.02 MPa, respectively.
2.2. Results and Discussion
2.2.1. Density Fluctuations
The first experimental results on the fluctuation of SCW were reported in 2000 [20], and subsequent studies [24] were more accurate due to improvements such as a more stable setting of the sample in harsh conditions [25] and more accurate experimental values of the absorption coefficient of the sample. Although the two results were qualitatively consistent, there was a slight difference in that the latter value of density fluctuations was slightly larger than the former, especially near the critical point. Therefore, in this review, we present the values from the latter report [24] as our experimental values. In our experiments, the measurable variables were temperature and pressure, from which we evaluated the density using the equation of the state of water developed by Wagner et al. [26]
In Figure 1, the isothermal changes of density fluctuation of SCW are shown as a function of with dots for Tr = 1.02, 1.04, and 1.06. Here, and Tr are the reduced density and temperature, normalized by the corresponding critical values and Tc, respectively. As expressed in Equation (3), the density fluctuations can also be calculated using the value of evaluated from the equation of state, and the result is represented by the solid line in Figure 1. The values obtained from the scattering experiment [24] and the values calculated from the equation of state [26] agree well within the experimental error and the inaccuracy of the equation of state. This may be interesting because of the different observation scales of the two methods. In the case of the equation of state, the based value is a macroscopic thermodynamic quantity. On the other hand, the observation scale for the scattering experiment is considered to be the coherent length of the X-rays used, which is considered to be mesoscopic. The good agreement of the results indicates that for SCW fluctuations, the information from the mesoscopic scale perspective is the same as that from the macroscopic scale perspective.
It is seen from Figure 1 that the isotherms of density fluctuation grow larger as the density and temperature approach and Tc, respectively, and that the density of the maximum of the isotherm shifts from and the deviation is remarkable as the temperature moves away from Tc. To demonstrate the abovementioned situation more clearly, the density fluctuation map of SCW as functions of density and temperature is shown in Figure 2, whose values are calculated from the equation of state [26]. The green curves are the isotherms of density fluctuation at Tr = 1.02, 1.04, and 1.06. As shown in Figure 2, the density fluctuation forms a ridge in the map. Later, the ridge was named the “Nishikawa line” or “Nishikawa-Widom line” [27,28,29]. This line connects smoothly with the rectilinear line in the phase diagram and with the extension of the gas–liquid coexistence curve in the phase diagram [20] in the same manner as the results for CO2 [17,18] and CF3H [19]. The Nishikawa line described by red deviates gradually from the critical isodensity line (blue line) on changing from the critical temperature. Such an observation is algebraically confirmed to be true by the calculation of the quasi-quantitative expression of the van der Waals equation [14].
The first experiment, which observed that the lines connecting the extreme values of physical quantities in the supercritical state deviate from the critical isodensity line, was the measurement of the speed of sound in Ar [30]. In terms of density fluctuations and correlation lengths of supercritical CO2 and CF3H [12,13,19], Nishikawa’s group found similar deviations, which led to a discussion on the extension of the gas–liquid coexistence curve. Similarly, in the SCW study, it was found that the sequence of extremes deviated from the critical isodensity line. As pointed out by Nishikawa et al. [12,13], the inhomogeneity of the solvent in the supercritical state is closely related to physicochemical properties such as reactivity and solubility, and it is in the most inhomogeneous (i.e., large density fluctuation) region that the most anomalous behaviors and solvent activation are observed. In other words, the area near the ridge of the density fluctuation is the most active when using SCW as a solvent.
2.2.2. Correlation Lengths
Near the critical point, the correlation length, , is related to the pair correlation function, , as expressed by the following equation [7]:
Equation (7) shows that the slope of the pair correlation function decreases exponentially near the critical point, and the parameter for the decrease is the correlation length. This indicates that the structure of supercritical fluids cannot be explained by the assumption of the existence of clusters of constant size. The correlation length, however, gives us information about the inhomogeneity from the viewpoint of length.
The correlation length can be obtained experimentally from SAXS measurements using the relation of Equation (5). As described above, SAXS experiments for SCW were performed twice [20,24]. Although the experimental conditions and the results for the density fluctuation of the latter [24] were better, the obtained values for correlation length were almost the same. As for the correlation length, the results of the former experiments [20] are shown as a function of density in Figure 3 because results with many more measuring points were reported. As shown in Figure 3, it can be seen that the correlation length increases on approaching and Tc. In addition, the maxima of the correlation length exists with a shift to a density region lower than the critical density, and this shift increases with separation from the critical temperature. This behavior is the same as that of density fluctuation.
2.2.3. Substance Dependences of Density Fluctuation and Correlation Length
As described at the beginning of this section, the behaviors of density fluctuation and correlation length of CO2 and CF3H show universality for the density and temperature normalized by and Tc. Therefore, it may be interesting to compare them for substances with different molecular interactions.
Figure 4 shows the density fluctuation of water with those of CO2 [17,18], CF3H [19], C2H4 [31], and C6H6 [32] at Tr = 1.02, 1.04, and 1.06. The values of the density fluctuation of water are significantly larger than the results of the other substances, which do not have hydrogen bonds. Among the latter group, the Tr = 1.02 data for C2H4 had experimental errors due to the difficulty in maintaining a stable thermodynamic state when approaching the critical point [31]. For the data of CO2 included in the group of Tr = 1.02, its exact temperature was Tr = 1.022. Therefore, the density fluctuation is slightly smaller than the others. Considering such circumstances, it is possible to conclude that the universality in the behavior of density fluctuation holds for nonhydrogen-bonding substances and water is significantly out of line with universality.
Next, substance dependence of the correlation length is considered. The correlation lengths of the aforementioned substances reflect individual molecular size [32]. Therefore, we normalized the correlation length by the respective molecular size and obtained the results shown in Figure 5. Here, we adopted the size parameter of the Lennard-Jones (LJ) potential [33] as the molecular size. Comparing Figure 4 and Figure 5, the density fluctuation and normalized correlation length show similar trends in substance dependences, and they are closely related. It was found that the molecular size makes a significant contribution to the correlation length, and to discuss universality, it is necessary to normalize the correlation length by the individual molecular size.
For nonhydrogen-bonded substances, the behavior of structural fluctuation is consistent even though the types of intermolecular forces, such as quadrupole moments, dipole moments, and π electrons, differ. Thus, in nonhydrogen-bonded substances, the universality of the structural fluctuation is ensured, which means that the specificity of the substance disappears using reduced variables normalized by the critical constants. On the other hand, the structural fluctuation of SCW shows a different behavior originating from hydrogen bonding. Hydrogen bonds are very directional, and their interactions reach farther than nonhydrogen bonds. As a result, the molecular aggregates of water are more bulky than other substances due to the orientation of the interactions, allowing more molecules to participate in the aggregate. The intermolecular interactions of hydrogen bonds are so specific that they cancel out even the universality of structural fluctuations.
2.3. Summary
The structural fluctuation of SCW was investigated using SAXS experiments. The results are summarized as follows: (1) The behavior of density fluctuations in water differs from that of substances without hydrogen bonds. (2) For most substances, the correlation length normalized with molecular size can be regarded as a universal quantity. However, water is the exception.
3. Theoretical Characterization of the SCW Region in Terms of the Concept of “Ridge” in the Phase Diagram
Density fluctuation is one of the distinguishing features of supercritical fluids compared with normal states such as liquid and vapor. The fluctuations become increasingly larger as the critical point is approached, and eventually diverge at the critical point. This indicates that the fluctuations are spreading to the macroscopic region [7].
Two interesting papers have been published independently and almost simultaneously that characterized density fluctuations in supercritical fluids. One is the experiment reviewed in the previous section, and the other is a statistical mechanical study [17,18,34,35,36,37]. Using SAXS, Nishikawa et al. found that when the density fluctuation of CO2 is plotted against density, it shows a finite (nondivergent) maximum along the critical isochore, which they later called a “ridge” [17]. Chialvo and Cummings observed a similar phenomenon theoretically in their analysis of the Kirkwood–Buff integrals for the supercritical region of fluids [34].
Following them, Gray et al. and Narikiyo reported that the ridge appears on the lower-density side of the critical isochore [35,37]. The same shift of density fluctuations of supercritical liquids is also observed experimentally [12,17,18,20,36].
To investigate the detailed molecular picture of the liquid structure on either side of the ridge, Matsugami et al. have applied the statistical mechanics of molecular liquids, called the RISM–KH theory [38]. In this section, we briefly review their theoretical study to identify the “ridge” of water and to clarify the microscopic structure of the fluids in both regions that are separated by the line.
3.1. Theoretical Framework of Density Fluctuation
The number-density fluctuation of liquids, usually simply called “density fluctuation,” is proportional to the isothermal compressibility, , which is given by [39,40]
where denotes the number of molecules in an arbitrary volume , is the Boltzmann constant, and is absolute temperature. means the ensemble average under the grand canonical ensemble.
can be evaluated by differentiation of the density with respect to the pressure at constant temperature:
The pressure is determined by [41]
where all these correlation functions are evaluated using the RISM–KH theory. The RISM–KH theory is a statistical mechanics theory of molecular liquids that describes the structure and properties of molecular liquids without statistical errors [40]. The RISM–KH theory consists of the following two equations, namely
where . The elements of the matrices of , , and are , , and , respectively. in Equation (11) denotes the convolution integral. and are the inverse temperature and two-body interaction potential between interaction sites and . Here, the density fluctuation of water was investigated using the RISM–KH theory for densities ranging from 0.0001 to 1.0 g cm−3 and for temperatures from 565 to 760 K. In this study, we employed an SPC/E water model with modified hydrogen parameter.
3.2. Temperature and Density Dependence of Density Fluctuation
The pressure isotherms for water against the molar volume for different temperatures are plotted in Figure 6. The temperature range plotted (565 to 660 K) was chosen to be close to the critical point. From the figure, one can determine the critical point as the density g cm−3 and the temperature K, which is in qualitative agreement with the experimental observation.
In Figure 7, the density fluctuation of water is plotted as a function of the density and temperature. One can see a maximum at the critical point, at the density of 0.127 g cm−3 and the temperature of 644 K, corresponding to Figure 6. The red line connecting the maximum points in the figure corresponds to the “ridge” proposed by Nishikawa et al. introduced in the previous section [17].
3.3. Fluid Structure around the Ridge
Because the density fluctuation takes its maximum value along the ridge, there are states of different densities on both sides of the ridge with the same density fluctuation and temperature. As discussed in the previous section, Nishikawa et al. argued that these points have a liquid-like structure on the high-density side and a gas-like structure on the low-density side. To elucidate this argument at the molecular level, the RDFs have been considered.
Figure 8a shows the RDFs for several densities at 644 K. Here, the distributions at different densities for the same density fluctuation were compared. From this figure, it can be seen that different liquid structures are observed for the same density fluctuation.
For a closer look, the short- and long-range parts for and (both density fluctuations are 3) are shown in Figure 8b,c, respectively. The RDF of O–O shows a clear first minimum after the first peak on the high-density side, whereas the first peak decays almost monotonically on the low-density side. This indicates the characteristics of the distribution functions of liquid and gas, respectively. An RDF of O–H shows the strength of hydrogen bonding. The peak is stronger on the low-density side. At low densities, the two-body interaction is dominant, resulting in a prominent first peak, whereas at higher densities, the first peak is lower due to the screening effect by the many-body interaction. These features were observed in NMR experiments by Matubayasi and Nakahara [42].
The fluid structures on the ridge are also considered to see their critical behavior. Figure 9 shows how the fluid structure changes as it approaches the critical point on the ridge. The RDFs clearly show that the tail of the RDF becomes longer as the fluid state approaches the critical point and the correlations become increasingly longer.
3.4. Summary
In this section, a theoretical study based on the RISM–KH theory for the analysis of the density fluctuation of water was reviewed. The “ridge” proposed by Nishikawa et al. was reproduced using the RISM–KH theory and the structural features of liquid water in the high- and low-density sides were revealed at the molecular level. The microscopic view of the liquid water has been discussed based on the RDFs. The results clearly show that the liquid structure on the higher-density side is more “water-like,” whereas the lower-density side is more “vapor-like.” The shift of the ridge toward lower density from the critical isochore with increasing temperature reported by the experiments was also reproduced.
4. Structure of Water Using Ab Initio Modeling
First-principles theory is necessary to clarify the relationship between the characteristic structure of water and intermolecular interactions. The theoretical approaches based on molecular simulations, such as molecular dynamics and Monte Carlo, have greatly contributed to the heuristic understanding of the structural, dynamic, and some thermodynamic properties of water. Many reviews have already appeared on the simulation of water [43]. Another theory that tries to explain the structure of water from first principles is the integral equation theory for molecular liquids. Among the many studies, the extended RISM (XRISM) theory has been used to reproduce experimentally observed structural features of water at a qualitative level. In addition, this method has proven to have obvious advantages in terms of applicability and extensibility to chemistry and biophysical chemistry [44].
In this section, the XRISM theory is further extended to analyze water structure over a very wide range of temperature and pressure, including the supercritical region. Considering many-body effects such as electronic polarization are often a crucial issue in theoretical studies. As has been pointed out [1,45], careful attention is always required when using model potentials for molecular interactions. This is because commonly used standard model parameters are highly empirical, are tuned to reproduce experimental data well, and are dependent on the state of the system. Therefore, they may need to be readjusted depending on the state of the system, especially in the supercritical regions where the intermolecular interactions may change significantly from the normal states, resulting in severe parameter dependence. The present study includes properties of liquid water over a wide range of temperature and density conditions (0–600 °C and 0.6–1.4 g cm−3); ranging from the supercritical region to the triple point of the three phases: water, ice-VI, and ice-VII (81.6 °C, 21700 atm) [46]. The change in the polarization state of the molecule is important when dealing with such wide temperature and density ranges. Therefore, it is necessary to use a theory of liquids that can treat the polarization of solution molecules in first-principles theory.
4.1. Theoretical Framework Considering Polarization
Here, by combining the ab initio molecular orbital (MO) method, XRISM calculations were performed considering the electronic polarization of water [45]. Polarization and other many-body effects are naturally taken into account through the self-consistent manner for determining the liquid and electronic structures of the system. The method is essentially very similar to the RISM–SCF theory used for solute–solvent systems at infinite dilution [47,48,49], with a modification associated with application to a neat liquid [45]. The procedure consists of the following steps.
- (i)
- First, the electronic structure of an isolated molecule is calculated. (In this study, the Hartree–Fock level approximation with a double zeta with polarization functions (DZP)-type basis set has been employed.)
- (ii)
- The effective charges of atoms in the molecule are determined by the electrostatic potential method based on the electronic structure calculations.
- (iii)
- The RISM equation for the neat liquid system is solved using the effective charges, and the pair correlation function is determined.
- (iv)
- From the pair correlation function, the microscopic reaction field is calculated using the same definition as the Fock operator in the original RISM–SCF.
- (v)
- The electronic structure of a molecule is calculated with the modified Fock operator including the microscopic reaction field.
Steps (ii) to (v) are iterated until mutual consistency in both the electronic structure and the pair correlation functions is achieved. In this calculation, the same LJ parameters and molecular structure as in TIP3P were used. We also performed RISM calculations of the same LJ system from which the effective charge was removed. The purpose is to clarify the role of hydrogen bonding by comparing liquid structures with and without electrostatic interaction.
4.2. Electronic Polarization of Water
The dipole moment of the isolated water molecule is constant. However, the situation is different in the liquid because an electronic polarization is induced by the electrostatic field created by the surrounding water molecules. The dipole moment depends on the density and/or temperature because the thermal motion and/or the intermolecular interaction of water molecules change under different thermodynamic conditions. The dipole moment of the isolated water molecule calculated by the present ab initio MO method is 2.3 D, which is slightly larger than the experimental value (1.8 D). Improvement can be expected using a more sophisticated level of electronic structure calculation, but it does not affect the discussion of the dependence on temperature and density. Therefore, the dipole moment is considered as the relative value in the liquid phase and the gas phase. Figure 10 shows the difference in the dipole moment of a water molecule in the liquid and gas phases. When the density conditions are 0.6 g cm−3 and 1.4 g cm−3, the lower temperature region is not shown because it is not physically stable, and convergence of the numerical solution was not obtained. At the room temperature and standard density, the dipole moment is increased by 0.7 D from that in the gas phase, which can be compared with the value widely known experimentally and theoretically: 2.5 − 1.8 = 0.7 D [50]. As the temperature increases or the density decreases, the polarization effect becomes smaller, and the electronic structure of the water molecule approaches that of the isolated system. Because molecular vibration is not considered in this study, it is thought that the decrease in polarization is due to the activation of the whole molecule, especially rotational motion. Because motion of the molecules is induced, the average electric field generated is weaker and less anisotropic. However, even at low densities and high temperatures (0.6 g cm−3 and 600 °C), considerable polarization is still seen. Judging from the computed pair correlation functions, the hydrogen-bonding network is considered to be almost lost in the low-density region, but direct bonding between adjacent water molecules remains. That is, the electronic state of the water molecule is different from that of the isolated state. Matubayasi et al. proposed a method to determine the dipole moment of molecules in liquid by analyzing NMR chemical shift data in combination with the molecular dynamics simulation [51]. It can be said that the density and temperature dependence results for electronic polarization obtained in this calculation are in quantitative agreement with those determined by their semiempirical approach. In the other connection with the experimental quantities, we calculated the internal energy change of the vaporization ():
where is the site–site interaction potential between water molecules and is the electronic energy change defined above. At 100 °C with 1.0 g cm−3, is computed to be 11.14 kcal mol−1, which is in reasonable agreement with the experimental value, 8.99 kcal mol−1 [46,52]. Although we will not explain the details here, whereas the total free energy depends on density, it is not so sensitive to temperature changes. Although we could not find experimental data of free-energy change over the wide range of temperatures and densities corresponding to this study, we believe that this result at least qualitatively predicts the actual water situation. As for free-energy change (temperature dependence from 0 °C to 100 °C) in a more limited range, our theory reproduces the experimental results well [45].
4.3. Liquid Structure
Figure 11 shows the temperature dependence of the pair correlation function (PCF) between water and oxygen at three different densities. First, let us focus on the normal density, 1.0 g cm−3. The peak at 3 Å, corresponding to the diameter of the LJ potential σ, represents water molecules in direct contact with each other. The characteristic structure of water is clearly seen at T = 0 °C. The relatively small peak at R ≈ 4.5 Å (or ≈1.63σ) is attributed to the tetrahedral ice-like structure. As the temperature rises, this peak weakens and is gradually replaced by the peak derived from the simple liquid structure around R ≈ 2σ. The isosbestic-like point corresponding to these two structural changes can be seen. As the density changes, the liquid structure changes significantly. In other words, in the space around the water molecule of interest, the location of nearby water molecules depends on the density conditions. In comparison, the change with temperature is much more gentle, and the peaks essentially do not shift from the specific position determined by the density. Instead, only the peak height changes. Because isosbestic-like points are observed for temperature changes at any peak, only the proportion of water molecules changes. At low density, the second peak is very low and there is almost no correlation at long distances. At high density, the third peak also becomes clearer, and the liquid structure resembles that of a simple liquid. It is known from the molecular simulation study that 90% of hydrogen bonds remain upon melting from an ice structure to ambient liquid water [53]. When analyzing liquid water of normal density (1.0 g cm−3), the position of the isosbestic point can be described consistently by assuming an ice-like tetrahedral structure. Of course, the structure obtained by XRISM also contains water molecules that fill the gaps of the tetrahedral structure. These are adjacent but nonhydrogen-bonded water molecules called “interstitial water molecules” in the old water model. In contrast, the temperature change of the PCF at high density behaves the same as the change in LJ fluid of the same density, strongly suggesting that the structure of water under this condition is very similar to that of a simple liquid.
In Figure 12, the first-peak position of the O–O PCF of water (solid line) and that of the LJ liquid (dotted line) are plotted with respect to the inverse of the cube root of the density. That is, the horizontal axis represents the average distance between molecules in the liquid, and the vertical axis is the closest distance reflecting the result of the many-body effect including all intermolecular interactions of attraction and repulsion. The results of the experiments obtained with X-ray diffraction are also plotted with the symbol X. At higher densities (left side), the peak positions of water and LJ liquid are closer to one another, indicating the importance of the packing effect. As the density decreases, both of these shift to greater distances (right side), but the position in water is much less sensitive to density changes compared with the position in the LJ fluid. This is explained by the fact that the closest distance between molecules in liquid water is primarily determined by the core repulsion (exclusion) as well as by the hydrogen bond. Under the high-density conditions, the molecules are densely packed and core repulsion dominates. The closest distance of the LJ fluid is essentially determined solely by this packing effect. Because of this, water and LJ fluids behave the same in high-density conditions. On the other hand, as the density decreases, the closest distance increases and the packing effect virtually disappears. That is, the structure of water is dominated by hydrogen bonds. The results obtained from the calculations are in qualitative agreement with the corresponding experimental data of water, indicating that the present model correctly characterizes the water structure over a wide range of densities.
4.4. Summary
The ab initio MO theory was combined with the integral equation theory to reveal the electronic structure, liquid structure, and thermodynamics of water over a wide range of temperatures (0–600 °C) and densities (0.6–1.4 g cm−3). A dipole moment of molecules in the liquid state is induced compared with the isolated state but decreases with increasing temperature and/or density. This is explained by the weakening of the hydrogen bonding with the surrounding molecules by thermal activation and the weakening of the reaction field in the system. These calculated results are in quantitative agreement with experimental data determined based on NMR chemical shifts coupled with molecular dynamics simulations.
At normal densities (1.0 g cm−3), the liquid structure of water takes on a tetrahedral structure, retaining the short-range structural characteristics of ice. However, as the density changes, this structure changes significantly. At high density (1.4 g cm−3), the molecules are densely packed in space, and, like the LJ fluid, the structure is essentially determined by the many-body packing effect. On the other hand, at low density (0.6 g cm−3), not only the packing effect but also the hydrogen bonding virtually disappears. Entropy effects become important as the configuration space available to molecules increases. It is believed that temperature changes do not significantly affect the liquid structure itself, but instead, the proportion of water molecules having a given structure changes. In this paper, the number of hydrogen bonds is also calculated. In particular, we attempted to distinguish true hydrogen bonds from those in which the hydrogen–oxygen distance is simply short as a result of the molecules being adjacent to each other. It turned out that the two showed completely opposite behavior with respect to temperature rise.
5. Autoionization in Supercritical Water
The ionic product of water, , is the equilibrium constant for the autoionization reaction of water and it is also a standard quantity for determining the protonation (or deprotonation) states of solvated chemical species. The ionic product is strongly dependent on the temperature and density of the system due to the intra- and intermolecular interactions.
There are several methods to determine . Trout and Parrinello have employed the Car–Parrinello density functional method to investigate the autoionization process for water in the liquid state [54,55]. Sato and co-workers have investigated the temperature and density dependence of the electronic properties, molecular structure, radial distribution, and using the RISM–SCF method [45,56,57,58]. RISM–SCF and its variants have also been successfully applied to measure the acid dissociation constant [59,60,61,62].
Using the RISM–SCF coupled with the hypernetted-chain (HNC) approximation, Sato et al. have investigated properties in the wide range of densities (0.6–1.4 g cm−3) and temperatures (300–900 K). To calculate in a lower-density region (less than 0.6 g cm−3), the KH closure needs to be introduced instead of HNC because of higher robustness for the numerical calculation [63]. In this subsection, a theoretical study using the RISM–SCF/KH method to investigate the properties of fluid water in a wide range of densities (0.025–1.0 g cm−3) and temperatures (300–800 K) is briefly reviewed [27]. In the calculation, one water molecule is treated by quantum mechanics, which is called the “solute,” and all surrounding “solvent” water molecules are treated using classical mechanics. Similarly, the dissociated states of the water molecule, H3O+ and OH−, are also considered quantum mechanical “solutes.”
5.1. Theoretical Framework of pKw
The logarithm of the ionic product of water, , is related to the reaction free energy of the autoionization reaction of water, , as
with being the gas constant. Here, is defined as
where and are the reaction free energy in vacuo and the solvation free energy of species X. These values can be evaluated by solving RISM–SCF coupled with the KH closure equation for a wide range of densities and temperatures.
For the RISM–SCF/KH calculations, the restricted Hartree–Fock/Møller–Plesset 2nd-order perturbation level with triple zeta basis set augmented by p polarization functions on hydrogen atoms and d polarization and diffuse p functions on oxygen atoms is employed.
All calculations were carried out in a range of densities 0.025–1.0 g cm−3 and temperatures 300–800 K. All other computational details can be found in the original research article.
5.2. Free Energy and pKw
In Figure 13, the change in from the standard state , , is plotted against temperature and density and compared with that by the experiments. The monotonic increase in with increasing temperature and density is qualitatively consistent with the experimental results [64]. However, the amount of change itself is overestimated. This is considered to be because only one molecule is treated as a quantum chemical “solute,” and thus quantum chemical effects such as electron transfer between molecules are ignored. This is also pointed out for the molecular simulation by Yagasaki et al. [65].
Let us consider the origin of the monotonic change in with increasing density and temperature. The most important factor for the temperature dependence is the change in the excess chemical potential, . The temperature and density dependence of is plotted in Figure 14b. increases with decreasing density and with increasing temperature, monotonically. On the other hand, the components of , , and are not monotonically varying and have a minimum value. This behavior indicates that the two competing effects are interacting (See Figure 15). The excess chemical potential is determined by two major effects, namely electrostatic stabilization and cavity formation. and show a similar monotonic decrease with increasing density in the low-density region, which is attributed essentially to the density dependence of the electrostatic stabilization. In the high-density region, monotonic increasing of and with increasing density is attributed to the cavity formation effect. Because is an ionic species, increases monotonically with increasing density due to strong electrostatic stabilization. These features are also reported in other papers [58].
5.3. Summary
The temperature and density dependence of was investigated using the RISM–SCF method in combination with KH. The results have shown a monotonic increase with increasing density at all temperatures in good agreement with the experimental observation. The major factor of change is a change in the excess chemical potential, where there are two possible effects: electrostatic stabilization and cavity formation. Using the RISM–SCF method, it was successfully elucidated how these effects depend on temperature and density variations. Quantitative errors in have also been pointed out, but it is expected that these can be improved by incorporating quantum effects for a larger part of the system with future development of the theory.
6. The Diels–Alder Reaction in Supercritical Water
The Diels–Alder reaction is an organic reaction to synthesize polycyclic ring molecules. It has been shown by Breslow et al. that the reaction is drastically accelerated using water as solvent [66]. However, the yield of the reaction was not increased as much as expected because the solubility of the reactants in water is quite low. It is SCW [67,68] that has an advantage in this regard. SCW dissolves a variety of organic compounds depending on temperature and pressure. In fact, several different combinations of diene and dienophile have been examined experimentally [69]. It was reported that SCW gives higher yields than AW and that it increases the reaction rate dramatically. SCW is also advantageous from the environmental viewpoint. Here, we review our studies on the Diels–Alder reactions in SCW as well as in AW using the RISM–SCF/MCSCF method; these studies answer the questions why the reaction rate increases by changing the solvent from organic to aqueous solutions, and why the reaction yields drastically increase when using SCW in place of water. As a target system, the cycloaddition of cyclopentadiene (CP) with methyl vinyl ketone (MVK) is examined (Figure 16), which has been extensively studied by means of both experiments and theories [66,70,71,72,73,74,75].
To examine the mechanism of the Diels–Alder reaction, possible structures of the transition state are presumed. The dienophile can take two different conformations, s-cis or s-trans, which may bind with the diene to make transition states (TSs) in two possible structures, exo or endo. That makes four possible combinations, endo–cis, endo–trans, exo–cis, and exo–trans, for the conformation of the TS. It was suggested in the earlier studies that the two conformations concerned with the exo-form have very high activation barriers [76]. Therefore, the endo–cis and endo–trans combinations were examined [77,78].
The total free energies of the solute molecule in the gas and solvent phases are defined respectively by
where and represent the electronic energy of the solute in the gas phase and in water, respectively. The electronic structure of the solute in solution changes from that in the gas phase due to the solute–solvent interaction. The energy change of the electronic structure associated with solvation, is defined as
The activation free energy in the gas phase is defined as
where is the electronic energy at the TS in the gas phase. The activation free energies in AW and SCW are defined as
and
where and are the free energies of the TSs in AW and SCW, respectively.
The free-energy changes of the product from the reactant in the gas phase, AW, and SCW are defined respectively by
and
where and are the free energies of the product in the gas phase, AW, and SCW, respectively.
Concerning the potential functions for solute molecules, CH, CH2, and CH3 groups are treated as united atoms, and the potential functions consist of the LJ and Coulomb interactions. The LJ parameters for the united atoms are taken from the OPLS [79,80].
For TSs, these parameters were fixed at the same values as those of corresponding sites in the reactants. An SPC-like model was used. The temperature and density of the surrounding water were 298 K, 1.0 g/cm3 for the ambient condition and 873 K, 0.6 g/cm3 for the supercritical condition, respectively.
6.1. Stabilization of the Transition State in Ambient Water
The free-energy profiles, defined by Equations (19)–(24), along the reaction coordinate that passes through the endo–trans TS are plotted in Figure 17: gas phase (298 K), AW (298 K, 1.0 g/cm2), and SCW (873 K, 0.6 g/cm3). All the energy levels are determined by regarding the respective reactant state at the corresponding temperature as a standard. The results indicate that both the activation barrier and the free energy of the product reduce in AW and SCW compared with those in the gas phase at the respective temperature, although the amount of reduction in SCW is less than that in AW.
The activation free energies in the gas phase and AW are 52.48 and 45.58 kcal/mol, respectively: there is a reduction by 6.90 kcal/mol from the gas phase to AW (Table 1). The change is attributed essentially to the differences in the electronic reorganization energy, , and the solvation free energy, , between the reactant and TS. Changes in the activation free energy from the gas phase to AW (=) and to SCW (=) are listed in Table 1.
The stabilization of the TS originates from the decrease in the solvation free energy associated with the reaction process from the reactant to TS, which includes geometrical change giving rise to the desolvation of water molecules at contact. The detailed analysis of the solvation free energy, , at the TS in AW indicated that the hydrophobic and electrostatic effects contributed almost equally to the reduction of the activation free energy. On the other hand, it was found, in the case of SCW, that the hydrophobic effect contributes mainly to the reduction of the activation barrier.
Comparing between the trans and cis activation states, the trans state shows slightly greater stabilization both in AW and SCW. This indicates that the reaction goes over both activation barriers, but with the trans state slightly more probable.
The activation barrier in SCW is quite high, ≈80 kcal/mol, compared with that in AW, ≈45 kcal/mol. This may cause some concern about the use of SCW as a solvent. However, that is just apparent because the temperature of SCW is almost three times higher, 873 K, than that of AW, 298 K.
6.2. Physical Origin of the High Yield in Supercritical Water
The yield of a reaction is a very important concern for any industrial application of the reaction. It is determined by two factors: the equilibrium constant of the reaction and the solubility of the reactants in the solvent. The solubility is an important factor because undissolved molecules cannot participate in the reaction. Here, we define an effective yield constant by a product of the Henry’s law constant of the reactants () and the equilibrium constant of the reaction () as
The Henry’s law constant is obtained from the solvation free energy of the solute molecule dissolved in the solvent from the gas phase.
The equilibrium constant K is related to the free-energy difference between the reactant and the product () in the solvent,
The change of the solvation free energy from the reactant to the product is defined by
and the electronic reorganization energy upon the reaction is defined as
Changes in the free energies of the reaction from the gas phase to AW and to SCW are defined respectively by
and
Listed in Table 2 are changes in the reaction free energy from the gas phase to AW and to SCW. It is seen that the product in AW is stabilized more than the reactant in terms of the solvation free energy,, whereas makes a minor contribution. Comparing the numbers for between AW and SCW, one may conclude that the chemical reaction is more favorable in AW than in SCW for both trans and cis conformations. It can also be seen that the cis conformation is more stable than the trans conformation. Therefore, when the reaction goes through the endo–cis TS only, the equilibrium constant K in AW and in SCW becomes and 0.20, respectively. Therefore, if the yield is determined solely by the equilibrium constant of the reaction, the yield in SCW can never be higher than that in AW. That is not the case in the experimental results.
According to Equation (25), there is another factor to consider for determining the reaction yield, namely the solubility of the reactant molecules in AM and SCW, defined by Equation (26).
The solvation free energies, , of the reactants, CP and MVK, in AW are calculated to be 19.68 kcal/mol and 11.04 kcal/mol, respectively. On the other hand, those in SCW were 25.48 kcal/mol and 20.05 kcal/mol, respectively. Putting those numbers into Equation (25), in SCW is estimated to be times greater than that in AW, taking corresponding temperatures into account. From those results for the equilibrium constant and the solubility, one finds based on Equation (25) that the yield in SCW is approximately 667 times higher than in AW. Our calculation shows that the energetics of the reaction in SCW gives a disadvantage regarding the yield, but the increased solubility of the reactants in the solvent gives an advantage that is sufficient to overcome the energetic disadvantage.
6.3. Summary
In this section, we have reviewed a theoretical study for a Diels–Alder reaction in the gas phase, in AW, and in SCW based on the RISM–SCF/MCSCF method, a combined ab initio electronic structure theory and the statistical mechanics of molecular liquids. We draw the following conclusions from the study.
The reaction rate in AW is increased largely in comparison with that in the gas phase through a reduced activation barrier due to the hydrophobic interaction. The reaction in SCW is accelerated due to increased thermal activation, not by the same cause as in AW. The reaction yield is increased dramatically in SCW due to enhanced solubility compared with that in water. Regarding Diels–Alder reactions, the stereochemistry is another important issue studied by many authors. It has been observed experimentally that the endo/exo stereoselectivity of products of the reaction becomes much higher in AW than that in organic solvents, and the selectivity disappears in SCW. It will be of great interest to see microscopically why water enhances the stereoselectivity, and why it disappears in SCW.
7. Concluding Remarks
In the present article, we have reviewed the experimental and theoretical studies, carried out by two groups in Japan, to characterize the thermodynamic properties of SCW from the viewpoint of density fluctuations. In the experimental studies based on SAXS, the existence of a line that separates the phase diagram of the SCW between the liquid-like region and vapor-like region was clarified. The existence of such a line in the phase diagram was first predicted theoretically by Widom and Fischer and given the name “Widom line” much later by Stanley. The first experimental characterization of the line was made by Nishikawa and co-workers, and named the “ridge.” Therefore, it may be more appropriate to call the line the “Nishikawa–Widom line.” The Nishikawa–Widom line of water was reproduced theoretically by Matsugami et al. based on the RISM theory of molecular liquids. The RDF around the liquid-like region shows a wiggle characteristic of a liquid state as the distance increases, whereas that around the vapor-like region shows a monotonic decay characteristic of a gas state.
The extreme thermodynamic condition of SCW has a significant effect on the electronic structure of water molecules and also on the chemical reactions in the fluid. The Diels–Alder reaction in SCW was investigated theoretically based on the RISM–SCF theory. The reaction in SCW is accelerated due to increased thermal activation, not due to the reduction of the activation barrier. The reaction yield is increased dramatically in SCW compared with that in water due to enhanced solubility. The finding suggests the possibility that the biomolecules were synthesized from inorganic compounds in a natural condition of SCW around a submarine volcano before life was born.
In this review, although the research devoted to SCW is focused, other SC fluids have also been studied intensively. SC carbon dioxide (SCCO2) is one of these fluids, and it is widely used in green chemistry to replace the volatile organic solvents [81]. One of the authors’ groups is working extensively on SCCO2, and revealed a universality of anomalous properties of SC fluids [15,17,18,82,83].
These studies have revealed the details of the structure and properties of supercritical fluids, which will broaden the field of application of supercritical fluids in green chemistry.
Author Contributions
Conceptualization N.Y., M.M., Y.H., K.N. and F.H.; investigation N.Y., M.M., Y.H., K.N. and F.H.; writing N.Y., M.M., Y.H., K.N. and F.H. All authors have read and agreed to the published version of the manuscript.
Funding
NY acknowledges the financial support from the Japan Society for the Promotion of Science (JSPS) KAKENHI (Grant Nos 18K05036 and 19H02677) and the Toyota Riken Scholar from the Toyota Physical and Chemical Research Institute.
Conflicts of Interest
The authors declare no conflict of interest.
References
- Nakahara, M.; Yamaguchi, T.; Ohtaki, H. The structure of water and aqueous electrolyte solutions under extreme conditions. Recent Res. Devel. Phys. Chem. 1997, 1, 17. [Google Scholar]
- Fischer, K.; Schulenberg, T.; Laurien, E. Design of a supercritical water-cooled reactor with a three-pass core arrangement. Nucl. Eng. Des. 2009, 239, 800–812. [Google Scholar] [CrossRef]
- Imre, A.R.; Groniewsky, A.; Györke, G.; Katona, A.; Velmovszki, D. Anomalous Properties of Some Fluids−with High Relevance in Energy Engineering− in Their Pseudo-critical (Widom) Region. Period. Polytech. Chem. Eng. 2019, 63, 276–285. [Google Scholar] [CrossRef]
- Padilla, R.V.; Too, Y.C.S.; Benito, R.; Stein, W. Exergetic analysis of supercritical CO2 Brayton cycles integrated with solar central receivers. Appl. Energy 2015, 148, 348–365. [Google Scholar] [CrossRef]
- Nakahara, M. The Structure and Properties of Supercritical Water. Netsu Sokutei 2004, 31, 14–22. [Google Scholar]
- Hirata, F. Exploring Life Phenomena with Statistical Mechanics of Molecular Liquids; CRC Press: Boca Raton, FL, USA, 2020. [Google Scholar]
- Stanley, H.E. Introduction to Phase Transitions and Critical Phenomena; Oxford University Press: New York, NY, USA, 1987. [Google Scholar]
- Banuti, D. Crossing the Widom-line–supercritical pseudo-boiling. J. Supercrit. Fluids 2015, 98, 12–16. [Google Scholar] [CrossRef]
- Kajimoto, O. Solvation in Supercritical Fluids: Its Effects on Energy Transfer and Chemical Reactions. Chem. Rev. 1999, 99, 355–390. [Google Scholar] [CrossRef]
- Tucker, S.C.; Maddox, M.W. The effect of solvent density inhomogeneities on solute dynamics in supercritical fluids: A theoretical perspective. J. Phys. Chem. B 1998, 102, 2437–2453. [Google Scholar] [CrossRef]
- Tucker, S.C. Solvent density inhomogeneities in supercritical fluids. Chem. Rev. 1999, 99, 391–418. [Google Scholar] [CrossRef] [PubMed]
- Nishikawa, K.; Morita, T. Fluid Behavior at Supercritical States Studied by Small-Angle X-Ray Scattering. J. Supercrit. Fluids 1998, 13, 143–148. [Google Scholar] [CrossRef]
- Nishikawa, K.; Morita, T. Inhomogeneity of molecular distribution in supercritical fluids. Chem. Phys. Lett. 2000, 316, 238–242. [Google Scholar] [CrossRef]
- Nishikawa, K.; Kusano, K.; Arai, A.A.; Morita, T. Density fluctuation of a van der Waals fluid in supercritical state. J. Chem. Phys. 2003, 118, 1341–1346. [Google Scholar] [CrossRef]
- Saitow, K.; Kajiya, D.; Nishikawa, K. Dynamics of density fluctuation of supercritical fluid mapped on phase diagram. J. Am. Chem. Soc. 2004, 126, 422–423. [Google Scholar] [CrossRef] [PubMed]
- Nishikawa, K.; Takematsu, M. X-Ray-Scattering Study of Carbon-Dioxide at Supercritical States. Chem. Phys. Lett. 1994, 226, 359–363. [Google Scholar] [CrossRef]
- Nishikawa, K.; Tanaka, I. Correlation Lengths and Density-Fluctuations in Supercritical States of Carbon-Dioxide. Chem. Phys. Lett. 1995, 244, 149–152. [Google Scholar] [CrossRef]
- Nishikawa, K.; Tanaka, I.; Amemiya, Y. Small-angle X-ray scattering study of supercritical carbon dioxide. J. Phys. Chem. 1996, 100, 418–421. [Google Scholar] [CrossRef]
- Nishikawa, K.; Morita, T. Small-Angle X-ray-Scattering Study of Supercritical Trifluoromethane. J. Phys. Chem. B 1997, 101, 1413–1418. [Google Scholar] [CrossRef]
- Morita, T.; Kusano, K.; Ochiai, H.; Saitow, K.; Nishikawa, K. Study of inhomogeneity of supercritical water by small-angle X-ray scattering. J. Chem. Phys. 2000, 112, 4203–4211. [Google Scholar] [CrossRef]
- Arai, A.A.; Morita, T.; Nishikawa, K. Analysis to obtain precise density fluctuation of supercritical fluids by small-angle X-ray scattering. Chem. Phys. 2005, 310, 123–128. [Google Scholar] [CrossRef]
- Amemiya, Y.; Wakabayashi, K.; Hamanaka, T.; Wakabayashi, T.; Matsushita, T.; Hashizume, H. Design of a Small-Angle X-Ray Diffractometer Using Synchrotron Radiation at the Photon-Factory. Nucl. Instrum. Methods 1983, 208, 471–477. [Google Scholar] [CrossRef]
- Morita, T.; Miyagi, H.; Shimokawa, Y.; Maisuo, H.; Nishikawa, K. Construction of the sample holder and small-angle X-ray scattering measurement for supercritical water. Jpn. J. Appl. Phys. Part 2 Lett. 1998, 37, L768–L770. [Google Scholar] [CrossRef]
- Nishikawa, K.; Arai, A.A.; Morita, T. Density fluctuation of supercritical fluids obtained from small-angle X-ray scattering experiment and thermodynamic calculation. J. Supercrit. Fluids 2004, 30, 249–257. [Google Scholar] [CrossRef]
- Morita, T.; Kusano, K.; Nishikawa, K.; Miyagi, H.; Shimokawa, Y.; Matsuo, H. Titanium sample holder for small-angle x-ray scattering measurements of supercritical aqueous solutions. Rev. Sci. Instrum. 2001, 72, 3013–3018. [Google Scholar] [CrossRef]
- Wagner, W.; Pruss, A. The IAPWS formulation 1995 for the thermodynamic properties of ordinary water substance for general and scientific use. J. Phys. Chem. Ref. Data 2002, 31, 387–535. [Google Scholar] [CrossRef] [Green Version]
- Yoshida, N.; Ishizuka, R.; Sato, H.; Hirata, F. Ab initio theoretical study of temperature and density dependence of molecular and thermodynamic properties of water in the entire fluid region: Autoionization processes. J. Phys. Chem. B 2006, 110, 8451–8458. [Google Scholar] [CrossRef] [PubMed]
- Shibuta, S.; Imamura, H.; Nishikawa, K.; Morita, T. Fluctuational parameters based on the Bhatia-Thornton theory for supercritical solutions: Application to a supercritical aqueous solution of n-pentane. Chem. Phys. 2017, 487, 30–36. [Google Scholar] [CrossRef]
- Ploetz, E.A.; Smith, P.E. Gas or Liquid? The Supercritical Behavior of Pure Fluids. J. Phys. Chem. B 2019, 123, 6554–6563. [Google Scholar]
- Carome, E.F.; Cykowski, C.B.; Havlice, J.F.; Swyt, D.A. Temperature and Pressure Dependence of Velocity of Ultrasound in Argon. Physica 1968, 38, 307. [Google Scholar] [CrossRef]
- Nishikawa, K.; Ochiai, H.; Saitow, K.; Morita, T. Static inhomogeneity of supercritical ethylene studied by small-angle X-ray scattering. Chem. Phys. 2003, 286, 421–430. [Google Scholar] [CrossRef]
- Arai, A.A.; Morita, T.; Nishikawa, K. Investigation of structural fluctuation of supercritical benzene by small-angle x-ray scattering. J. Chem. Phys. 2003, 119, 1502–1509. [Google Scholar] [CrossRef]
- Reid, R.C.; Prausnitz, J.M.; Poling, J.E. The Properties of Gases and Liquids, 4 ed.; McGraw-Hill: New York, NY, USA, 1987. [Google Scholar]
- Chialvo, A.A.; Cummings, P.T. Solute-induced Effects on the Structure and the Thermodynamics of Infinitely Dilute Mixtures. AICHE J. 1994, 40, 1558–1573. [Google Scholar] [CrossRef]
- Gray, C.; Goldman, S.; Tomberli, B.; Li, W. Correlation lengths and density fluctuations in supercritical states of carbon dioxide—Comment. Chem. Phys. Lett. 1997, 271, 185–187. [Google Scholar] [CrossRef]
- Nishikawa, K. Reply to Comment on "Correlation lengths and density fluctuations in supercritical states of carbon dioxide". Chem. Phys. Lett. 1997, 271, 188. [Google Scholar] [CrossRef]
- Narikiyo, O. Comment on "correlation length and density fluctuations in supercritical states of carbon dioxide". Chem. Phys. Lett. 1998, 290, 549–550. [Google Scholar] [CrossRef]
- Matsugami, M.; Yoshida, N.; Hirata, F. Theoretical characterization of the "ridge" in the supercritical region in the fluid phase diagram of water. J. Chem. Phys. 2014, 140, 104511. [Google Scholar] [CrossRef]
- Hansen, J.P.; McDonald, I.R. Theory of Simple Liquids, 3rd ed.; Academic Press: Amsterdam, The Netherlands, 2006. [Google Scholar]
- Kovalenko, A.; Hirata, F. Molecular Theory of Solvation; Hirata, F., Ed.; Kluwer: Dordrecht, The Netherlands, 2003. [Google Scholar]
- Kovalenko, A.; Hirata, F. First-principles realization of a van der Waals-Maxwell theory for water. Chem. Phys. Lett. 2001, 349, 496–502. [Google Scholar] [CrossRef]
- Matubayasi, N.; Nakahara, M. Super- and subcritical hydration of nonpolar solutes. I. Thermodynamics of hydration. J. Chem. Phys. 2000, 112, 8089–8109. [Google Scholar] [CrossRef] [Green Version]
- Ohmine, I.; Tanaka, H. Fluctuation, Relaxations, and Hydration in Liquid Water—Hydrogen-Bond Rearrangement Dynamics. Chem. Rev. 1993, 93, 2545–2566. [Google Scholar] [CrossRef]
- Hirata, F. Chemical processes in solution studied by an integral equation theory of molecular liquids. Bull. Chem. Soc. Jpn. 1998, 71, 1483–1499. [Google Scholar] [CrossRef]
- Maw, S.; Sato, H.; Ten-No, S.; Hirata, F. Ab initio study of water: Self-consistent determination of electronic structure and liquid state properties. Chem. Phys. Lett. 1997, 276, 20–25. [Google Scholar] [CrossRef]
- Dorsey, N. Properties of Ordinary Water-Substance; Hafner Publishing Co.: New York, NY, USA, 1968. [Google Scholar]
- Ten-No, S.; Hirata, F.; Kato, S. A Hybrid Approach for the Solvent Effect on the Electronic-Structure of a Solute Based on the RISM and Hartree-Fock Equations. Chem. Phys. Lett. 1993, 214, 391–396. [Google Scholar] [CrossRef]
- Ten-No, S.; Hirata, F.; Kato, S. Reference Interaction Site Model Self-Consistent-Field Study For Solvation Effect On Carbonyl-Compounds In Aqueous-Solution. J. Chem. Phys. 1994, 100, 7443–7453. [Google Scholar] [CrossRef]
- Sato, H.; Hirata, F.; Kato, S. Analytical energy gradient for the reference interaction site model multiconfigurational self-consistent-field method: Application to 1,2-difluoroethylene in aqueous solution. J. Chem. Phys. 1996, 105, 1546–1551. [Google Scholar] [CrossRef]
- Gregory, J.K.; Clary, D.C.; Liu, K.; Brown, M.G.; Saykally, R.J. The water dipole moment in water clusters. Science 1997, 275, 814–817. [Google Scholar] [CrossRef] [PubMed]
- Matubayasi, N.; Wakai, C.; Nakahara, M. Structural study of supercritical water. II. Computer simulations. J. Chem. Phys. 1999, 110, 8000–8011. [Google Scholar] [CrossRef]
- Eisenberg, D.; Kauzmann, W. The Structure and Properties of Water; Oxford at the Clarendon Press: London, UK, 1969. [Google Scholar]
- Ohmine, I. Liquid Water Dynamics—Collective Motions, Fluctuation, and Relaxation. J. Phys. Chem. 1995, 99, 6767–6776. [Google Scholar] [CrossRef]
- Trout, B.; Parrinello, M. Analysis of the dissociation of H2O in water using first-principles molecular dynamics. J. Phys. Chem. B 1999, 103, 7340–7345. [Google Scholar] [CrossRef]
- Trout, B.; Parrinello, M. The dissociation mechanism of H2O in water studied by first-principles molecular dynamics. Chem. Phys. Lett. 1998, 288, 343–347. [Google Scholar] [CrossRef]
- Sato, H.; Hirata, F. Theoretical study for autoionization of liquid water: Temperature dependence of the ionic product (pKw). J. Phys. Chem. A 1998, 102, 2603–2608. [Google Scholar] [CrossRef]
- Sato, H.; Hirata, F. Ab initio study of water. II. Liquid structure, electronic and thermodynamic properties over a wide range of temperature and density. J. Chem. Phys. 1999, 111, 8545–8555. [Google Scholar] [CrossRef]
- Sato, H.; Hirata, F. Ab initio study on molecular and thermodynamic properties of water: A theoretical prediction of pK(w) over a wide range of temperature and density. J. Phys. Chem. B 1999, 103, 6596–6604. [Google Scholar] [CrossRef]
- Kido, K.; Sato, H.; Sakaki, S. Systematic Assessment on Aqueous pK(a) and pK(b) of an Amino Acid Base on RISM-SCF-SEDD Method: Toward First Principles Calculations. Int. J. Quantum Chem. 2012, 112, 103–112. [Google Scholar] [CrossRef]
- Seno, Y.; Yoshida, N.; Nakano, H. Theoretical analysis of complex formation of p-carboxybenzeneboronic acid with a monosaccharide. J. Mol. Liq. 2016, 217, 93–98. [Google Scholar] [CrossRef]
- Fujiki, R.; Kasai, Y.; Seno, Y.; Matsui, T.; Shigeta, Y.; Yoshida, N.; Nakano, H. A computational scheme of pKa values based on the three-dimensional reference interaction site model self-consistent field theory coupled with the linear fitting correction scheme. Phys. Chem. Chem. Phys. 2018, 20, 27272–27279. [Google Scholar] [CrossRef]
- Kido, K.; Sato, H.; Sakaki, S. First Principle Theory for pK(a) Prediction at Molecular Level: pH Effects Based on Explicit Solvent Model. J. Phys. Chem. B 2009, 113, 10509–10514. [Google Scholar] [CrossRef] [PubMed]
- Kovalenko, A.; Hirata, F. Self-Consistent Description Of A Metal-Water Interface By The Kohn-Sham Density Functional Theory And The Three-Dimensional Reference Interaction Site Model. J. Chem. Phys. 1999, 110, 10095–10112. [Google Scholar] [CrossRef]
- Mesmer, R.E.; Marshall, W.L.; Palmer, D.A.; Simonson, J.M.; Holmes, H.F. Thermodynamics of Aqueous Association and Ionization Reactions at High-Temperatures and Pressures. J. Solut. Chem. 1988, 17, 699–718. [Google Scholar] [CrossRef]
- Yagasaki, T.; Iwahashi, K.; Saito, S.; Ohmine, I. A theoretical study on anomalous temperature dependence of pK(w) of water. J. Chem. Phys. 2005, 122, 144504. [Google Scholar] [CrossRef] [PubMed]
- Rideout, D.C.; Breslow, R. Hydrophobic acceleration of Diels-Alder reactions. J. Am. Chem. Soc. 1980, 102, 7816–7817. [Google Scholar] [CrossRef]
- Shaw, R.W.; Brill, T.B.; Clifford, A.A.; Eckert, C.A.; Franck, E.U. Supercritical Water—A Medium for Chemistry. Chem. Eng. News 1991, 69, 26–39. [Google Scholar]
- Savage, P.E. Organic chemical reactions in supercritical water. Chem. Rev. 1999, 99, 603–621. [Google Scholar] [CrossRef] [PubMed]
- Korzenski, M.B.; Kolis, J.W. Diels-Alder reactions using supercritical water as an aqueous solvent medium. Tetrahedron Lett. 1997, 38, 5611–5614. [Google Scholar] [CrossRef]
- Blake, J.F.; Jorgensen, W.L. Solvent Effects on a Diels-Alder Reaction from Computer-Simulations. J. Am. Chem. Soc. 1991, 113, 7430–7432. [Google Scholar] [CrossRef]
- Blake, J.F.; Lim, D.; Jorgensen, W.L. Enhanced Hydrogen-Bonding of Water to Diels-Alder Transition-States—Ab-Initio Evidence. J. Org. Chem. 1994, 59, 803–805. [Google Scholar] [CrossRef]
- Otto, S.; Blokzijl, W.; Engberts, J.B.F.N. Diels-Alder Reactions in Water—Effects of Hydrophobicity and Hydrogen-Bonding. J. Org. Chem. 1994, 59, 5372–5376. [Google Scholar] [CrossRef]
- Furlani, T.R.; Gao, J.L. Hydrophobic and hydrogen-bonding effects on the rate of Diels-Alder reactions in aqueous solution. J. Org. Chem. 1996, 61, 5492–5497. [Google Scholar] [CrossRef]
- Jorgensen, W.L.; Lim, D.C.; Blake, J.F. Abinitio Study of Diels-Alder Reactions of Cyclopentadiene with Ethylene, Isoprene, Cyclopentadiene, Acrylonitrile, and Methyl Vinyl Ketone. J. Am. Chem. Soc. 1993, 115, 2936–2942. [Google Scholar] [CrossRef]
- Assfeld, X.; Ruiz-López, M.F.; García, J.I.; Mayoral, J.A.; Salvatella, L. Importance of Electronic and Nuclear-Polarization Energy on Diastereofacial Selectivity of Diels-Alder Reactions in Aqueous-Solution. J. Chem. Soc. Chem. Comm. 1995, 1371–1372. [Google Scholar] [CrossRef]
- Breslow, R.; Maitra, U. Unusual Structural Effects on the Chemical Degradation of Steroid Sidechains. Tetrahedron Lett. 1984, 25, 5843–5846. [Google Scholar] [CrossRef]
- Harano, Y.; Sato, H.; Hirata, F. Solvent effects on a Diels-Alder reaction in supercritical water: RISM-SCF study. J. Am. Chem. Soc. 2000, 122, 2289–2293. [Google Scholar] [CrossRef]
- Harano, Y.; Sato, H.; Hirata, F. A theoretical study on a Diels-Alder reaction in ambient and supercritical water: Viewing solvent effects through frontier orbitals. Chem. Phys. 2000, 258, 151–161. [Google Scholar] [CrossRef]
- Jorgensen, W.L.; Briggs, J.M.; Contreras, M.L. Relative Partition-coefficients for Organic Solutes from Fluid Simulations. J. Phys. Chem. 1990, 94, 1683–1686. [Google Scholar] [CrossRef]
- Jorgensen, W.L.; Madura, J.D.; Swenson, C.J. Optimized Intermolecular Potential Functions for Liquid Hydrocarbons. J. Am. Chem. Soc. 1984, 106, 6638–6646. [Google Scholar] [CrossRef]
- Peach, J.; Eastoe, J. Supercritical carbon dioxide: A solvent like no other. Beilstein J. Org. Chem. 2014, 10, 1878–1895. [Google Scholar] [CrossRef] [PubMed] [Green Version]
- Saitow, K.; Kajiya, D.; Nishikawa, K. Time evolution of density fluctuation in supercritical region. I. Non-hydrogen-bonded fluids studied by dynamic light scattering. J. Phys. Chem. A 2005, 109, 83–91. [Google Scholar] [CrossRef] [PubMed]
- Nakayama, H.; Saitow, K.; Sakashita, M.; Ishii, K.; Nishikawa, K. Raman spectral changes of neat CO2 across the ridge of density fluctuation in supercritical region. Chem. Phys. Lett. 2000, 320, 323–327. [Google Scholar] [CrossRef]
Figure 1.
Comparison of density fluctuation of SCW obtained from scattering experiments (triangles) with calculated ones from the equation of state of Wagner et al. [26] (solid curves). This figure is reprinted with permission from J. Supercritical Fluids 2004, 30, 249. Copyright 2004 Elsevier.
Figure 1.
Comparison of density fluctuation of SCW obtained from scattering experiments (triangles) with calculated ones from the equation of state of Wagner et al. [26] (solid curves). This figure is reprinted with permission from J. Supercritical Fluids 2004, 30, 249. Copyright 2004 Elsevier.
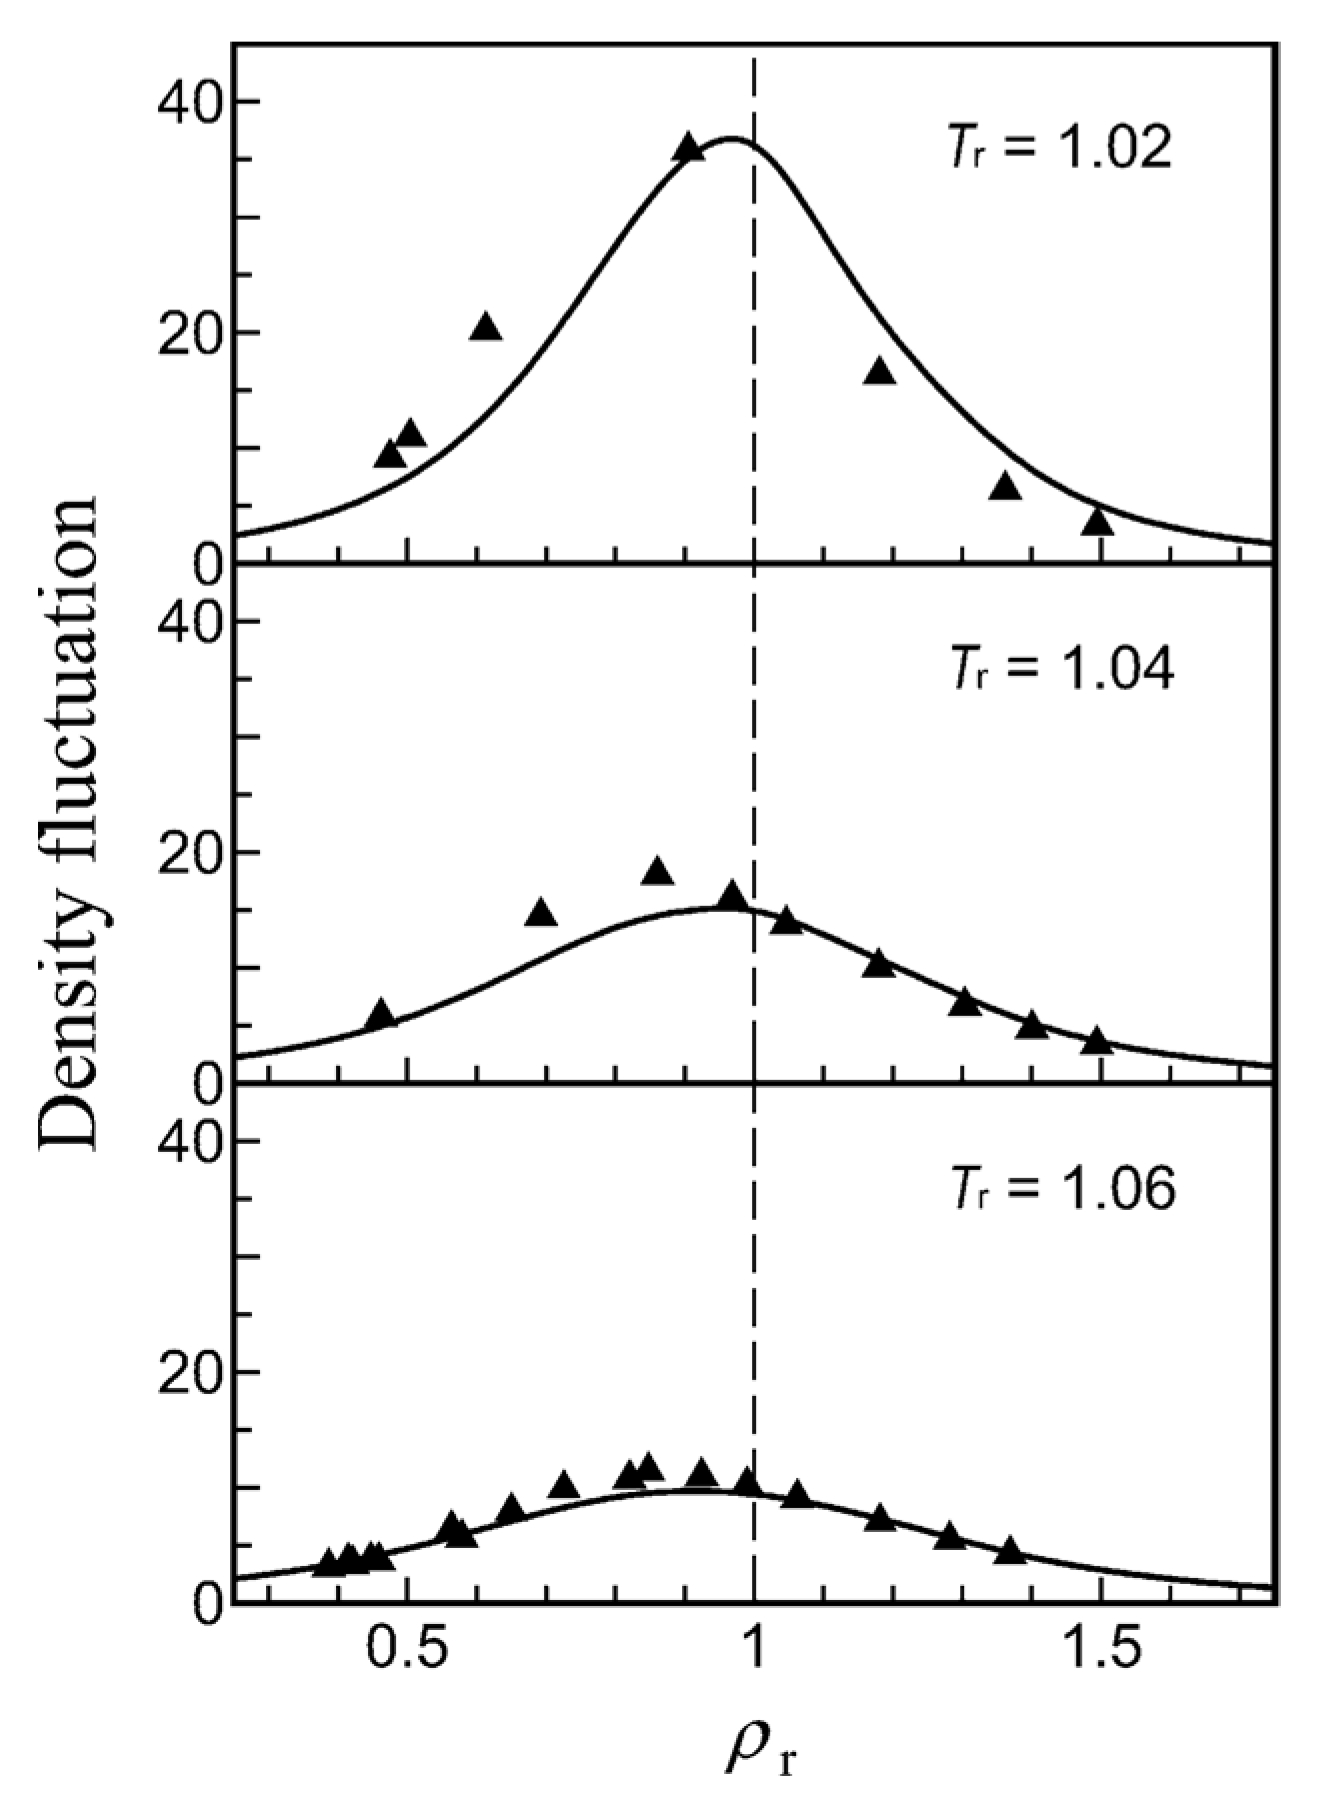
Figure 2.
Behavior of the density fluctuation of SCW on the phase diagram evaluated from the equation of state of Wagner et al. [26]. The green curves are the isotherms of density fluctuation at , and 1.06. The Nishikawa line and the critical isodensity line are described by the red broken line and blue chain line, respectively.
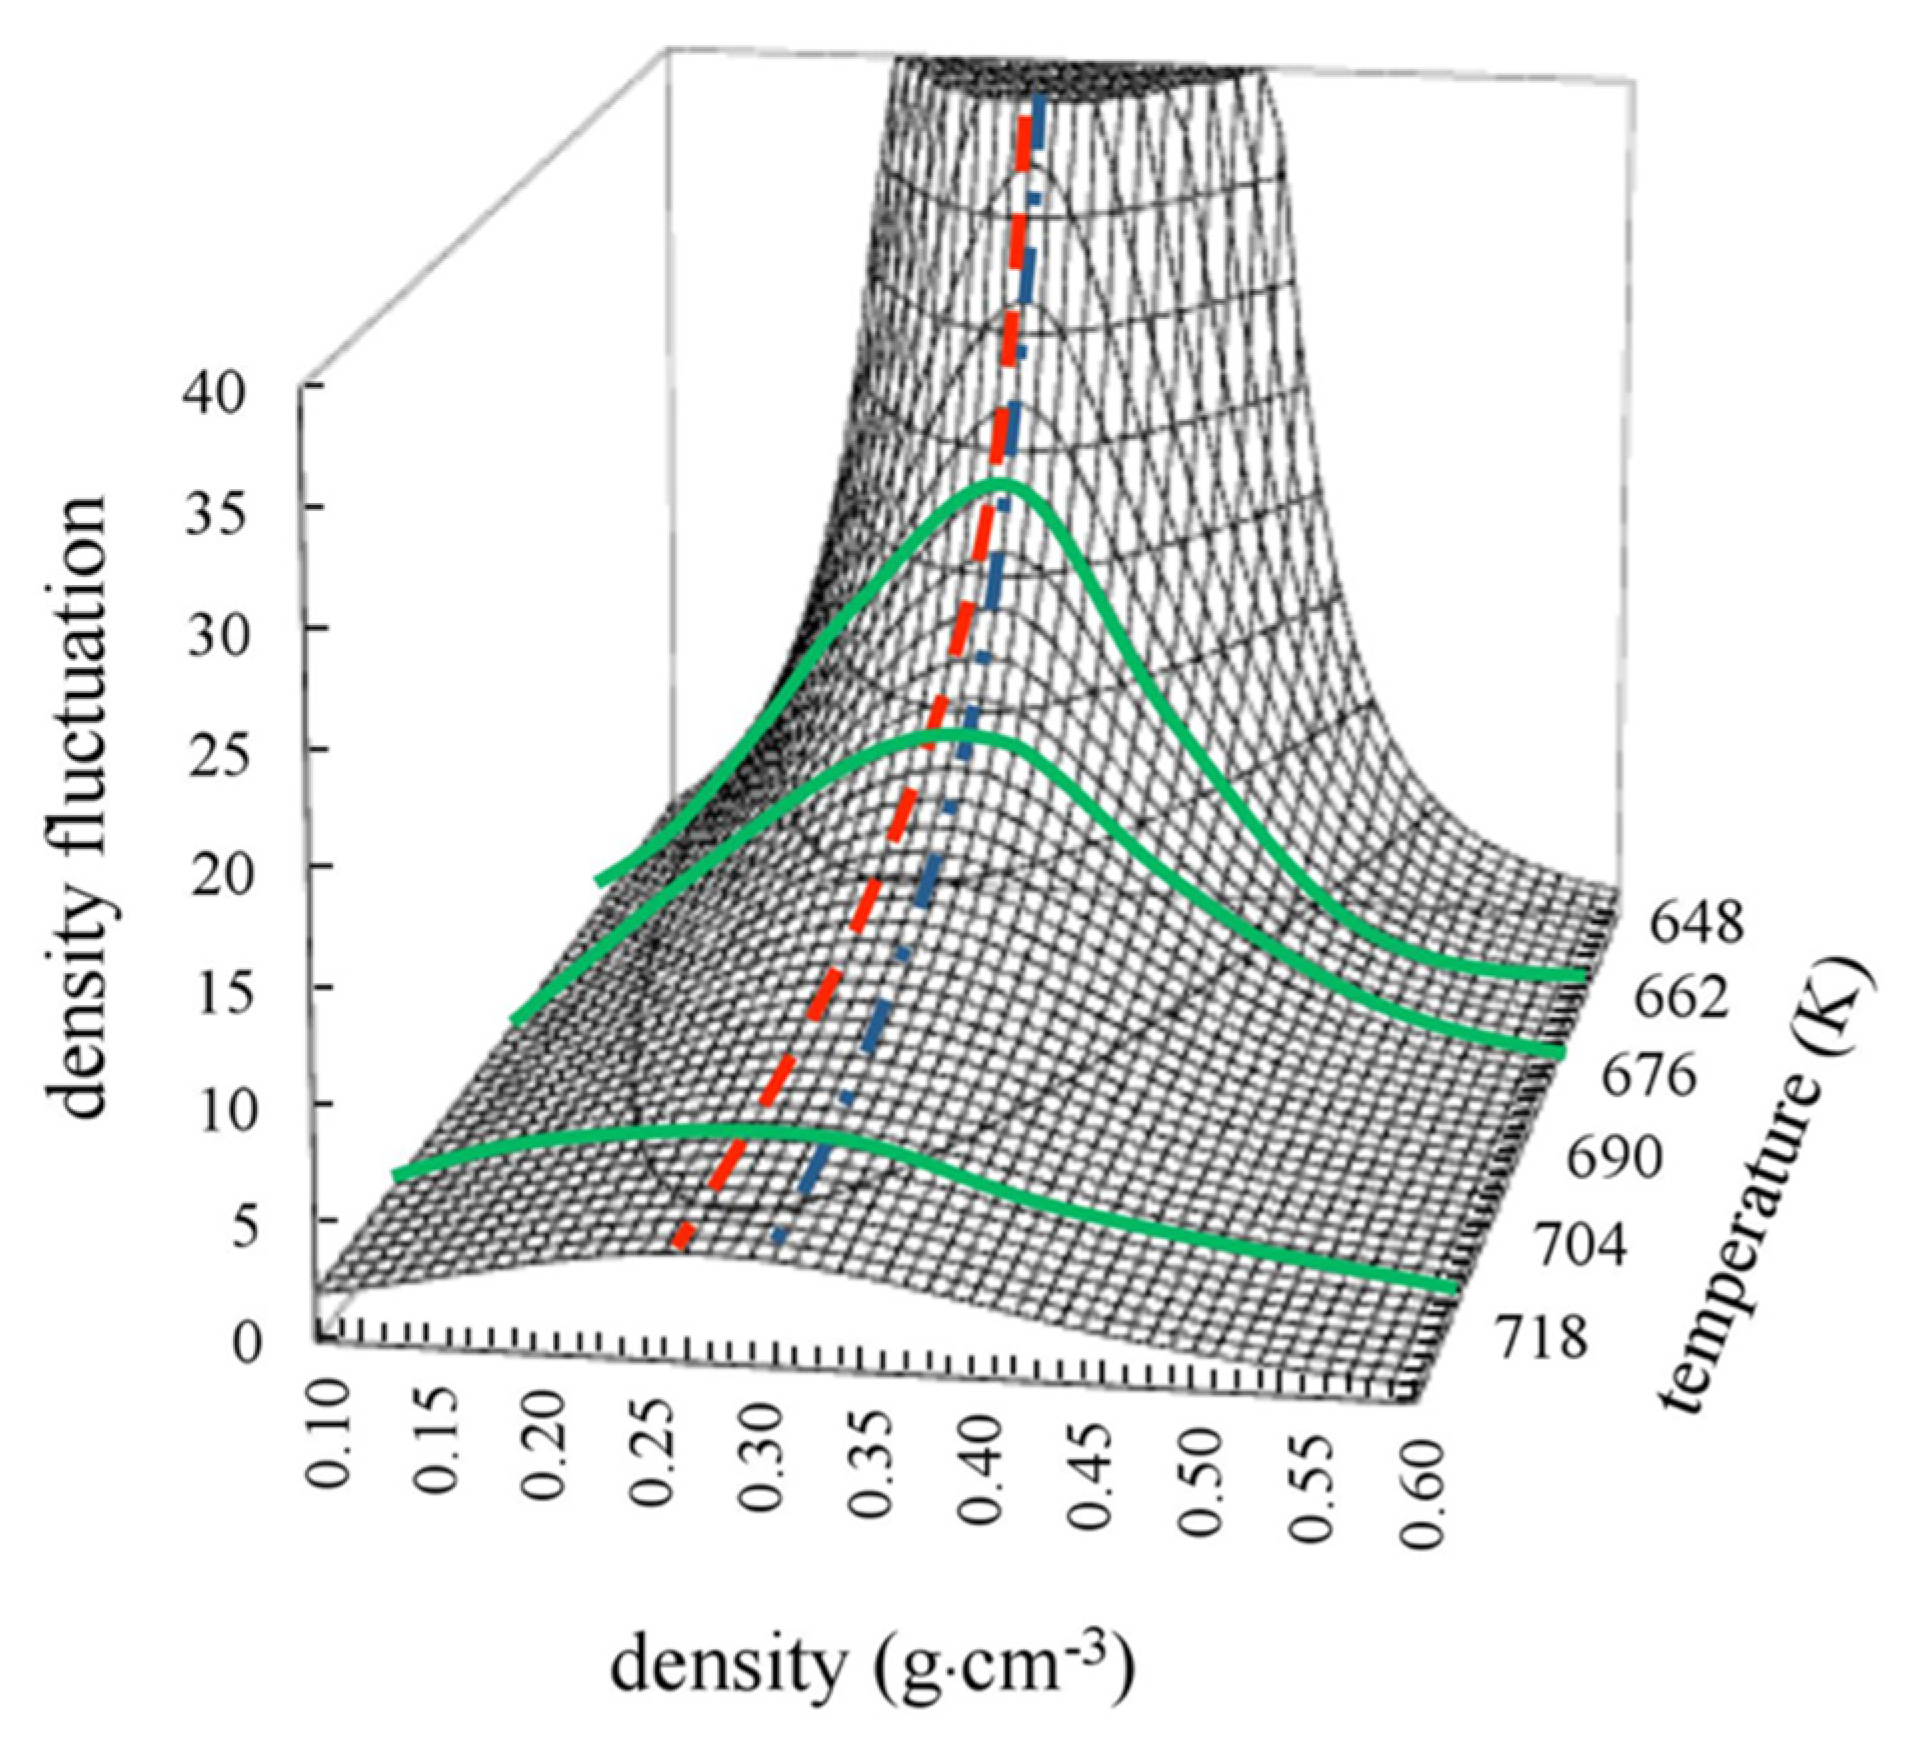
Figure 3.
The isothermal changes of correlation lengths for SCW as a function of density. The symbols of shaded square (■), shaded diamond (◆), open triangle (Δ), shaded inverted triangle (▼), and shaded circle (●) represent isotherms at temperatures T = 660.0, 661.5, 663.0 K (Tr = 1.02), 677.0 K (Tr = 1.05), and 687.5 K (Tr = 1.06), respectively. The chain line denotes the critical density. This figure is reprinted from JCP, 2000, 112, 4203.
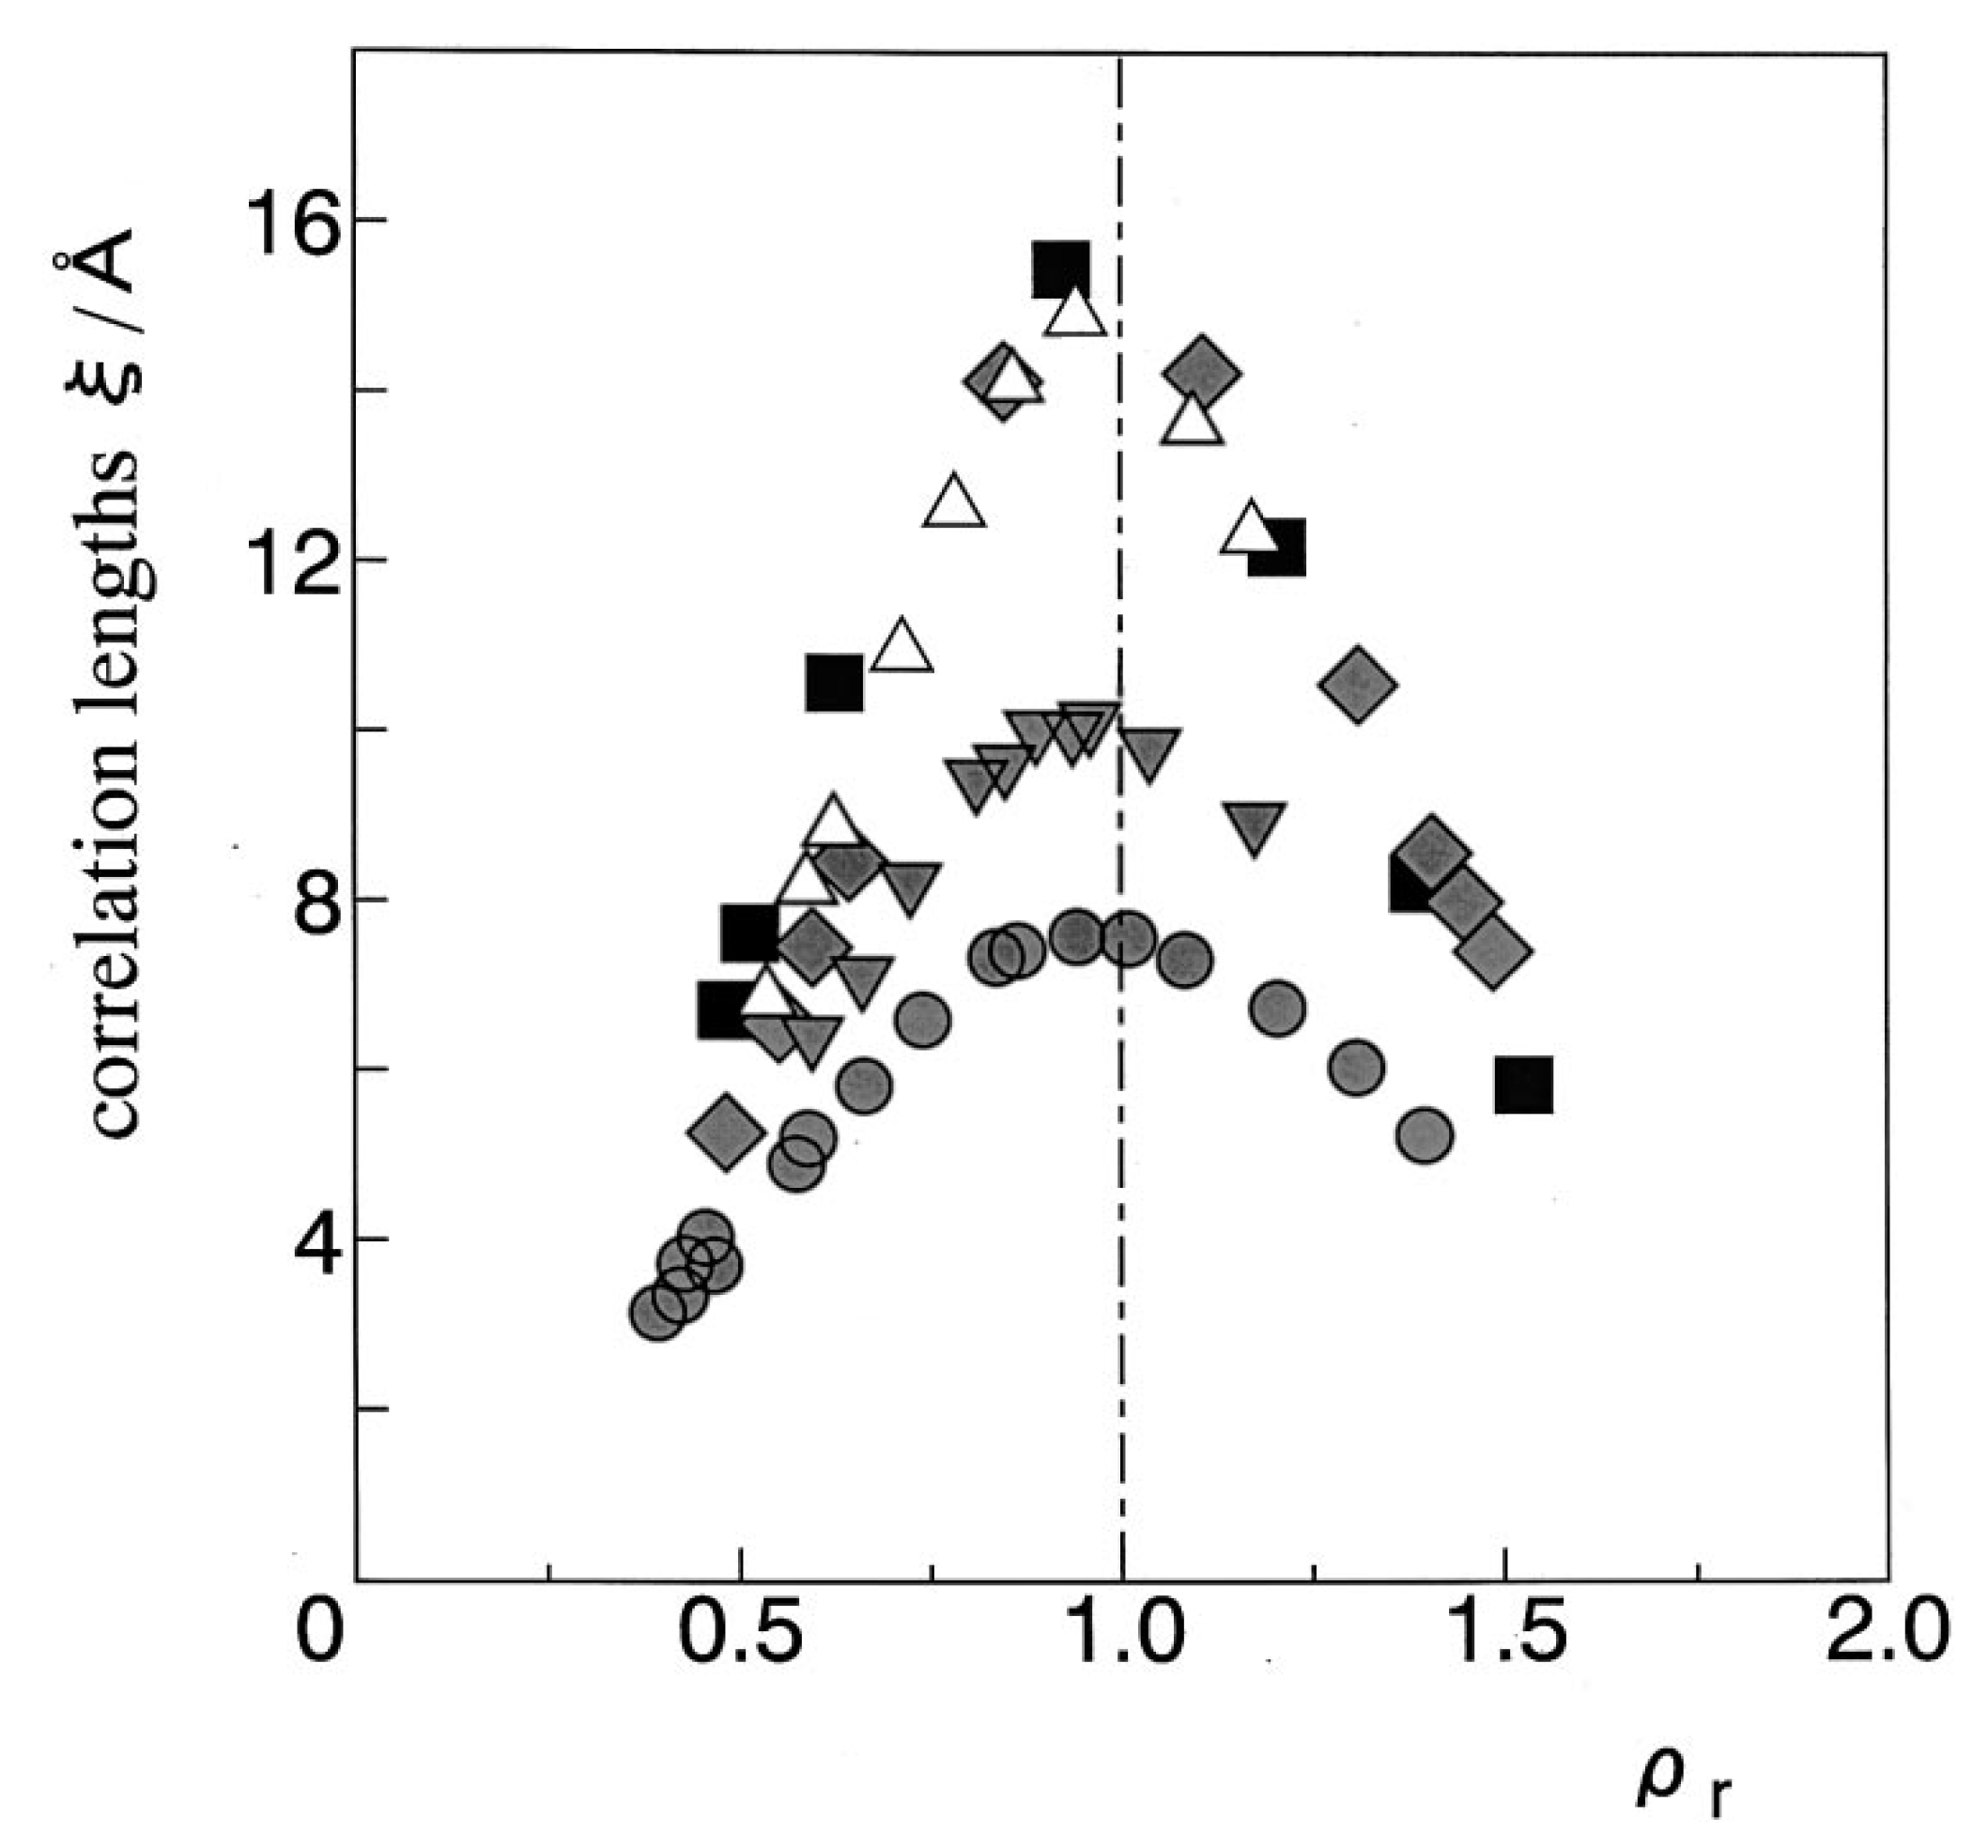
Figure 4.
A comparison of the density fluctuations among H2O (cross), CO2 (triangle), CF3H (circle), C2H4 (asterisk), and benzene (closed diamond) at Tr = 1.02, 1.04, and 1.06. This figure is reprinted from JCP, 2003, 119, 1502.
Figure 4.
A comparison of the density fluctuations among H2O (cross), CO2 (triangle), CF3H (circle), C2H4 (asterisk), and benzene (closed diamond) at Tr = 1.02, 1.04, and 1.06. This figure is reprinted from JCP, 2003, 119, 1502.
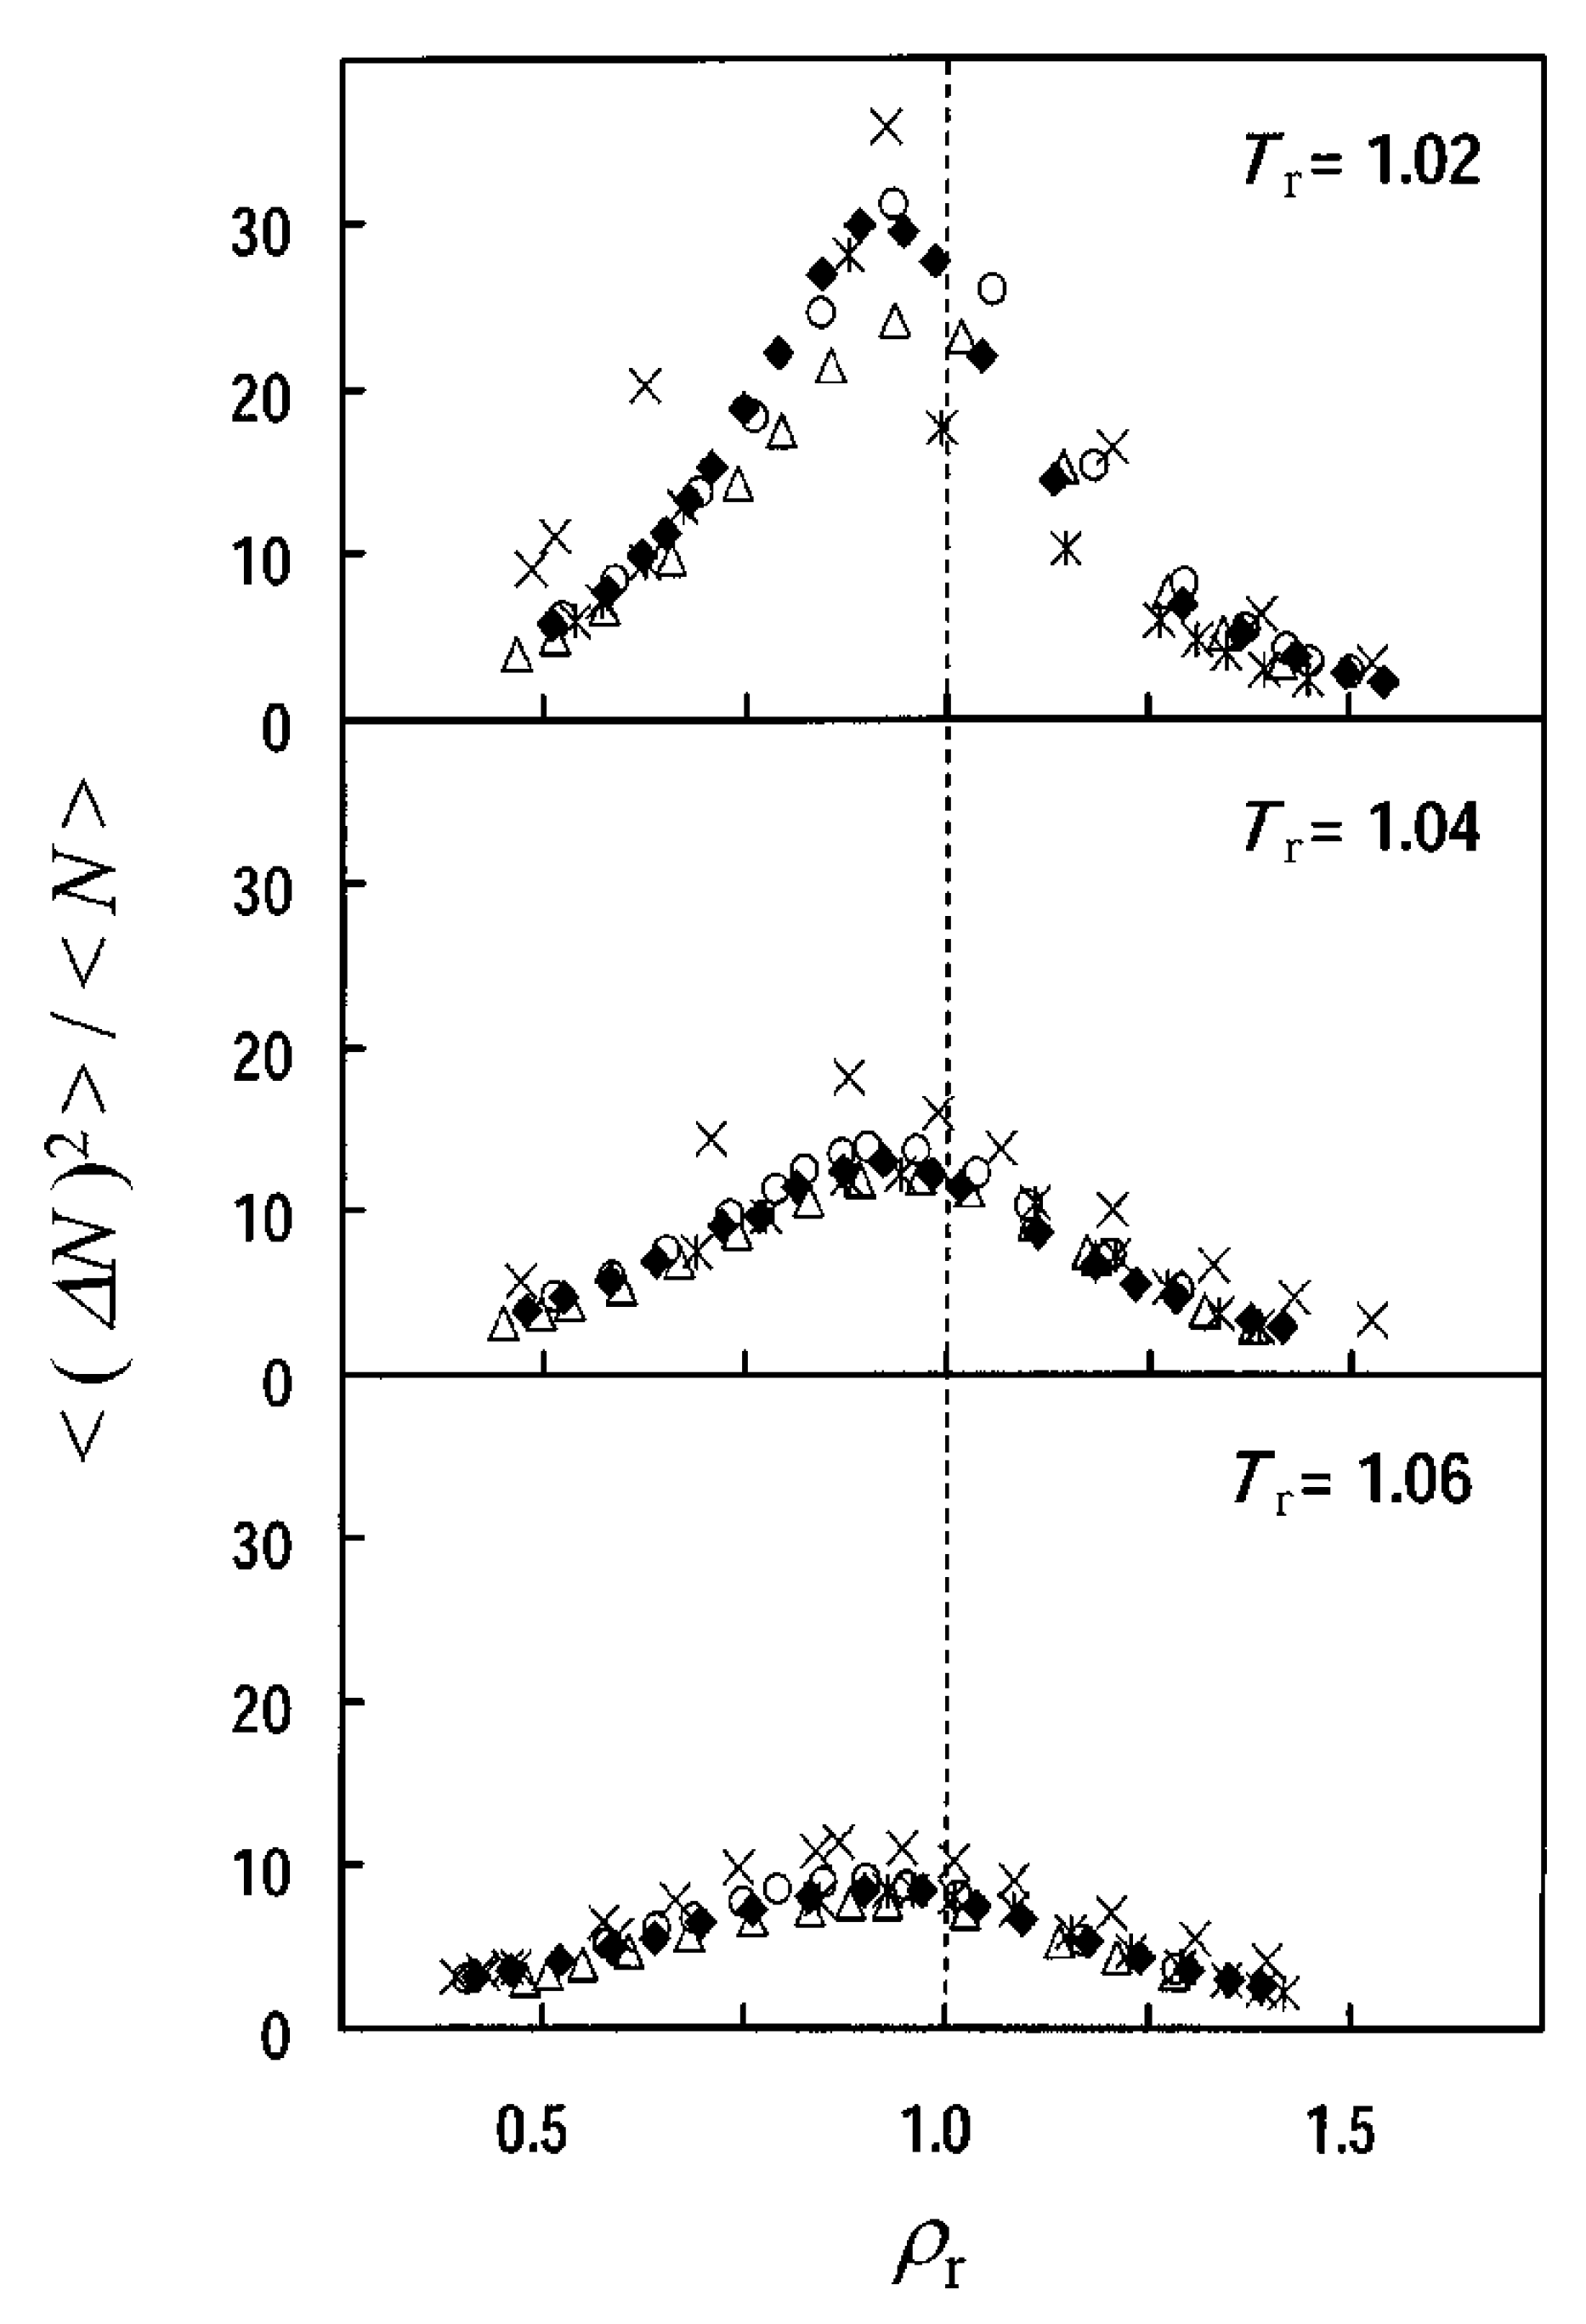
Figure 5.
A comparison of the normalized correlation lengths among H2O (cross), CO2 (triangle), CF3H (circle), C2H4 (asterisk), and benzene (closed diamond) at Tr = 1.02, 1.04, and 1.06. This figure is reprinted from JCP, 2003, 119, 1502.
Figure 5.
A comparison of the normalized correlation lengths among H2O (cross), CO2 (triangle), CF3H (circle), C2H4 (asterisk), and benzene (closed diamond) at Tr = 1.02, 1.04, and 1.06. This figure is reprinted from JCP, 2003, 119, 1502.
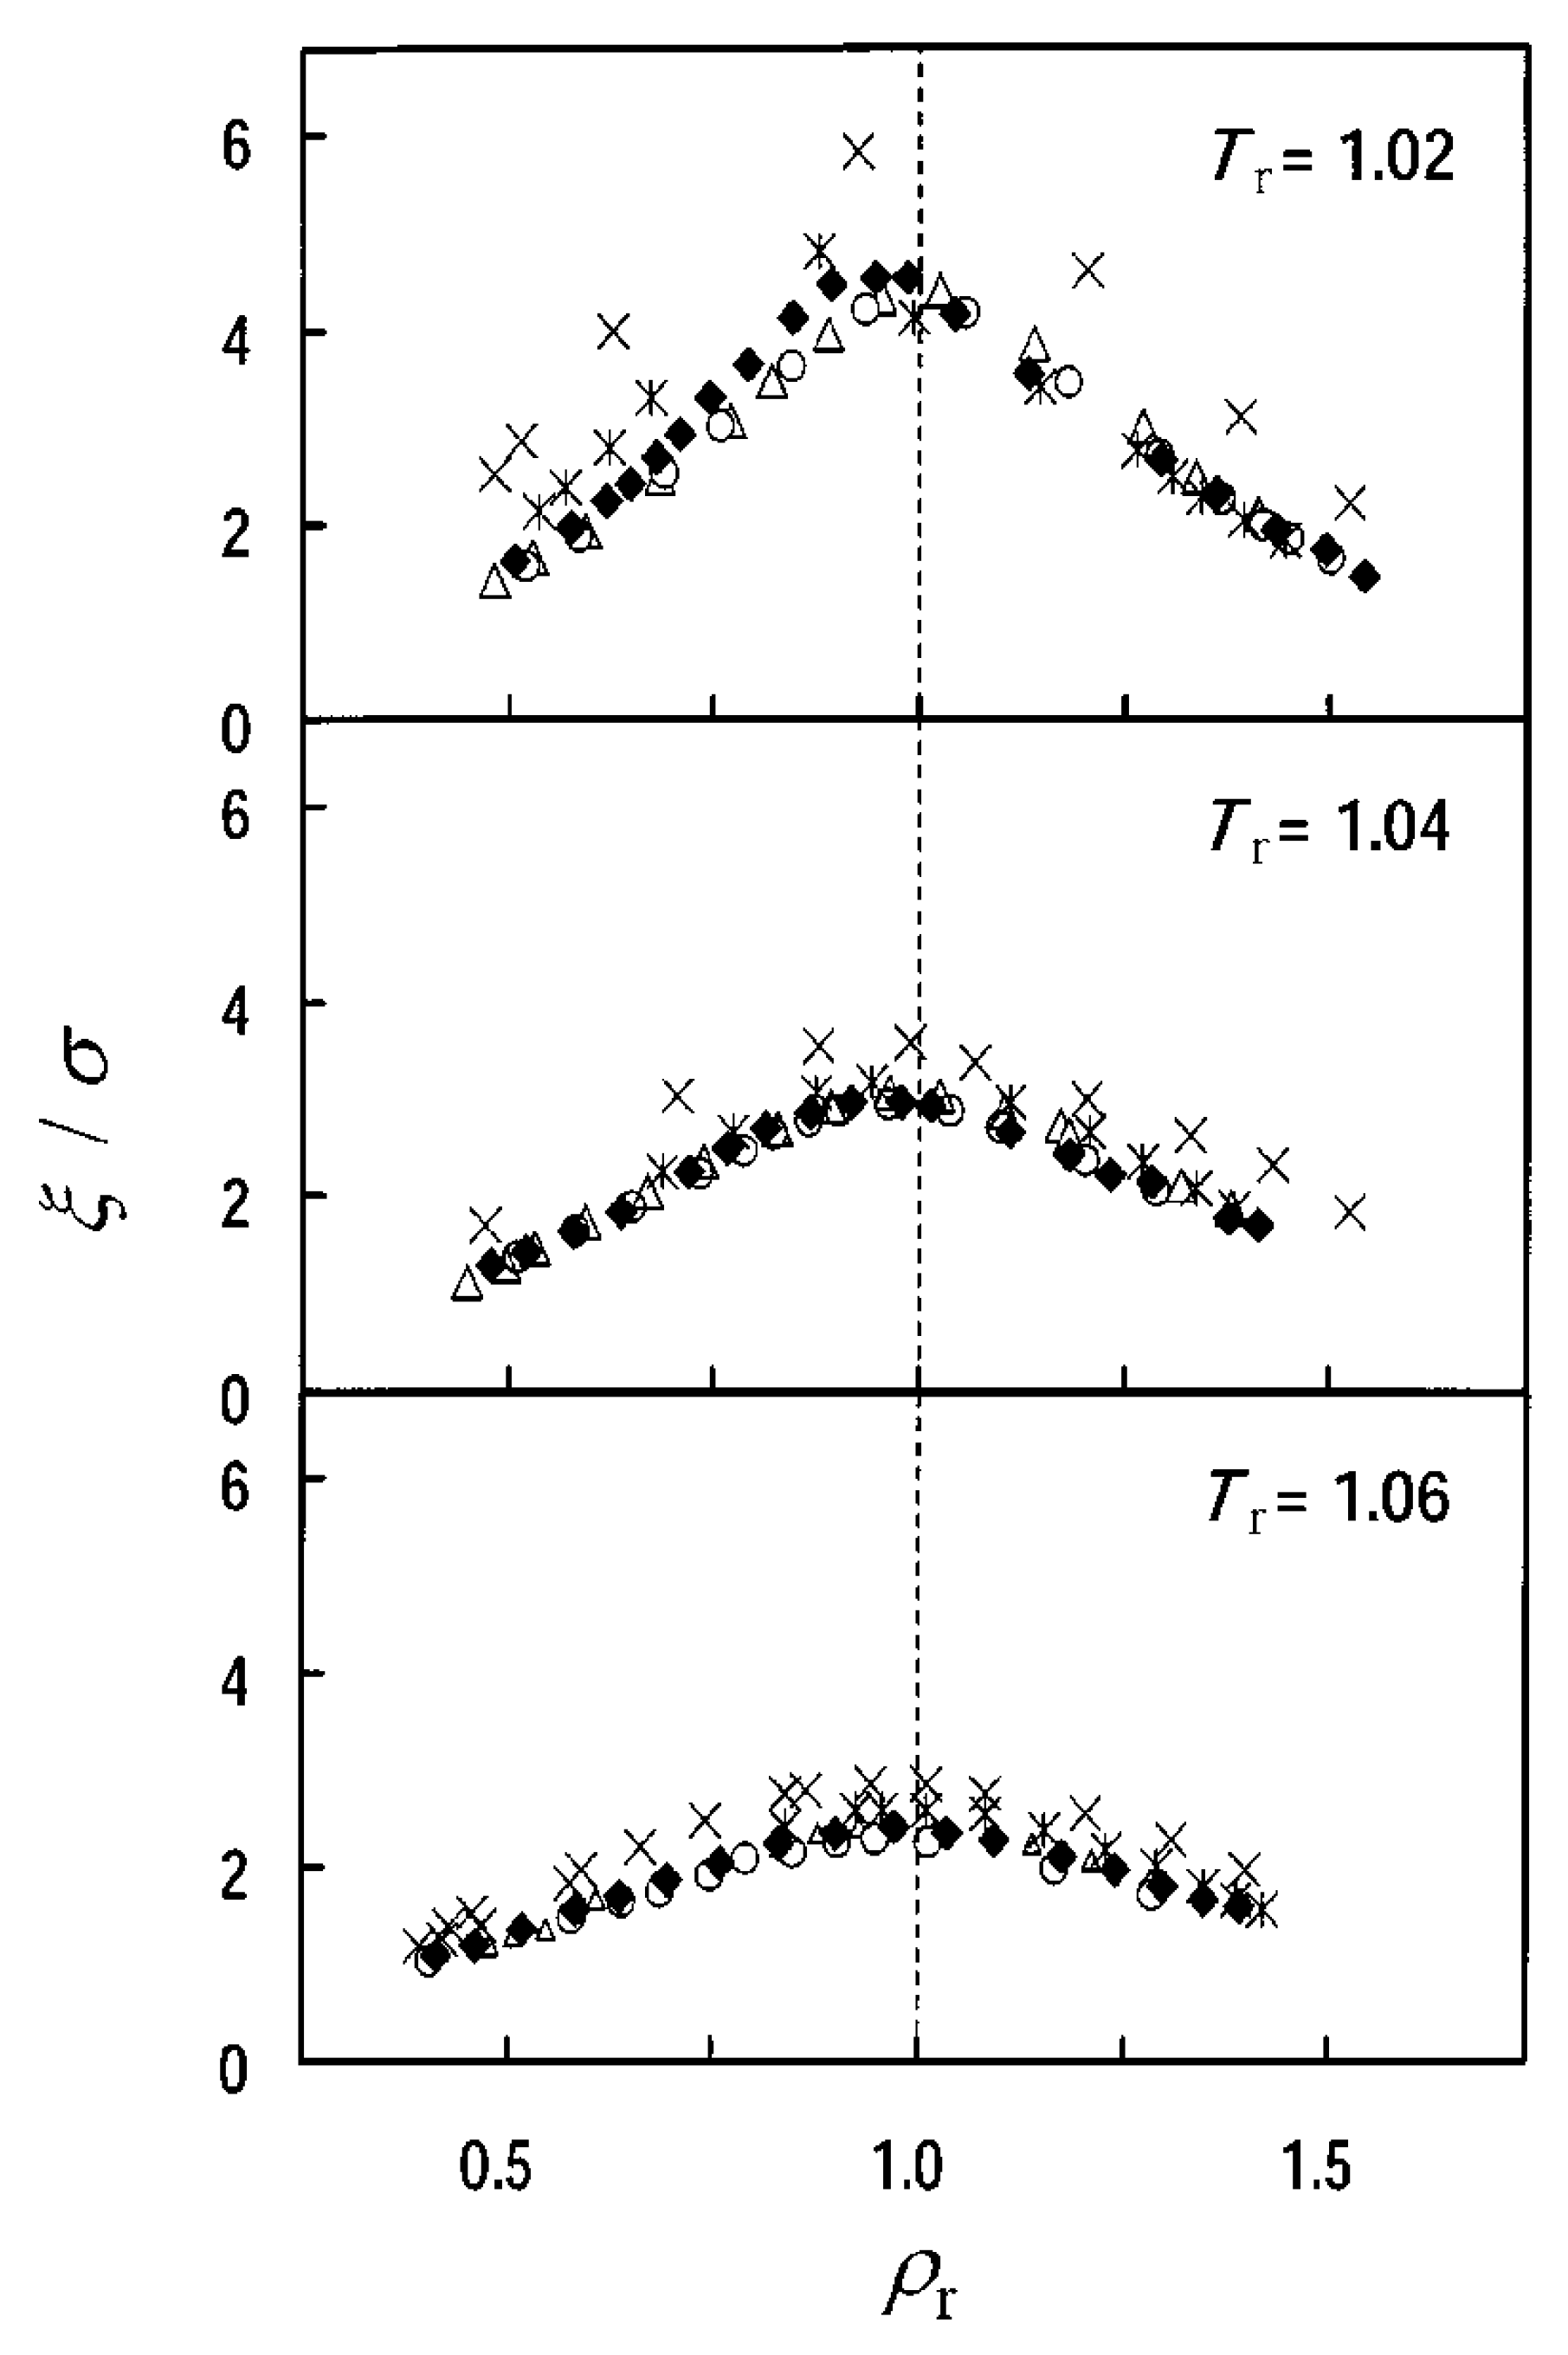
Figure 6.
Pressure isotherms evaluated using the RISM–KH theory. This figure is reprinted with permission from JCP, 2014, 140, 104511. Copyright 2014 AIP Publishing.
Figure 6.
Pressure isotherms evaluated using the RISM–KH theory. This figure is reprinted with permission from JCP, 2014, 140, 104511. Copyright 2014 AIP Publishing.
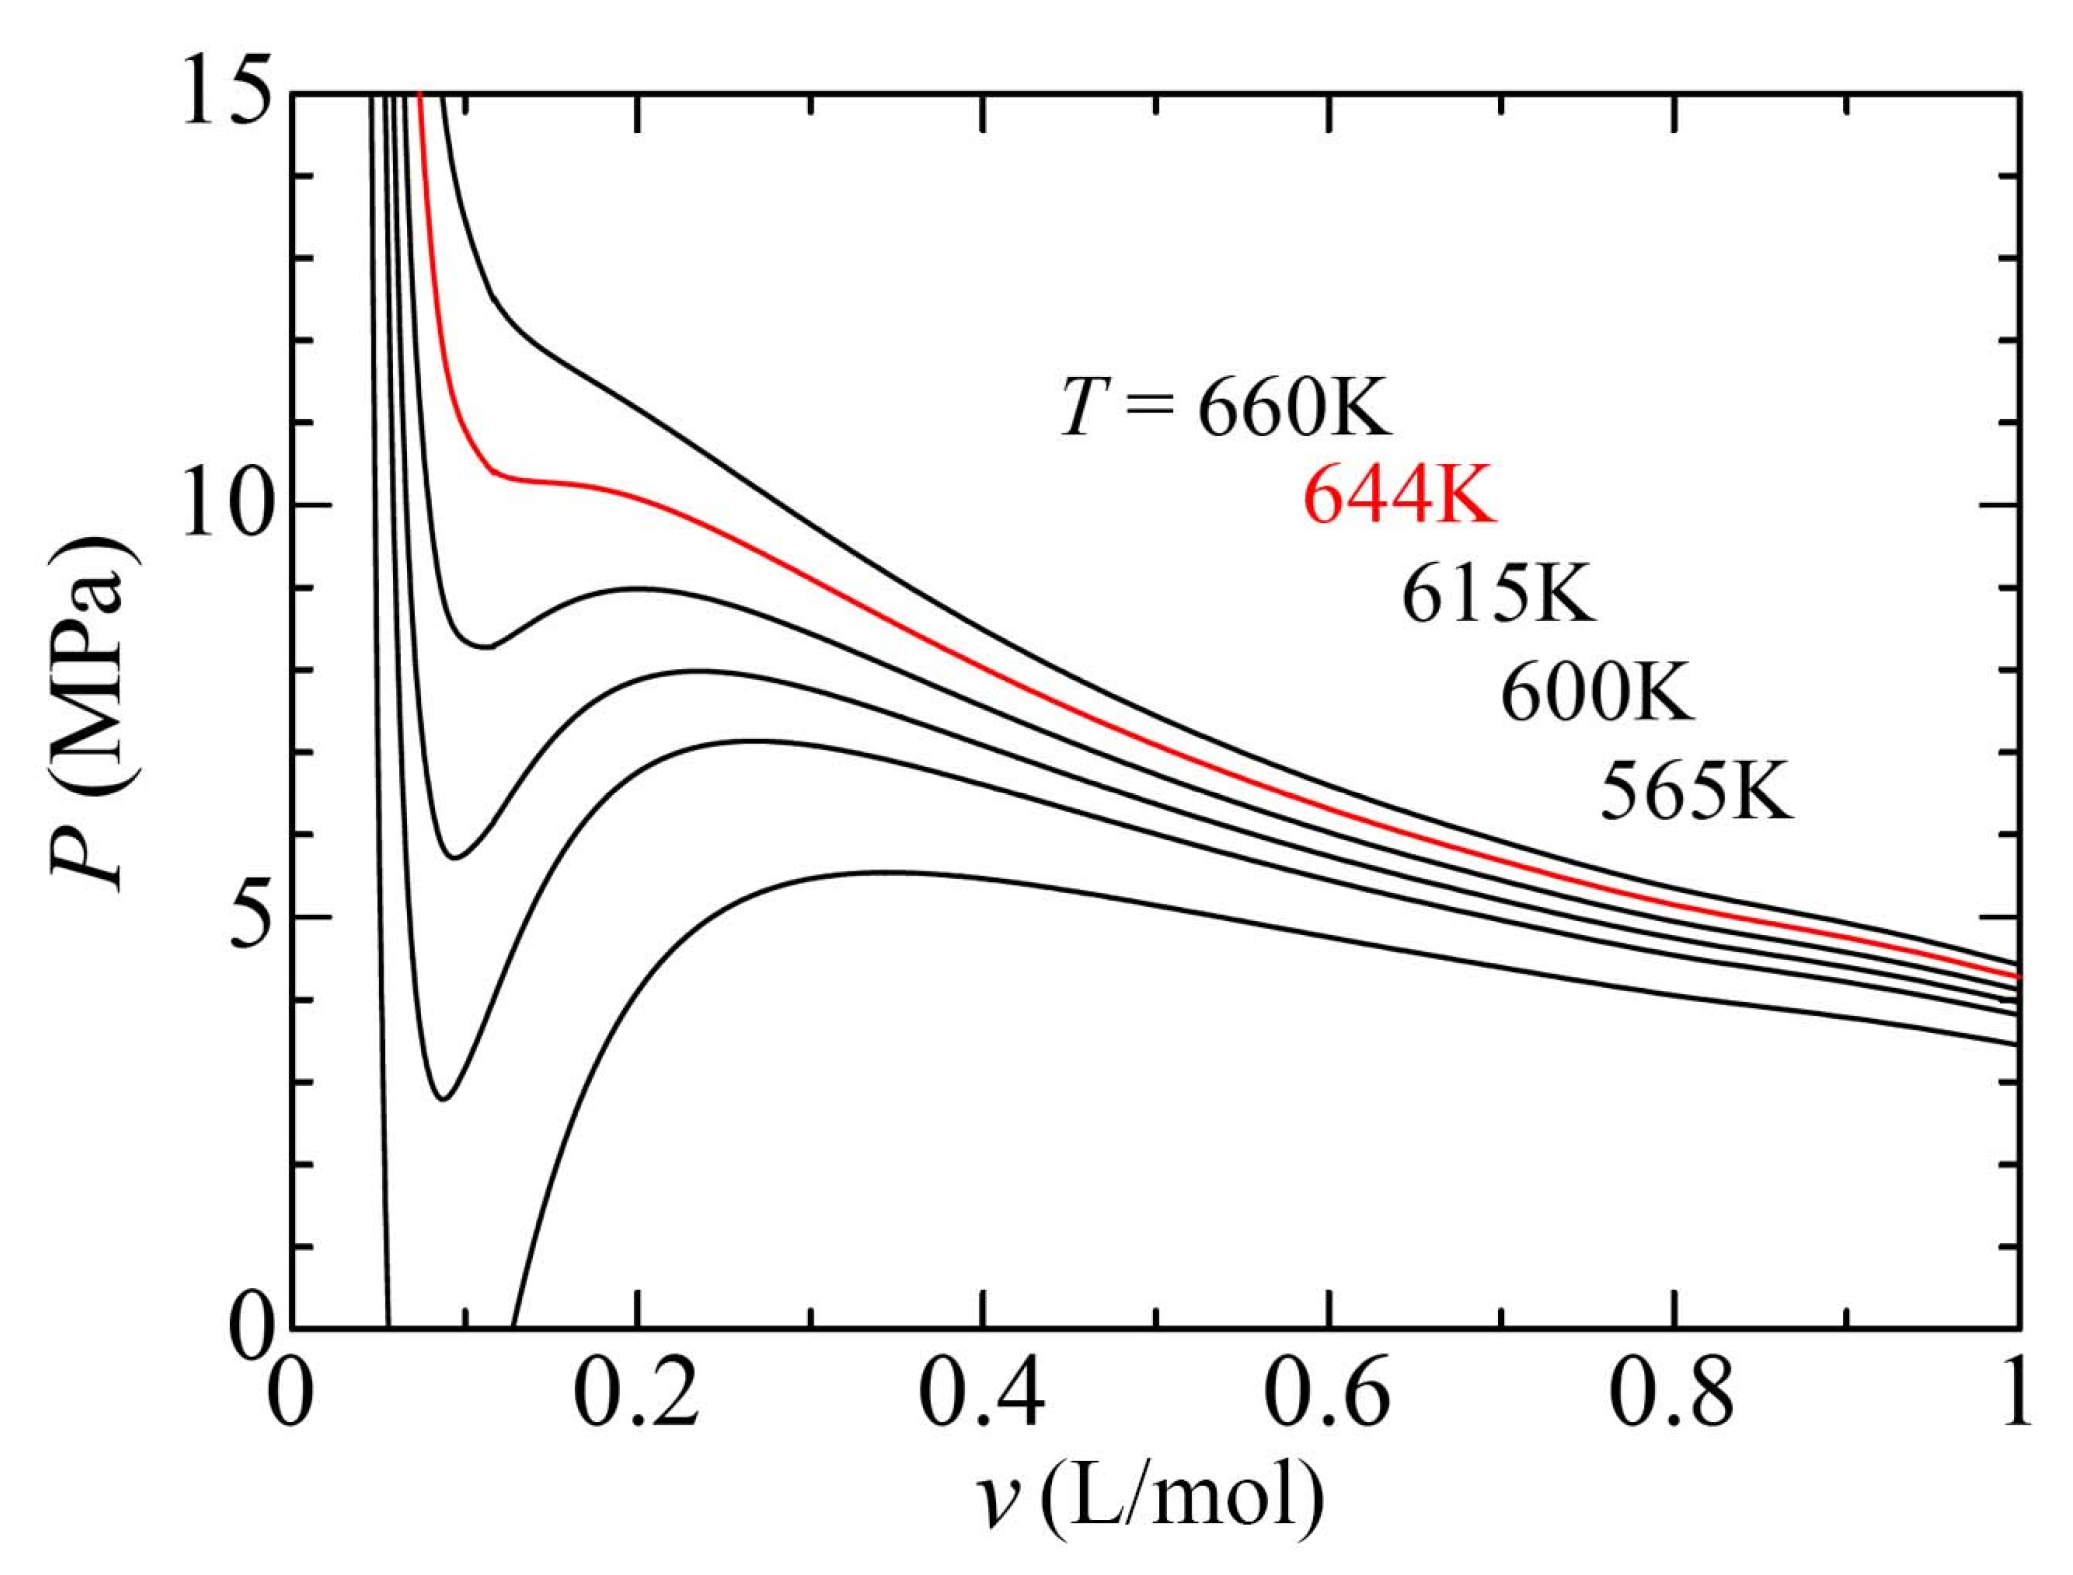
Figure 7.
Behavior of the density fluctuation of supercritical H2O on the phase diagram evaluated using RISM–KH theory. This figure is reprinted with permission from JCP, 2014, 140, 104511. Copyright 2014 AIP Publishing.
Figure 7.
Behavior of the density fluctuation of supercritical H2O on the phase diagram evaluated using RISM–KH theory. This figure is reprinted with permission from JCP, 2014, 140, 104511. Copyright 2014 AIP Publishing.
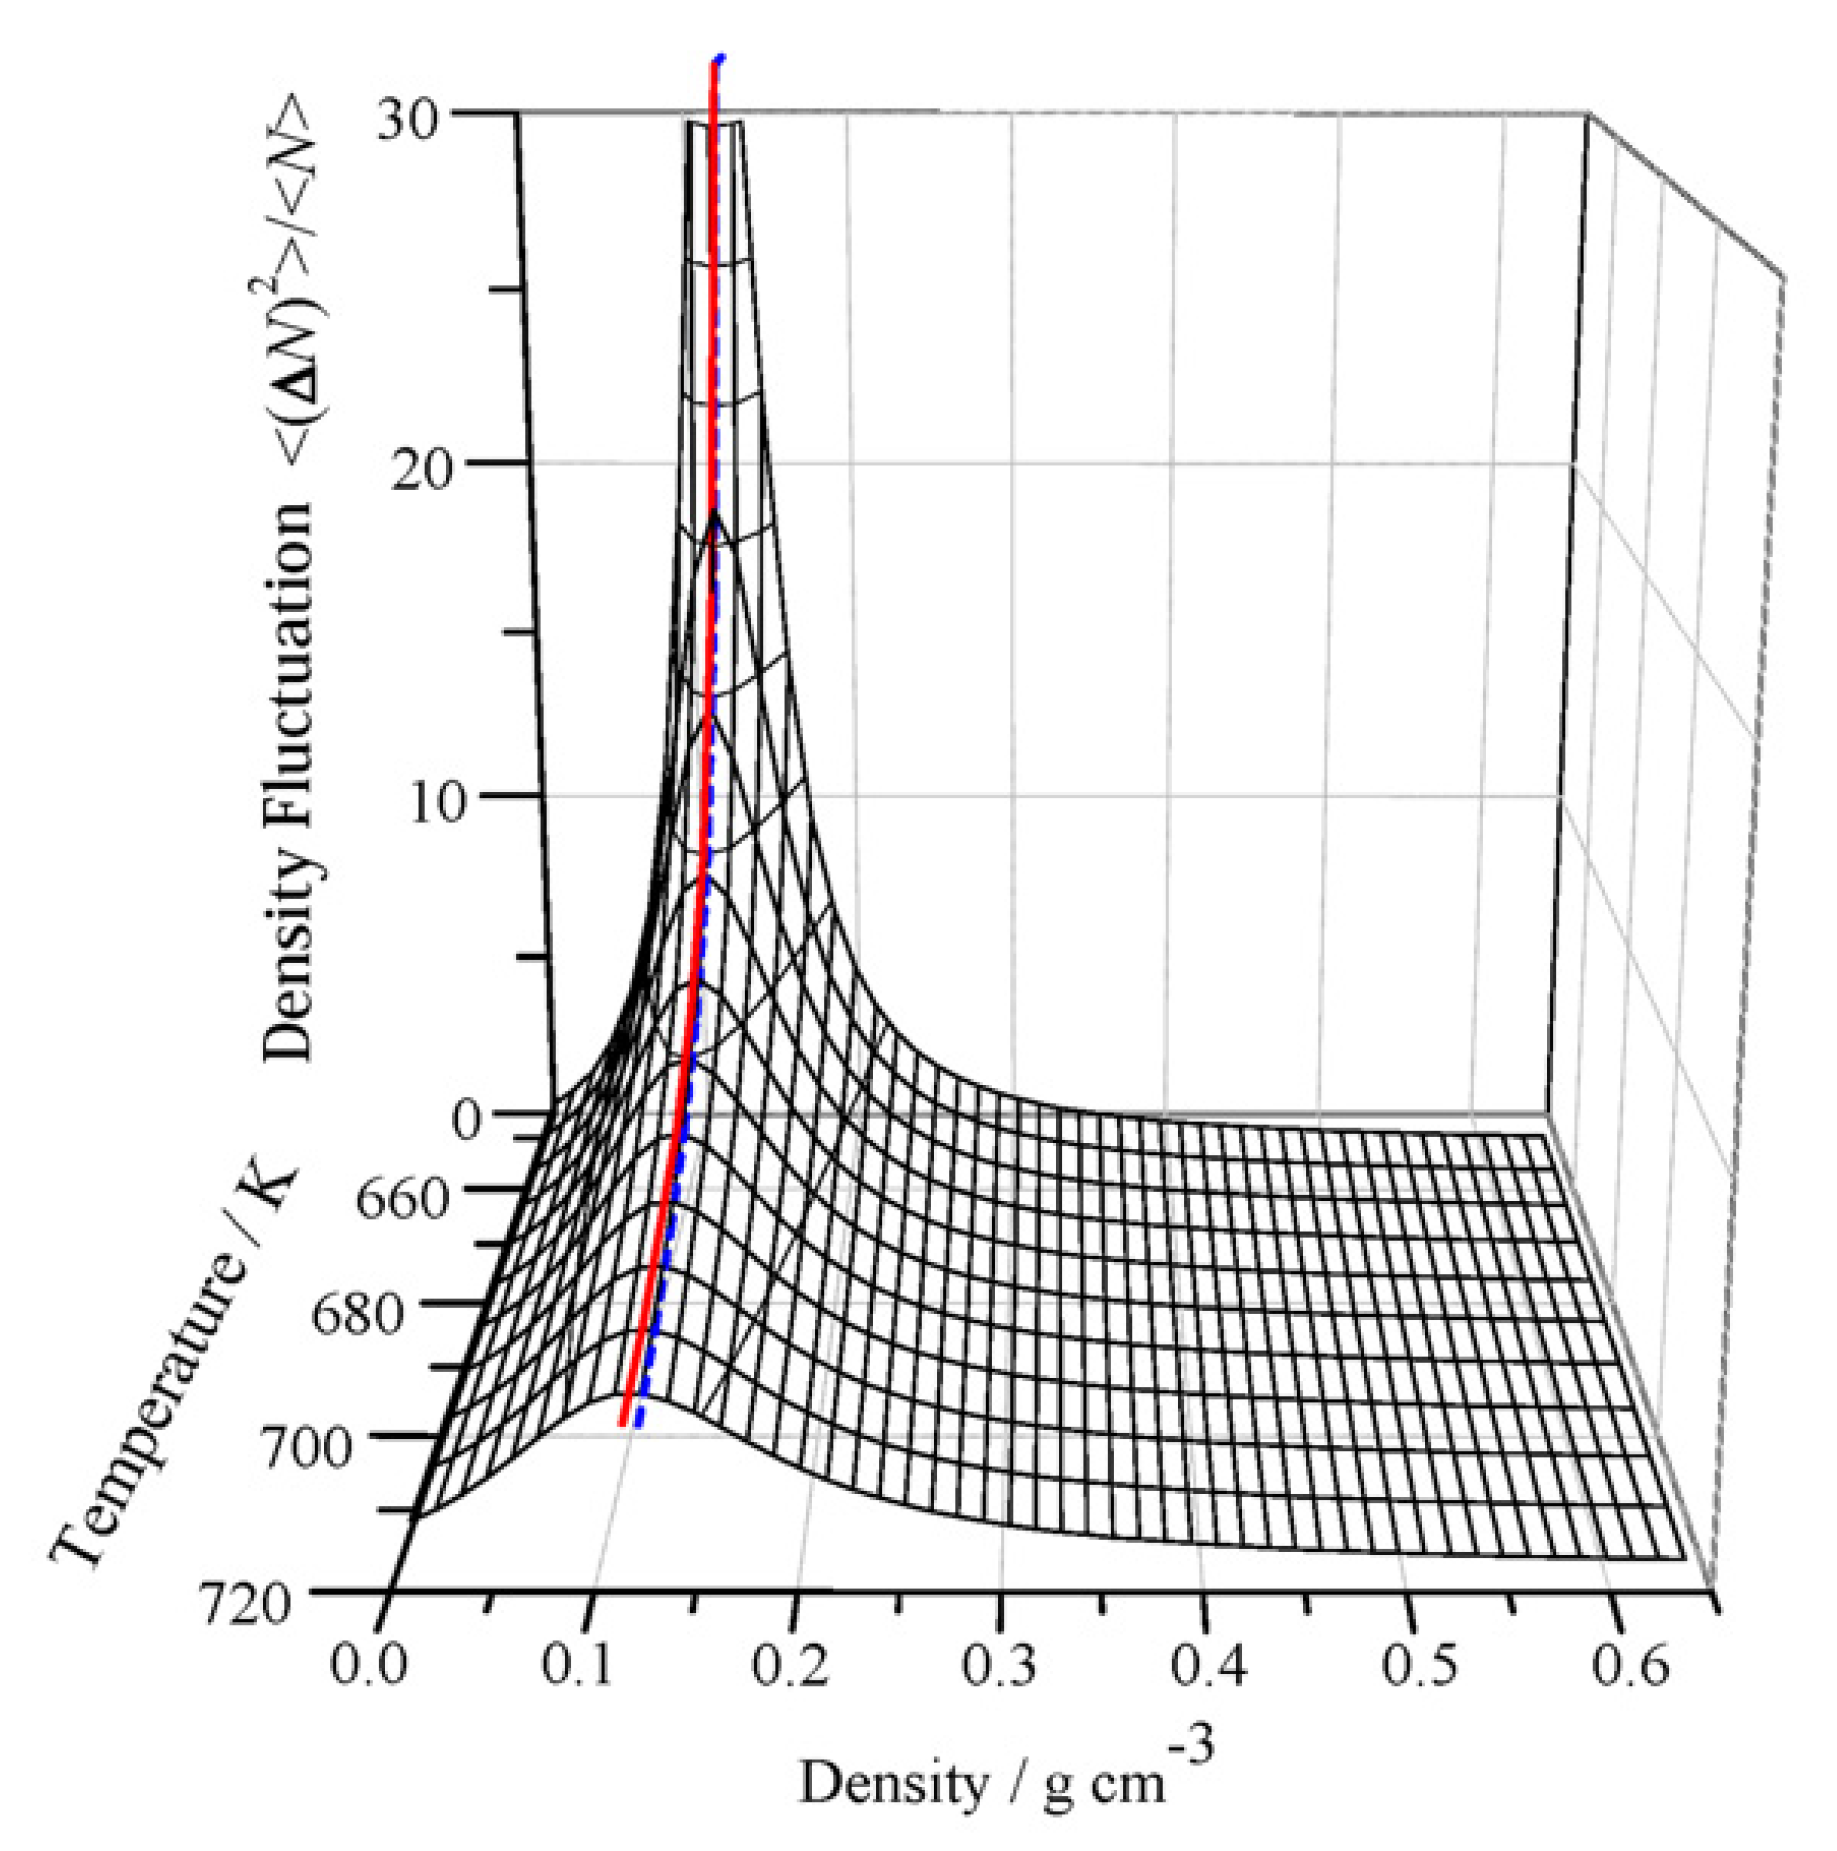
Figure 8.
Density dependence of the RDFs between O–O, gOO, O–H, gOH, and H–H, gHH, along an isotherm at 644 K. The results are plotted for the fluid at seven state points. Numbers in parentheses in the figures denote the value of density fluctuation at that point. (a–c) are plotted for different ranges, namely from 0 to 20 Å in (a), from 0 to 20 Å with y-axis from 0.8 to 1.7 in (b), and from 7 to 25 Å in (c). These figures are reprinted with permission from JCP, 2014, 140, 104511. Copyright 2014 AIP Publishing.
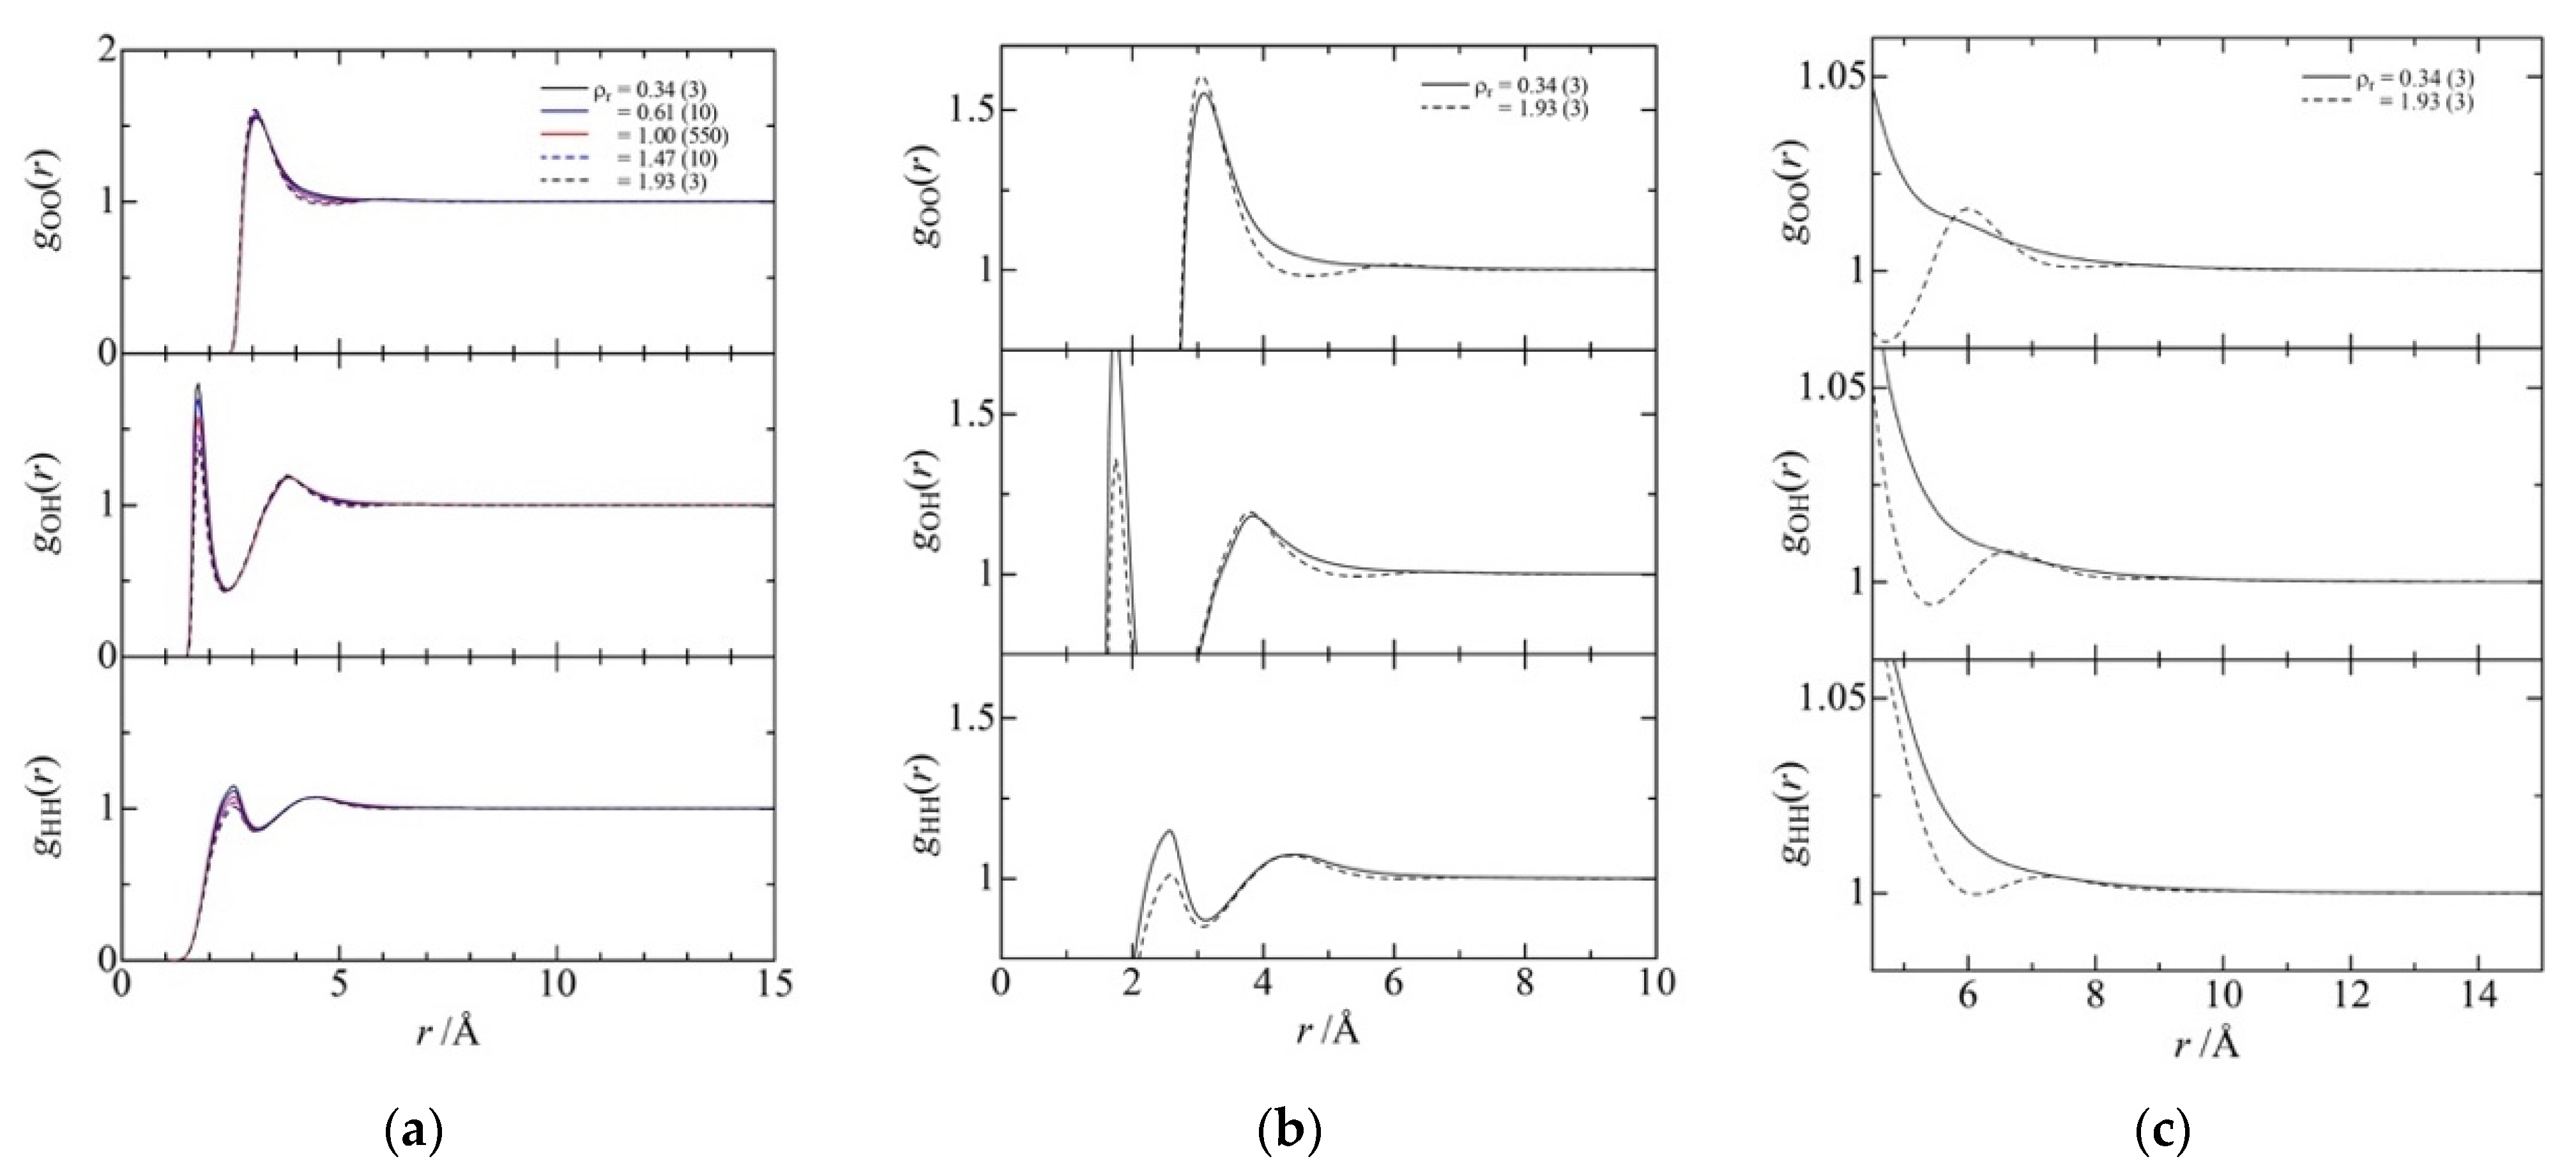
Figure 9.
The RDFs for the O–O site pair on the ridge over a wide range of site–site separations. Numbers in parentheses in the figure legend denote the relative number density and the value of density fluctuation at that point, respectively. This figure is reprinted with permission from JCP, 2014, 140, 104511. Copyright 2014 AIP Publishing.
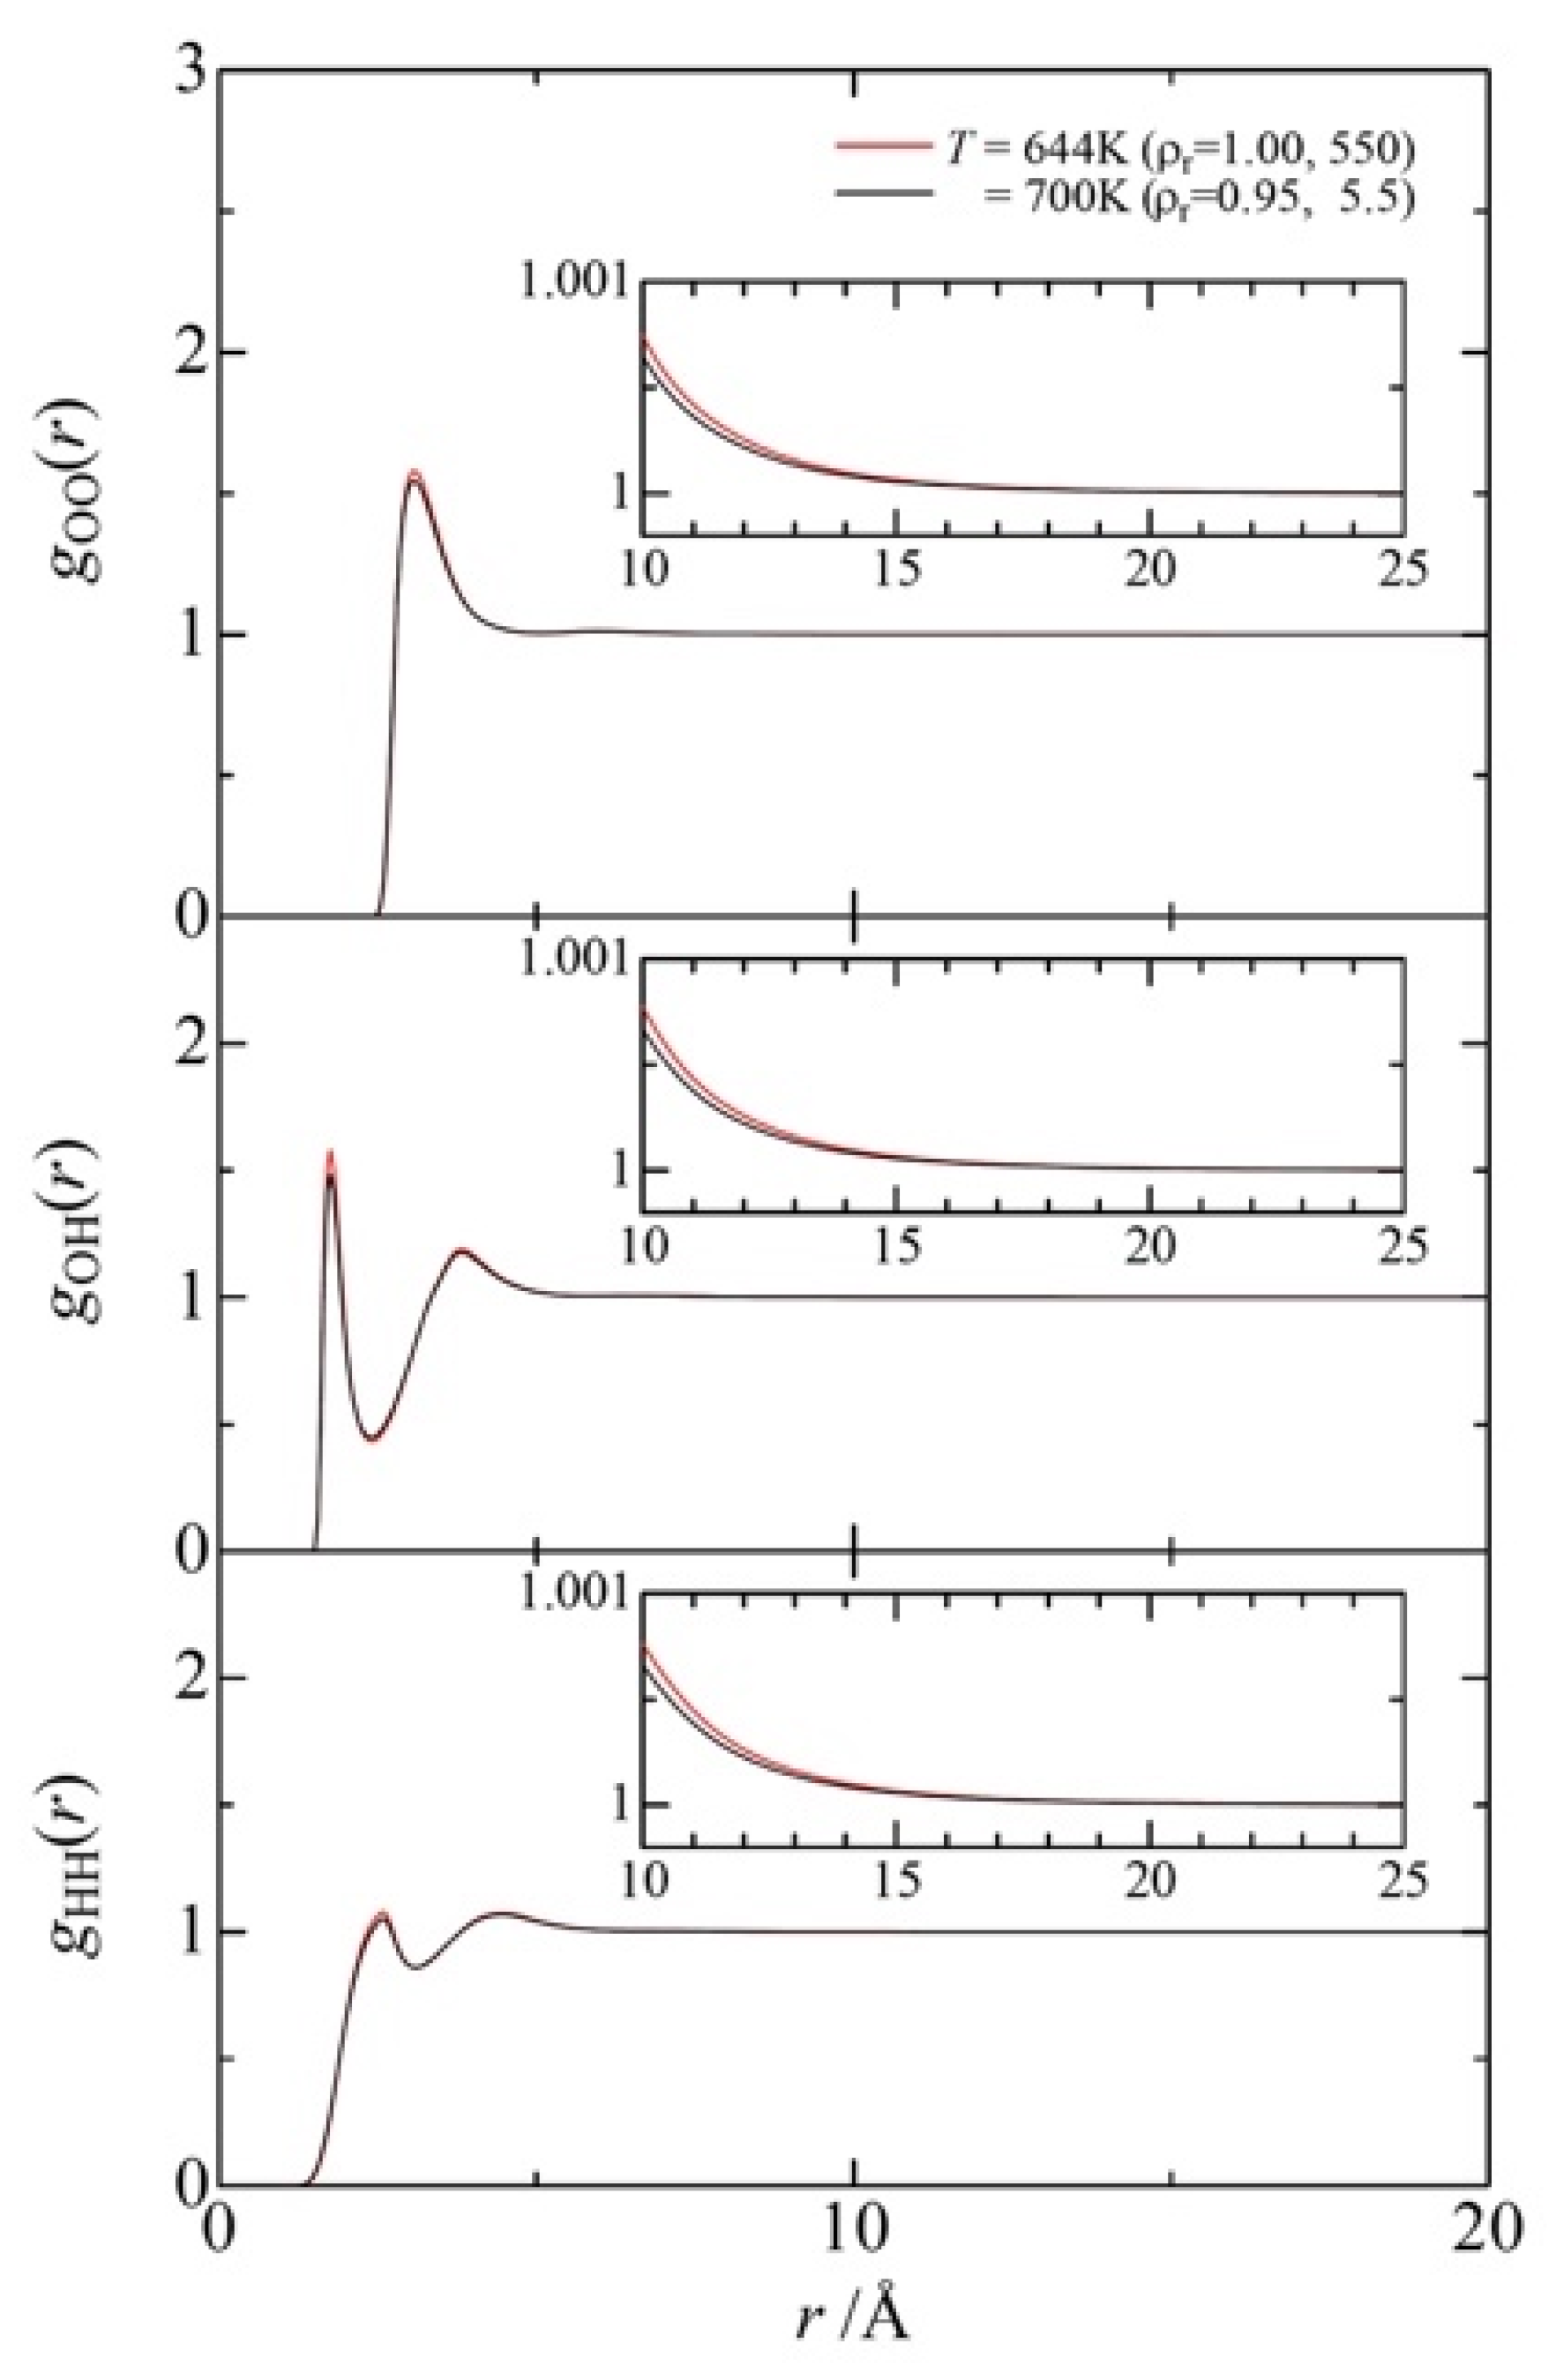
Figure 10.
Deviation of the dipole moment relative to values in the isolated molecule (shown in Debye units). This figure is reprinted with permission from JCP, 1999, 111, 8545. Copyright 1999 AIP Publishing.
Figure 10.
Deviation of the dipole moment relative to values in the isolated molecule (shown in Debye units). This figure is reprinted with permission from JCP, 1999, 111, 8545. Copyright 1999 AIP Publishing.
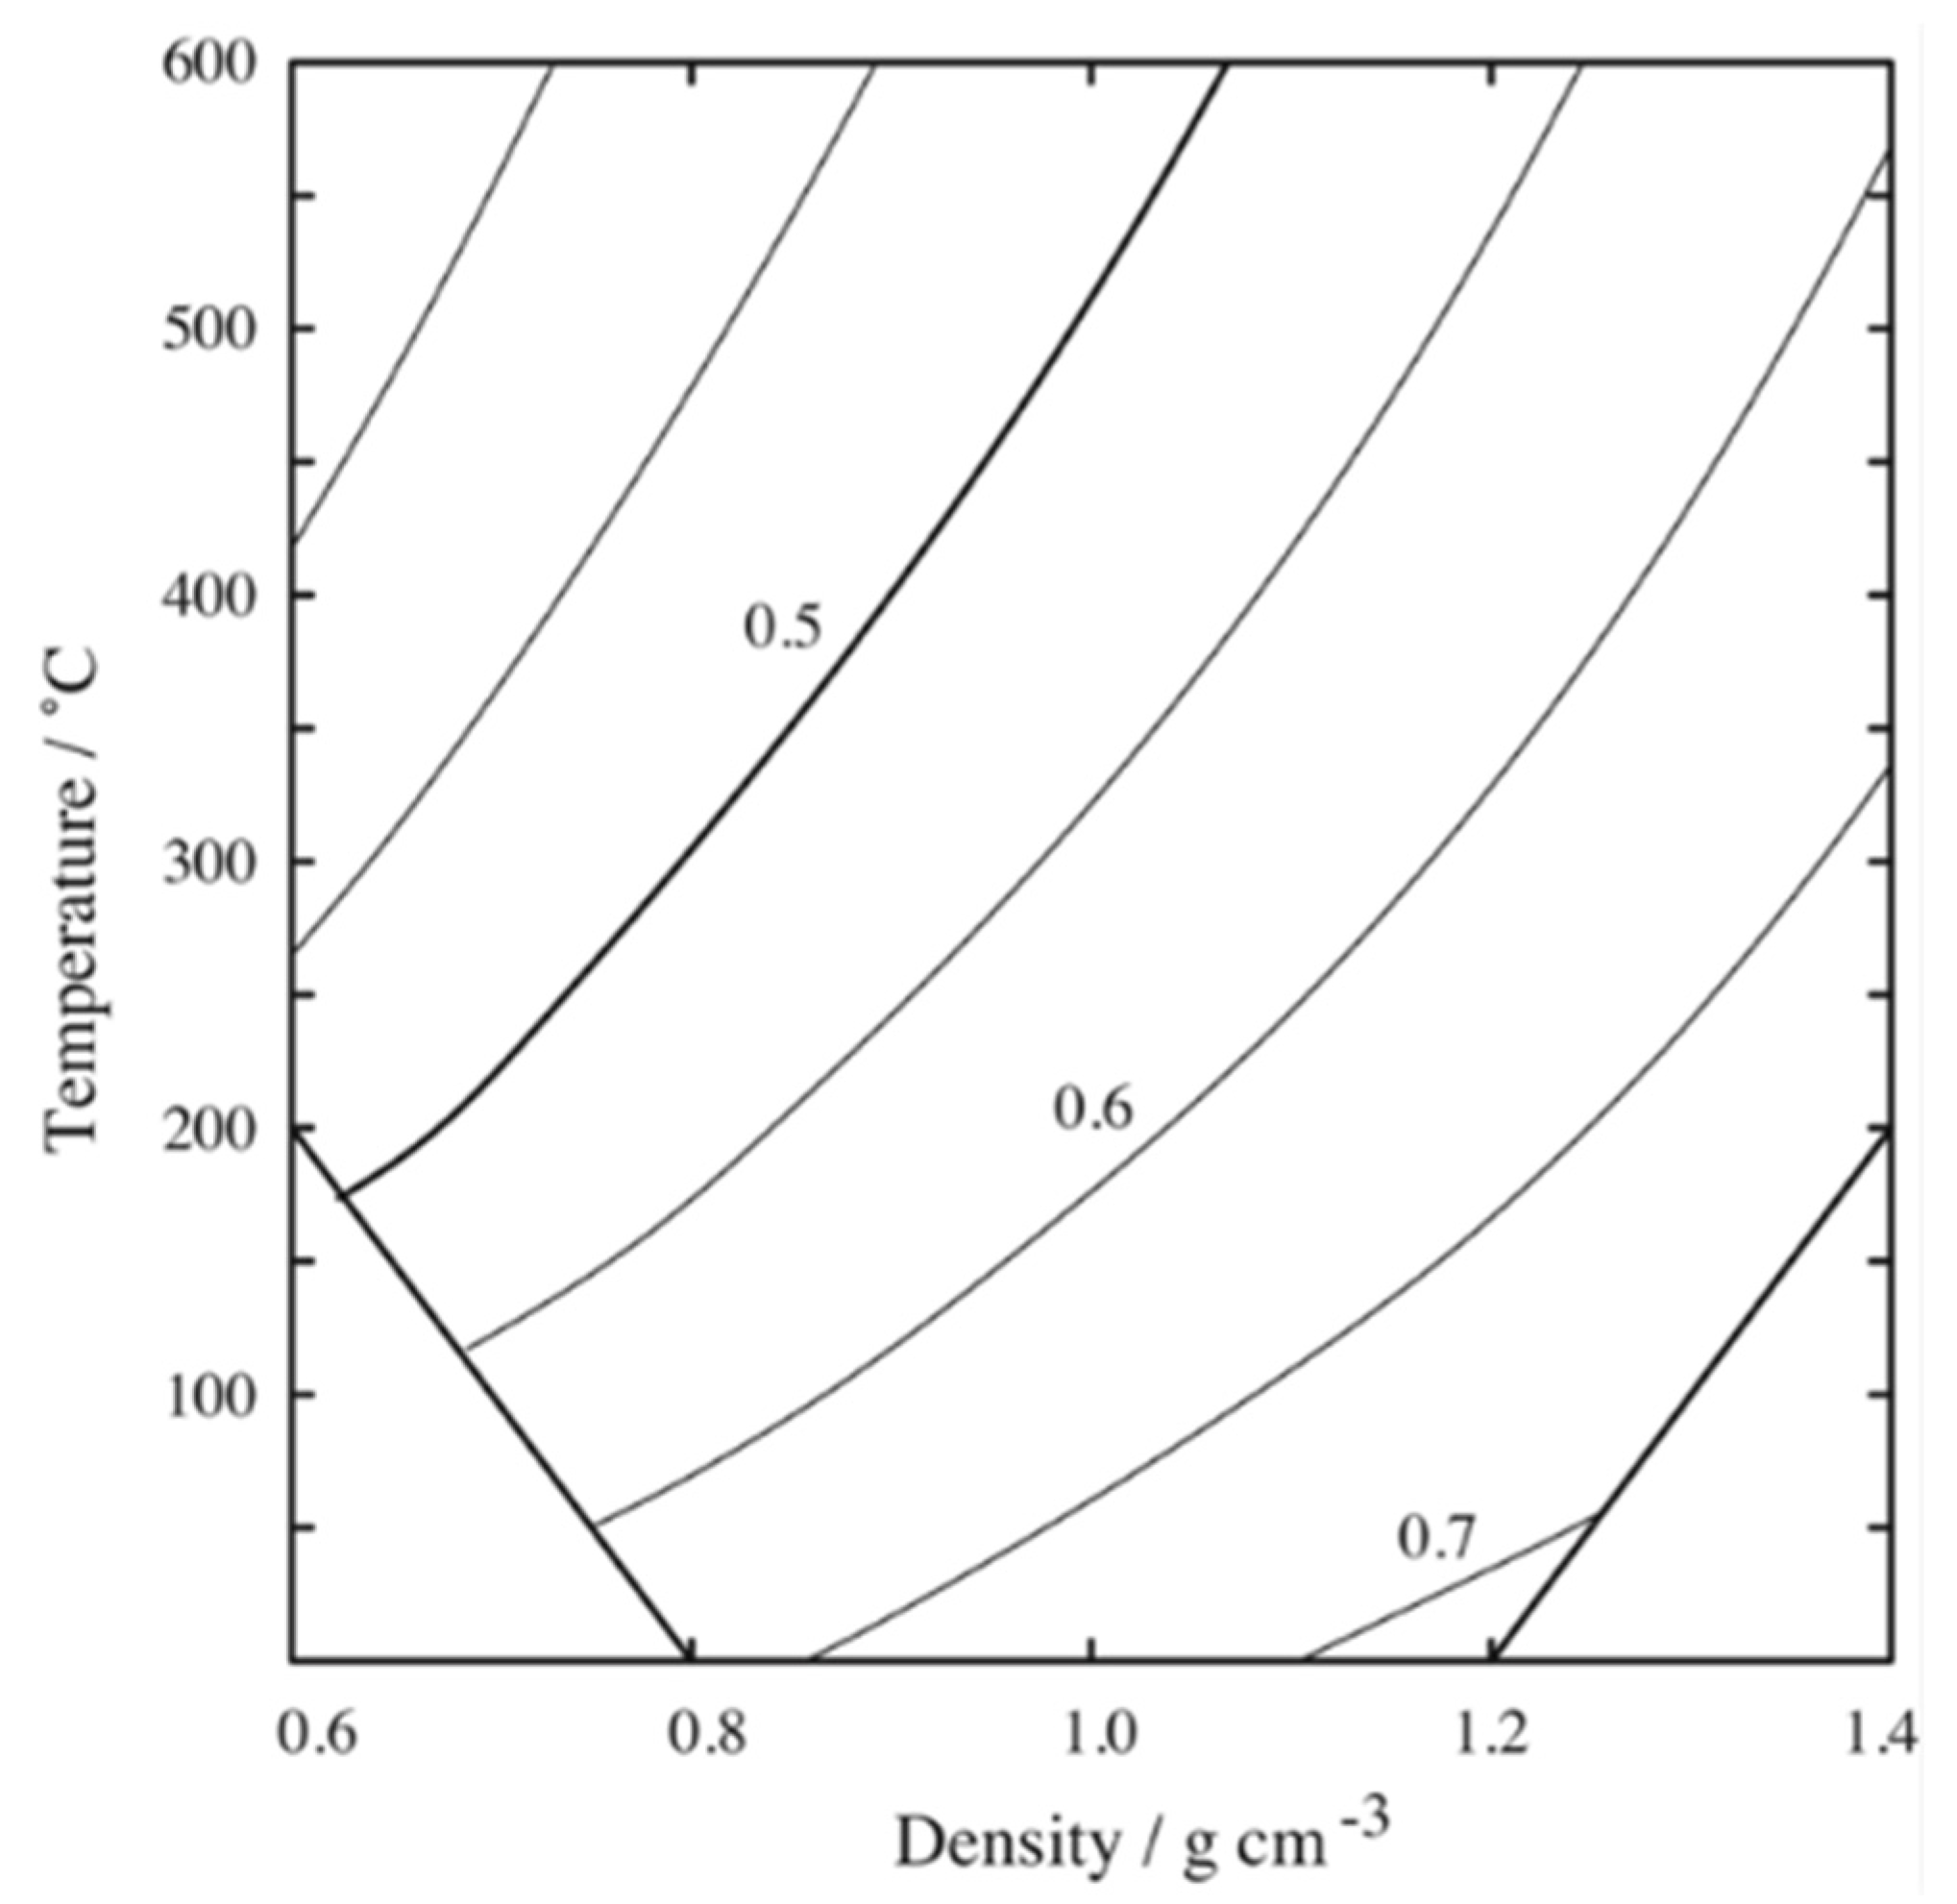
Figure 11.
Temperature dependence of O–O pair correlation functions of liquid water at different densities. The temperature varies from 0 to 600 °C at 1.0 g cm−3, whereas it ranges from 200 to 600 °C at 0.6 and 1.4 g cm−3. This figure is reprinted with permission from JCP, 1999, 111, 8545. Copyright 1999 AIP Publishing.
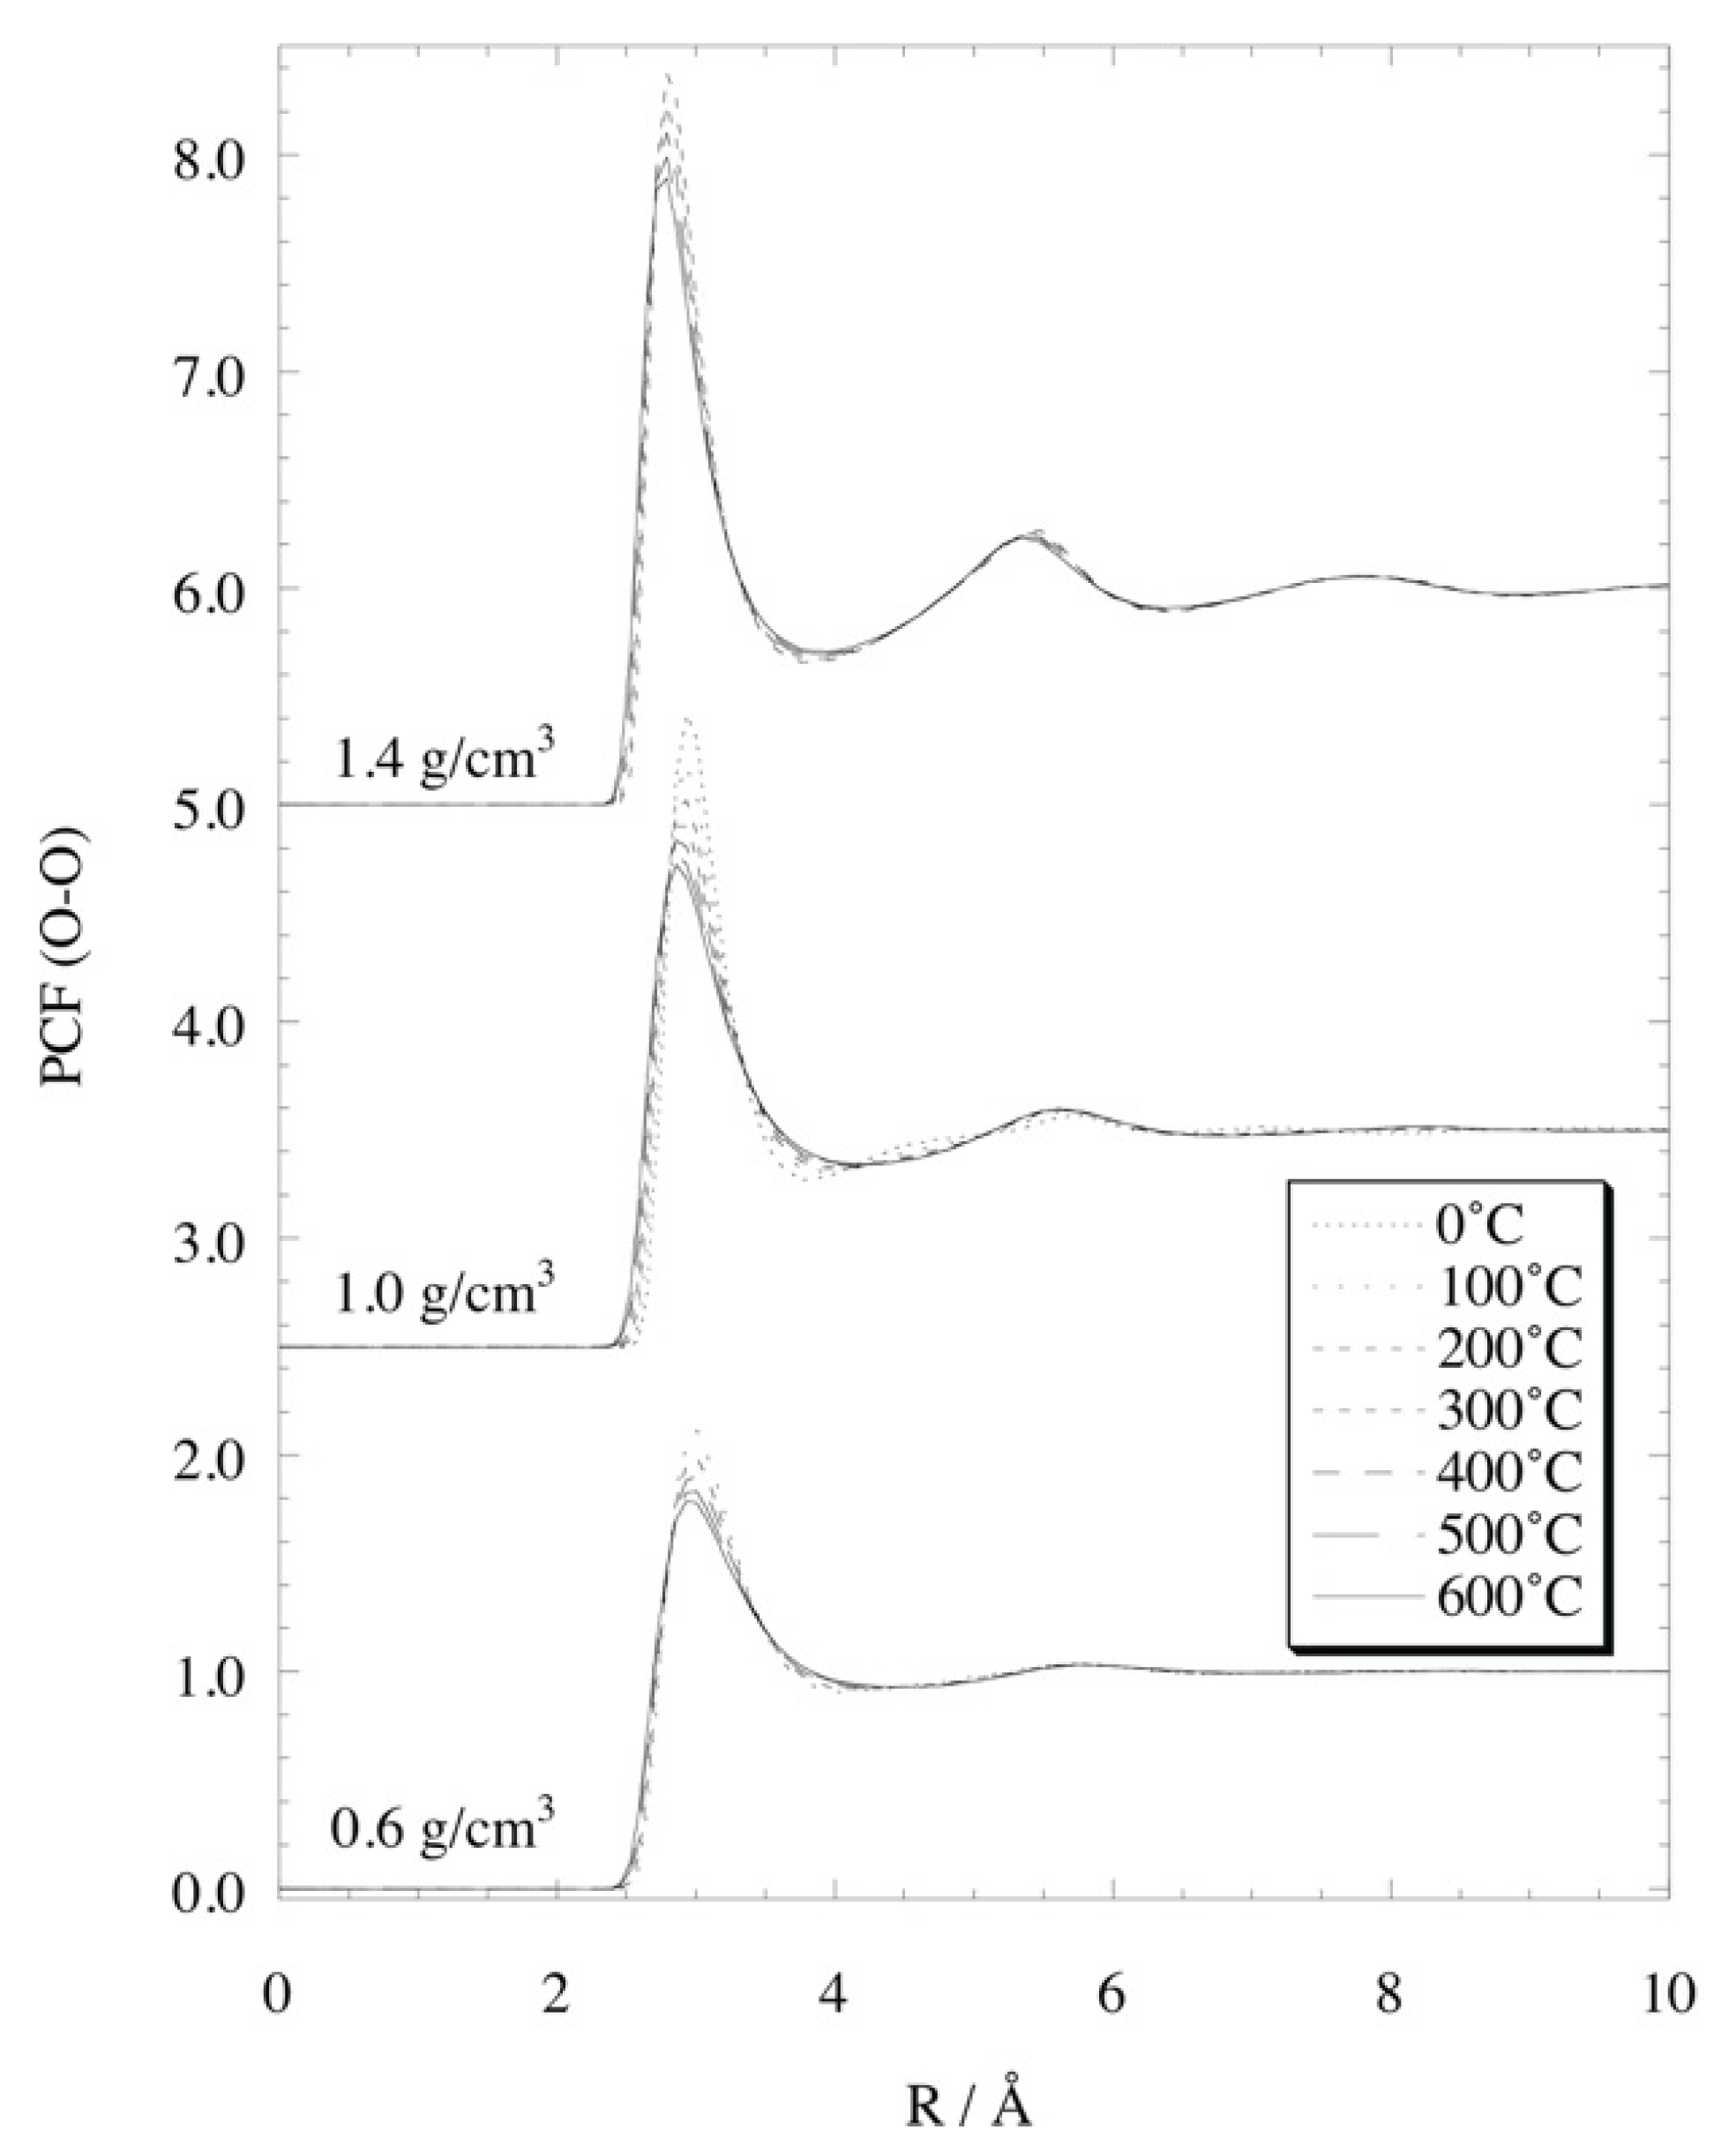
Figure 12.
The nearest O–O distance with respect to the inverse of the cube root of the density. The solid lines are for water and the dotted ones are for Lennard-Jones fluids. Corresponding experimental data obtained from X-ray diffraction are marked by . This figure is reprinted with permission from JCP, 1999, 111, 8545. Copyright 1999 AIP Publishing.
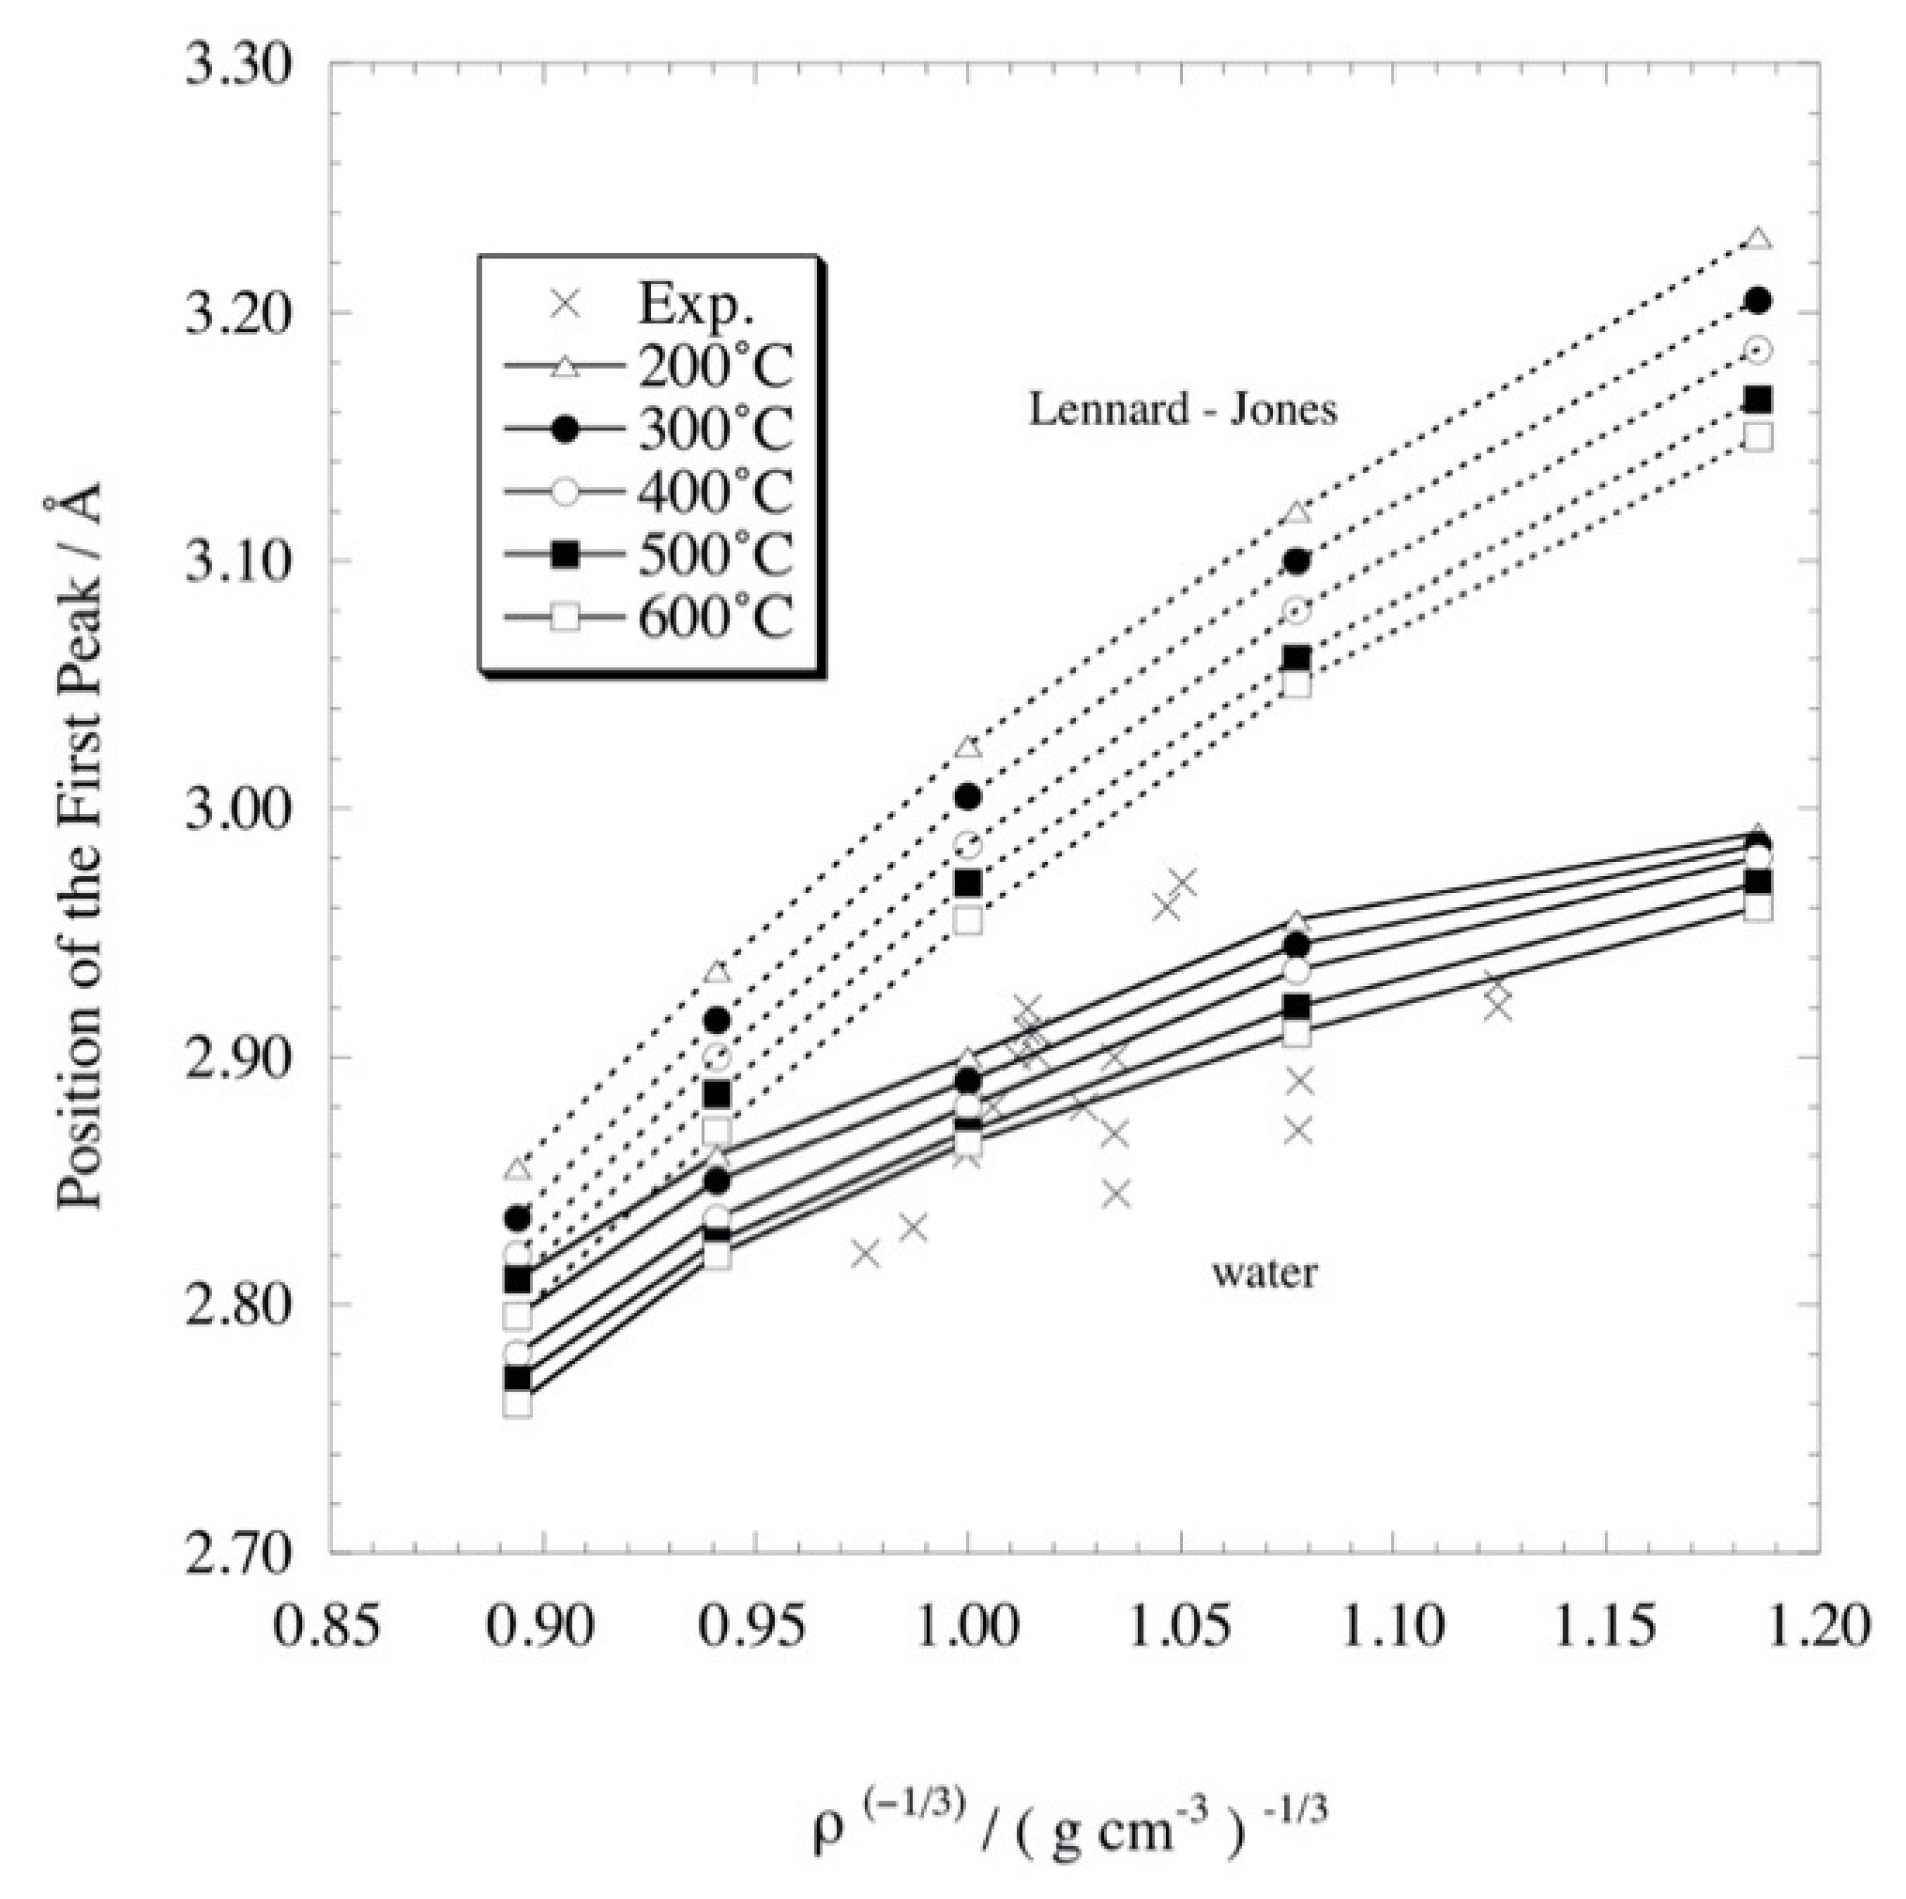
Figure 13.
Density and temperature dependence of , the difference between the and (1.0 g cm−3, 273.15 K), where and T are the solvent water density and the temperature of the system, respectively. The theoretical result of this work and experimental values are shown in parts (a) and (b), respectively. These figures are reprinted with permission from JPCB, 2006, 110, 8451. Copyright 2006 American Chemical Society.
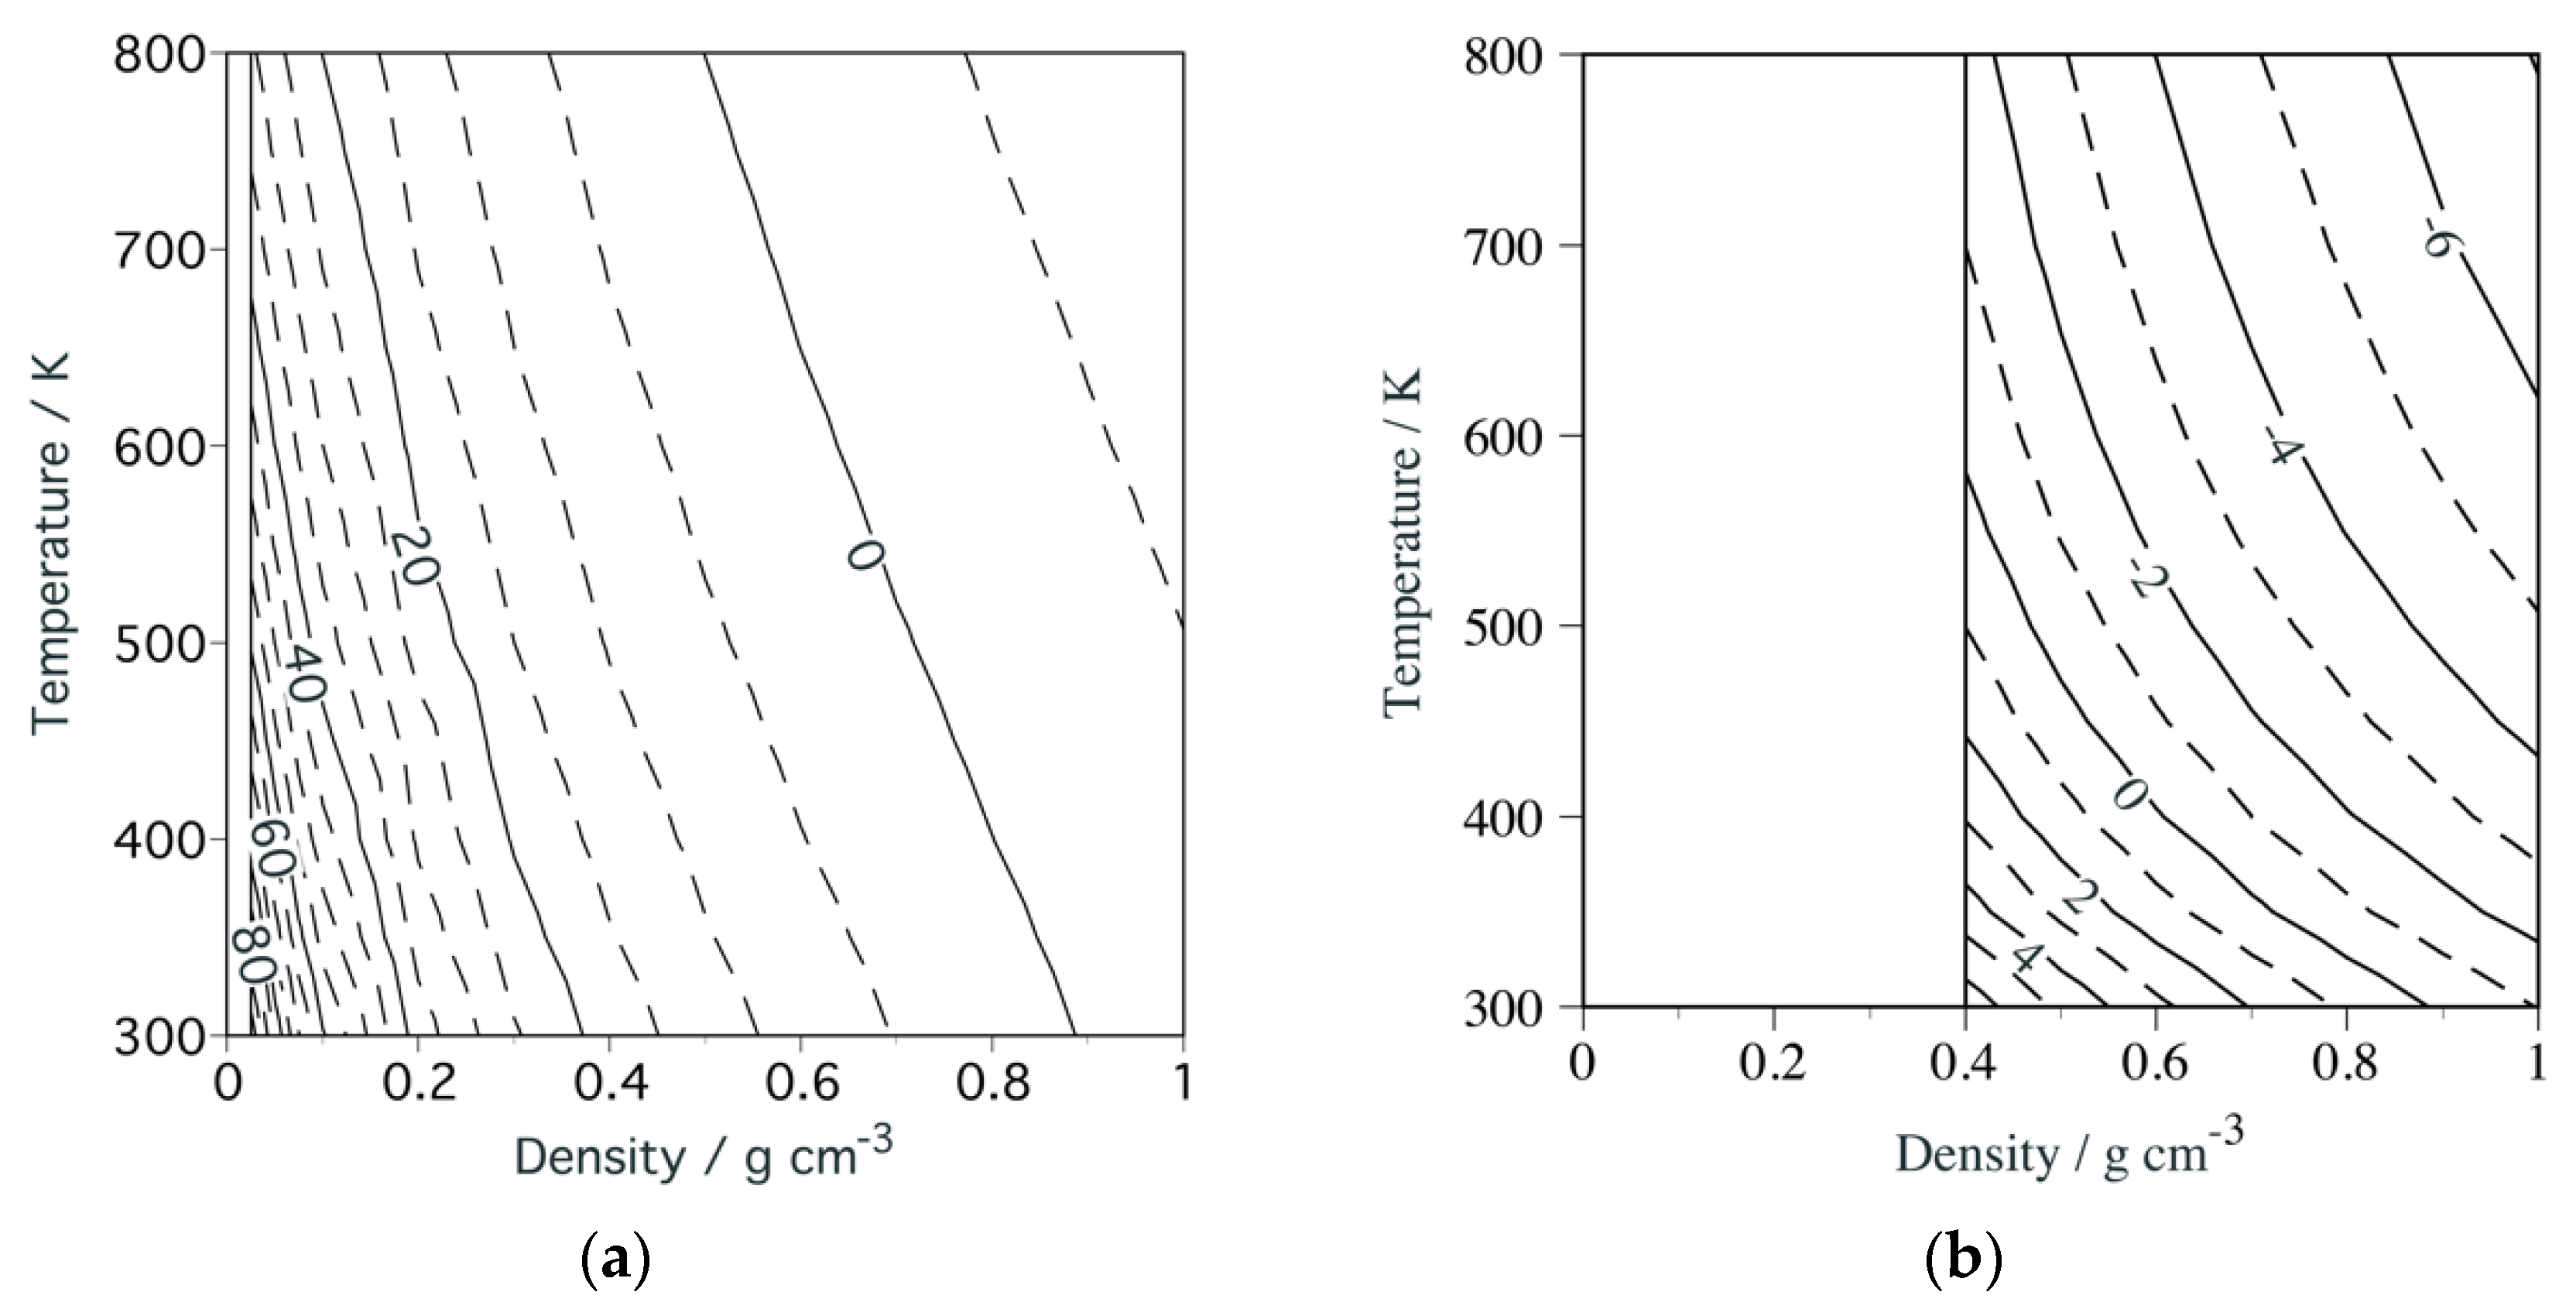
Figure 14.
Density and temperature dependence of the Gibbs free-energy change for the autoionization process of water: (a) and (b) . The units of the numbers on isochore lines are kcal mol−1. These figures are reprinted with permission from JPCB, 2006, 110, 8451. Copyright 2006 American Chemical Society.

Figure 15.
Density and temperature dependence of the solvation free energy: (a) H2O, (b) H3O+, and (c) OH−. The units of the numbers on isochore lines are kcal mol−1. These figures are reprinted with permission from JPCB, 2006, 110, 8451. Copyright 2006 American Chemical Society.
Figure 15.
Density and temperature dependence of the solvation free energy: (a) H2O, (b) H3O+, and (c) OH−. The units of the numbers on isochore lines are kcal mol−1. These figures are reprinted with permission from JPCB, 2006, 110, 8451. Copyright 2006 American Chemical Society.
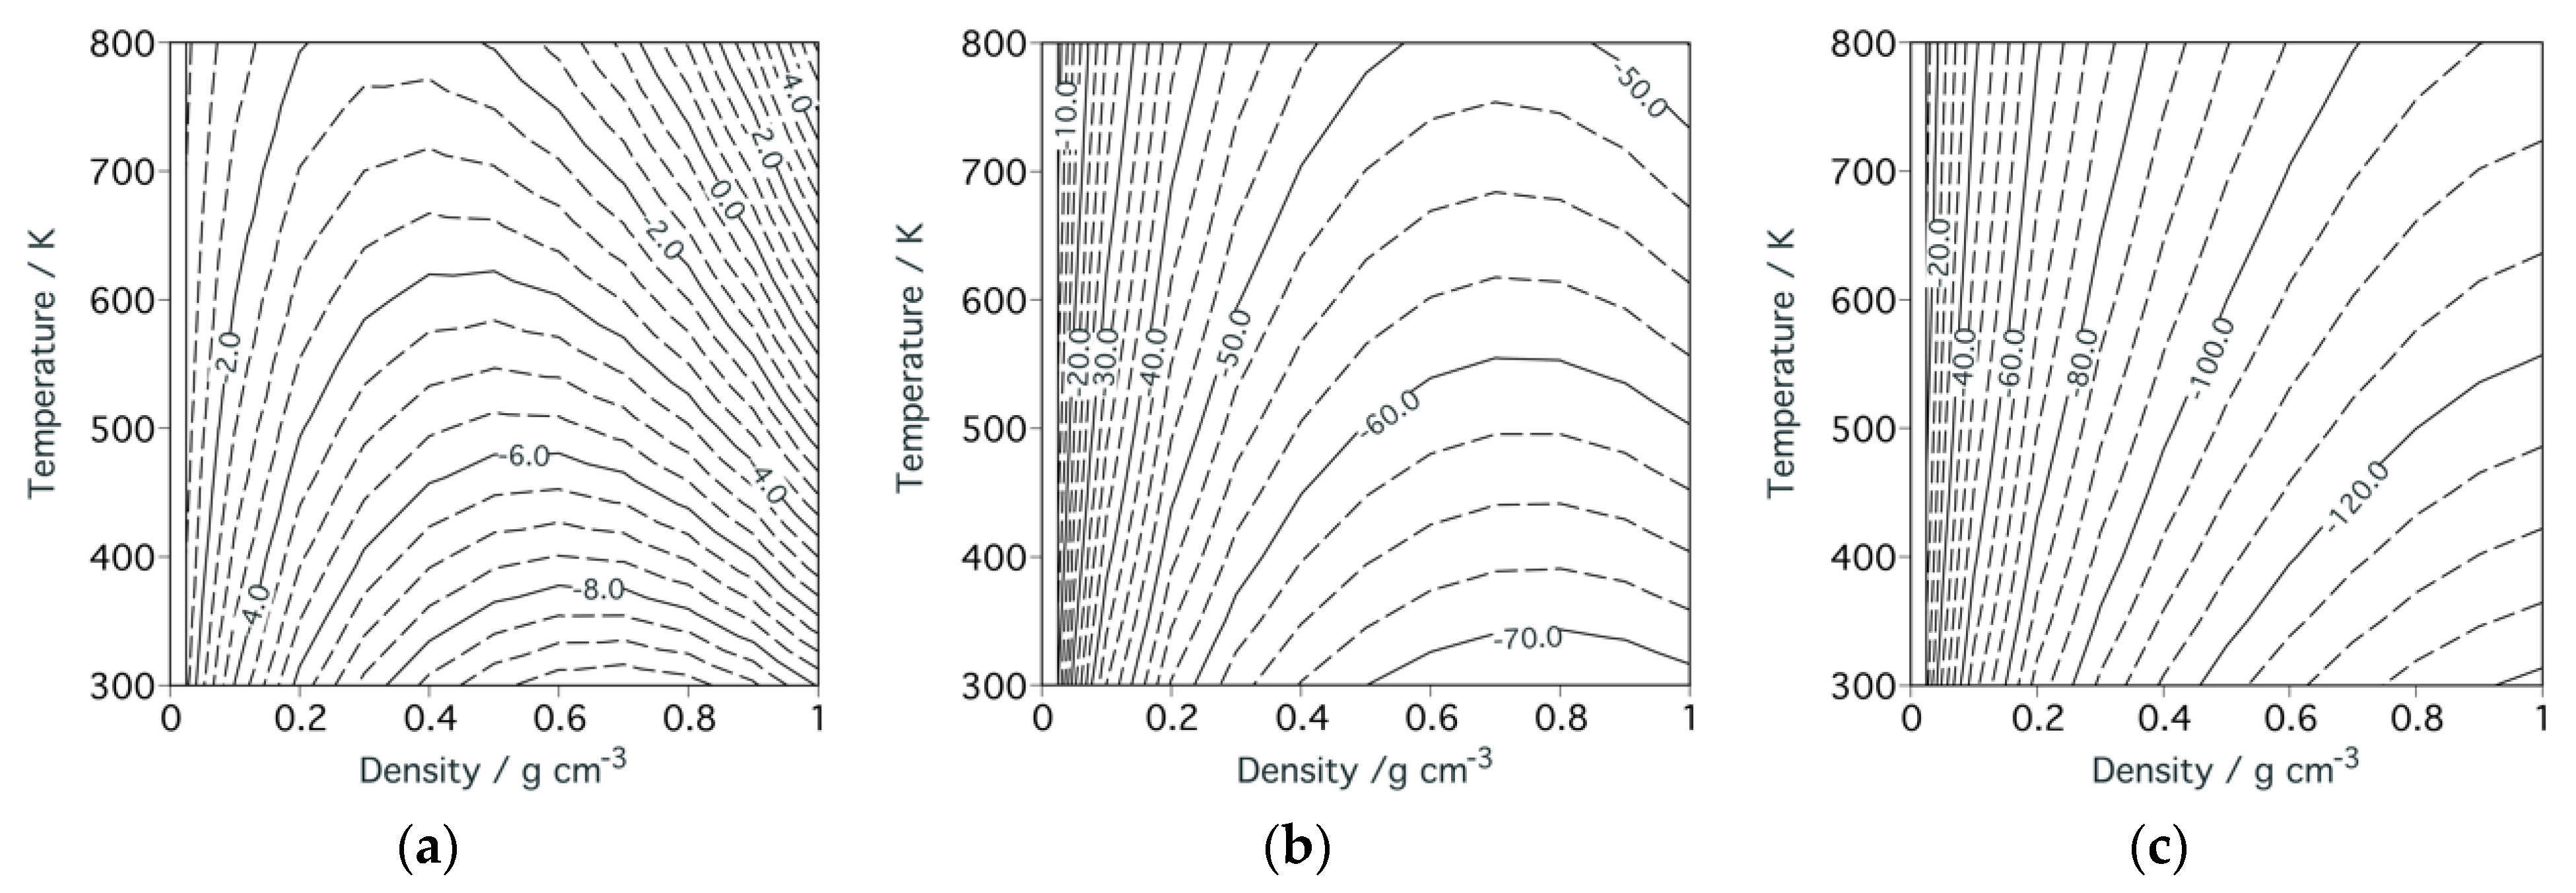
Figure 16.
Scheme for the Diels–Alder reaction.
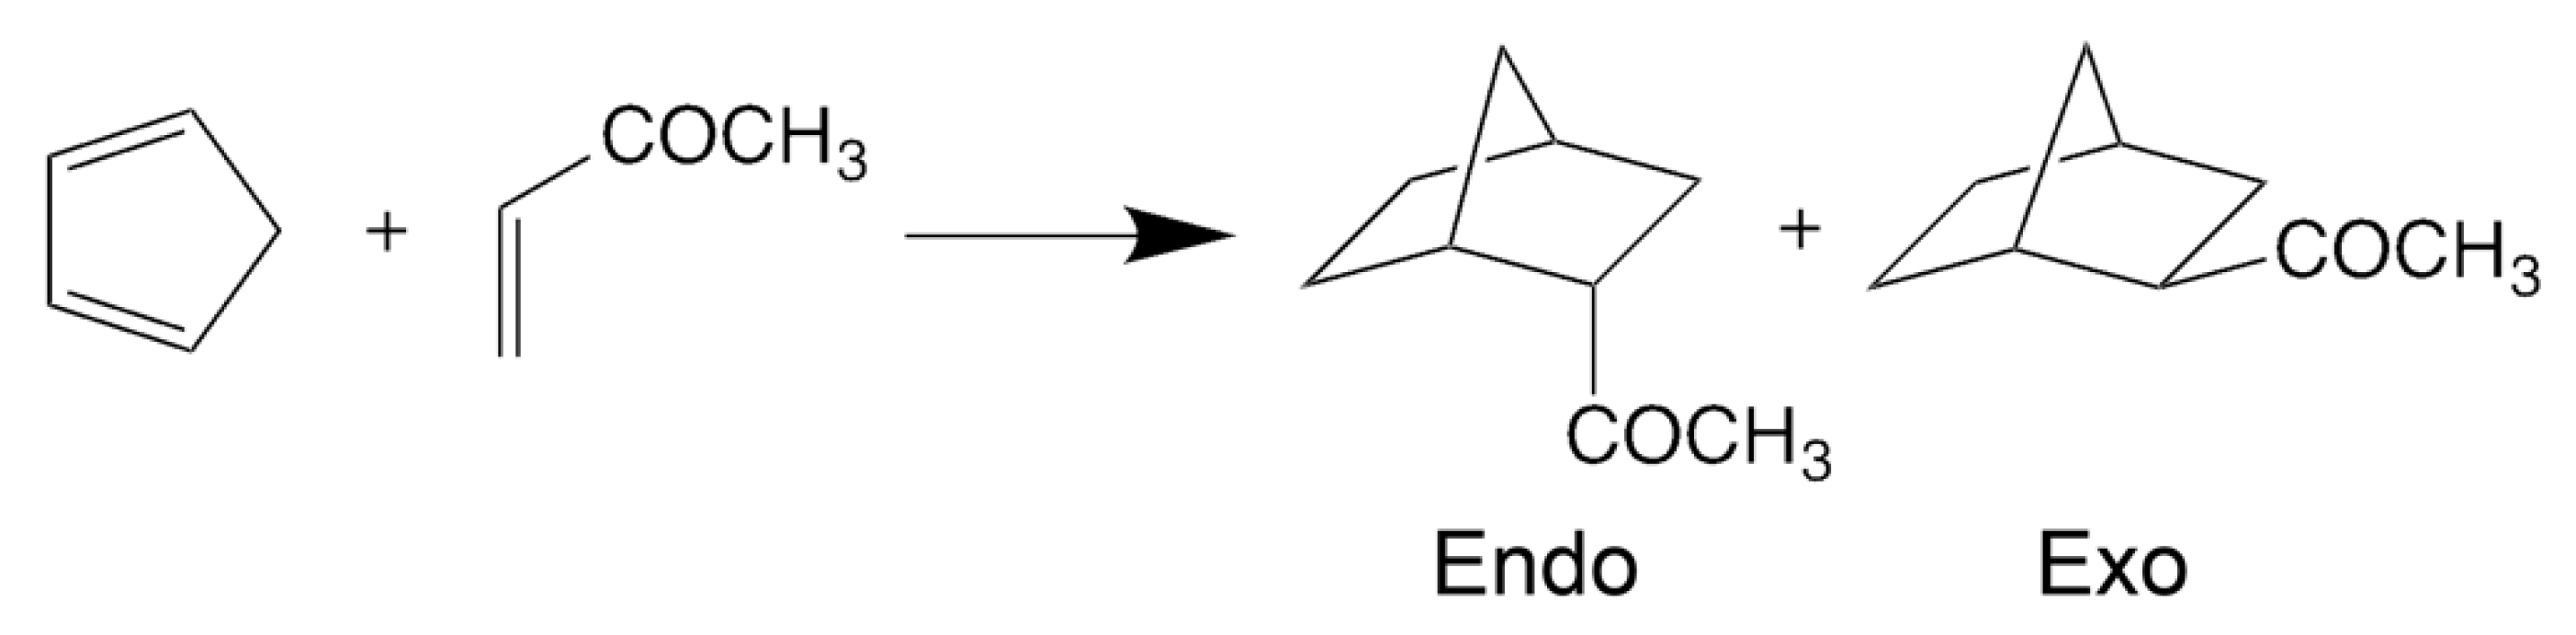
Figure 17.
The total free energies of TS and the products relative to those of the reactants for the endo–trans reactant. This figure is reprinted with permission from JACS, 2000, 122, 2289. Copyright 2000 American Chemical Society.
Figure 17.
The total free energies of TS and the products relative to those of the reactants for the endo–trans reactant. This figure is reprinted with permission from JACS, 2000, 122, 2289. Copyright 2000 American Chemical Society.
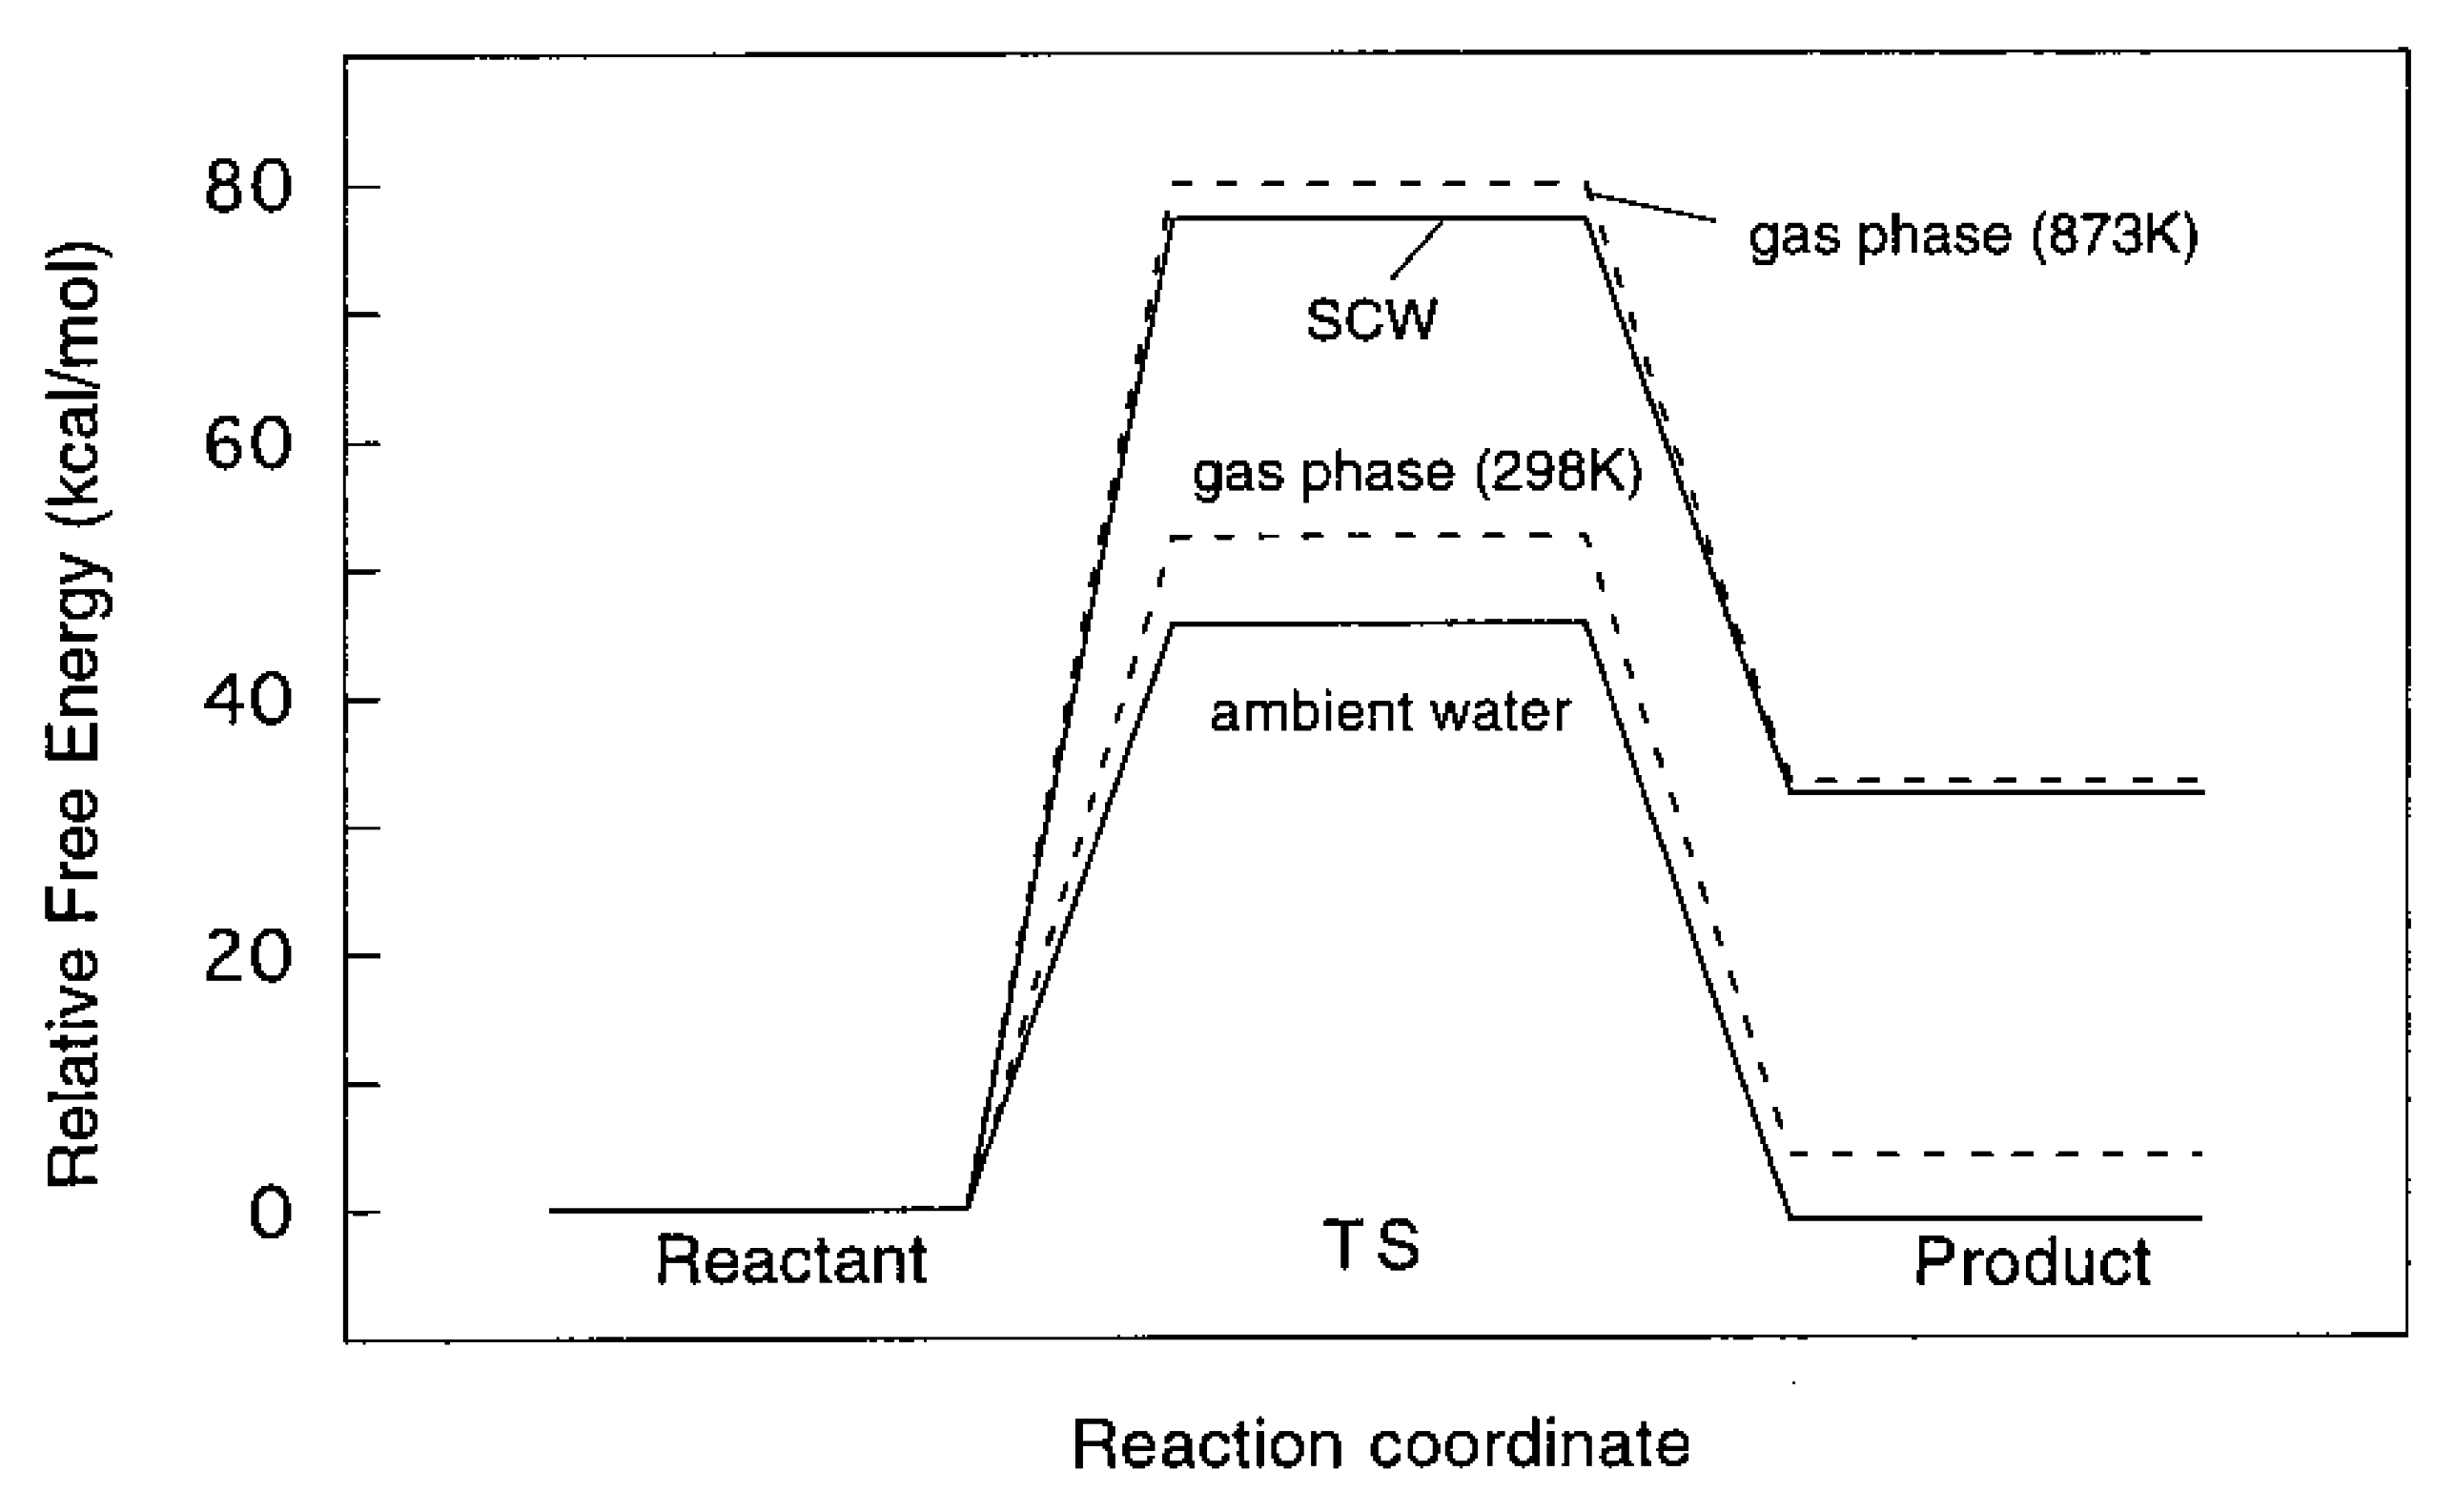

Table 1.
The change in the activation free energy from the gas phase to AW and to SCW. This table is reprinted with permission from JACS, 2000, 122, 2289. Copyright 2000 American Chemical Society.
Table 1.
The change in the activation free energy from the gas phase to AW and to SCW. This table is reprinted with permission from JACS, 2000, 122, 2289. Copyright 2000 American Chemical Society.
(kcal/mol) | (kcal/mol) | (kcal/mol) | |
|---|---|---|---|
| AW | |||
| trans | |||
| cis | |||
| SCW | |||
| trans | |||
| cis | |||
Table 2.
Changes in the free energy of the reaction from the gas phase to AW and to SCW. This table is reprinted with permission from JACS, 2000, 122, 2289. Copyright 2000 American Chemical Society.
Table 2.
Changes in the free energy of the reaction from the gas phase to AW and to SCW. This table is reprinted with permission from JACS, 2000, 122, 2289. Copyright 2000 American Chemical Society.
(kcal/mol) | (kcal/mol) | (kcal/mol) | |
|---|---|---|---|
| AW | |||
| trans | |||
| cis | |||
| SCW | |||
| trans | |||
| cis | |||
Publisher’s Note: MDPI stays neutral with regard to jurisdictional claims in published maps and institutional affiliations. |
© 2021 by the authors. Licensee MDPI, Basel, Switzerland. This article is an open access article distributed under the terms and conditions of the Creative Commons Attribution (CC BY) license (https://creativecommons.org/licenses/by/4.0/).
Share and Cite
MDPI and ACS Style
Yoshida, N.; Matsugami, M.; Harano, Y.; Nishikawa, K.; Hirata, F. Structure and Properties of Supercritical Water: Experimental and Theoretical Characterizations. J 2021, 4, 698-726. https://doi.org/10.3390/j4040049
AMA Style
Yoshida N, Matsugami M, Harano Y, Nishikawa K, Hirata F. Structure and Properties of Supercritical Water: Experimental and Theoretical Characterizations. J. 2021; 4(4):698-726. https://doi.org/10.3390/j4040049
Chicago/Turabian StyleYoshida, Norio, Masaru Matsugami, Yuichi Harano, Keiko Nishikawa, and Fumio Hirata. 2021. "Structure and Properties of Supercritical Water: Experimental and Theoretical Characterizations" J 4, no. 4: 698-726. https://doi.org/10.3390/j4040049