
Alteration of Organic Matter during Wildfires in the Forests of Southern Siberia


V.N. Sukachev Institute of Forest of the Siberian Branch of the Russian Academy of Sciences—Separate Subdivision of the Federal Research Center “Krasnoyarsk Science Center SB RAS”, Akademgorodok 50/28, 660036 Krasnoyarsk, Russia
*
Author to whom correspondence should be addressed.
Fire 2023, 6(8), 304; https://doi.org/10.3390/fire6080304
Submission received: 11 July 2023
/
Revised: 29 July 2023
/
Accepted: 31 July 2023
/
Published: 6 August 2023
(This article belongs to the Special Issue Upgrading of Biomass Resources for Subsequent Combustion Use)
Abstract
:Large areas of forests burn annually in Siberia. Pyrogenic organic matter (PyOM) generated by wildfires acts as a stable carbon deposit and plays an important role in the global carbon cycle. Little is known about the properties of PyOM formed during fires in Siberian forests. In this work, we report the results of thermogravimetry (TG), differential scanning calorimetry (DSC), and Fourier transform infrared (FTIR) spectroscopy applied to the study of the chemical composition, structure, and thermal stability of PyOM formed during surface and crown fires of moderate to high severity in southern Siberia. We studied the PyOM produced from the forest floor, down wood, cones, and outer bark of tree stems in Scots pine, larch, spruce, and birch forests. We calculated the thermal recalcitrance indexes (R50, Q3) based on TG/DSC data. We found that wildfires resulted in a strong decrease in thermolabile components in burned fuels, enrichment by aromatic structures, and a significant increase in thermal stability (T50) compared to unburned samples. In all the studied forests, bark PyOM revealed the highest value of T50 while forest floor PyOM had the lowest one. At the same time, our results indicated that the properties of PyOM were more strongly driven by wildfire severity than by fuel type. Overall, the thermal recalcitrance R50 index for PyOM samples increased by 9–29% compared to unburned plant residues, indicating a shift from low to intermediate carbon sequestration potential class in the majority of cases and hence less susceptibility of PyOM to biodegradation.
1. Introduction
In boreal forest ecosystems, wildfire is a frequent disturbance factor that strongly affects the size and composition of the soil organic carbon pool [1]. More than 70% of fires and up to 90% of the total burned area in Russia occur in Siberia. In recent decades, fire frequency, area burned, and carbon emissions increased significantly in Siberia due to elevated air temperatures [2,3]. Pyrogenic organic matter (PyOM) produced due to the incomplete combustion of plant biomass during wildfires is a component of the stable soil organic pool which plays an important role in the global carbon cycle [4]. PyOM comprises a continuum of combustion products ranging from lightly charred plant materials to highly condensed soot [5,6]. Recent studies have demonstrated that up to 16–28% of the total С affected by fire is retained in PyOM [7,8,9]. The conversion rates vary significantly between fuel components. For instance, for down wood and bark in a Pinus banksiana forest of Western Canada, over half of the C affected by a high-intensity crown fire was converted to PyOM, whereas for the forest floor it was only one-quarter [8]. In soils frequently exposed to fires, the contribution of pyrogenic carbon to total organic carbon can exceed 35–40% [10].
PyOM is C-enriched and more chemically and thermally recalcitrant compared to its unburned precursors [11,12]. Therefore, PyOM production during a wildfire can be considered a mechanism for C sequestration. The PyOM products of vegetation fires are both chemically and physically variable, so they cover a wide range of carbon sequestration potentials [8,12]. A large fraction of the PyOM continuum can be considered a C sink on a decadal/centennial timescale [6,9]. The properties of PyOM formed during wildfires may vary greatly in different ecosystems depending on the fuel types burned and fire characteristics [4,13]. The concentration of oxygen at the time of burning determines whether flaming or smoldering conditions will develop [4]. As a result of the oxygen limitation for smoldering, the peak temperature of a smoldering fire generally ranges from 200 to 300 °C, which is significantly lower than that of a flaming fire (about 600 °C) [13].
The chemical composition of plants determines PyOM formation and its properties depending on differences in the thermal stability of plant biopolymers (hemicelluloses, cellulose, and lignin). Leaves and grass generate PyOM at a relatively low temperature (~250 °C) because polysaccharides are decomposed at this temperature. This type of fuel produces smaller amounts of aromatic and recalcitrant PyOM compared to woody biomass and thus may be degraded more quickly in soils [14]. Besides the vegetation type, local variations in environmental conditions (vegetation moisture, slope, etc.) result in high spatial variability in burn severity even within a specific area [15].
PyOM originates at temperatures between 250 and 500 °C. Charring of plant materials results in the loss of oxygen-containing functional groups and the O-alkyl aliphatic structures, as well as an increase in aromatic C. Over 480 °C, the character of the charred material becomes almost totally aromatic [10]. The aromatic structure of carbon includes the concepts of aromaticity and degree of aromatic condensation. Aromaticity increases with increasing temperature from 200 °C to ca. 500 °C, when maximum aromaticity values are reached. The degree of aromatic condensation increases more gradually from 400 °C, reaching maximum values at temperatures above 1000 °C. The aromaticity and the degree of aromatic condensation of PyOM influence its sequestration potential [16]. The degree of aromatization depends on burning conditions such as temperature, duration, and oxygen availability. At temperatures lower than 450 °C, usually recorded in wildfires of moderate intensity, PyOM reveals a low degree of aromatization [14].
Charring experiments with cellulose and lignin under oxic conditions have revealed the degradation of cellulose due to dehydration and dehydroxylation processes, as well as the simultaneous formation of aromatic structures. The main chemical alteration of lignin occurred due to dehydroxylation, cleavage, shortening of the propanyl side chains, and demethylation of the methoxyl groups. The remaining methoxyl C showed a relatively higher resistance of the lignin backbone towards thermal oxidation, indicating that lignin residues are an important component of charcoal generated during forest fires [17,18].
The solid-state 13C nuclear magnetic resonance (NMR), Fourier transform infrared (FTIR) spectroscopy, and thermal analysis methods such as thermogravimetry (TG) and differential scanning calorimetry (DSC) are widely used to characterize PyOM [12,19,20,21,22,23]. The combined use of different analytical techniques provides a better characterization of PyOM quality [14]. Although some studies [24,25] have evaluated the effect of wildfires on soil organic matter in the forests of Siberia, data on the chemical composition and structure of PyOM are rare [1,26]. Therefore, the aim of our present research is to evaluate the composition, structure, and thermal stability of PyOM formed during fires in different forest types of southern Siberia using thermal analysis and FTIR spectroscopy. This study will provide new data on the characteristics of fresh PyOM produced from various fuels in Siberia and its carbon sequestration potential.
2. Materials and Methods
2.1. Study Area and Sampling Procedure
The study was carried out in Scots pine (Pinus sylvestris L.) (Plot 1), larch (Larix sibirica Ledeb.) (Plot 2), spruce (Picea obovata Ledeb.) (Plot 3), and birch (Betula pendula Roth) (Plot 4) forests in Central Siberia (Figure 1).
The sites are located in the Altai-Sayan mountain–forest–steppe (Plots 1), Altai-Sayan mountain–taiga (Plots 2 and 4), and Central Siberian subtaiga–forest–steppe (Plot 3) forest zones [28] on the left and right banks of the Yenisey river in the southern regions of the Krasnoyarsk krai (Figure 1). The climate of the study area is sharply continental. Mean annual temperatures over the 2006 to 2022 period varied from 0 to 2.3 °C among studied sites with daily minimum and maximum values reaching up to –44.4 and 36.9 °C, respectively. The lowest annual precipitation (372.9 mm) was recorded at Plot 1 located in the forest–steppe and the highest (813.5 mm) was at Plot 2 in the mountain–taiga zone, while in Plots 3 and 4, annual precipitation averaged 532.5 and 518.2 mm, respectively. Average snow depth was 7.1, 60.3, 29.4, and 22.7 cm for Plots 1–4, respectively, as reported by the closest weather stations (https://rp5.ru; accessed on 10 July 2023).
Spring fires dominate the study area [29]. Average fire return intervals vary from 10 to 33 years depending on forest type [30], with the highest fire activity registered in nearby settlements due to high anthropogenic pressure [31].
All the studied forests were burned on 2–7 May 2022. We examined the sites 3–10 days postfire. There was no rain after the fire and before sampling. In addition, we sampled unburned (control) forests located in the immediate proximity of the burned sites in the same growing conditions with similar stand structure and living ground cover characteristics. The average diameter at breast height (DBH) of the examined stands varied from 23.3 to 32.7 cm, and height from 13.4 to 28.8 m (Table 1).
Scots pine, spruce, and birch stands were characterized by high tree density with a basal area varying from 35.4 to 43.7 m2/ha. Low tree density in the larch forest, where the basal area accounted for 13.2 m2/ha, resulted in a high proliferation of shrubs such as Spiraea, Rosa, Cotoneaster spp., and Rhododendron dauricum L. Living grasses and small shrubs covered up to 10–15% of the plot areas prefire because the research was conducted at the beginning of the growing season. The dominant living ground vegetation in the birch stand (Plot 4) included Carex spp., Maianthemum bifolium (L.) F.W. Schmidt, Atragene sibirica, and Vicia cracca L. In the Scots pine (Plot 1) and spruce (Plot 3) forests, litter dominated the ground cover, with Carex spp. occupying up to 10% of the area and feather moss (Pleurozium schreberi (Willd. ex Brid.)) covering over 5% of the ground vegetation. We determined the fire severity in situ based on the average char heights on the trees [32] and the completeness of combustion of ground fuels [33]. The Scots pine forest (Plot 1) was burned by a high-severity crown fire with total tree mortality while the other forests (Plots 2–4) were burned by surface moderate- to high-severity fires resulting in up to 40% tree mortality (Table 1).
At both burned and unburned sites, we sampled the forest floor layer in 5 replicates. The forest floor consisted mainly of cured herbs and grasses, needles, leaves, moss, and duff. Additionally, we sampled small dead down wood pieces of d < 1 cm and cones (typical wildfire fuels) lying on the ground surface. After the fire, the charred forest floor was sampled and sorted from the uncharred plant residues. The color of the charred layer (ash) generated by wildfire can vary widely, from light to dark, depending on the fuel types burned and fire characteristics [34]. Regardless of the color, all the ash was sampled as it was of pyrogenic origin. At burned plots in the birch and spruce forests, only the upper part of the forest floor was burned, while in the Scots pine and larch forests, surface ground cover burned up to the mineral layer. Therefore, at unburned plots, we sampled the layers of forest floor which corresponded to the burned organic matter at plots exposed to fires. Moreover, the samples of overstory outer bark from tree stems were collected at burned and control plots in 5 replicates. All samples were air-dried in the laboratory, then ground, sieved through a 0.5 mm sieve, and analyzed by TG, DSC, and FTIR spectroscopy.
2.2. Thermal Analysis
The mass loss and heat flow characteristics of thermal degradation of burned and unburned samples were studied using TG and DSC, respectively. Thermogravimetry (TG 209 F1, NETZSCH-Gerätebau GmbH, Selb, Germany) was carried out in an air atmosphere with a gas flow of 20 mL/min from 25 to 850 °C in an aluminum oxide crucible. Approximately 5 mg of each sample was used. The heating rate was 10 °C min−1. The data were analyzed using NETZSCH Proteus Thermal Analysis Software version 4.8.4.
To characterize the PyOM, we calculated the thermal recalcitrance indexes (R50, Q3) based on TG and DSC data [12,14,22,35].
The R50 index was calculated according to Harvey et al. [21]:
where T50,x and T50,graphite are the temperature values corresponding to 50% of the mass loss of the x sample and graphite, respectively.
R50,x = T50,x/T50,graphite;
The values of T50,x were obtained directly from TG thermograms in the temperature range of 170–850 °C where the thermal degradation of samples occurred after the loss of free and non-structural water. For graphite, we used the data obtained by Santín et al. [12]. T50,graphite was 823 °C. We classified the studied samples into the following recalcitrance/C sequestration potential classes according to Harvey et al. [21]: Class A (R50 > 0.70); Class B (0.50 ≤ R50 < 0.70); and Class C (R50 < 0.50).
The calorimetric measurements were performed with a differential scanning calorimeter (DSC 204 F1, NETZSCH-Gerätebau GmbH, Selb, Germany) with a heating rate of 10 °C min−1 from 25 to 590 °C. The sample mass was about 0.5 mg. The samples were sealed in aluminum pans with pierced lids by pressing. The heat of combustion (Q, kJ/g) was determined by integrating the DSC curves over the exothermic region (150–590 °C). For each DSC thermogram, we divided the area under the DSC curve between 150 and 590 °C into three temperature regions representing different degrees of organic matter resistance to thermo-oxidation [14]: 150–375 °C—labile organic matter (mainly polysaccharides and other aliphatic compounds); 375–475 °C—recalcitrant organic matter (lignin or other polyphenols); 475–550 °C—highly recalcitrant organic matter (polycondensed aromatic forms). The partial heats of thermo-oxidation of organic matter were calculated from the DSC thermograms using the NETZSCH Proteus software. Partial heat was defined as the percentage of heat released over a certain temperature range from the total amount of heat. The resulting partial heats representing these three regions were designated as Q1, Q2, and Q3, respectively. The index Q3 (%) can be used as an indicator of thermally recalcitrant organic matter, which has also proven to be more resistant to microbial degradation than material falling into regions Q1 and Q2 [12,35].
2.3. Fourier Transform Infrared Spectroscopy
For FTIR analysis, the samples were prepared by mixing powdered samples with ∼100 mg KBr and then compressing them to form a thin tablet. FTIR spectra were measured using a Fourier transform infrared spectrometer (VERTEX 80V, Bruker Optics Inc., Bremen, Germany) in a spectral range of 8000–350 cm−1 at a spectral resolution of 0.2 cm−1. The spectra were obtained in transmission mode and then converted to absorbance units. The intensities of absorption bands were obtained from the original FTIR spectra.
3. Results
3.1. Thermogravimetry
Transformation of plant material during fire occurs due to the breakdown of major plant biopolymers, i.e., hemicelluloses, cellulose, and lignin. It is known that hemicelluloses decompose in the lower temperature range (220–315 °C) than cellulose (300–400 °C), while lignin degrades over a broader temperature range (200–500 °C) [36,37]. Typical thermograms showing the differences between burned and unburned samples are shown in Figure 2. The TG curve reveals the mass loss, whereas the DTG (differential thermogravimetric) curve is indicative of the mass loss rate. The peaks in the DTG curves indicate the stages of the thermal degradation (thermo-oxidation) of the samples.
The DTG curves of unburned samples showed three/four main stages of thermal degradation. The initial mass loss (peak at 61–72 °C) was caused by the evaporation of hygroscopic water. The mass loss in the temperature range of 170(180)–360(380) °C (peak at 312–327 °C) was attributable to the decomposition of thermolabile components, such as polysaccharides (hemicelluloses and cellulose). The mass loss above 360(380) °C is associated with thermostable compounds (Table 2). This is due to the thermal degradation of lignin, which is more thermally resistant. A small temperature peak above 600 °C in the DTG curves and the corresponding mass loss of 0.16–1.95% is probably associated with the oxidation of char formed at an earlier stage of sample thermal degradation.
The forest floor and down wood samples from unburned forests showed a higher mass loss of polysaccharides (thermolabile compounds) than the bark and cones, which were more enriched in lignin. The bark and cones had higher thermal stability indicated by T50. The residual mass was noticeably higher for the forest floor in all forests, indicating inorganic material content.
The thermolabile compounds’ decomposition peak in the DTG curves of the PyOM significantly decreased or disappeared (Figure 2) due to the loss of polysaccharides in the burned samples. By contrast, the peak above 380 °C increased, indicating a higher relative proportion of aromatic structures [21].
The TG curves of the PyOM indicated a significant decrease in the mass loss of polysaccharides (Table 2). In the Scots pine, larch, and spruce forests, the down wood and bark were more affected by fires and showed a greater decrease in thermolabile components than the forest floor and cones. In the birch forest, the bark and forest floor demonstrated a similar decrease. In general, the down wood, forest floor, and cones in the spruce forest revealed the lowest decrease in thermolabile components during fire compared to those in the Scots pine, larch, and birch forests.
All the PyOM samples showed a higher proportion of thermostable components (aromatic compounds) compared to the unburned samples. High-severity fires led to a greater increase in thermostable components in the down wood, cone, and forest floor PyOM compared to moderate-severity fire. The highest increase was observed for the down wood PyOM in the Scots pine and larch forests. In all the forests affected by high-severity fires, forest floor PyOM showed the smallest increase in aromatic structures. In the spruce stand, it was found for cone PyOM.
The residual mass (mineral residue) increased significantly (2–3 times) for all PyOM, except for the bark PyOM, compared to the unburned samples. It is known that under higher fire severity more complete combustion of fuels occurs and, in turn, higher combustion completeness leads to the enrichment of mineral residues [8,34].
Fires resulted in enhanced thermal stability indicated by increasing T50 and correspondingly higher thermal recalcitrance index R50. The bark and down wood PyOM in the Scots pine and larch forests showed the greatest T50 values, reflecting a higher thermal stability. Higher values of T50 indicate a greater accumulation of more complex, polymerized, and energy-rich compounds [14].
According to the classification by Harvey et al. [21], the forest floor PyOM in all the studied forests showed low carbon sequestration potential (Class C, R50 < 0.50) despite the higher values of R50 than for the unburned samples. Bark PyOM from all forests (Plots 1–4) and the down wood and cone PyOM generated during high-severity fires (Plots 1, 2) belonged to class B (0.50 ≤ R50 < 0.70) and, therefore, had an intermediate carbon sequestration potential. A moderate-severity fire in the spruce forest resulted in the formation of down wood and cone PyOM which was classified as class C.
3.2. Differential Scanning Calorimetry
DSC analysis of the unburned samples showed an endothermic peak below 150 °C because of hygroscopic water loss and two/three exothermic peaks above 150 °C corresponding to the thermal degradation (combustion) of organic matter (Figure 3). The first exothermic peak is associated with the decomposition of thermolabile components (polysaccharides), while the second and third peaks are associated with the thermal oxidation of lignin. The combustion heat (Q) ranged from 11.0 to 14.1 kJ/g (Table 3). The bark and cone samples demonstrated slightly higher calorific values than the forest floor and down wood likely due to greater lignin content. Among the three categories of organic matter lability, the largest proportion in all the unburned samples was that of recalcitrant compounds (Q2, 375–475 °C), which made up between 42.2 and 61.5% of the total Q. The combustion heat <375 °C (Q1) accounted for 26.2–40.3% of the total Q, indicating thermolabile compounds. The highest values were observed for the forest floor in all forests. The proportion of highly thermostable organic compounds (Q3 > 475 °C) was 7.1–26.4% of the total Q. The cones were enriched with Q3. Positive correlations were found between the average values of Q3 and T50 (r = 0.72) as well as Q2 + Q3 and T50 (r = 0.94) at a significant level (p < 0.05).
After the fires, the DSC curves showed a loss of thermolabile components and a concomitant increase in thermostable compounds. The first exothermic peak significantly reduced or vanished. The heat produced by PyOM was higher compared to that in the unburned samples. The combustion heat (Q) values were significantly higher for bark, cone, and down wood PyOM (18.0–24.4 kJ/g) in all the studied forests, indicating a greater content of energy-rich compounds compared to the burned forest floor. The redistribution of Q1, Q2, and Q3 was variable within each of the studied components but in general, PyOM showed a lower proportion of Q1 and a higher thermal recalcitrance (Q2, Q3) than its precursors. The exception is cone PyOM in the spruce forest where a decrease in Q1 was not observed despite TG showing a decrease in thermolabile components. Forest floor PyOM in all forests and bark PyOM in Scots pine, larch, and spruce forests revealed an increase in the proportion of highly thermally stable organic compounds (Q3). Bark PyOM from the birch forest showed a noticeable increase in Q2 but not in Q3. Cone PyOM from the Scots pine and larch forests showed slight changes. Down wood PyOM revealed a significantly higher proportion of Q3 in the larch forest and Q2 in the Scots pine forest. In spruce stands, down wood PyOM had slightly higher proportions of Q2 and Q3 compared to the unburned down wood.
3.3. Fourier Transform Infrared Spectroscopy
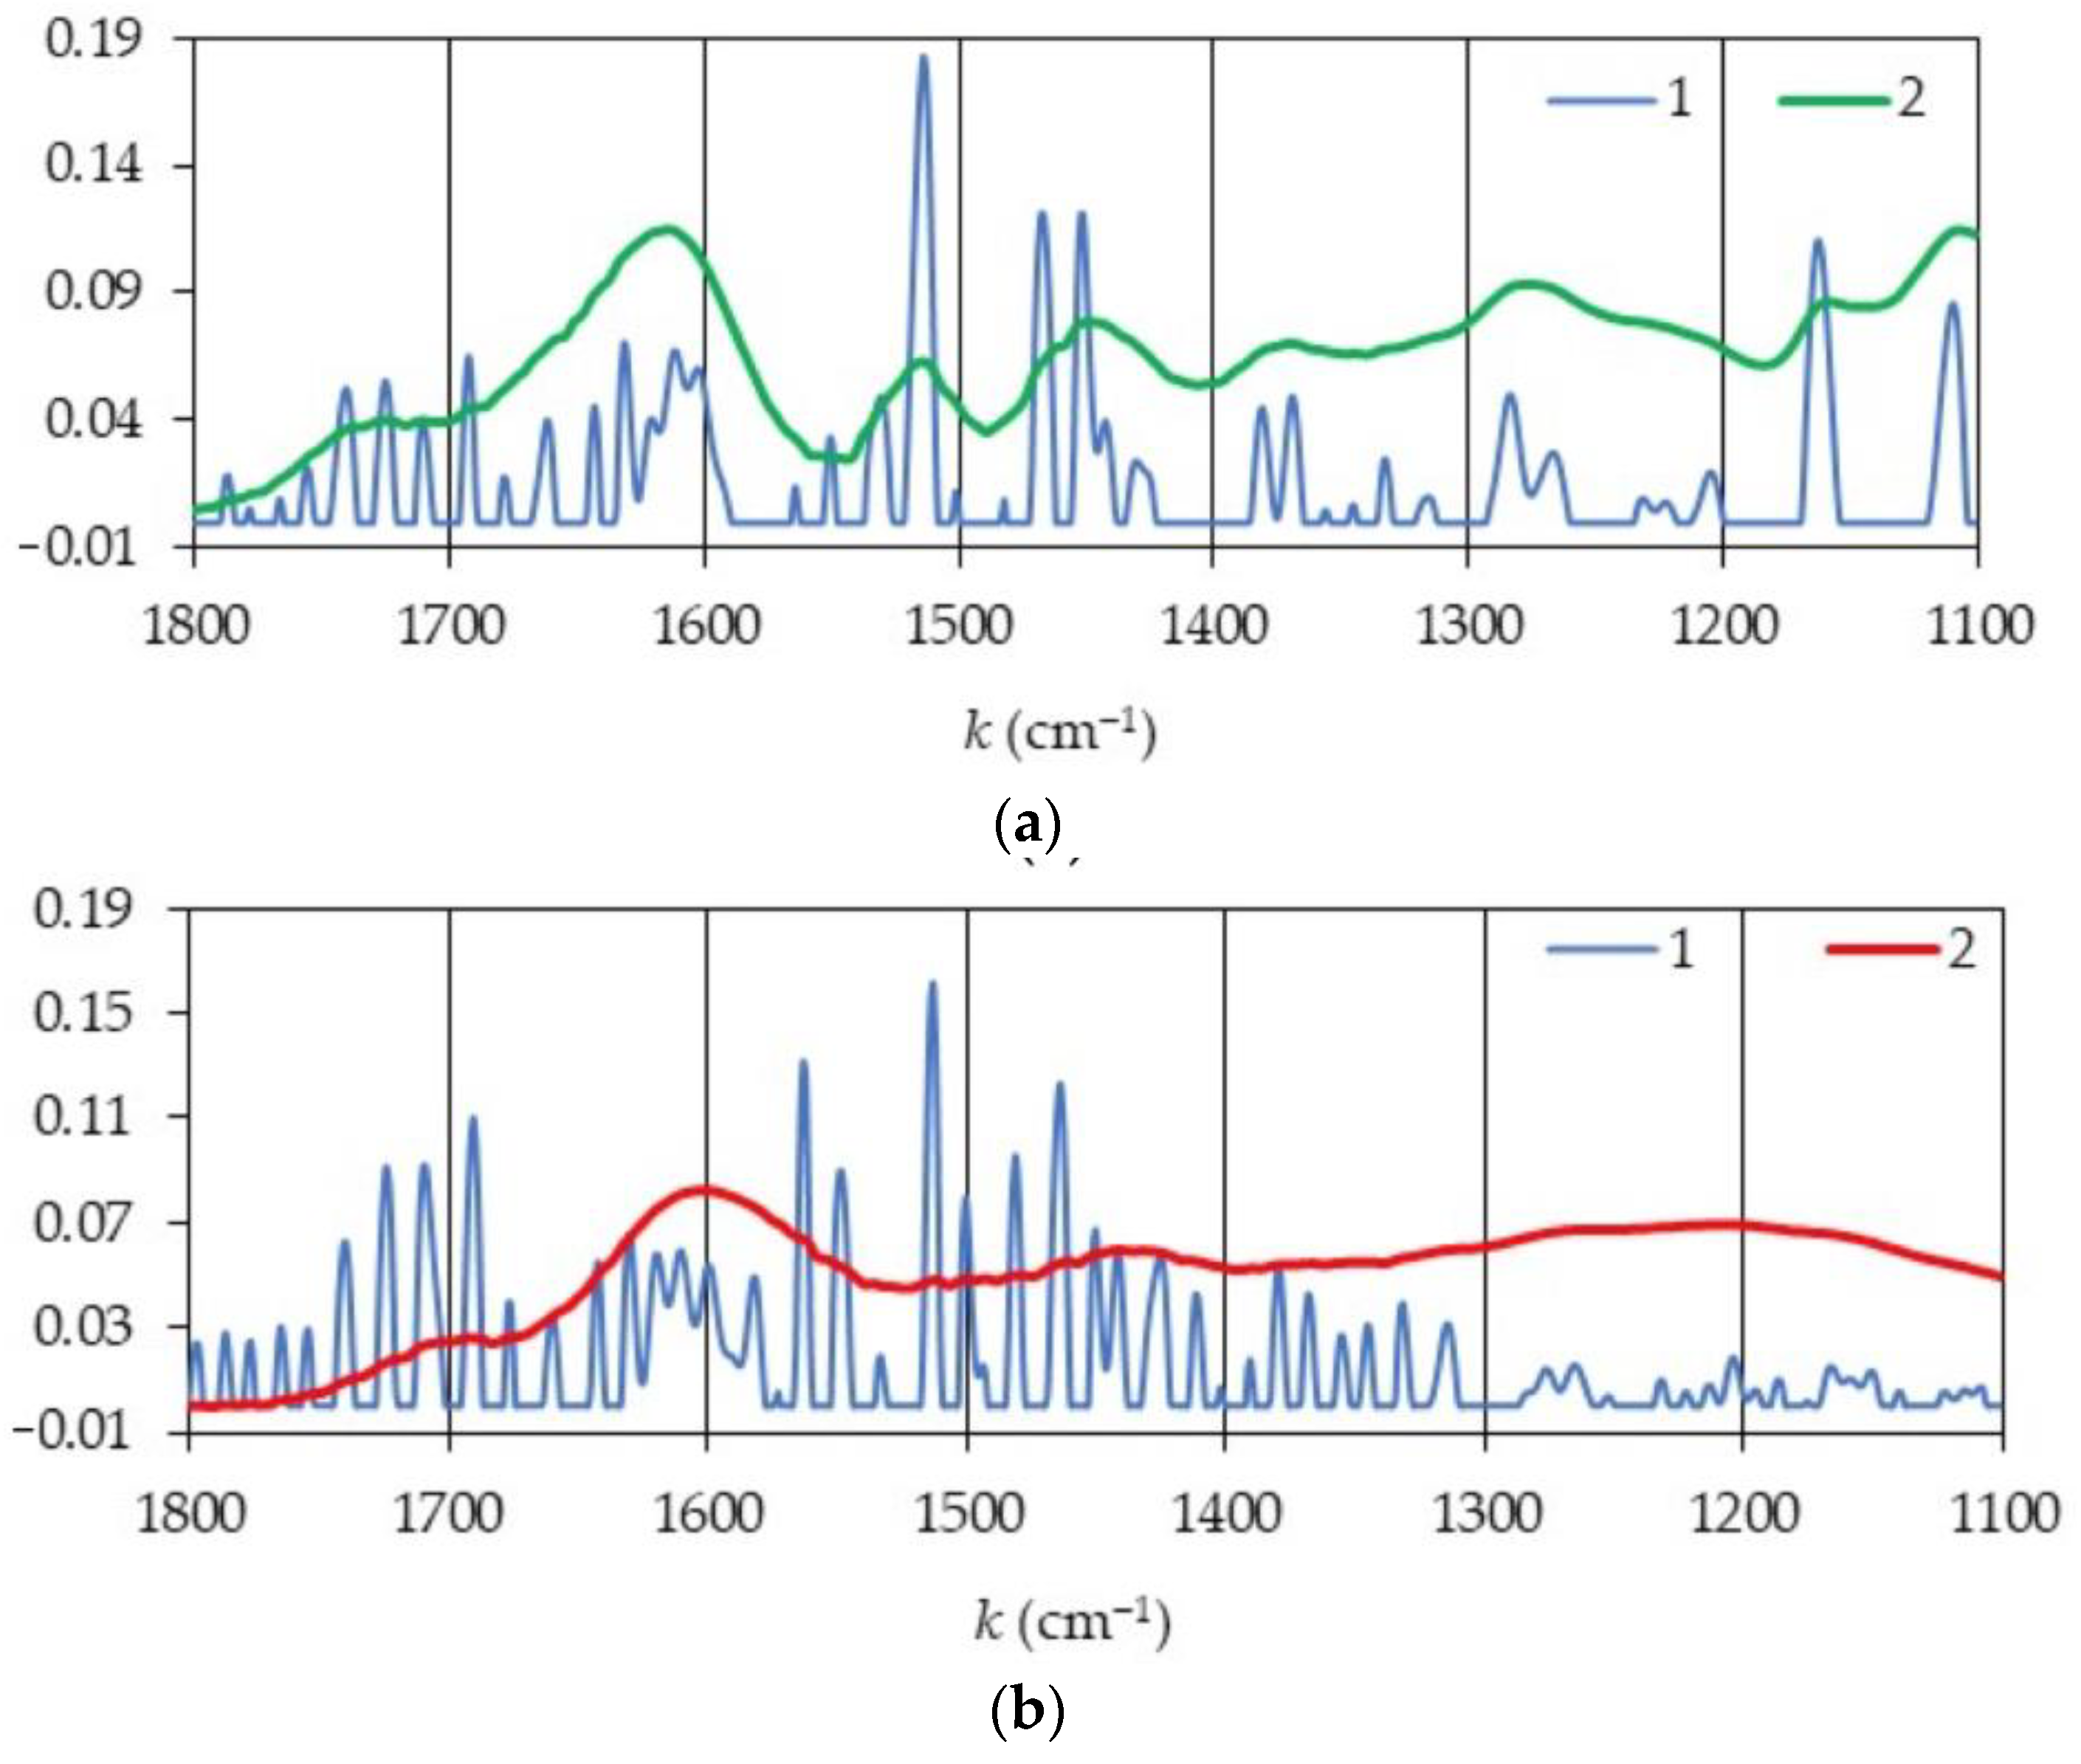
The changes in the chemical structure of organic matter can be monitored by FTIR analysis. The absorbance bands of different functional groups in the FTIR spectra of PyOM samples reflect alterations caused by fires. Figure 4 shows the spectra between 3900 and 400 cm−1 of unburned and burned bark samples from the Scots pine forest. The FTIR spectra for other fuels in the Scots pine forest and for other forests are provided in Figures S1–S4 in the Supplementary Materials. To enhance the resolution of the absorption bands, the second derivative was applied to the spectral data (Figure 5).
The prominent absorbance bands in the FTIR spectra of the samples were observed at approximately 3390, 2920, 2850, and 2360 cm−1 and in the fingerprint region (1800–800 cm−1). The band at 3390 cm−1 corresponds to the O–H stretching of hydroxyl groups from alcohols, phenols, and organic acids as well as hydrogen bonding due to adsorbed water [38,39]. The bands at 2920 cm−1 are attributed to C–H stretching vibration from the methylene group in aliphatic chains [40]. The band at 2850 cm−1 is due to C–H stretching in aromatic methoxyl groups and in methyl groups of side chains [41]. In general, O–H stretching and C-H stretching vibrations have contributions from all of the major biopolymers, i.e., hemicelluloses, cellulose, and lignin [42]. The band at 2360 cm−1 is due to the presence of carbon dioxide [43]. In the fingerprint region, FTIR spectra consist of specific and common bands that can be attributed to major components of the plant cell wall, i.e., hemicelluloses, cellulose, and lignin [44,45]. We focused on several characteristic bands in the FTIR spectra for polysaccharides and lignin (1726, 1514, 1600, 1371, 1267, 1160, and 1060 cm−1) in the fingerprint region to identify changes. The band at 1726 cm−1 corresponds to unconjugated C=O stretching, frequently of polysaccharide origin [44,46,47]. The band at 1600 cm−1 is related to the C=C stretching of the aromatic ring in lignin plus the C=O stretching modes of conjugated ketones and quinines [44,48]. The band at 1514 cm−1 is attributed to C=C aromatic skeletal vibrations stretching the benzene ring in lignin [39,47]. The band at 1371 cm−1 is due to C–H deformation in cellulose and hemicelluloses [49]. The band at 1267 cm−1 is attributed to guaiacyl ring breathing, C–O stretching in lignin, and C–O linkage in guiacyl aromatic methoxyl groups [46]. Hemicelluloses and cellulose exhibit characteristic bands at 1160 and 1060 cm−1 attributed to C–O–C asymmetric stretching vibrations and C–O stretching vibrations [44].
Fire led to a change in the intensity of various functional groups, indicating a strong alteration in the chemical structure of the organic matter. The intensity of the band at 3390 cm−1 diminished drastically for bark PyOM (by 78–83%) in all stands, followed by down wood PyOM in the Scots pine and larch forests, and cone and forest floor PyOM in the Scots pine, larch, and birch forests. The samples of forest floor PyOM from the spruce stand showed no change in the intensity of this band. The intensities of the bands at 2920, 2850, and 1726 cm−1 decreased for all PyOM samples. A higher decrease in the intensities of these bands was observed for the bark (by 58–73%) and down wood (66–79%) PyOM in the Scots pine and larch stands. These bands almost vanished for bark PyOM from the birch forest. In the spruce stand, the bark was also more strongly affected by fire compared to the forest floor, down wood, and cones, revealing a decrease in the band intensities by 46–62%. The breakage of hydroxyl groups of the aliphatic chain occurs between 120 °C and 200 °C. The cracking of aliphatic methyl, methylene, methoxyl groups, and the reformation of carbonyl and carboxyl occurs at ~350–400 °C. At higher temperatures (>600 °C), almost no aliphatic functional groups can be found [48,50].
The intensity of the characteristic bands of polysaccharides (1371, 1160, and 1060 cm−1) diminished for the majority of the PyOM samples compared to the unburned samples. In particular, the bark PyOM in all forests and down wood PyOM in the Scots pine and larch stands showed a significantly greater decrease. We observed a larger decrease in the intensity of the band at 1060 cm−1 than the bands at 1371 and 1160 cm−1. However, the 1160 and 1060 cm−1 bands were more intense for the forest floor PyOM in the Scots pine and spruce forests, and the band at 1371 cm−1 for forest floor PyOM in all stands. The down wood PyOM in the spruce forest also showed a stronger band at 1371 cm−1. The intensity of the band at 1160 cm−1 for cone PyOM from the spruce and larch forests remained almost unchanged. The increase in the intensity of the bands at 1371, 1160, and 1060 cm−1 was unexpected and may be related to the presence of uncharred material and/or mineral particles from ash or soil in the forest floor layer sampled [51,52]. The increase in the intensity of the band at 1030 cm−1 in burned forest floor was also observed by Merino et al. [14], who suggested that the more intense signal may be due to the higher content of silicates, which could mask the contribution of polysaccharide C–O bonds.
The differences in the spectra of burned and unburned samples were also observed in the regions specific to aromatic structures (1514, 1600, and 1267 cm−1). The intensity of the band at 1514 cm−1 was higher for the forest floor and cone PyOM in all the studied forests and down wood PyOM in the Scots pine and spruce stands. For bark PyOM in the Scots pine, larch, and birch forests and for down wood PyOM in the larch forest, this band intensity decreased. In general, the band at 1600 cm−1 behaved in a similar way as the band at 1514 cm−1 for the majority of the PyOM samples. However, some differences were observed. In particular, the cone PyOM in the spruce forest and forest floor PyOM in the birch forest showed no change in the intensity of this band. The bark PyOM in the spruce forest revealed a decrease in the intensity of the band at 1600 cm−1 while the band at 1514 cm−1 remained unchanged. The intensity of the band at 1267 cm−1 greatly increased for the forest floor and down wood PyOM in the spruce forest and slightly for the forest floor and cone PyOM in the larch forest. For other PyOM samples, this band decreased, indicating a loss of the C–O bond in lignin.
4. Discussion
The studied forests were affected by surface and crown fires from moderate to high severity, which suggests various degrees of organic matter transformation due to the maximum temperatures, duration of fire, oxygen concentration, and properties of fuels [14,23]. Wildfire charring results in similar chemical transformations of the plant materials as slow pyrolysis but in varying magnitudes [22]. Polysaccharides (hemicelluloses and cellulose) in plant biomass are preferentially lost as the temperature increases during a wildfire. Although the original aromatic plant materials are the sources of most of the aromatic compounds in PyOM, aliphatic and acidic compounds can be converted to aromatic compounds, thereby increasing the aromatic compound content in PyOM [4,13,14,53].
Thermal analysis indicated a loss of thermolabile components (polysaccharides) and higher content of thermostable compounds in fire-affected samples. All PyOM samples demonstrated enhanced thermal stability and chemical recalcitrance as indicated by T50, and thermal recalcitrance indexes of R50 and Q2 or Q3 compared to unburned ones, due to the degradation of the most thermolabile compounds, O-alkyl and alkyl structures, and the concomitant increase in aromatic structures [14,17]. According to Harvey et al. [21], thermal stability is a function of bond energy. The thermal stability of organic matter is a good indicator of its biogeochemical stability and the thermal stability of PyOM has also been suggested as a proxy for the biogeochemical stability of PyOM. PyOM dominated by a larger proportion of C–C single-bonded structures might have lower thermal stability than those dominated by C=C, conjugated, and aromatic structures [13,21]. The heat of combustion for PyOM samples (except for the forest floor PyOM from the spruce forest) was 1.1–2.2 times higher. Merino et al. [14,23,54] found that the DSC parameters of T50 and Q3 were significantly correlated with the degree of aromaticity measured by 13C NMR, suggesting that thermal properties may reflect the degree of aromatization/carbonization of charred compounds.
The FTIR spectra revealed that the bands characteristic for polysaccharides (1726, 1371, 1160, and 1060 cm−1) were much less pronounced in the PyOM samples relative to those in the unburned samples. Moreover, the reduced intensity of the bands produced by O-H stretching vibrations (3390 cm−1) and C–H aliphatic vibrations (2920 cm−1) indicated dehydration, dealkylation, and decarboxylation reactions occurring during fire [51]. Changes in the vibration of aromatic groups (1267, 1514, and 1600 cm−1) were also observed. Interestingly, the aromatic bands showed different behavior in the PyOM formed from bark, forest floor, down wood, and cones. An increase in the intensity of these bands observed in the majority of the PyOM samples indicated that lignin-type structures remained after burning and the content of aromatic structures increased (aromaticity increased). By contrast, a decrease in the intensity of these bands was caused by the breakages of the aromatic C=C bond and probably the formation of graphite-like structures which occurs at high (>600 °C) temperatures [50]. Similar changes in the vibration of aromatic groups have been observed with increasing temperature during the pyrolysis of plant biomass. For example, Li et al. [48] showed that the intensity of bands at 1600, 1400, 832, and 700 cm−1 increased for biochars produced at 350–500 °C but the spectra revealed the continuous loss of aromatic groups until the dominance of graphitic C in the temperature range of 650–800 °C. The FTIR spectra of wood and grass chars showed an increasing degree of condensation at charring temperatures of 500 °C and beyond (loss of intensity at 1650–1500 cm−1 relative to that at 885–752 cm−1) [53]. Thus, the decrease in the intensity of aromatic bonds and high values of T50 and Q3 found for bark PyOM in all forests and for down wood PyOM in the larch stand indicates an effect of high temperatures (>600 °C) and probably aromatic condensation. However, compared to the production of biochar, oxidative conditions favor the formation of small clusters of condensed aromatic carbon in the burned plant biomass, even at higher temperatures [14,55]. Czimczik et al. [1] found that surface fires in Siberian Scots pine forests converted organic carbon in the forest floor into alkyl and aromatic structures, the latter consisting of heterocyclic macromolecules and small clusters of condensed carbon.
The results of thermal analysis and FTIR spectroscopy showed that the outer bark of tree stems was strongly affected by fire in all the studied forests, probably due to high temperatures when tree stems were burning. The bark PyOM showed substantially higher thermal stability (indicated by T50) and proportion of highly recalcitrant compounds (Q3, >475 °C) compared to other PyOM samples. At the same time, bark PyOM affected by a high-severity crown fire demonstrated the highest values of T50 and R50. Rodríguez y Silva et al. [56] observed that in the tree crowns, the maximum temperatures ranged from 82 to 1224 °C during experimental crown fires in conifer forests. Valendik et al. [57] found that the temperature of convection flow varied from 329 to 930 °C at a tree stem height of 1 m during surface fires of various severities in the coniferous forests of Siberia. According to T50, the bark PyOM followed in the following order: Scots pine > larch > birch and spruce.
PyOM formation conditions during wildfires are very heterogeneous. Santín et al. [22] indicated that the maximum temperatures at the specific charcoal production sampling locations during an experimental high-intensity crown fire in a jack pine (Pinus banksiana) stand ranged from 550 °C to 950 °C. Ivanova et al. [58] showed that maximum temperatures on the ground surface in Scots pine and larch forests in the southern taiga of Siberia (Angara region) can reach 600–1010 °C during fires of various intensities. During fires, maximum ground temperatures are typically in the range of 200–300 °C but in some cases, the measured soil surface temperatures peak at 500–700 °C [59]. After high-severity fires in coniferous forests not only bark but also down wood PyOM samples showed a significant increase in the thermal stability: larch > Scots pine > spruce. The Q3 value (25.5%) and R50 thermal recalcitrance index (0.53) found for the down wood PyOM in the larch forest are close to those values (Q3, R50) obtained by Santín et al. [22] for down wood charcoal generated at the maximum temperature of 796 °C during an experimental high-intensity crown fire in jack pine (Pinus banksiana) stand.
The forest floor and cones were less affected by fire than bark and down wood in all the studied forests. However, forest floor PyOM revealed a substantial increase in Q3 compared to cone PyOM. The thermal stability of forest floor PyOM (T50) declines in the following order: Scots pine > birch > larch > spruce forests. For cones, the order is as follows: Scots pine > larch > spruce forest. The obtained values of Q3 for forest floor PyOM were slightly higher than those found by Santín et al. [22] for forest floor charcoal generated at the maximum temperatures of 550, 683, and 950 °C, while the R50 values were similar. The observed differences in the composition of PyOM can be related to variations in the heating conditions (fire characteristics and flammability of plant materials) and differences in the chemical degradation of lignin of each plant species during burning [13,14]. Our findings clearly showed that the forest floor, down wood, and cones in a spruce forest were noticeably less affected by fire due to its lower severity. Higher moisture conditions in the spruce forest were not conducive to the intense burning of organic matter. The obtained results indicate that fire severity played a key role in the transformation of plant materials in the studied forests. In general, the thermal stability of the PyOM samples decreased in the following order: bark > cone > down wood > forest floor in the Scots pine forest; bark/down wood > cone > forest floor in the larch forest; bark > down wood > cone > forest floor in the spruce forest; and bark > forest floor in the birch forest. In our opinion, the thermal stability of formed PyOM is significantly influenced first of all by the fire severity, and then by the chemical composition of fuels.
Assessment of the carbon sequestration potential of PyOM showed that, in general, the majority of the PyOM formed from fuels affected by high-severity fires in the Scots pine, larch, and birch forests had higher recalcitrance R50 indexes compared to the PyOM formed during moderate-severity fire in the spruce forest. The PyOM derived from bark, down wood, and cones during fires of high severity showed intermediate carbon sequestration potential, while the forest floor PyOM in all the studied forests was characterized by low carbon sequestration potential. In the spruce forest affected by a fire of moderate severity, all the PyOM samples, except for bark PyOM, demonstrated low carbon sequestration potential. None of the PyOM samples showed a high carbon sequestration potential. The low carbon sequestration potentials indicate a much higher susceptibility of the PyOM to biodegradation than intermediate carbon sequestration potential [21]. Our results are consistent with an earlier study by Santín et al. [22] who also found that the PyOM formed from the forest floor and down wood during a wildfire had low and intermediate carbon sequestration potentials.
5. Conclusions
This study demonstrates the alterations in properties of organic matter associated with wildfires of various severity in Scots pine, larch, spruce, and birch forests of southern Siberia. We compared, for the first time, the properties of fresh PyOM formed during naturally occurring spring fires from various fuel types in different forest ecosystems of Siberia. Our findings showed a significant decrease in thermolabile components (mostly hemicelluloses and cellulose) and a concomitant increase in aromatic structures, including highly recalcitrance compounds, in the fuels affected by fires. PyOM generated from the forest floor, down wood, cones, and outer bark of tree stems showed enhanced thermal stability compared to unburned samples. PyOM formed during fires of high severity had a greater value of the thermal recalcitrance index R50 than PyOM generated by a moderate-severity fire, with maximum values found for the bark affected by a high-severity crown fire, indicating less susceptibility to subsequent biological degradation. We found that the characteristics of PyOM varied substantially depending on fire severity and the type of vegetation burned. The predicted increases in fire severity across the boreal forests would lead to the production of more stable pyrogenic organic matter. To better understand the role of PyOM in the carbon budget, more regional studies are required to account for a range of different ecosystem types and fire characteristics.
Supplementary Materials
The following supporting information can be downloaded at: https://www.mdpi.com/article/10.3390/fire6080304/s1, Figure S1: FTIR spectra of unburned fuels (left) and PyOM (right) from a Scots pine forest. Note: k—wavenumber; Figure S2: FTIR spectra of unburned fuels (left) and PyOM (right) from a larch forest. Note: k—wavenumber; Figure S3: FTIR spectra of unburned fuels (left) and PyOM (right) from a spruce forest. Note: k—wavenumber; Figure S4: FTIR spectra of unburned fuels (left) and PyOM (right) from a birch forest. Note: k—wavenumber.
Author Contributions
Conceptualization, O.A.S., S.R.L., and E.A.K.; methodology, O.A.S., S.R.L., and E.A.K.; software, O.A.S. and S.R.L.; formal analysis, O.A.S., S.R.L., and E.A.K.; investigation, O.A.S. and E.A.K.; data curation, O.A.S., S.R.L., and E.A.K.; writing—original draft preparation, O.A.S. and E.A.K.; writing—review and editing, O.A.S. and E.A.K.; visualization, O.A.S. and S.R.L.; supervision, O.A.S.; funding acquisition, E.A.K. All authors have read and agreed to the published version of the manuscript.
Funding
This research was funded by State Assignment Projects # 0287-2021-0041 and 0287-2021-0011.
Institutional Review Board Statement
Not applicable.
Informed Consent Statement
Not applicable.
Data Availability Statement
The data presented in this study are available in the article and supplementary material. The original fieldwork data are available on request from the corresponding author.
Conflicts of Interest
The authors declare no conflict of interest.
References
- Czimczik, C.I.; Preston, C.M.; Schmidt, M.W.I.; Schulze, E.-D. How surface fire in Siberian Scots pine forests affects soil organic carbon in the forest floor: Stocks, molecular structure, and conversion to black carbon (charcoal). Glob. Biogeochem. Cycles 2003, 17, 1020. [Google Scholar] [CrossRef] [Green Version]
- Kharuk, V.I.; Ponomarev, E.I.; Ivanova, G.A.; Dvinskaya, M.L.; Coogan, S.C.P.; Flannigan, M.D. Wildfires in the Siberian taiga. Ambio 2021, 50, 1953–1974. [Google Scholar] [CrossRef] [PubMed]
- Kukavskaya, E.A.; Shvetsov, E.G.; Buryak, L.V.; Tretyakov, P.D.; Groisman, P.Y. Increasing fuel loads, fire hazard, and carbon emissions from fires in Central Siberia. Fire 2023, 6, 63. [Google Scholar] [CrossRef]
- McBeath, A.V.; Smernik, R.J.; Krull, E.S. A demonstration of the high variability of chars produced from wood in bushfires. Org. Geochem. 2013, 55, 38–44. [Google Scholar] [CrossRef]
- Bird, M.I.; Ascough, P.L. Isotopes in pyrogenic carbon: A review. Org. Geochem. 2012, 42, 1529–1539. [Google Scholar] [CrossRef] [Green Version]
- Bird, M.I.; Wynn, J.G.; Saiz, G.; Wurster, C.M.; McBeath, A. The pyrogenic carbon cycle. Annu. Rev. Earth Planet. Sci. 2015, 43, 273–298. [Google Scholar] [CrossRef]
- Saiz, G.; Goodrick, I.; Wuster, C.M.; Zimmermann, M.; Nelson, P.N.; Bird, M.I. Charcoal re-combustion efficiency in tropical savannas. Geoderma 2014, 219, 40–45. [Google Scholar] [CrossRef]
- Santín, C.; Doerr, S.H.; Preston, C.M.; González-Rodríguez, G. Pyrogenic organic matter production from wildfires: A missing sink in the global carbon cycle. Glob. Chang. Biol. 2015, 21, 1621–1633. [Google Scholar] [CrossRef] [Green Version]
- Santín, C.; Doerr, S.H.; Kane, E.S.; Masiello, C.A.; Ohlson, M.; de la Rosa, J.M.; Preston, C.M.; Dittmar, T. Towards a global assessment of pyrogenic carbon from vegetation fires. Glob. Chang. Biol. 2016, 22, 76–91. [Google Scholar] [CrossRef] [Green Version]
- Certini, G. Effects of fire on properties of forest soils: A review. Oecologia 2005, 143, 1–10. [Google Scholar] [CrossRef]
- Ascough, P.L.; Brock, F.; Collinson, M.E.; Painter, J.D.; Lane, D.W.; Bird, M.I. Chemical characteristics of macroscopic pyrogenic carbon following millennial-scale environmental exposure. Front. Environ. Sci. 2020, 7, 203. [Google Scholar] [CrossRef]
- Santín, C.; Doerr, S.H.; Jones, M.W.; Merino, A.; Warneke, C.; Roberts, J.M. The relevance of pyrogenic carbon for carbon budgets from fires: Insights from the FIREX experiment. Glob. Biogeochem. Cycles 2020, 34, e2020GB006647. [Google Scholar] [CrossRef]
- Gao, C.; Cong, J.; Sun, Y.; Han, D.; Wang, G. Variability in pyrogenic carbon properties generated by different burning temperatures and peatland plant litters: Implication for identifying fire intensity and fuel types. Int. J. Wildland Fire 2022, 31, 395–408. [Google Scholar] [CrossRef]
- Merino, A.; Chávez-Vergara, B.; Salgado, J.; Fonturbel, M.T.; García-Oliva, F.; Vega, J.A. Variability in the composition of charred litter generated by wildfire in different ecosystems. Catena 2015, 133, 52–63. [Google Scholar] [CrossRef]
- Keeley, J.E. Fire intensity, fire severity and burn severity: A brief review and suggested usage. Int. J. Wildland Fire 2009, 18, 116–126. [Google Scholar] [CrossRef]
- Wiedemeier, D.B.; Abiven, S.; Hockaday, W.C.; Keiluweit, M.; Kleber, M.; Masiello, C.A.; McBeath, A.V.; Nico, P.S.; Pyle, L.A.; Schneider, M.P.W.; et al. Aromaticity and degree of aromatic condensation of char. Org. Geochem. 2015, 78, 135–143. [Google Scholar] [CrossRef] [Green Version]
- Knicker, H.; Hilscher, A.; González-Vila, F.J.; Almendros, G. A new conceptual model for the structural properties of char produced during vegetation fires. Org. Geochem. 2008, 39, 935–939. [Google Scholar] [CrossRef] [Green Version]
- Knicker, H. Pyrogenic organic matter in soil: Its origin and occurrence, its chemistry and survival in soil environments. Quat. Int. 2011, 243, 251–263. [Google Scholar] [CrossRef]
- González-Pérez, J.A.; González-Vila, F.J.; Almendros, G.; Knicker, H. The effect of fire on soil organic matter—A review. Environ. Int. 2004, 30, 855–870. [Google Scholar] [CrossRef]
- Leifeld, J. Thermal stability of black carbon characterised by oxidative differential scanning calorimetry. Org. Geochem. 2007, 38, 112–127. [Google Scholar] [CrossRef]
- Harvey, O.R.; Kuo, L.-J.; Zimmerman, A.R.; Louchouarn, P.; Amonette, J.E.; Herbert, B.E. An index-based approach to assessing recalcitrance and soil carbon sequestration potential of engineered black carbons (Biochars). Environ. Sci. Technol. 2012, 46, 1415–1421. [Google Scholar] [CrossRef] [PubMed]
- Santín, C.; Doerr, S.H.; Merino, A.; Bucheli, T.D.; Bryant, R.; Ascough, P.; Gao, X.; Masiello, C.A. Carbon sequestration potential and physicochemical properties differ between wildfire charcoals and slow-pyrolysis biochars. Sci. Rep. 2017, 7, 11233. [Google Scholar] [CrossRef] [PubMed] [Green Version]
- Merino, A.; Fonturbel, M.T.; Fernández, C.; Chávez-Vergara, B.; García-Oliva, F.; Vega, J.A. Inferring changes in soil organic matter in post-wildfire soil burn severity levels in a temperate climate. Sci. Total Environ. 2018, 627, 622–632. [Google Scholar] [CrossRef] [PubMed]
- Krasnoshchekov, Y.N. Soils of ous forests and their transformation under the impact of fires in Baikal region. Eurasian Soil Sci. 2018, 51, 371–384. [Google Scholar] [CrossRef]
- Dymov, A.A.; Startsev, V.V.; Yakovleva, E.V.; Dubrovskiy, Y.A.; Milanovsky, E.Y.; Severgina, D.A.; Panov, A.V.; Prokushkin, A.S. Fire-induced alterations of soil properties in albic podzols developed under pine forests (middle taiga, Krasnoyarsky Kray). Fire 2023, 6, 67. [Google Scholar] [CrossRef]
- Shapchenkova, O.A.; Krasnoshchekov, Y.N.; Loskutov, S.R. Application of the methods of thermal analysis for the assessment of organic matter in postpyrogenic soils. Eurasian Soil Sci. 2011, 44, 677–685. [Google Scholar] [CrossRef]
- Hansen, M.C.; Potapov, P.V.; Moore, R.; Hancher, M.; Turubanova, S.A.; Tyukavina, A.; Thau, D.; Stehman, S.V.; Goetz, S.J.; Loveland, T.R.; et al. High-resolution global maps of 21st-century forest cover change. Science 2013, 342, 850–853. [Google Scholar] [CrossRef] [Green Version]
- Ministry of Natural Resources and Environment of the Russian Federation. On Approval of the List of Forest Zones in the Russian Federation and the List of Forest Regions of the Russian Federation; Decree of the Ministry of Natural Resources and Environment of the Russian Federation No. 367 of 18 August 2014; Revised on 19 February 2019; Ministry of Natural Resources and Environment of the Russian Federation: Moscow, Russia, 2019. (In Russian) [Google Scholar]
- Sofronov, M.A.; Volokitina, A.V.; Sofronova, T.M. Wildfires in Mountain Forests; Russian Academy of Sciences: Krasnoyarsk, Russia, 2008; p. 388. (In Russian) [Google Scholar]
- Furyaev, V.V. Pyrological regimes and dynamics of the southern taiga forests in Siberia. In Fire in Ecosystems of Boreal Eurasia; Goldammer, J.G., Furyaev, V.V., Eds.; Kluwer Academic Publishers: Dordrecht, The Netherlands, 1996; pp. 168–185. Available online: https://link.springer.com/book/10.1007/978-94-015-8737-2 (accessed on 10 July 2023).
- Ivanova, G.A.; Ivanov, A.V. Wildfires in Pine Forests of Central Siberia; Nauka: Novosibirsk, Russia, 2015; p. 240. (In Russian) [Google Scholar]
- Kurbatsky, N.P. Forest Fire Suppression Procedures and Tactics; Goslesbumizdat: Moscow, Russia, 1962; p. 154. (In Russian) [Google Scholar]
- Rosleskhoz Directive. About Approval of Instructions on Estimating Damage Caused by Forest Fires; No. 53 from 03.04.1998. Available online: https://docs.cntd.ru/document/901863083 (accessed on 10 July 2023). (In Russian).
- Bodí, M.B.; Martin, D.A.; Balfour, V.N.; Santín, C.; Doerr, S.H.; Pereira, P.; Cerdà, A.; Mataix-Solera, J. Wildland fire ash: Production, composition and eco-hydro-geomorphic effects. Earth-Sci. Rev. 2014, 130, 103–127. [Google Scholar] [CrossRef]
- Campo, J.; Merino, A. Variations in soil carbon sequestration and their determinants along a precipitation gradient in seasonally dry tropical forest ecosystems. Glob. Chang. Biol. 2016, 22, 1942–1956. [Google Scholar] [CrossRef]
- Brebu, M.; Vasile, C. Thermal degradation of lignin—A review. Cellul. Chem. Technol. 2010, 44, 353–363. [Google Scholar]
- Waters, C.L.; Janupala, R.R.; Mallinson, R.G.; Lobban, L.L. Staged thermal fractionation for segregation of lignin and cellulose pyrolysis products: An experimental study of residence time and temperature effects. J. Anal. Appl. Pyrolysis 2017, 126, 380–389. [Google Scholar] [CrossRef]
- Jindo, K.; Mizumoto, H.; Sawada, Y.; Sanchez-Monedero, M.A.; Sonoki, T. Physical and chemical characterization of biochars derived from different agricultural residues. Biogeosciences 2014, 11, 6613–6621. [Google Scholar] [CrossRef] [Green Version]
- Kubovský, I.; Kačíková, D.; Kačík, F. Structural changes of oak wood main components caused by thermal modification. Polymers 2020, 12, 485. [Google Scholar] [CrossRef] [PubMed] [Green Version]
- Coates, J. Interpretation of Infrared Spectra, A Practical Approach in Encyclopedia of Analytical Chemistry; Meyers, R.A., Ed.; John Wiley & Sons Ltd.: Chichester, UK, 2000; pp. 10815–10837. [Google Scholar]
- Boeriu, C.G.; Bravo, D.; Gosselink, R.J.A.; van Dam, J.E.G. Characterisation of structure-dependent functional properties of lignin with infrared spectroscopy. Ind. Crops Prod. 2004, 20, 205–218. [Google Scholar] [CrossRef]
- Shi, J.; Xing, D.; Lia, J. FTIR studies of the changes in wood chemistry from wood forming tissue under inclined treatment. Energy Procedia 2012, 16, 758–762. [Google Scholar] [CrossRef] [Green Version]
- Md Salim, R.; Asik, J.; Sarjadi, M.S. Chemical functional groups of extractives, cellulose and lignin extracted from native Leucaena leucocephala bark. Wood Sci. Technol. 2021, 55, 295–313. [Google Scholar] [CrossRef]
- Pozo, C.; Díaz-Visurraga, J.; Contreras, D.; Freer, J.; Rodríguez, J. Characterization of temporal biodegradation of radiata pine by Gloeophyllum trabeum through principal component analysis-based two-dimensional correlation. J. Chil. Chem. Soc. 2016, 61, 2878–2883. [Google Scholar] [CrossRef] [Green Version]
- Guizani, C.; Jeguirim, M.; Valin, S.; Limousy, L.; Salvador, S. Biomass Chars: The effects of pyrolysis conditions on their morphology, structure, chemical properties and reactivity. Energies 2017, 10, 796. [Google Scholar] [CrossRef] [Green Version]
- Pandey, K.K.; Pitman, A.J. FTIR studies of the changes in wood chemistry following decay by brown-rot and white-rot fungi. Int. Biodeterior. Biodegrad. 2003, 52, 151–160. [Google Scholar] [CrossRef]
- Esteves, B.; Velez Marques, A.; Domingos, I.; Pereira, H. Chemical changes of heat treated pine and eucalypt wood monitored by FTIR. Maderas. Cienc. Y Tecnol. 2013, 15, 245–258. [Google Scholar] [CrossRef] [Green Version]
- Li, M.-Y.; Cheng, S.-C.; Li, D.; Wang, S.-N.; Huang, A.-M.; Sun, S.-Q. Structural characterization of steam-heat treated Tectona grandis wood analyzed by FT-IR and 2D-IR correlation spectroscopy. Chin. Chem. Lett. 2015, 26, 221–225. [Google Scholar] [CrossRef]
- Tomak, E.D.; Topaloglu, E.; Gumuskaya, E.; Yildiz, U.C.; Ay, N. An FTIR study of the changes in chemical composition of bamboo degraded by brown-rot fungi. Int. Biodeterior. Biodegrad. 2013, 85, 131–138. [Google Scholar] [CrossRef]
- Elnour, A.Y.; Alghyamah, A.A.; Shaikh, H.M.; Poulose, A.M.; Al-Zahrani, S.M.; Anis, A.; Al-Wabel, M.I. Effect of pyrolysis temperature on biochar microstructural evolution, physicochemical characteristics, and its influence on biochar/polypropylene composites. Appl. Sci. 2019, 9, 1149. [Google Scholar] [CrossRef] [Green Version]
- Mastrolonardo, G.; Hudspith, V.A.; Francioso, O.; Rumpel, C.; Montecchio, D.; Doerr, S.H.; Certini, G. Size fractionation as a tool for separating charcoal of different fuel source and recalcitrance in the wildfire ash layer. Sci. Total Environ. 2017, 595, 461–471. [Google Scholar] [CrossRef]
- Jozanikohan, G.; Abarghooei, M.N. The Fourier transform infrared spectroscopy (FTIR) analysis for the clay mineralogy studies in a clastic reservoir. J. Petrol. Explor. Prod. Technol. 2022, 12, 2093–2106. [Google Scholar] [CrossRef]
- Keiluweit, M.; Nico, P.S.; Johnson, M.G.; Kleber, M. Dynamic Molecular Structure of Plant Biomass-Derived Black Carbon (Biochar). Environ. Sci. Technol. 2010, 44, 1247–1253. [Google Scholar] [CrossRef] [Green Version]
- Merino, A.; Ferreiro, A.; Salgado, J.; Fontúrbel, M.T.; Barros, N.; Fernández, C.; Vega, J.A. Use of thermal analysis and solid-state 13C CP-MAS NMR spectroscopy to diagnose organic matter quality in relation to burn severity in Atlantic soils. Geoderma 2014, 226–227, 376–386. [Google Scholar] [CrossRef]
- Preston, C.; Schmidt, M.W. Black (pyrogenic) carbon: A synthesis of current knowledge and uncertainties with special consideration of boreal regions. Biogeosciences 2006, 3, 397–420. [Google Scholar] [CrossRef] [Green Version]
- Rodríguez y Silva, F.; Guijarro, M.; Madrigal, J.; Jiménez, E.; Molina, J.R.; Hernando, C.; Vélez, R.; Vega, J.A. Assessment of crown fire initiation and spread models in Mediterranean conifer forests by using data from field and laboratory experiments. For. Syst. 2017, 26, e02S. [Google Scholar] [CrossRef] [Green Version]
- Valendik, E.N.; Sukhinin, A.I.; Kosov, I.V. Influence of Lowland Fires on the Stability of Conifers; V.N. Sukachev Institute of Forest SB RAS: Krasnoyarsk, Russia, 2006; p. 98. (In Russian) [Google Scholar]
- Ivanova, G.A.; Kukavskaya, E.A.; Bezkorovainaya, I.N.; Bogorodskaya, A.V.; Zhila, S.V.; Ivanov, V.A.; Kovaleva, N.M.; Krasnoshchekova, E.N.; Tarasov, P.A. Impact of Fires on the Light Coniferous Forests of Angara Region; Nauka: Novosibirsk, Russia, 2022; p. 204. (In Russian) [Google Scholar]
- Knicker, H. How does fire affect the nature and stability of soil organic nitrogen and carbon? A review. Biogeochemistry 2007, 85, 91–118. [Google Scholar] [CrossRef]
Figure 1.
Map of the locations of the study sites and views of burned Scots pine (Plot 1), larch (Plot 2), spruce (Plot 3), and birch (Plot 4) forests. Forested lands according to the product of Hansen et al. [27] are shown in green.
Figure 1.
Map of the locations of the study sites and views of burned Scots pine (Plot 1), larch (Plot 2), spruce (Plot 3), and birch (Plot 4) forests. Forested lands according to the product of Hansen et al. [27] are shown in green.

Figure 2.
TG (left) and DTG (right) curves of PyOM (1) and unburned (2) samples of stem bark from a Scots pine forest (a), cone from a larch forest (b), down wood from a spruce forest (c), and forest floor from a birch forest (d).
Figure 2.
TG (left) and DTG (right) curves of PyOM (1) and unburned (2) samples of stem bark from a Scots pine forest (a), cone from a larch forest (b), down wood from a spruce forest (c), and forest floor from a birch forest (d).
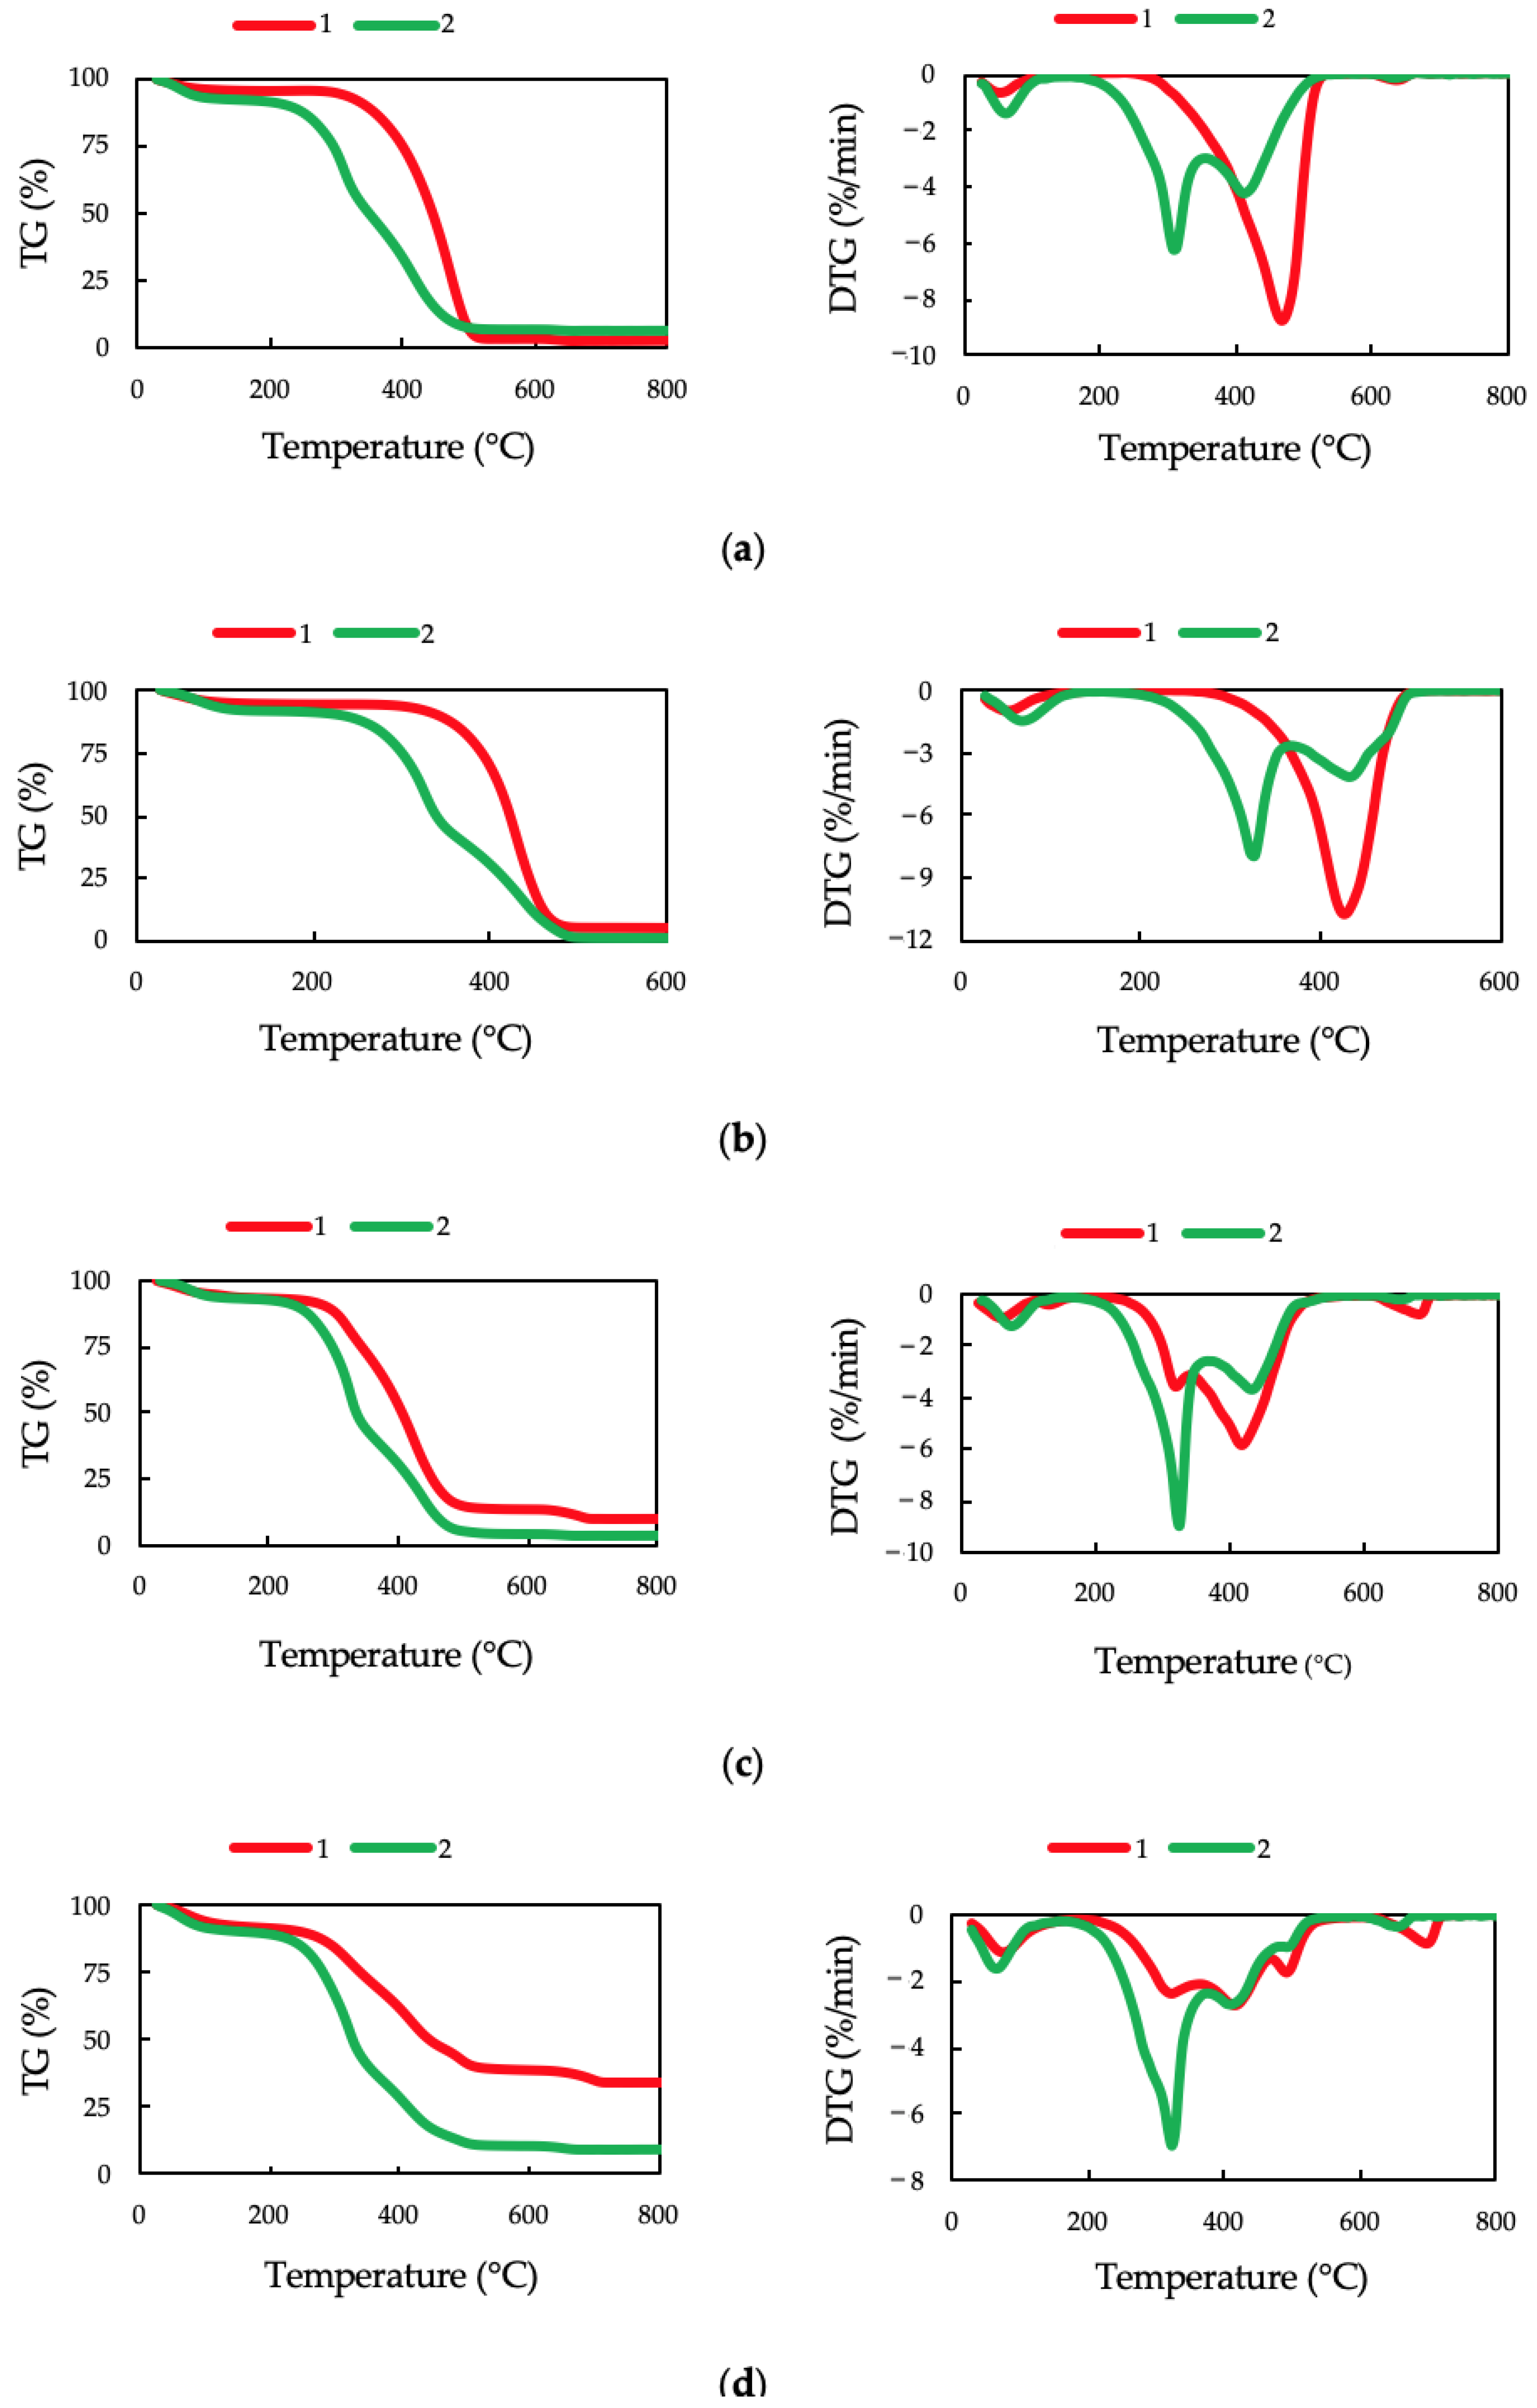
Figure 3.
DSC curves of PyOM (1) and unburned (2) samples of bark from a Scots pine forest (a), cone from a larch forest (b), down wood from a spruce forest (c), and forest floor from a birch forest (d).
Figure 3.
DSC curves of PyOM (1) and unburned (2) samples of bark from a Scots pine forest (a), cone from a larch forest (b), down wood from a spruce forest (c), and forest floor from a birch forest (d).

Figure 4.
FTIR spectra of unburned bark (a; green line) and bark PyOM (b; red line) from a Scots pine forest. Note. k—wavenumber.
Figure 4.
FTIR spectra of unburned bark (a; green line) and bark PyOM (b; red line) from a Scots pine forest. Note. k—wavenumber.

Figure 5.
Fragments of the second derivatives of FTIR spectra of unburned bark (a) and bark PyOM (b) from a Scots pine forest. 1—the second derivative (−∂2A/∂k2); 2—absorbance; k—wavenumber.
Figure 5.
Fragments of the second derivatives of FTIR spectra of unburned bark (a) and bark PyOM (b) from a Scots pine forest. 1—the second derivative (−∂2A/∂k2); 2—absorbance; k—wavenumber.

Table 1.
Stand structure and fire characteristics of examined forests.
| Plot | Coordinates | Stand Characteristics | Fire Characteristics | |||||
|---|---|---|---|---|---|---|---|---|
| Tree Species Composition * | DBH (cm) | Height (m) | Age (Years) | Basal Area (m2/ha) | Fire Type | Fire Severity | ||
| 1 | 53°32′58″ N 91°50′2″ E | 10P | 27.7 | 28.8 | 55 | 43.7 | crown | high |
| 2 | 53°16′51″ N 90°0′30″ E | 10L | 23.3 | 13.4 | 40 | 13.2 | surface | high |
| 3 | 56°19′6″ N 89°45′13″ E | 8S2B | 32.7 | 27.2 | 70 | 40.2 | surface | moderate |
| 4 | 55°51′32″ N 94°15′58″ E | 10B | 27.4 | 24.1 | 70 | 35.4 | surface | high |
* Forest woody vegetation composition is determined using a 10-unit scale on the basis of tree species volume. P is Scots pine, L is larch, S is spruce, and B is birch.
Table 2.
Parameters of the thermal degradation of unburned samples and PyOM. Standard deviations of the means are provided in parentheses.
Table 2.
Parameters of the thermal degradation of unburned samples and PyOM. Standard deviations of the means are provided in parentheses.
| Components | Unburned Samples at Control Plots | PyOM Samples at Burned Plots | ||||||||
|---|---|---|---|---|---|---|---|---|---|---|
| Mass Loss (%) | Residual Mass (%) | T50 (°C) | R50 | Mass Loss (%) | Residual Mass (%) | T50 (°C) | R50 | |||
| Ther- molabile | Ther- mostable | Ther- molabile | Ther- mostable | |||||||
| Plot 1. Scots pine forest | ||||||||||
| Tree bark | 44.09 (1.45) | 43.07 (1.63) | 4.96 (1.66) | 357 (10) | 0.43 (0.01) | 12.96 (1.81) | 79.05 (3.11) | 4.31 (1.51) | 446 (5) | 0.54 (0.01) |
| Down wood | 58.56 (2.14) | 31.22 (3.02) | 4.13 (0.98) | 328 (1) | 0.40 (0.001) | 15.40 (6.79) | 73.72 (5.86) | 7.39 (1.70) | 420 (12) | 0.51 (0.01) |
| Cone | 48.57 (2.96) | 42.11 (2.80) | 1.56 (0.46) | 351 (11) | 0.43 (0.01) | (20.67) (8.26) | 70.23 (7.85) | 4.56 (1.54) | 424 (13) | 0.51 (0.02) |
| Forest floor | 54.32 (1.28) | 32.38 (1.35) | 6.59 (1.30) | 335 (1) | 0.41 (0.002) | 24.56 (7.99) | 50.97 (12.41) | 17.65 (5.21) | 403 (22) | 0.49 (0.03) |
| Plot 2. Larch forest | ||||||||||
| Tree bark | 49.75 (1.40) | 38.54 (1.18) | 3.50 (0.66) | 348 (4) | 0.42 (0.005) | 20.80 (4.50) | 70.06 (5.62) | 3.94 (0.58) | 433 (16) | 0.53 (0.02) |
| Down wood | 57.61 (1.30) | 32.18 (0.82) | 3.49 (0.29) | 335 (3) | 0.41 (0.003) | 12.77 (7.23) | 74.15 (12.58) | 8.19 (3.02) | 433 (28) | 0.53 (0.03) |
| Cone | 50.33 (0.85) | 39.76 (0.86) | 1.45 (0.15) | 346 (3) | 0.42 (0.003) | 24.96 (9.98) | 64.35 (10.41) | 4.64 (0.42) | 410 (13) | 0.50 (0.02) |
| Forest floor | 57.82 (2.98) | 26.72 (1.22) | 6.37 (1.70) | 330 (2) | 0.40 (0.002) | 30.83 (4.19) | 41.89 (6.06) | 19.79 (2.42) | 385 (12) | 0.47 (0.02) |
| Plot 3. Spruce forest | ||||||||||
| Tree bark | 49.52 (2.57) | 37.29 (2.21) | 4.73 (1.17) | 344 (4) | 0.42 (0.01) | 17.43 (6.21) | 70.05 (6.50) | 6.64 (1.38) | 427 (15) | 0.52 (0.02) |
| Down wood | 56.53 (2.42) | 33.75 (1.69) | 3.39 (0.63) | 335 (2) | 0.41 (0.002) | 28.34 (6.16) | 57.41 (8.24) | 8.83 (2.20) | 404 (10) | 0.49 (0.01) |
| Cone | 41.41 (3.80) | 43.50 (3.13) | 2.97 (0.61) | 365 (7) | 0.44 (0.01) | 32.87 (4.19) | 53.63 (3.34) | 5.51 (1.63) | 396 (7) | 0.48 (0.01) |
| Forest floor | 51.17 (1.25) | 29.71 (0.58) | 8.66 (0.73) | 339 (8) | 0.41 (0.01) | 35.75 (4.84) | 37.70 (9.51) | 17.25 (7.62) | 367 (15) | 0.45 (0.02) |
| Plot 4. Birch forest | ||||||||||
| Tree bark | 48.62 (3.47) | 39.16 (1.99) | 4.89 (2.04) | 360 (5) | 0.44 (0.01) | 22.86 (5.97) | 67.78 (5.18) | 4.62 (0.32) | 427 (8) | 0.52 (0.01) |
| Forest floor | 52.92 (1.70) | 26.89 (0.89) | 9.14 (1.21) | 332 (2) | 0.40 (0.002) | 23.56 (4.45) | 37.17 (1.27) | 30.42 (6.19) | 399 (9) | 0.48 (0.01) |
Table 3.
DSC parameters of unburned samples and PyOM. Standard deviations of the means are provided in parentheses.
Table 3.
DSC parameters of unburned samples and PyOM. Standard deviations of the means are provided in parentheses.
| Components | Unburned Samples at Control Plots | PyOM Samples at Burned Plots | ||||||
|---|---|---|---|---|---|---|---|---|
| Q (kJ/g) | Q1 (%) | Q2 (%) | Q3 (%) | Q (kJ/g) | Q1 (%) | Q2 (%) | Q3 (%) | |
| Plot 1. Scots pine forest | ||||||||
| Tree bark | 11.3 (0.7) | 33.9 (3.9) | 51.3 (4.8) | 14.8 (8.6) | 22.8 (2.9) | 20.9 (1.2) | 43.8 (1.9) | 35.3 (2.4) |
| Down wood | 11.0 (0.6) | 32.2 (1.4) | 53.4 (1.0) | 14.3 (1.7) | 24.2 (3.5) | 23.7 (6.0) | 62.9 (6.0) | 13.4 (6.2) |
| Cone | 12.2 (1.3) | 26.2 (2.9) | 47.5 (1.3) | 26.3 (3.2) | 21.3 (2.0) | 21.9 (3.5) | 52.7 (5.0) | 25.4 (7.2) |
| Forest floor | 11.5 (0.6) | 37.5 (1.1) | 53.8 (0.8) | 8.7 (1.1) | 16.6 (2.5) | 26.2 (6.4) | 51.5 (2.0) | 22.4 (2.0) |
| Plot 2. Larch forest | ||||||||
| Tree bark | 12.6 (1.0) | 34.2 (1.2) | 49.3 (3.0) | 16.5 (4.1) | 20.9 (1.8) | 23.3 (2.5) | 39.5 (2.5) | 37.1 (4.9) |
| Down wood | 11.9 (0.9) | 34.0 (0.4) | 59.0 (1.2) | 7.1 (1.3) | 24.4 (2.4) | 21.8 (8.0) | 52.7 (8.3) | 25.5 (15.9) |
| Cone | 11.4 (1.2) | 29.2 (0.9) | 52.4 (5.8) | 18.4 (5.3) | 21.0 (5.5) | 26.7 (4.2) | 60.3 (6.4) | 13.0 (5.7) |
| Forest floor | 11.7 (0.5) | 38.7 (1.7) | 50.5 (0.7) | 10.8 (1.3) | 16.4 (2.0) | 32.1 (3.9) | 50.0 (1.5) | 17.8 (4.8) |
| Plot 3. Spruce forest | ||||||||
| Tree bark | 13.1 (0.9) | 35.6 (1.8) | 54.7 (2.6) | 9.7 (2.5) | 20.0 (2.1) | 21.7 (4.3) | 53.7 (3.4) | 24.6 (7.2) |
| Down wood | 12.1 (0.7) | 36.1 (1.2) | 52.7 (1.1) | 11.2 (0.4) | 18.8 (2.0) | 31.5 (4.8) | 56.2 (11.3) | 14.3 (6.4) |
| Cone | 13.8 (1.0) | 27.2 (3.0) | 61.5 (5.3) | 11.3 (2.7) | 18.0 (1.9) | 29.4 (2.2) | 57.0 (1.3) | 13.6 (1.9) |
| Forest floor | 12.8 (0.5) | 38.8 (0.4) | 51.4 (0.1) | 9.8 (0.4) | 12.9 (1.0) | 38.2 (2.1) | 46.6 (2.3) | 15.2 (0.9) |
| Plot 4. Birch forest | ||||||||
| Tree bark | 14.1 (1.1) | 31.4 (4.5) | 42.2 (4.2) | 26.4 (8.6) | 22.8 (1.6) | 20.7 (3.0) | 54.1 (5.2) | 25.1 (7.1) |
| Forest floor | 11.8 (1.2) | 40.3 (1.5) | 45.0 (2.4) | 14.7 (3.8) | 13.2 (2.2) | 33.7 (1.3) | 46.3 (1.5) | 20.0 (1.1) |
Disclaimer/Publisher’s Note: The statements, opinions and data contained in all publications are solely those of the individual author(s) and contributor(s) and not of MDPI and/or the editor(s). MDPI and/or the editor(s) disclaim responsibility for any injury to people or property resulting from any ideas, methods, instructions or products referred to in the content. |
© 2023 by the authors. Licensee MDPI, Basel, Switzerland. This article is an open access article distributed under the terms and conditions of the Creative Commons Attribution (CC BY) license (https://creativecommons.org/licenses/by/4.0/).
Share and Cite
MDPI and ACS Style
Shapchenkova, O.A.; Loskutov, S.R.; Kukavskaya, E.A. Alteration of Organic Matter during Wildfires in the Forests of Southern Siberia. Fire 2023, 6, 304. https://doi.org/10.3390/fire6080304
AMA Style
Shapchenkova OA, Loskutov SR, Kukavskaya EA. Alteration of Organic Matter during Wildfires in the Forests of Southern Siberia. Fire. 2023; 6(8):304. https://doi.org/10.3390/fire6080304
Chicago/Turabian StyleShapchenkova, Olga A., Sergei R. Loskutov, and Elena A. Kukavskaya. 2023. "Alteration of Organic Matter during Wildfires in the Forests of Southern Siberia" Fire 6, no. 8: 304. https://doi.org/10.3390/fire6080304