

The Role of Climate in Ignition Frequency

1
Fenner School of Environment and Society, The Australian National University, Canberra, ACT 2601, Australia
2
School of Engineering, The Australian National University, Canberra, ACT 2601, Australia
*
Author to whom correspondence should be addressed.
Fire 2023, 6(5), 195; https://doi.org/10.3390/fire6050195
Submission received: 14 February 2023
/
Revised: 20 March 2023
/
Accepted: 8 May 2023
/
Published: 10 May 2023
Abstract
:Many fire management agencies aim to detect and suppress all ignitions within their jurisdiction and may benefit from understanding the causes of year-to-year variation. Ignition variation is likely to be associated with climatically driven changes in fuel quantity or moisture in landscapes where ignition sources vary little over similar temporal scales. We assessed how monthly ignitions varied in south-eastern Australia in response to climate anomalies over approximately nine years. Once accounting for seasonal effects, ignitions increased with temperature and vapour pressure deficit anomalies and decreased with precipitation anomalies. These findings indicate that climatic conditions play a role in limiting ignition frequency via effects on fuel moisture. Our models predicted that warmer and drier conditions during our study caused considerable increases in ignition frequency compared to the long-term average reference period (1961–1990). Like many fire-prone landscapes around the world, our study area is projected to become hotter and drier because of climate change. Fire management agencies will need to improve fire detection and suppression capabilities under a future climate.
1. Introduction
Climatic variation has the potential to alter fuel conditions and the resultant frequency of unplanned fire ignitions. For example, exceptionally dry conditions across south-eastern Australia promoted higher than usual ignition success, despite no apparent change in the availability of ignition sources during the 2019–2020 fire season [1]. Many fire management agencies aim to detect and suppress all unplanned fire ignitions. Understanding how, and the extent to which, interannual climatic variation affects ignition frequency can assist fire managers in allocating resources efficiently. Higher than expected ignitions may overload fire management resources in jurisdictions that aim to suppress all fires [1]. Although the drivers of ignition occurrence have been well studied globally [2,3,4], most research focuses on ignition probability, rather than the absolute number of ignitions.
The occurrence of a successful unplanned fire ignition requires an ignition source and the availability of a sufficient quantity of fuel that is sufficiently dry [5,6,7]. Variation in exposure to ignition sources across the landscape may cause spatial variation in ignition frequency [2,8]. For example, lightning is the primary source of natural ignitions in most landscapes [8], but may be more likely in certain parts of the landscape [2,9,10]. Anthropogenic ignitions are typically the greatest contributor to the total number of ignitions in parts of the landscape frequented by people [8,10,11]. Ignition sources may not be a primary limitation on ignition occurrence in landscapes with a strong human presence [12], and may, therefore, contribute less to interannual variation in ignition frequency than climatic conditions do.
Climatic conditions vary from year to year at regional scales and may influence fuel quantity and moisture content [12,13,14]. That is, climate may influence ignition frequency more than ignition sources where ignition sources are abundant, such as landscapes with a strong human presence. In arid climates, climatic variation may affect plant productivity and the resultant quantity of fuel [12,15] and consequently ignition frequency. For example, relatively wet periods may promote more fuel production, resulting in a higher probability of a successful ignition [16]. Conversely, ignitions may become more frequent during drier periods in wetter climates where there is typically abundant fuel that is often too moist to ignite.
Climatic variability has been linked to annual fluctuations in the number of fires in fire-prone landscapes globally [16,17,18,19]. For example, warmer and drier conditions increased ignitions in Chile [16] and increased lighting ignitions in Alaska [20]. However, many studies focus on fires that burn more than a certain area (for example >0.5 hectares in Turco et al. (2013)) and may not include many ignitions that result in smaller fires. This assumes that ignitions that result in smaller fires did not have the potential to burn a greater area. Further, ignition analyses that exclude smaller fires may not describe conditions associated with the majority of ignitions attended by fire agencies.
This study aims to understand the importance that interannual climatic variation has on ignition frequency in a fire-prone landscape dominated by anthropogenic ignitions. We analysed the effects of climatic anomalies on the number of ignitions per month across the Australian Capital Territory, in south-eastern Australia between 2012 and 2021 to determine if and how interannual climatic variation affects ignition frequency. Monthly precipitation, temperature, and VPD (vapour pressure deficit) anomalies were used to predict the number of monthly ignitions. Predictions were made while accounting for the time of year (month) as we expected more ignitions during the austral summer (October to March). Once we had accounted for this seasonality, we expected ignitions to increase with temperature and VPD anomalies and decrease with precipitation anomalies.
2. Materials and Methods
2.1. Study Area
We assessed variation in ignition frequency within the Australian Capital Territory (ACT), in south-eastern Australia. Much of the ACT consists of forested mountains (~600–1900 m altitude), however, there is a large urban centre (Canberra, population ~400,000) in the lower elevation (~600 m altitude) north. Mean annual rainfall varies from 618 to 1383 mm and mean annual temperatures from 12.3 to 19.9 °C (1961 to 1990 average derived from SILO (Scientific Information for Land Owners)). Rainfall is relatively consistent throughout the year, but winters are cool with frosts (and snow at high elevations) and summers can be hot, regularly exceeding 30 °C at lower elevations. Climatic influences such as El Niño-Southern Oscillation (ENSO), Indian Ocean Dipole (IOD), and the Southern Annular Mode (SAM) are associated with interannual variation in temperature, rainfall, and fire weather [21]. Tall (>30 m) forests are common in the wetter parts of the ACT, and woodland and dry forests in the drier parts [22]. Grasslands are common throughout the valley floors, particularly in the north. Across the various landcover types in the ACT, fires typically occur during the austral summer (December to February) at an interval of 20 years or more [23]. Mean annual evapotranspiration is less than 1.9 times the mean annual precipitation across most of the ACT, indicating that fire activity is moisture limited within our study area [15]. Although this effect may be less pronounced in the drier and more populated Canberra region.
2.2. Ignition and Climate Data
Unplanned ignition data were provided by the ACT Emergency Services Agency (ESA) and included all ignitions that the ESA was notified of between December 2012 to August 2021 inclusive (Figure 1). Earlier ignition records were omitted due to suspected missing data. We constrained our analysis to Bushfire Prone Areas, which cover areas of the ACT where unplanned fires present a high risk to lives and property (Figure 1). Any incident that caused a fire within Bushfire Prone Areas was considered an ignition. This includes fires associated with car accidents and escaped planned fires, but not planned fires that remained within containment lines. It is likely that some ignitions in Bushfire Prone Areas are not included in the data because they were not reported, or self-extinguished before detection. Over the study period, there were 667 known ignitions of which approximately 70% were from anthropogenic sources, 23% from undetermined sources, and 7% were from natural causes (mostly lightning). There were 57 to 88 ignitions (mean = 70.8 ignitions) per fire season (12 months from July to June encompassing a single austral summer) over the eight full fire seasons captured in the data. Monthly ignitions ranged from zero to 39 (mean = 6.4) (Figure 2). We did not distinguish between ignition sources due to the low number of non-anthropogenic ignitions.
Climate data were obtained from SILO gridded daily weather observation data. Gridded weather data better represent the conditions across the entire study area than using weather station data, which only represent local conditions. SILO data is produced by extrapolating daily weather station observations into 5 × 5 km grid cells [24]. We used these data to calculate long-term (1961–1990) average monthly precipitation (monthly total), temperature (mean daily maximum), and vapour pressure deficit (mean daily vapour pressure deficit at the time of the maximum daily temperature) for each grid cell. Precipitation and temperature were chosen because of their relevance to fire risk [25] and they are two of the main climate variables forecasted ahead of fire seasons and in climate change projections. Vapour pressure deficit was chosen because of its relationship with live [26] and dead [27] fuel moisture content. We produced climate anomalies for each month of the study period (December 2012 and August 2021 (inclusive)). Monthly climate anomalies were represented as a percentage of the long-term average (1961–1990) for a given month and then averaged over the entire study area. We used percent anomalies because the scale of absolute anomalies was expected to vary across the study area, making mean anomalies uninformative.
The monthly anomaly for the entire study area (Bushfire Prone Areas in the ACT) was produced from the weighted mean anomaly of all grid cells in the study area for a given month. Grid cells were weighted by the proportion of the cell within Bushfire Prone Areas in the ACT. By weighting each grid cell, we avoided bias associated with grid cells that extended beyond the Bushfire Prone Areas mapping, where ignitions were not counted.
The climatic conditions varied over the duration of the study, including several particularly wet and particularly hot, dry years (Figure 2). Monthly climate anomalies varied from −94.6 to 321.5% (mean = −7.9%) for precipitation, −8 to 33.1% (mean = 9.1%) for maximum temperature, and −22.7 to 75.1% (mean = 12.5%) for VPD. The anomalies indicate that the study period was generally hotter and drier than the long-term average.
2.3. Analysis
We used Poisson Bayesian Generalised Additive Models (GAMs) to predict the number of ignitions per month in response to precipitation, temperature, and VPD anomalies. We used Bayesian regression because the posterior distribution is a better representation of the variance than frequentist approaches, and enables the ability to calculate the probability of certain outcomes. The use of GAMs allowed for the detection of non-linear responses to the month. We chose to assess monthly ignitions because most ignitions within this timeframe are likely to be responding to the same climatic conditions. Assessment of shorter timeframes would likely produce stronger predictions. However, our objective was to provide analysis that could be linked to medium-term forecasts that can be used to inform planning decisions, rather than specific weather conditions. Assessing monthly ignitions also enables an assessment of seasonal effects on ignition frequency. We separately predicted monthly ignitions in response to the one-, three-, six-, and twelve-month climate anomalies (e.g., the three-month anomaly for December 2012 would be calculated using the anomalies from October, November, and December 2012) to account for the compounding effects of successive anomalous months.
All analyses were conducted using the BRMS (Bayesian Regression Models using ‘Stan’) package [28] in R version 4.0.0 [29]. Separate models were fitted for each of the three climate variables due to the strong correlation between variables. For each climate variable, separate models were fitted for each of the anomaly periods (one, three, six, and twelve months). Climate variables were initially fitted as smooth terms to determine if there were non-linear effects, but none were identified and each was fitted as a linear predictor in the final models. The month was fitted as a cyclic cubic regression spline of the month to ensure a continuous effect from the start to the end of the year. An autoregressive term was specified to address the likely temporal correlation between ignitions. Each model was fitted with 4000 iterations (including 2000 warm-up iterations) on each of the four Markov chains (8000 posterior samples in total). We assessed convergence by checking that the Gelman Rubin R statistic [30] was less than 1.1. We calculated the Bayes R2 for the 5th, 50th, and 95th percentile of the posterior distribution to compare the predictive accuracy of the four climate anomaly periods. Figures showing the predicted number of monthly ignitions are only presented for the model using the one-month climate anomaly (marginal effects plots for all models are presented in supplementary material).
We used our models to determine if and how each of the climate variables affected ignition frequency over time. For each of the climate anomaly variables, we produced a posterior distribution (8000 samples) for each month of the year under two climate scenarios: the long-term average (0% anomaly) and the mean anomaly for each calendar month over the study period. Monthly predictions were summed to produce a distribution of annual ignitions under the long-term (1961–1990) and study period (November 2012–August 2021) climate scenarios. For simplicity, predictions were only made with the models using the one-month climate anomaly. We chose to assess the effects of the two climate scenarios on annual ignitions as this time scale aligns with the time scale that fire management agencies plan for. It also avoids the need to interpret the particular seasonal effects associated with ignitions in our study area.
3. Results
The predictive accuracy of each model was reasonable, with Bayes R2 values of the median posterior prediction ranging from 0.57 to 0.7 (Figure S1 in supplementary material). The Bayes R2 values of each model generally decreased with the increasing length of time over which the climate anomaly was calculated (Figure S1 in supplementary material). An exception to this trend is the three-month precipitation anomaly model, which had slightly higher Bayes R2 values than the one-month precipitation anomaly model. Models using the precipitation anomaly as the climate predictor generally had the highest Bayes R2 values, followed by models using the VPD anomaly. All models tended to slightly overpredict the number of ignitions when the observed number of ignitions was low, and underpredict when the observed number of ignitions was high (Figure S2 in supplementary material). This trend is particularly pronounced for the models that used the twelve-month temperature and VPD pressure deficit anomalies (Figure S2 in supplementary material).
Monthly ignitions were strongly influenced by the month and the climate anomaly in each model (Figure 3, Figures S3–S5 in supplementary material). The highest rate of ignitions occurred from December to February, with the lowest rate from June to July. The predicted number of ignitions increased from positive to negative precipitation anomalies, and from negative to positive temperature and VPD anomalies (Figure 3, Figures S3–S5 in supplementary material). The effects of climate anomalies generally resulted in greater variation in the predicted number of ignitions during the months when ignitions were higher (the austral summer) than months when ignitions were lower (the austral winter). These trends were consistent across models, regardless of the duration of the climate anomaly.
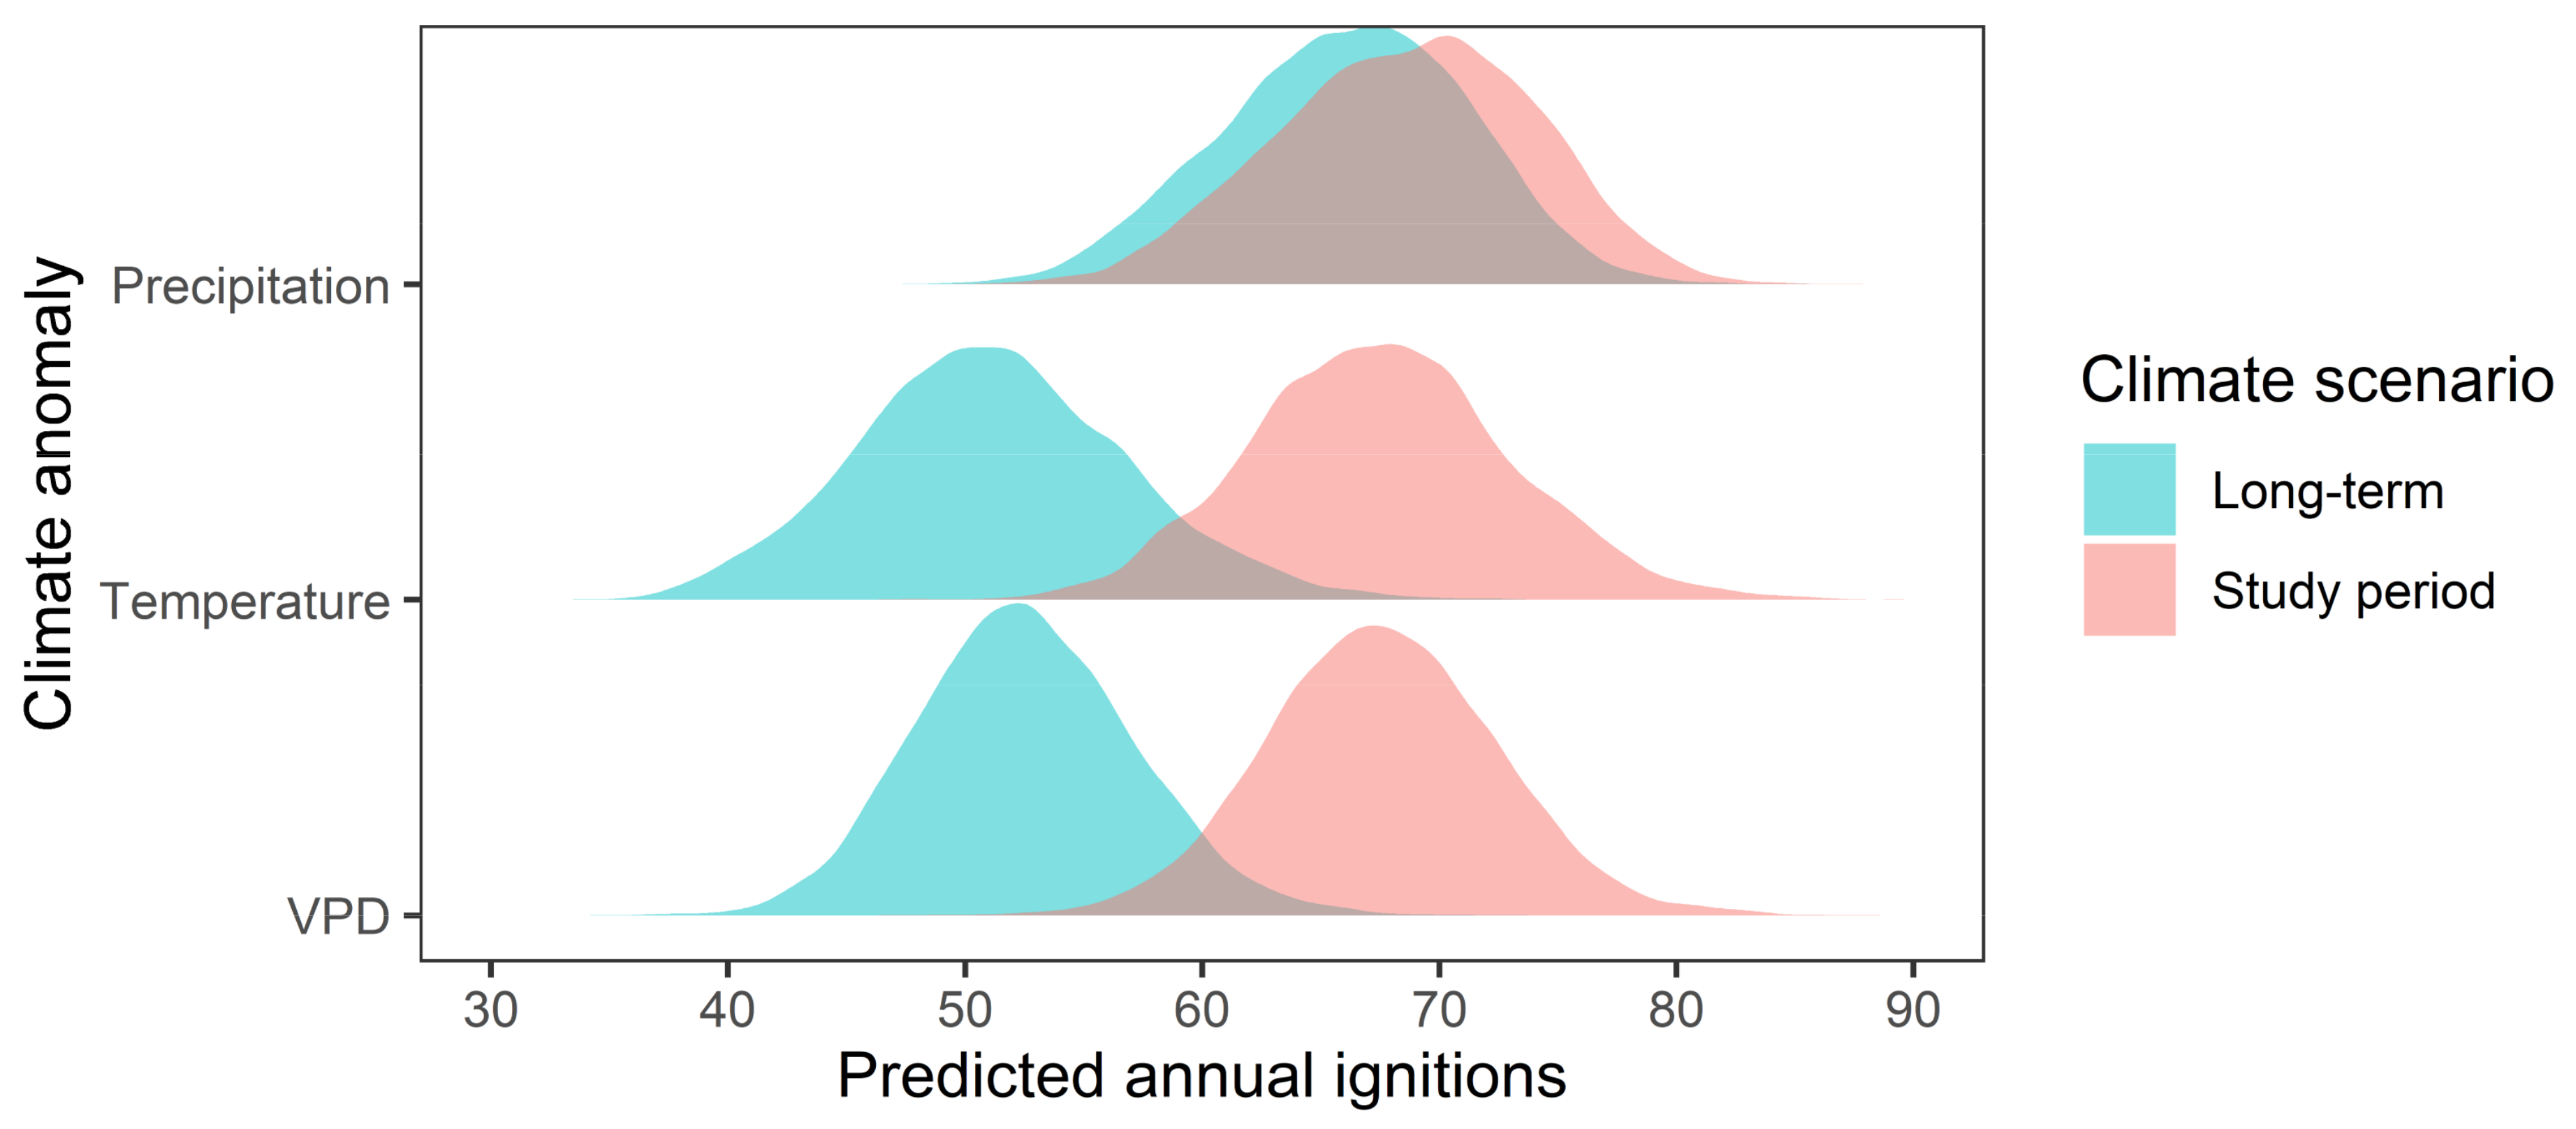
Each one-month climate anomaly model produced similar posterior distributions for annual ignitions under the long-term average and study period climate scenarios (Figure 4). The one-month precipitation model produced values that were slightly lower than the study period average when predictions were made using the long-term average climate anomalies (Figure 4). By contrast, the one-month temperature and VPD models generally predicted lower numbers of annual ignitions under the long-term climate scenario than in the study period scenario (Figure 4).
4. Discussion
Our analyses supported our hypothesis that interannual variation in ignition frequency would be influenced by climatic variation. Specifically, ignitions were more frequent during climatic anomalies that result in drier fuel (lower precipitation and higher temperatures and VPD) (Figure 3), indicating that ignitions may be, at least partially, limited by fuel moisture in our study area. These findings are consistent with research showing that ignitions become more frequent under drier conditions in other temperate landscapes [16,17]. As in other temperate fire-prone regions [31,32], ignitions were more frequent during the warmer months (October to March in our study area) than in the cooler months (Figure 3). The seasonal nature of ignitions is presumably a consequence of variation in fuel moisture caused by intra-annual climatic variation [33,34]. That is, climatic conditions associated with ignition potential vary enough to influence monthly ignitions across the year and between years for a given month (as expressed by the influence of climate anomalies in our study).
4.1. Links between Climatic Variation and Ignitions
The climatic variables assessed in our study (precipitation, temperature, and VPD) are involved in the process of fuel moisture depletion and replenishment. The potential for the atmosphere to absorb moisture from dead and live fuel increases with increasing temperature and VPD [26,27,35]. Consequently, VPD is used as a reliable predictor of dead and live fuel moisture content [26,36]. Precipitation influences soil moisture, which can replenish live and dead fuel moisture, thus reducing the rate of drying [37,38,39]. Similarly strong Bayes R2 values for the models using the one and three-month precipitation anomalies (Figure S1 in supplementary material) support findings that soil moisture affects fuel moisture over long timescales [39]. By contrast, atmospheric drivers of fuel moisture (temperature and VPD) exert their effects over relatively short periods (days to weeks) [14]. Temperature and VPD are, therefore, less likely to influence fuel conditions over longer time frames, as reflected by the relatively faster decline in Bayes R2 values with increasing climate anomaly averaging periods (Figure S1 in supplementary material).
The comparison of total annual ignitions under long-term and study period climate scenarios (Figure 4) indicates that climate change may be affecting ignition frequency in the ACT. Our analysis showed that, assuming no change in ignition availability, the minimum number of annual ignitions observed during our study period (57 ignitions recorded between July 2020 and June 2021) was six times more likely under the temperature and VPD anomalies observed during the study than under the long-term average conditions. While these estimates do not account for changes in the availability of ignition sources between the two scenarios, they serve to demonstrate the extent to which climatic variation, and climate change, can affect ignition occurrence. Maximum daily temperatures have increased in the ACT over the past century, and are expected to continue increasing [40,41]. Increasing temperatures can increase the VPD if relative humidity does not increase sufficiently. Precipitation, which may influence relative humidity, has not changed substantially in the ACT over the past century, nor is it projected to change because of climate change [40,41]. Flannigan, et al. [42] suggest precipitation may need to increase by up to 15% for every degree of warming to offset the increased atmospheric absorption of moisture from fuel in North America. Precipitation was marginally lower during our study period compared to the long-term average. This may explain the negligible difference in predicted annual ignitions between long-term average precipitation and the study period anomaly. Many other fire-prone landscapes in Australia and around the world are projected to become hotter and drier [43], and, therefore, may also experience an increase in the number of ignitions. Our findings complement other studies that suggest climate change may increase ignitions in south-eastern Australia [2,9] and in other fire-prone parts of the world [20,44].
4.2. Implications for Fire Management
Most of the ignitions in our data were associated with anthropogenic causes, which have the potential to be reduced through public policy decisions. For example, restricting unnecessary activities that can cause ignitions could reduce ignition frequency. Of course, completely removing anthropogenic ignition sources from the landscape is not a practical solution and some level of risk will remain. Our analyses show ignition frequency changes with climatic anomalies over 1-to-12-month periods. Hence, medium-term climate forecasts may be of benefit in planning ignition prevention campaigns, as well as detection resource allocations ahead of fire seasons.
It is difficult to determine if the increased number of ignitions associated with warmer and drier conditions will cause an increase in the area burnt, as the area burnt is also associated with hotter and drier conditions [45]. However, our findings suggest that more detection and containment resources will be required during anomalously hot and dry periods, which may become more common as the climate warms. These increased resource requirements are independent of those associated with the greater likelihood of larger fires occurring during these periods [21]. Therefore, fire management agencies may need to detect and contain more ignitions during hotter and drier years in addition to managing larger fires. Our models predict that the climate has already changed enough in the ACT to see increased ignitions and that this trend is likely to continue, due to a warming climate [40,41]. Improved fire detection capabilities will likely be required to meet the increasing resource demands associated with a warming climate [46].
4.3. Further Considerations
While our analysis provides clear links between ignition frequency and climatic conditions, this does not preclude other limitations on ignition frequency. The availability of ignition sources is still likely to limit ignitions, particularly in remote areas that are not as frequently visited by people [2]. There may be more people in the landscape during warm and dry days, and consequently a greater risk of anthropogenic ignitions. This may be partly captured by more ignitions during the seasonally warmer months (i.e., summer) and anomalously warmer and drier months. However, activity in some fire-prone areas of our study area is restricted on days when dangerous fire weather is forecast, which may counter the increased anthropogenic presence during warm and dry periods. Importantly, we are not aware of any changes in management or land use that would have caused obvious changes in the year-to-year availability of anthropogenic ignition sources during our study. Lightning activity is greater during the austral summer, which may contribute to the higher number of ignitions during this time [31,47]. However, we expect this effect to be relatively small, as lightning is unlikely to account for a large proportion of ignitions [2,11,31].
Although fire is likely limited by fuel moisture in our study area, some areas may also be limited by fuel quantity, particularly after a recent fire [9]. A fire in early 2020 burnt a large part of our study area, which may partially explain the decline in ignitions after early 2020 (Figure 2).
We also suggest that ignition detection and reporting may be more reliable during summer and anomalously warm and dry weather than in cooler and drier periods because of greater concern for the outbreak of unplanned fires. Vilar, et al. [48] suggest changes in land use may be a more important driver of fire occurrence than climate change in some landscapes. The ACT has a growing population and associated urban expansion, which may interact with ignition risk across the region.
We collected data over a range of conditions that broadly overlapped with conditions observed over the long-term average period (1961–1990). This enabled us to predict ignitions under long-term average and present climatic conditions. Caution must be taken in inferring our results beyond the range of climatic variance observed in our data, such as in a future climate. Climatic conditions outside of those assessed in our study may exert complex effects on landscape flammability outside of the short-term climatic effects explored in our study [49].
5. Conclusions
We predicted monthly ignitions in the ACT in response to climate anomalies while accounting for the effects of seasonal climatic variation. Monthly ignitions varied predictably throughout the year, with more ignitions during the summer months and fewer during winter. While accounting for seasonal variation, we detected variation in ignition frequency associated with monthly climatic anomalies. Ignitions were more frequent during anomalously warm and dry months than anomalously cool and wet months. These findings suggest that fuel moisture is a limitation on ignition frequency in our study area. Our models predicted more ignitions during the study period than under a long-term average climatic scenario due to higher temperatures and VPD, and moderate declines in precipitation. The contrast in climatic conditions between the two scenarios is consistent with observed and projected climate change patterns for the study area, other parts of south-eastern Australia, and many fire-prone areas around the world. This suggests that increased ignition frequency may become a global issue. The increasing demand for resources associated with the increasing frequency of ignitions caused by climate change may be best addressed by improved fire detection capabilities.
Supplementary Materials
The following supporting information can be downloaded at: https://www.mdpi.com/article/10.3390/fire6050195/s1, Figure S1 The Bayes R2 of the median (dot) and 5th–95th percentile (whisker) of the posterior distribution for the models using precipitation (circles), temperature (triangles) and vapour pressure deficit (VPD, squares) anomalies over one, three six and 12 month periods; Figure S2 The observed number of monthly ignitions plotted against the median (vertical line) and the 90th percentil of the posterior distribution (horizontal line) for the 12 models using precipitation, temperature and vapour pressure deficit (VPD) anomalies over one, three, six and 12 months; Figure S3 Marginal effects plots for models predicting ignitions in response to the month and precipitation anomaly over one (a and b), three (c and d), six (e and f) and 12 (g and h) months. Figures depict the median (solid blue line) and 90th percentile (grey band) of the posterior predictions; Figure S4 Marginal effects plots for models predicting ignitions in response to the month and temperature anomaly over one (a and b), three (c and d), six (e and f) and 12 (g and h) months. Figures depict the median (solid blue line) and 90th percentile (grey band) of the posterior predictions; Figure S5 Marginal effects plots for models predicting ignitions in response to the month and vapour pressure deficit anomaly over one (a and b), three (c and d), six (e and f) and 12 (g and h) months. Figures depict the median (solid blue line) and 90th percentile (grey band) of the posterior predictions.
Author Contributions
Conceptualization, N.W. and M.Y.; methodology, N.W.; formal analysis, N.W.; investigation, N.W.; resources, M.Y.; data curation, N.W.; writing—original draft preparation, N.W.; writing—review and editing, M.Y.; visualization, N.W.; supervision, M.Y.; project administration, M.Y.; funding acquisition, M.Y. All authors have read and agreed to the published version of the manuscript.
Funding
This research was partially funded by Optus as part of the ANU-Optus Bushfire Research Centre of Excellence.
Institutional Review Board Statement
Not applicable.
Informed Consent Statement
Not applicable.
Data Availability Statement
Pre-processed ignition and climate anomaly data are available from https://github.com/NickWilsonResearch/ACT_Monthly_Ignitions. SILO climate data can be downloaded from https://www.longpaddock.qld.gov.au/silo/ (accessed on 1 October 2021). Bushfire Prone Areas mapping can be downloaded from https://actmapi-actgov.opendata.arcgis.com/datasets/ACTGOV::bushfire-prone-areas/about (accessed on 14 September 2021). Original ignition data was provided by the Australian Capital Territory Emergency Services Agency on request.
Acknowledgments
We wish to acknowledge the Ngunnawal, who are the traditional custodians of the land on which our research was conducted. Acquisition and curation of ignition data were supported by the Australian Capital Territory Emergency Services Agency and the Australian Capital Territory Parks and Conservation Service. We also wish to thank the ANU Statistical Support Network for their statistical advice and the ANU-Optus Bushfire Research Centre of Excellence for their advice.
Conflicts of Interest
The authors declare no conflict of interest.
References
- Owens, D.; O’Kane, M. Final Report of the NSW Bushfire Inquiry; Department of Premier and Cabinet (NSW): Sydney, Australia, 2020. [Google Scholar]
- Clarke, H.; Gibson, R.; Cirulis, B.; Bradstock, R.A.; Penman, T.D. Developing and testing models of the drivers of anthropogenic and lightning-caused wildfire ignitions in south-eastern Australia. J. Environ. Manag. 2019, 235, 34–41. [Google Scholar] [CrossRef] [PubMed]
- Syphard, A.D.; Keeley, J.E. Location, timing and extent of wildfire vary by cause of ignition. Int. J. Wildland Fire 2015, 24, 37–47. [Google Scholar] [CrossRef]
- Rigden, A.J.; Powell, R.S.; Trevino, A.; McColl, K.A.; Huybers, P. Microwave retrievals of soil moisture improve grassland wildfire predictions. Geophys. Res. Lett. 2020, 47, e2020GL091410. [Google Scholar] [CrossRef]
- Cawson, J.G.; Duff, T.J. Forest fuel bed ignitability under marginal fire weather conditions in Eucalyptus forests. Int. J. Wildland Fire 2019, 28, 198–204. [Google Scholar] [CrossRef]
- Ellis, P. The likelihood of ignition of dry-eucalypt forest litter by firebrands. Int. J. Wildland Fire 2015, 24, 225–235. [Google Scholar] [CrossRef]
- Cawson, J.; Pickering, B.; Filkov, A.; Burton, J.; Kilinc, M.; Penman, T. Predicting ignitability from firebrands in mature wet eucalypt forests. For. Ecol. Manag. 2022, 519, 120315. [Google Scholar] [CrossRef]
- Pausas, J.G.; Keeley, J.E. Wildfires and global change. Front. Ecol. Environ. 2021, 19, 387–395. [Google Scholar] [CrossRef]
- Penman, T.; Bradstock, R.; Price, O. Modelling the determinants of ignition in the Sydney Basin, Australia: Implications for future management. Int. J. Wildland Fire 2012, 22, 469–478. [Google Scholar] [CrossRef]
- Curt, T.; Fréjaville, T.; Lahaye, S. Modelling the spatial patterns of ignition causes and fire regime features in southern France: Implications for fire prevention policy. Int. J. Wildland Fire 2016, 25, 785–796. [Google Scholar] [CrossRef]
- Collins, K.M.; Price, O.F.; Penman, T.D. Spatial patterns of wildfire ignitions in south-eastern Australia. Int. J. Wildland Fire 2015, 24, 1098–1108. [Google Scholar] [CrossRef]
- Bradstock, R.A. A biogeographic model of fire regimes in Australia: Current and future implications. Glob. Ecol. Biogeogr. 2010, 19, 145–158. [Google Scholar] [CrossRef]
- Meyn, A.; White, P.S.; Buhk, C.; Jentsch, A. Environmental drivers of large, infrequent wildfires: The emerging conceptual model. Prog. Phys. Geogr. 2007, 31, 287–312. [Google Scholar] [CrossRef]
- Nolan, R.H.; Boer, M.M.; Resco de Dios, V.; Caccamo, G.; Bradstock, R.A. Large-scale, dynamic transformations in fuel moisture drive wildfire activity across southeastern Australia. Geophys. Res. Lett. 2016, 43, 4229–4238. [Google Scholar] [CrossRef]
- Boer, M.M.; Resco De Dios, V.; Stefaniak, E.Z.; Bradstock, R.A. A hydroclimatic model for the distribution of fire on Earth. Environ. Res. Commun. 2021, 3, 035001. [Google Scholar] [CrossRef]
- Urrutia-Jalabert, R.; González, M.E.; González-Reyes, Á.; Lara, A.; Garreaud, R. Climate variability and forest fires in central and south-central Chile. Ecosphere 2018, 9, e02171. [Google Scholar] [CrossRef]
- Turco, M.; Llasat, M.C.; von Hardenberg, J.; Provenzale, A. Impact of climate variability on summer fires in a Mediterranean environment (northeastern Iberian Peninsula). Clim. Chang. 2013, 116, 665–678. [Google Scholar] [CrossRef]
- Eastaugh, C.S.; Hasenauer, H. Deriving forest fire ignition risk with biogeochemical process modelling. Environ. Model. Softw. 2014, 55, 132–142. [Google Scholar] [CrossRef]
- Westerling, A.L.; Hidalgo, H.G.; Cayan, D.R.; Swetnam, T.W. Warming and earlier spring increase western US forest wildfire activity. Science 2006, 313, 940–943. [Google Scholar] [CrossRef]
- Veraverbeke, S.; Rogers, B.M.; Goulden, M.L.; Jandt, R.R.; Miller, C.E.; Wiggins, E.B.; Randerson, J.T. Lightning as a major driver of recent large fire years in North American boreal forests. Nat. Clim. Chang. 2017, 7, 529–534. [Google Scholar] [CrossRef]
- Abram, N.J.; Henley, B.J.; Sen Gupta, A.; Lippmann, T.J.; Clarke, H.; Dowdy, A.J.; Sharples, J.J.; Nolan, R.H.; Zhang, T.; Wooster, M.J. Connections of climate change and variability to large and extreme forest fires in southeast Australia. Commun. Earth Environ. 2021, 2, 8. [Google Scholar] [CrossRef]
- Baines, G. ACT Vegetation Map 2018. Available online: https://actmapi-actgov.opendata.arcgis.com/datasets/ACTGOV::act-vegetation-map-2018/about (accessed on 29 July 2021).
- Murphy, B.P.; Bradstock, R.A.; Boer, M.M.; Carter, J.; Cary, G.J.; Cochrane, M.A.; Fensham, R.J.; Russell-Smith, J.; Williamson, G.J.; Bowman, D.M. Fire regimes of Australia: A pyrogeographic model system. J. Biogeogr. 2013, 40, 1048–1058. [Google Scholar] [CrossRef]
- Jeffrey, S.J.; Carter, J.O.; Moodie, K.B.; Beswick, A.R. Using spatial interpolation to construct a comprehensive archive of Australian climate data. Environ. Model. Softw. 2001, 16, 309–330. [Google Scholar] [CrossRef]
- Sharples, J.J.; Lewis, S.C.; Perkins-Kirkpatrick, S.E. Modulating influence of drought on the synergy between heatwaves and dead fine fuel moisture content of bushfire fuels in the Southeast Australian region. Weather Clim. Extrem. 2021, 31, 100300. [Google Scholar]
- de Dios, R.V.; Hedo, J.; Camprubí, À.C.; Thapa, P.; Del Castillo, E.M.; de Aragón, J.M.; Bonet, J.A.; Balaguer-Romano, R.; Díaz-Sierra, R.; Yebra, M. Climate change induced declines in fuel moisture may turn currently fire-free Pyrenean mountain forests into fire-prone ecosystems. Sci. Total Environ. 2021, 797, 149104. [Google Scholar] [CrossRef]
- de Dios, R.V.; Fellows, A.W.; Nolan, R.H.; Boer, M.M.; Bradstock, R.A.; Domingo, F.; Goulden, M.L. A semi-mechanistic model for predicting the moisture content of fine litter. Agric. For. Meteorol. 2015, 203, 64–73. [Google Scholar] [CrossRef]
- Bürkner, P.-C. brms: An R package for Bayesian multilevel models using Stan. J. Stat. Softw. 2017, 80, 1–28. [Google Scholar] [CrossRef]
- R Core Team, R. A Language and Environment for Statistical Computing, 4th ed.; R Foundation for Statistical Computing: Vienna, Austria, 2020. [Google Scholar]
- Gelman, A.; Rubin, D.B. Inference from iterative simulation using multiple sequences. Stat. Sci. 1992, 7, 457–472. [Google Scholar] [CrossRef]
- Plucinski, M. The timing of vegetation fire occurrence in a human landscape. Fire Saf. J. 2014, 67, 42–52. [Google Scholar] [CrossRef]
- Bajocco, S.; Koutsias, N.; Ricotta, C. Linking fire ignitions hotspots and fuel phenology: The importance of being seasonal. Ecol. Indic. 2017, 82, 433–440. [Google Scholar] [CrossRef]
- Nyman, P.; Metzen, D.; Noske, P.J.; Lane, P.N.; Sheridan, G.J. Quantifying the effects of topographic aspect on water content and temperature in fine surface fuel. Int. J. Wildland Fire 2015, 24, 1129–1142. [Google Scholar] [CrossRef]
- Yebra, M.; Chuvieco, E.; Riaño, D. Estimation of live fuel moisture content from MODIS images for fire risk assessment. Agric. For. Meteorol. 2008, 148, 523–536. [Google Scholar] [CrossRef]
- Matthews, S. Dead fuel moisture research: 1991–2012. Int. J. Wildland Fire 2013, 23, 78–92. [Google Scholar] [CrossRef]
- Nolan, R.H.; de Dios, V.R.; Boer, M.M.; Caccamo, G.; Goulden, M.L.; Bradstock, R.A. Predicting dead fine fuel moisture at regional scales using vapour pressure deficit from MODIS and gridded weather data. Remote Sens. Environ. 2016, 174, 100–108. [Google Scholar] [CrossRef]
- Zhao, L.; Yebra, M.; van Dijk, A.I.; Cary, G.J.; Matthews, S.; Sheridan, G. The influence of soil moisture on surface and sub-surface litter fuel moisture simulation at five Australian sites. Agric. For. Meteorol. 2021, 298, 108282. [Google Scholar] [CrossRef]
- Qi, Y.; Dennison, P.E.; Spencer, J.; Riaño, D. Monitoring live fuel moisture using soil moisture and remote sensing proxies. Fire Ecol. 2012, 8, 71–87. [Google Scholar] [CrossRef]
- Vinodkumar, V.; Dharssi, I.; Yebra, M.; Fox-Hughes, P. Continental-scale prediction of live fuel moisture content using soil moisture information. Agric. For. Meteorol. 2021, 307, 108503. [Google Scholar] [CrossRef]
- Evans, J.; Ji, F.; Lee, C.; Smith, P.; Argüeso, D.; Fita, L. Design of a regional climate modelling projection ensemble experiment–NARCliM. Geosci. Model Dev. 2014, 7, 621–629. [Google Scholar] [CrossRef]
- Office of Environment and Heritage. Australian Capital Territory Climate Change Snapshot; Report Pollution and Environmental Incidents; Office of Environment and Heritage: Sydney, Australia, 2015. [Google Scholar]
- Flannigan, M.; Wotton, B.; Marshall, G.; De Groot, W.; Johnston, J.; Jurko, N.; Cantin, A. Fuel moisture sensitivity to temperature and precipitation: Climate change implications. Clim. Chang. 2016, 134, 59–71. [Google Scholar] [CrossRef]
- Tebaldi, C.; Debeire, K.; Eyring, V.; Fischer, E.; Fyfe, J.; Friedlingstein, P.; Knutti, R.; Lowe, J.; O’Neill, B.; Sanderson, B. Climate model projections from the scenario model intercomparison project (ScenarioMIP) of CMIP6. Earth Syst. Dyn. 2021, 12, 253–293. [Google Scholar] [CrossRef]
- Fill, J.M.; Davis, C.N.; Crandall, R.M. Climate change lengthens southeastern USA lightning-ignited fire seasons. Glob. Chang. Biol. 2019, 25, 3562–3569. [Google Scholar] [CrossRef]
- Clarke, H.; Nolan, R.H.; De Dios, V.R.; Bradstock, R.; Griebel, A.; Khanal, S.; Boer, M.M. Forest fire threatens global carbon sinks and population centres under rising atmospheric water demand. Nat. Commun. 2022, 13, 7161. [Google Scholar] [CrossRef]
- Lindenmayer, D.; Zylstra, P.; Yebra, M. Adaptive wildfire mitigation approaches. Science 2022, 377, 1163–1164. [Google Scholar] [CrossRef]
- Nampak, H.; Love, P.; Fox-Hughes, P.; Watson, C.; Aryal, J.; Harris, R. Characterizing spatial and temporal variability of lightning activity associated with wildfire over Tasmania, Australia. Fire 2021, 4, 10. [Google Scholar] [CrossRef]
- Vilar, L.; Herrera, S.; Tafur-García, E.; Yebra, M.; Martínez-Vega, J.; Echavarría, P.; Martín, M.P. Modelling wildfire occurrence at regional scale from land use/cover and climate change scenarios. Environ. Model. Softw. 2021, 145, 105200. [Google Scholar] [CrossRef]
- Kennedy, M.C.; Bart, R.R.; Tague, C.L.; Choate, J.S. Does hot and dry equal more wildfire? Contrasting short-and long-term climate effects on fire in the Sierra Nevada, CA. Ecosphere 2021, 12, e03657. [Google Scholar] [CrossRef]
Figure 1.
Map of the study area (right) and its location in south-eastern Australia, including state and territory boundaries (right). The map contains the location of unplanned fire ignitions (black dots) in Bushfire Prone Areas (grey fill) of the Australian Capital Territory between December 2012 and August 2021.
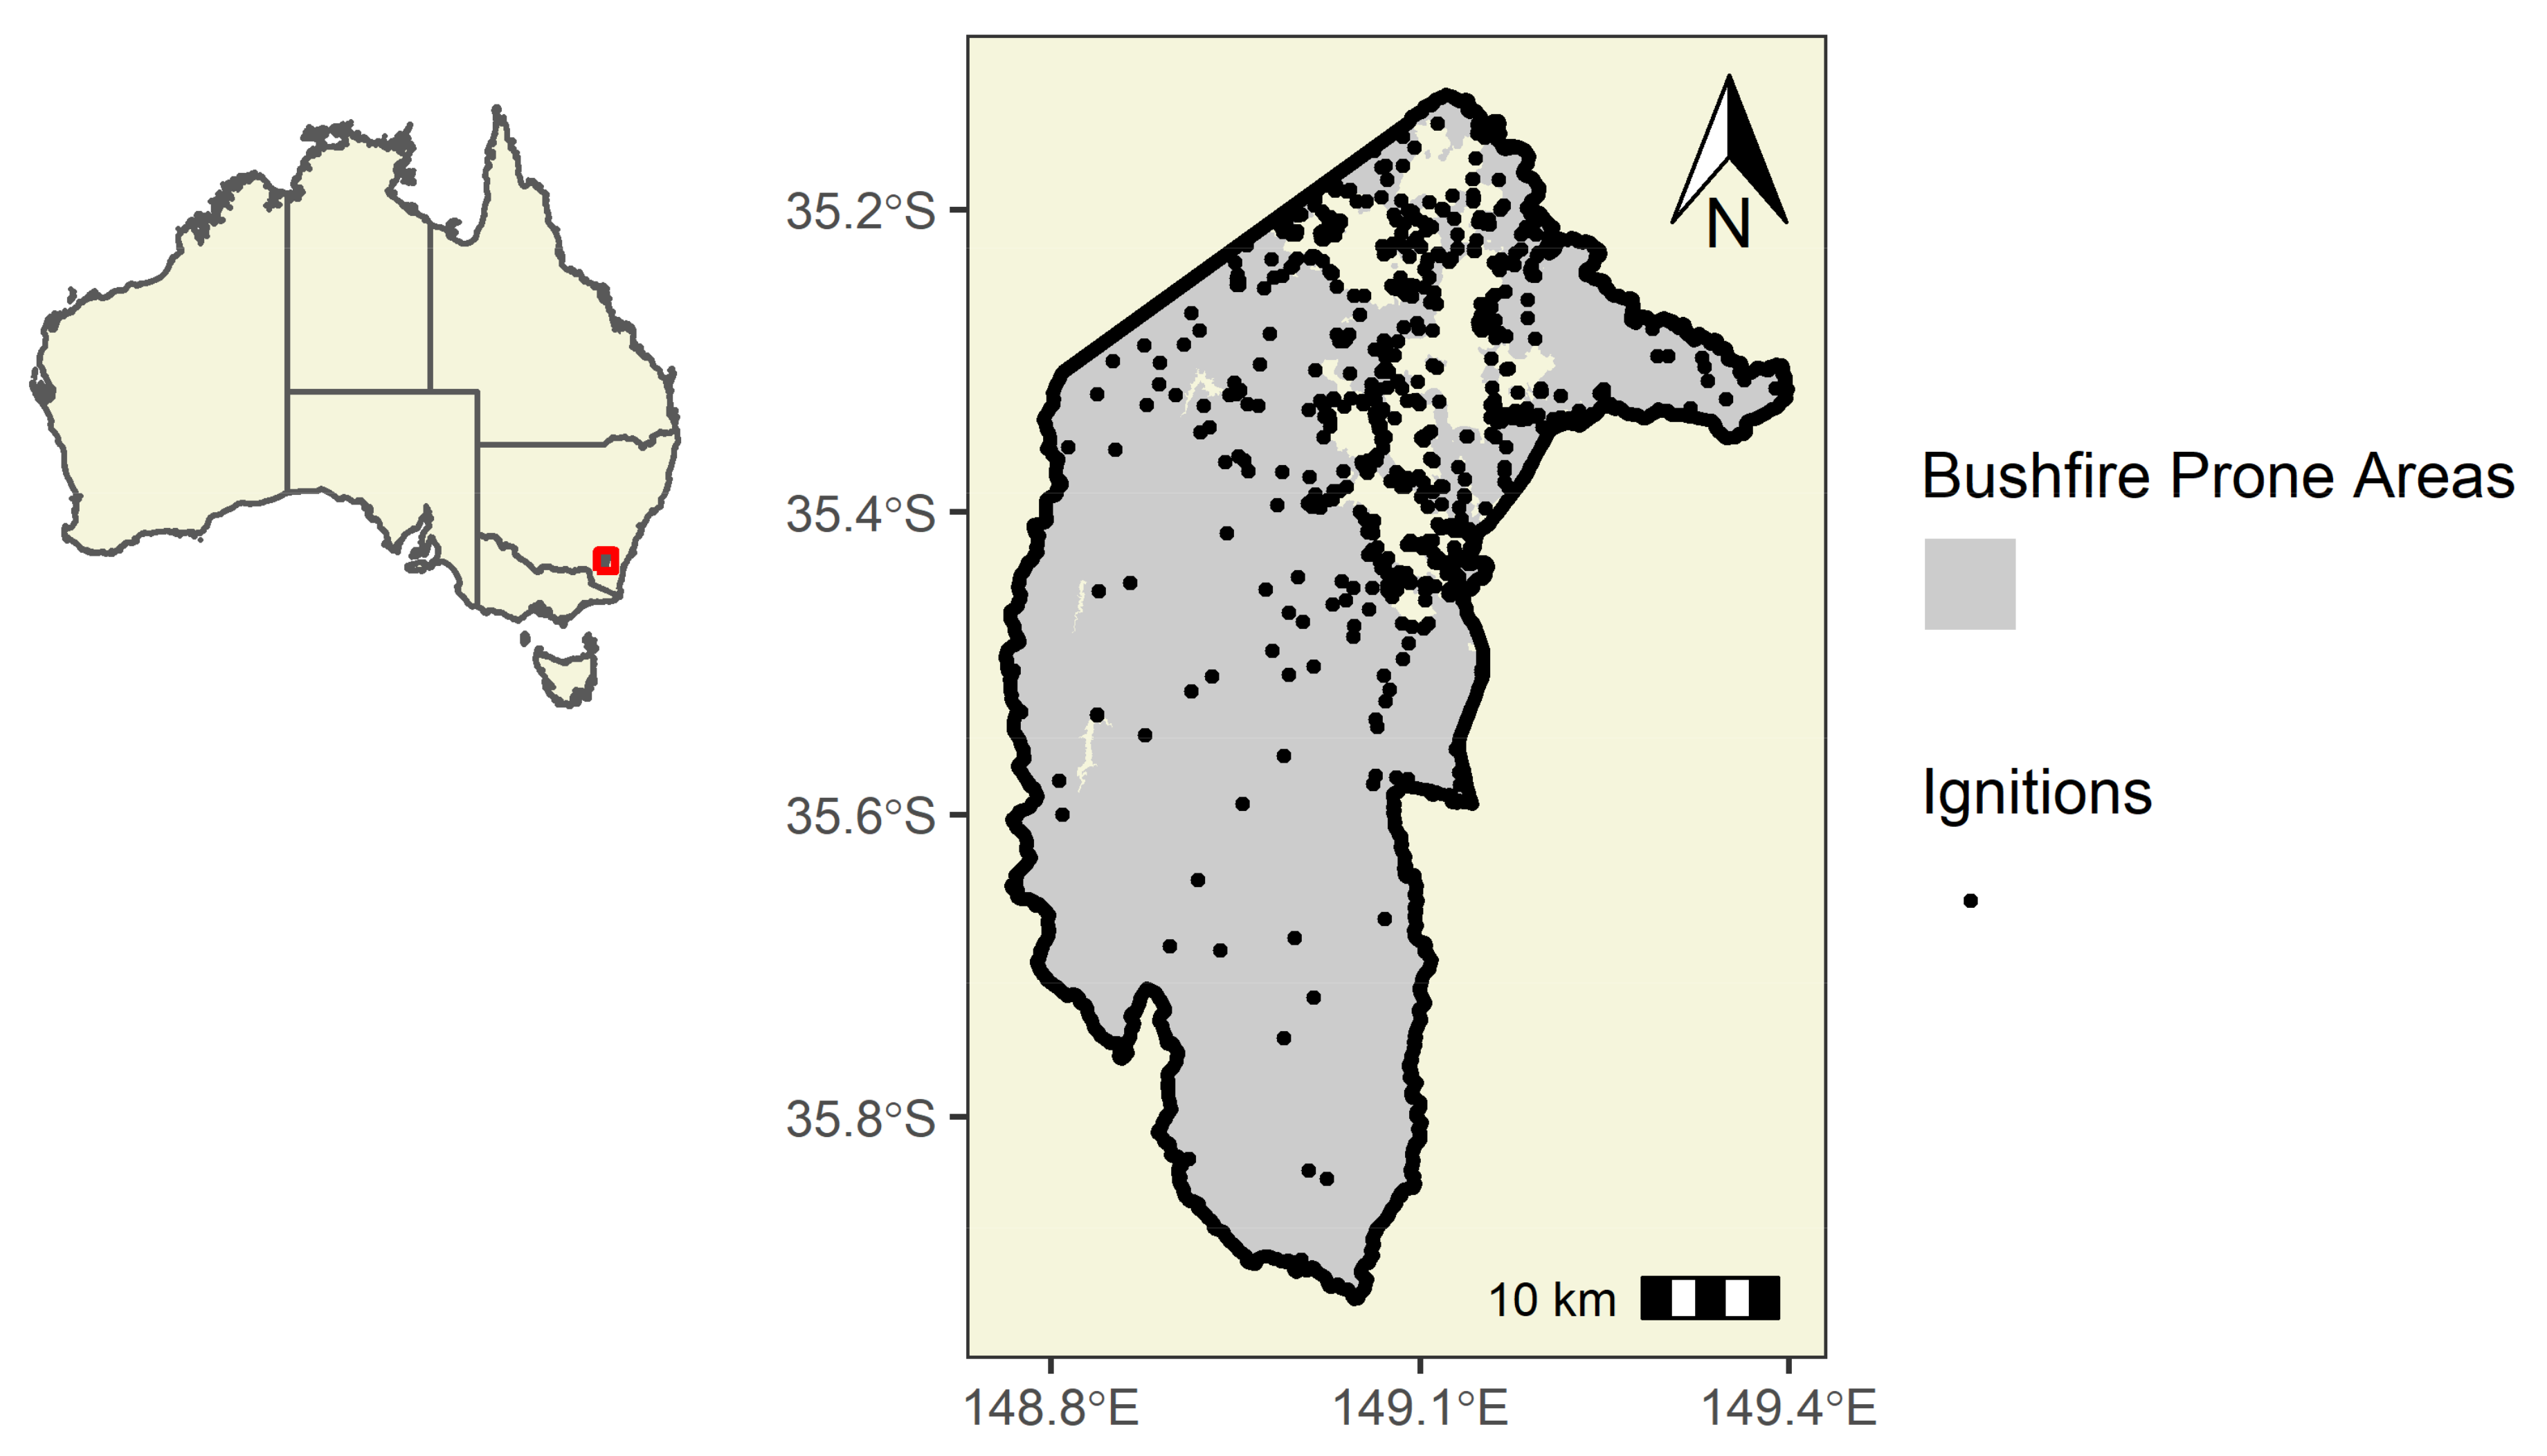
Figure 2.
Number of ignitions reported on Bushfire Prone Land in the Australian Capital Territory each month from November 2012 to August 2021 (grey bars), and the monthly precipitation ((a), blue), maximum daily temperature ((b), red), and vapour pressure deficit (VPD) at the time of the maximum daily temperature ((c), orange).
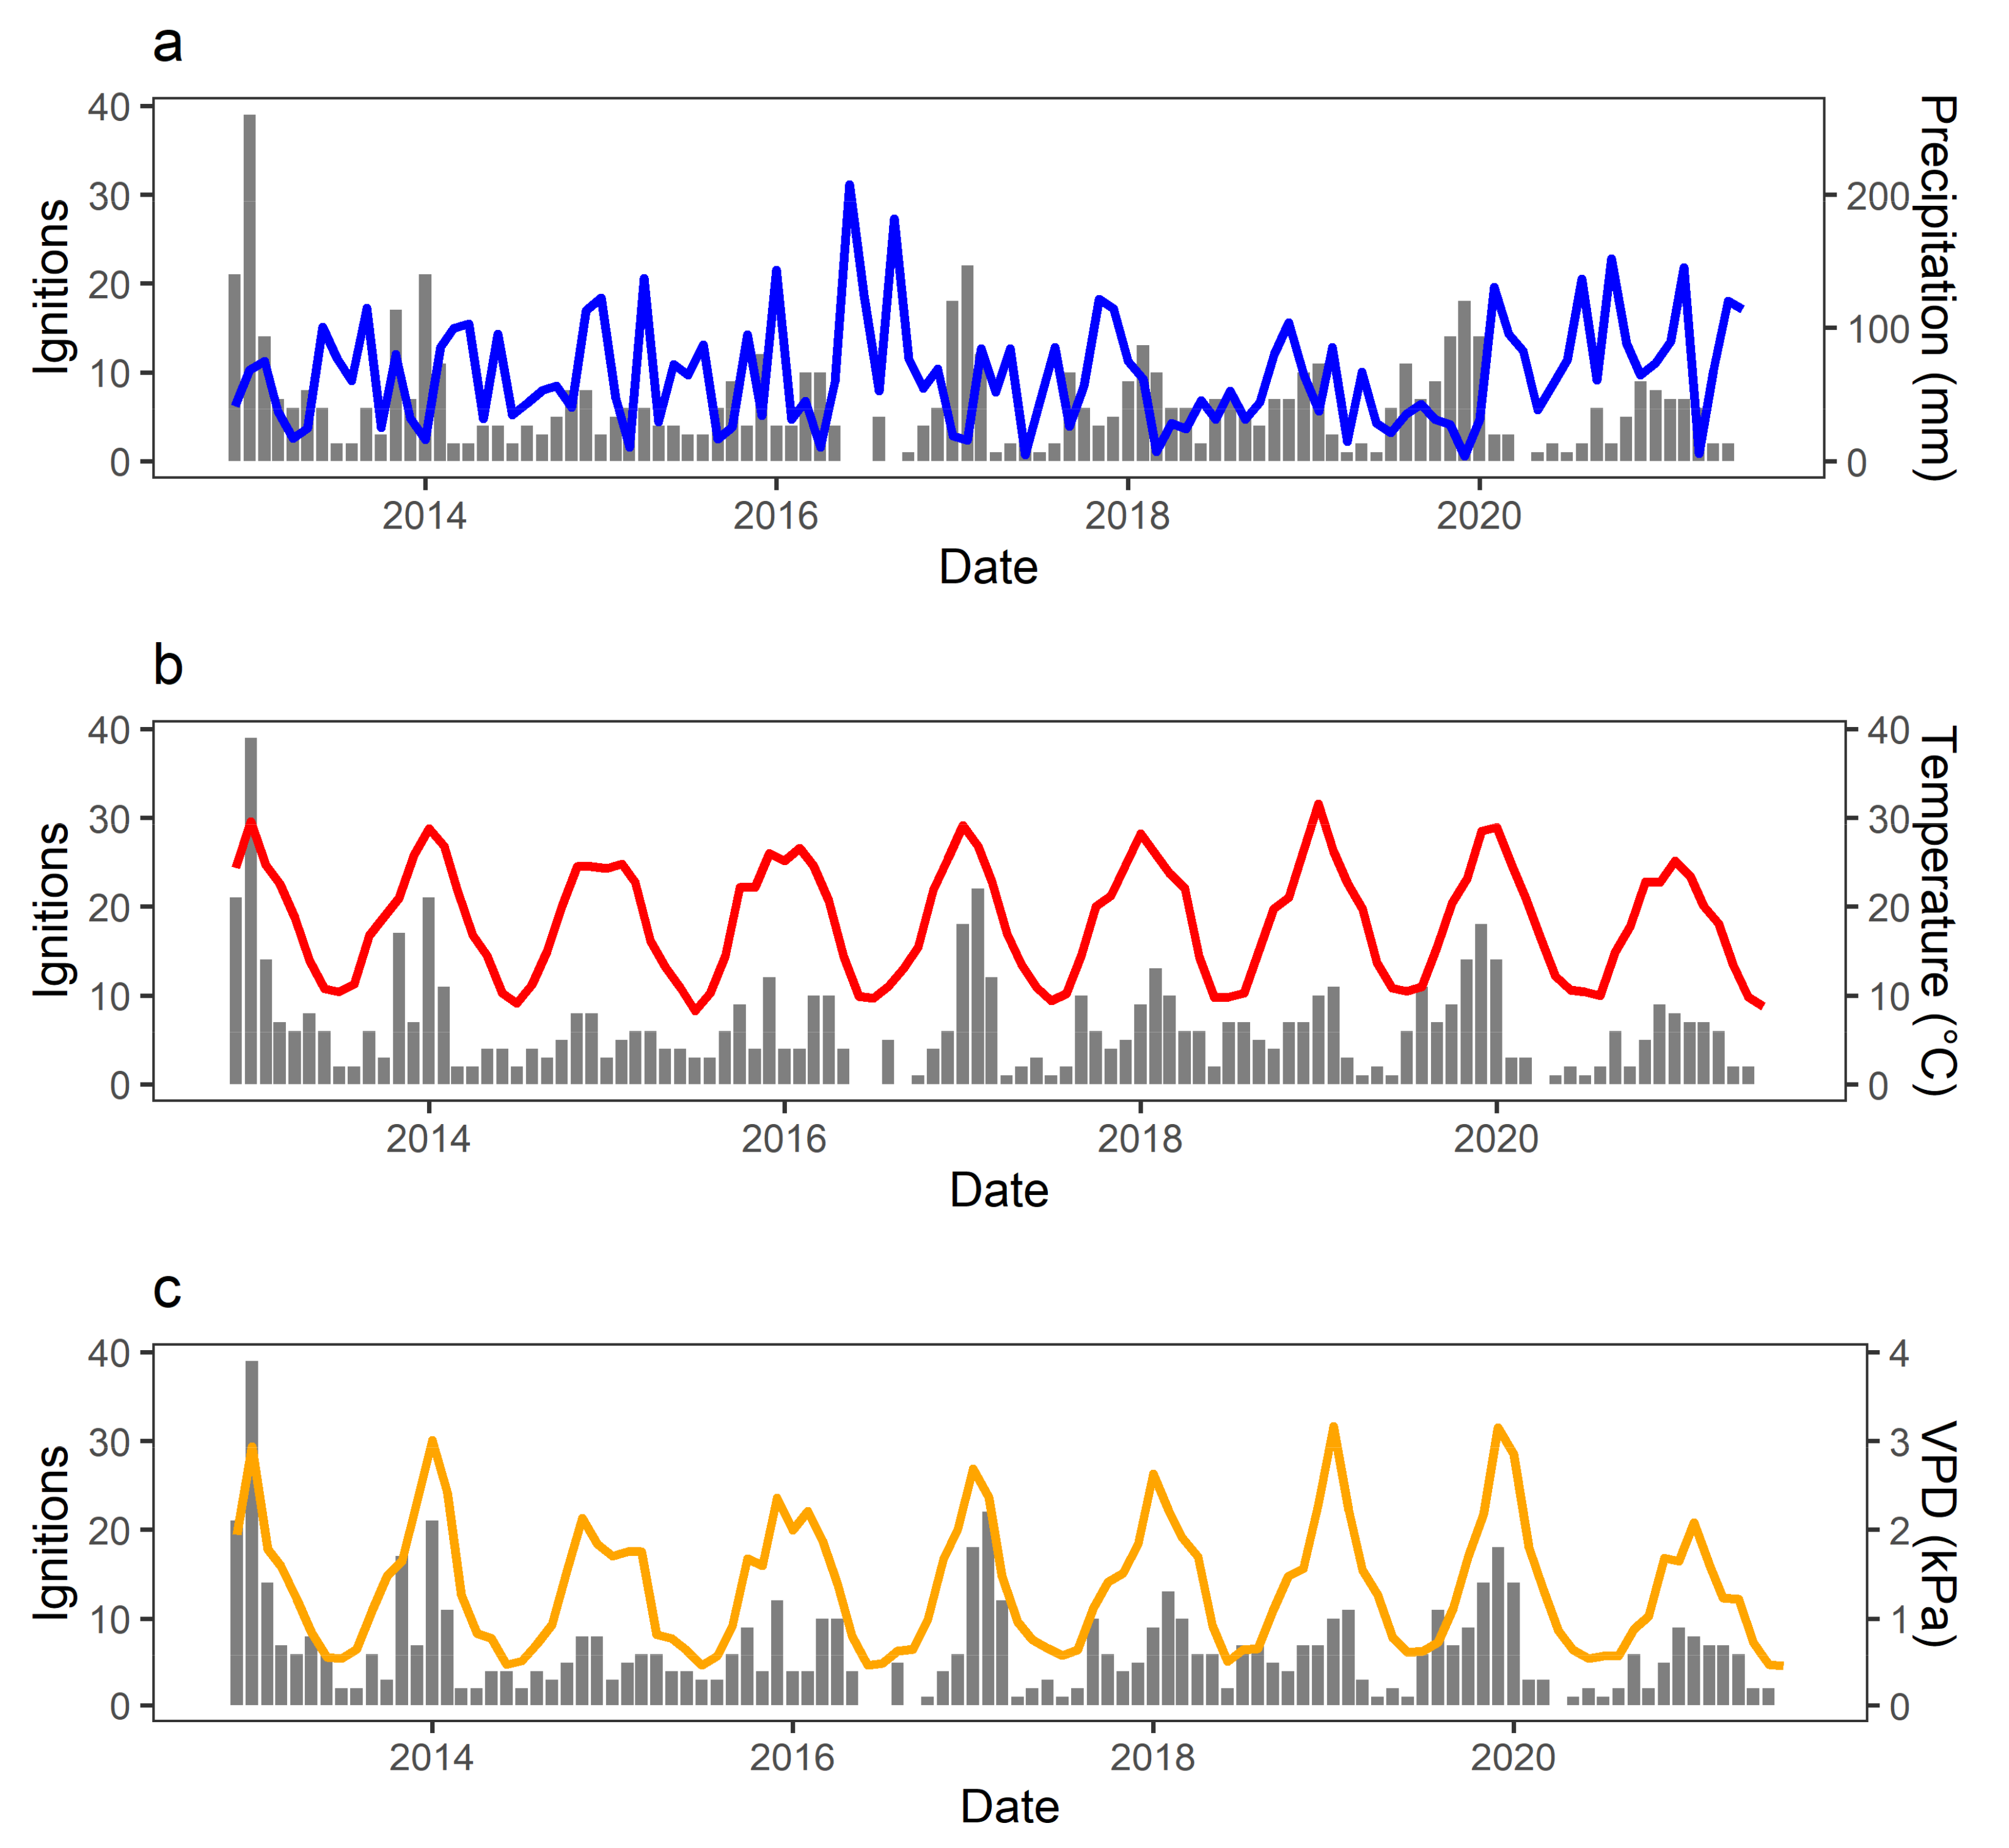
Figure 3.
Predicted number of monthly ignitions in response to the month of the year for the models using precipitation (top), temperature (middle), and vapour pressure deficit (VPD, bottom) as climate predictors. Predictions were made using the models with a one-month climate average. Predictions are fitted by three levels of one-month climate anomaly; the long-term average (0% anomaly), and the 5th and 95th percentile (approximately) of the long-term (1961–1990) period. Marginal effects for all models are available in the supplementary material.
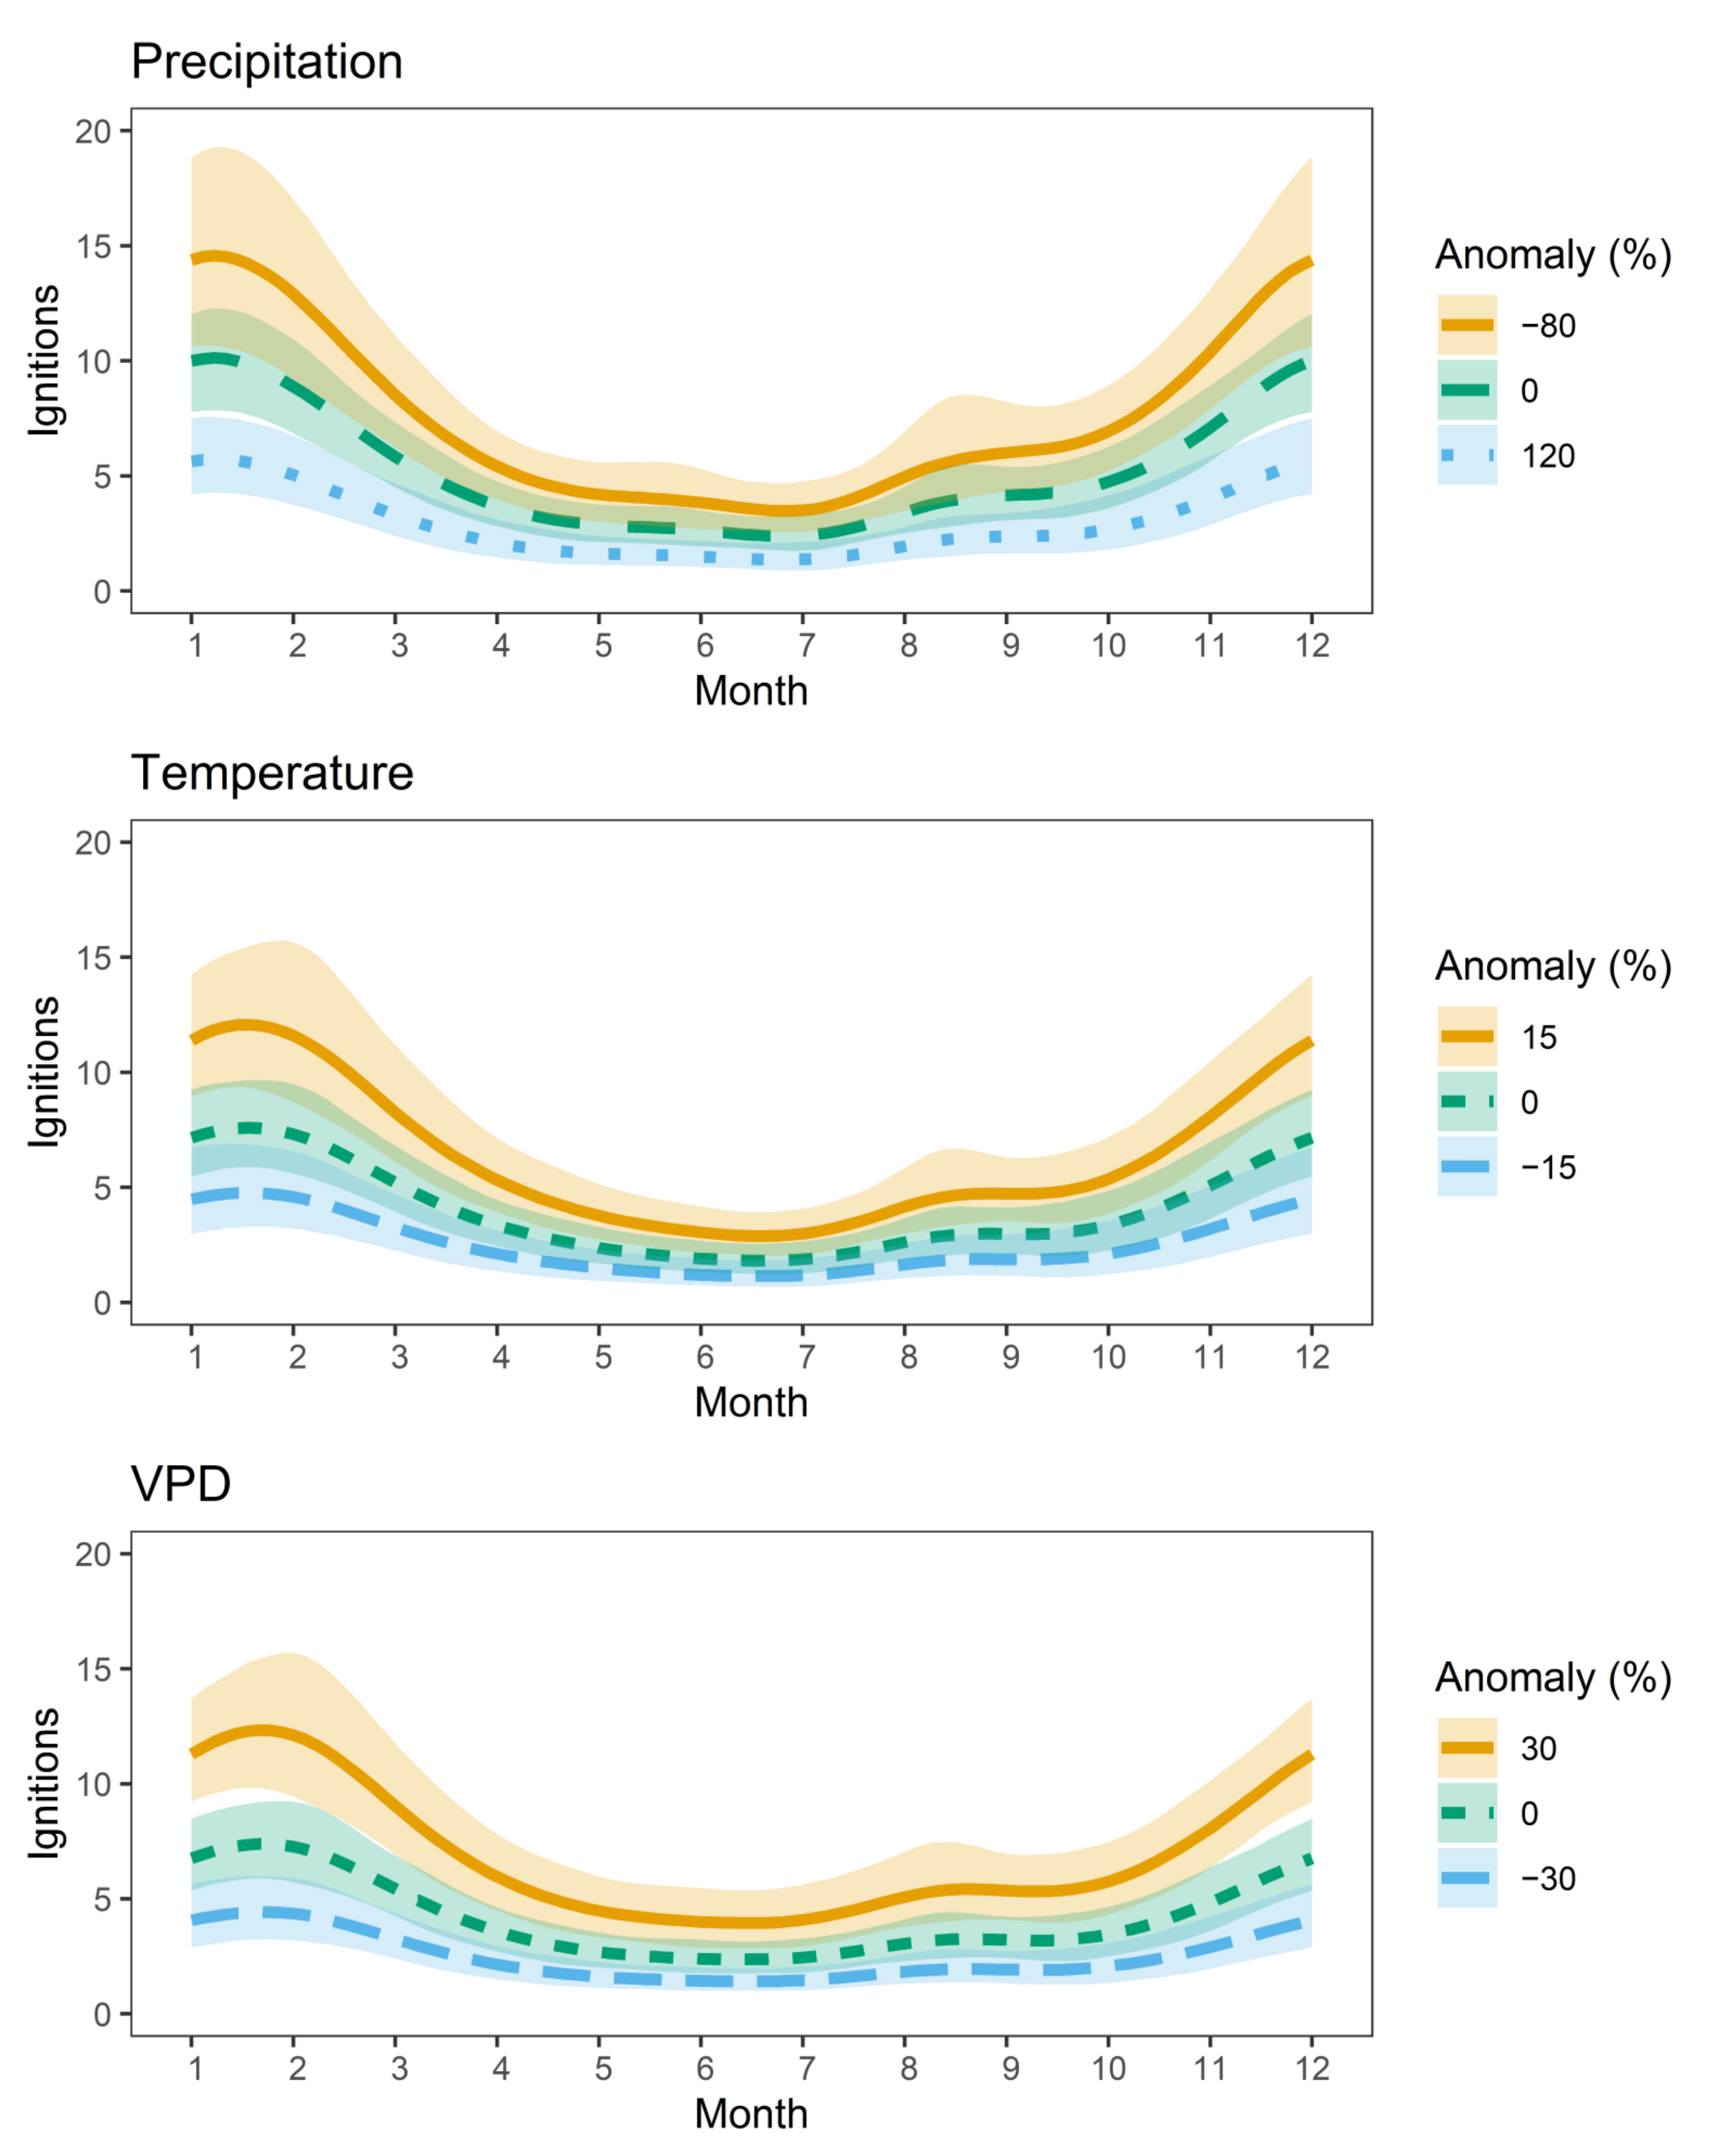
Figure 4.
Posterior distribution for one-month precipitation, temperature, and vapour pressure deficit (VPD) anomaly models under climate scenarios representing the long-term mean monthly climate anomaly (1961–1990, blue) and the mean monthly study period climate anomaly (2012–2021, red).
Figure 4.
Posterior distribution for one-month precipitation, temperature, and vapour pressure deficit (VPD) anomaly models under climate scenarios representing the long-term mean monthly climate anomaly (1961–1990, blue) and the mean monthly study period climate anomaly (2012–2021, red).
Disclaimer/Publisher’s Note: The statements, opinions and data contained in all publications are solely those of the individual author(s) and contributor(s) and not of MDPI and/or the editor(s). MDPI and/or the editor(s) disclaim responsibility for any injury to people or property resulting from any ideas, methods, instructions or products referred to in the content. |
© 2023 by the authors. Licensee MDPI, Basel, Switzerland. This article is an open access article distributed under the terms and conditions of the Creative Commons Attribution (CC BY) license (https://creativecommons.org/licenses/by/4.0/).
Share and Cite
MDPI and ACS Style
Wilson, N.; Yebra, M. The Role of Climate in Ignition Frequency. Fire 2023, 6, 195. https://doi.org/10.3390/fire6050195
AMA Style
Wilson N, Yebra M. The Role of Climate in Ignition Frequency. Fire. 2023; 6(5):195. https://doi.org/10.3390/fire6050195
Chicago/Turabian StyleWilson, Nicholas, and Marta Yebra. 2023. "The Role of Climate in Ignition Frequency" Fire 6, no. 5: 195. https://doi.org/10.3390/fire6050195