1. Introduction
Researchers working on imaging or analytical spectroscopy require bright light sources across a broad range of wavelengths. Bench-top laboratory UV–Vis spectrometers are typically able to measure absorbance in the mid UV–IR range (λ = 200–1000 nm) and often use combined light sources, typically deuterium and tungsten halogen lamps. Source intensity is important in spectroscopy because the signal to noise ratio of photon counting detectors varies as the square root of the light intensity. Consequently, it can be difficult to accurately measure the absorbance of highly absorbent samples, because of the low light intensity arriving at the detector, or very low absorbance samples, because the difference in the absorbance compared to the baseline is small. Both of these situations result in absorbance readings that have low signal to noise ratios. As is well known, signal to noise ratios can be improved by increasing the number or timespan of measurements but, for some samples, especially those that exhibit changing spectral properties over time, complex and expensive sources such as synchrotrons may be the only viable source of the high intensity, short wavelength light required to achieve high signal to noise ratios. There is therefore a demand for small, bright light sources that are both economical and capable of producing broadband light. Although suffering from low efficiency, rare gas continua offer a line free, very broadband UV visible light source that can be utilised for broadband absorbance spectroscopy [
1,
2].
Hot plasmas emit both line emission and intense broadband light in the form of bremsstrahlung radiation. This continuum emission approximates that of blackbody radiation, in which the total power emitted is proportional to
T4 (where
T is temperature), according to the Stefan-Boltzmann law. Laser-induced plasmas (LIPs) have been widely exploited in laser-induced breakdown spectroscopy (LIBS) to determine elemental composition from the line emission of the plasma. Coherent light from pulsed lasers, focused onto gaseous, liquid, or solid targets, can induce plasmas that are capable of emitting radiation from the soft X-ray [
3] to the mid-infrared region [
4]. Very hot plasmas, emitting in the EUV, can be generated by employing high powered, high repetition rate (>MHz) pulsed lasers focused onto a high pressure, pulsed jet of xenon gas that is sometimes mixed with particulate matter (e.g., Sn) to promote laser absorbance [
5,
6]. Another promising candidate for the generation of EUV radiation is pulsed capillary discharge sources [
7,
8]. Capillary discharge devices offer some advantages over LIP sources in terms of simplicity, compactness, and cost-efficiency, but disadvantages are the larger size of the source, debris production, and bore erosion of the capillary [
9]. Both of these EUV generation techniques employ Xe as the preferred medium because of its comparatively low first ionisation energy and the absence of molecular bonding. It is the 10+ ionisation state of Xe that is responsible for the 13.5 nm X-ray emission of hot LIPs [
10] that is needed for the lithography of next generation CPUs; however, for the generation of lower energy UV–Vis and IR radiation in a typical laboratory setting, other noble gases may be more suitable because of the expense of bottled Xe gas. Here, the possibility of utilising a laser-induced plasma (LIP) for the construction of an economical, bench-top spectroscopic light source for biological spectroscopy is investigated.
Laser-induced plasmas, as high intensity, short wavelength sources, offer a relatively inexpensive alternative spectroscopic light source that can be utilised in bench top devices to replace both traditional bulbs, as well as more powerful light sources in some technological applications. There are, however, few studies of LIPs generated in a noble gas by a pulsed laser, as a spectroscopic light source in the UV–Vis and IR regions. Most work on LIPs has been concerned with X-ray production, breakdown intensities, plasma dynamics, and the electrical and thermal properties of LIPs for optimization in LIBS. Published work that does investigate noble gas LIPs as a spectroscopic light source includes that of Adamson and Cimolino [
4], in which the authors exploited the infra-red emission from an LIP formed in air or Ar to study the carbonyl stretching absorption of the transition metal complex W(CO)
6. It was found that emission in the IR region, wavenumber = 2100–1700 cm
−1, was continuous and at least 25 times more intense than a conventional IR glowbar. One consideration, however, is that these plasma intensities were only generated during the approximate lifetime of the laser pulse. The lifetime of IR emission from the plasma was measured as 2.2 µs in air and 3.8 µs in argon.
The aim of this study was to develop a proof of concept low cost instrument that could be used to monitor broadband absorbance changes occurring when proteins aggregate in the presence of the polysaccharide heparin. The instrument was successfully developed and tested, and was able to record lysozyme aggregation absorbance spectra up to six times a second, for time periods tested up to one hour, over a wavelength range of 380–720 nm at a resolution of 0.2 nm.
2. Materials and Methods
Presented here is the construction and commissioning of a low-cost spectrometer that utilises noble gas LIPs as the light source. A Q-switched Nd:YAG laser (Weifang Mingliang Electronics Co. Ltd., Weifang, China) with a maximum output of 280 mJ per pulse, measured using a digital joulemeter (Molectron EM400, Coherent Inc., Santa Clara, CA, USA) equipped with a Molectron J25 laser power head, at a pulse rate of 2 Hz, at the primary harmonic at λ = 1064 nm or frequency doubled to λ = 532 nm with a Cr:YAG crystal, was used for plasma induction. The pulse width was measured using a silicon photodiode (Thorlabs DET10A, Ely, UK), rise time of 1 ns, and a digital oscilloscope (Tektronix TDS3032, Beaverton, OR, USA) with a 300 MHz bandwidth (yielding a rise time of ~1 ns). The measured pulse width at FWHM was 11.5 ns, providing a peak power of approximately 23 MW, assuming a Gaussian time profile.
Initially, focusing the laser through a 20 mm focal length, uncoated UV fused silica, plano-convex lens (Thorlabs LA4647, Ely, UK) did not reliably generate plasma sparks in air at atmospheric pressure owing to the high breakdown intensity threshold of air at this pressure (ca. 1012 W·cm
−1 [
11]). A sealed chamber was therefore incorporated (
Supplementary Materials, S1) so that various noble gases (He, Ne, Ar, and Kr) could be tested over a range of modest pressures (1–2.2 bar) for reliability, continuum emission intensity, and wavelength range. The effect of frequency doubling the laser to 532 nm was also tested under each condition. Inside the chamber laser pulses were focused to a calculated spot size of 8.7 µm (assuming a Gaussian beam profile), using a 20 mm focal length, uncoated UV fused silica, plano-convex lens (Thorlabs LA4647, Ely, UK), and inducing a plasma at the focal point of the lens in the gaseous medium (
Supplementary Materials, S1). The chamber was successfully tested at absolute pressures of up to 2.4 bar.
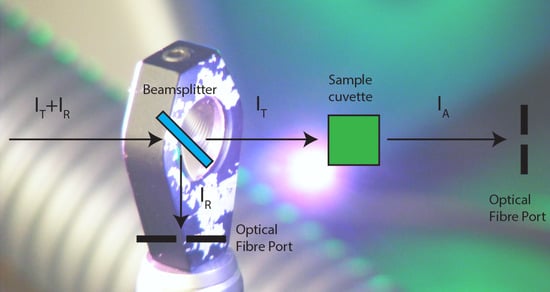
The optical arrangement for the capture, collimation, and detection of the emitted light is shown in
Figure 1. Broadband light emitted from the plasma was captured using a UV enhanced, 1 inch (25.4 mm) diameter, parabolic, concave mirror (Thorlabs CM254–019–F01, Ely, UK) of focal length 19 mm, mounted inside the chamber in a kinematic mount (Thorlabs KM05/M, Ely, UK) for fine adjustment. Light reflected from this mirror was collimated using a pinhole collimator containing two UV fused silica plano-convex lenses (Thorlabs LA4052 and LA4647, Ely, UK) with focal lengths of 35.1 mm and 20.1 mm, respectively. The collimator contracted the reflected light down to a diameter of approximately 2 mm. The contracted beam was then split using a broadband, non-polarising beam splitter (Thorlabs BSW26 50/50 beam splitter, λ = 350–1100 nm, Ely, UK). One arm of the split beam passed through a 50 µL quartz crystal cuvette, with a path length of 10 mm, containing the sample. Both arms of the beams were then focused onto optical fibre ports, using identical 20 mm focal length plano-convex lenses (Thorlabs LA4647, Ely, UK), into 1 m fluoride clad silica core 200 µm 0.22 NA optical fibre patch cables (Thorlabs BFH22–200–030–SMA–1M, Ely, UK) that were connected via standard SMA connectors to miniature λ = 200–1000 nm Czerny-Turner spectrometers (Thorlabs CCS200/M, Ely, UK). The positions of the two collimating lenses, used to focus the beams into the optical fiber, were adjusted so that the intensity of the emission was within the dynamic range of the spectrometers. A photograph of the instrument, with the its major components labelled, is show in
Supplementary Materials S1,
Figure S1.
The intensity of light emitted, captured, and collimated by the optics varied between pulses and over the lifetime of each pulse. The CCS200 spectrometers integrated the intensity of light received during a time period set by the experimenter and output the intensity as a value between zero and one for each wavelength interval. The intensity units of this output are arbitrary; therefore, intensities can only be compared relatively and exact photon fluxes from the plasma emission cannot be determined from this output. The spectrometers were run in amplitude correction mode which takes into account the wavelength dependent responsivity of the spectrometer by calibration against a factory calibrated internal reference table. Amplitude calibration is only carried out by the software for wavelengths greater than 380 nm. The dark noise of the CCS200 spectrometers were determined by setting the spectrometers to record continuously over 500 consecutive 50 ms intervals and were found to be, at most, 0.8% of the maximum readable intensity.
Both CCS200 spectrometers were set to record the integrated intensity of light received during a 50 ms integration time. This time interval exceeded the lifetime of the plasma (~1 ms [
12]) so that light emitted during its lifetime was captured in a single 50 ms interval. To synchronise the 50 ms measurement intervals of each spectrometer with the plasma, the spectrometers were triggered to start recording each 50 ms interval by a 5 V, 10 ms signal generated by a microcontroller (Arduino Uno, RS Components Ltd., Corby, UK) connected via its analogue input pins to a photodiode (TAOS TSL257 high sensitivity light to voltage converter, RS Components Ltd., Corby, UK). Depending on the light intensity, the photodiode outputted an analogue (0–5 V) signal that was read continuously by the microcontroller once every millisecond. The analogue signal was converted to a digital one (see
Supplementary Materials, S2). This arrangement synchronised the plasma emission with the integration interval of the spectrometers with the caveat that light from the first pulse was not recorded.
A variety of noble gases over a range of pressures were tested for plasma generation reliability and spectral intensity (closely related to plasma temperature). During these tests, the beam splitter and sample cuvette were removed so that the emission spectra of each of the noble gas plasmas could be measured directly using a single CCS200 spectrometer. Spectra for each gas and at each pressure were recorded and averaged over 300 laser pulses (5 min at 1 pulse per second), both with and without frequency doubling. The noble gases tested were He (101720–L, N4.6 Helium 99.996%, BOC Ltd., Guilford, UK), Ne (112008-BC, N5.0 Neon 99.999%, BOC Ltd., Guilford, UK), Ar (112034–BOC Grade A Argon 99.9% N5.0, BOC Ltd., Guilford, UK), and Kr (112005–BOC Krypton 99.999% N5.0, BOC Ltd., Guilford, UK) in increments of 0.2 bar over a range of 1–2.2 bar.
Cλ is the ratio of the intensity of light transmitted to light reflected by the beam splitter:
Cλ =
IT/
IR. The standard deviation in an absorbance measurement was calculated from the standard deviation of
Cλ, σ
Cλ:
To evaluate the ability of the instrument to record accurate absorbance spectra, a sample of 4% holmium (III) oxide in 10% aqueous perchloric acid was tested. This solution is the National Institute of Standards and Technology (NIST) recognised standard solution for spectrometer calibration as its absorbance spectrum has fourteen traceable peaks in the wavelength range 240 to 650 nm. The instrument was calibrated using this standard and peak centres observed were compared with their corresponding reference wavelengths (bands 9–14), as stated by NIST [
13,
14].
The instrument was able to determine the absorbance of a sample from a single laser pulse across the wavelength range 380–700 nm at a resolution of 0.2 nm and monitor time varying absorbance/scattering by plotting consecutive absorbance spectra at a sampling rate of 1–6 Hz (the adjustable pulse rate of the laser). The fastest temporal interval of the instrument was therefore 160 ms. This made the instrument particularly suitable for biological spectroscopy, for which absorbance changes can be used to monitor a host of solution-based phenomena, including the dynamics of interactions between chromogenic biomolecules with ligands, cations, and substrates.
To test the ability of the instrument to determine consecutive absorbance spectra for time-varying samples, the aggregation of lysozyme in the presence of heparin was investigated. Lysozyme has been proposed as a model protein for the investigation of amyloidogenesis observed in Alzheimer’s and Parkinson’s disease [
15]. Heparin almost instantly induces the aggregation of lysozyme [
16], but this process can be slowed by reducing the ratio of lysozyme concentration to that of heparin, enabling aggregation to be measured over a longer time period (see
Supplementary Materials, S4). Initial testing revealed that 0.2 mg lysozyme to 20 µg heparin gave aggregation rates and final turbidities within the measurable range (see
Supplementary Materials S4,
Figure S2). Raleigh scattering gives way to Mie scattering as the size of the aggregates increase, from being much smaller than the wavelength of light, to approaching the same size, and is manifest at visible wavelengths by increasingly turbid solutions. Turbidity was measured as an absorbance value across the working wavelength range of the instrument. The instrument was therefore utilised effectively as a broadband turbidometer for these experiments.
3. Results
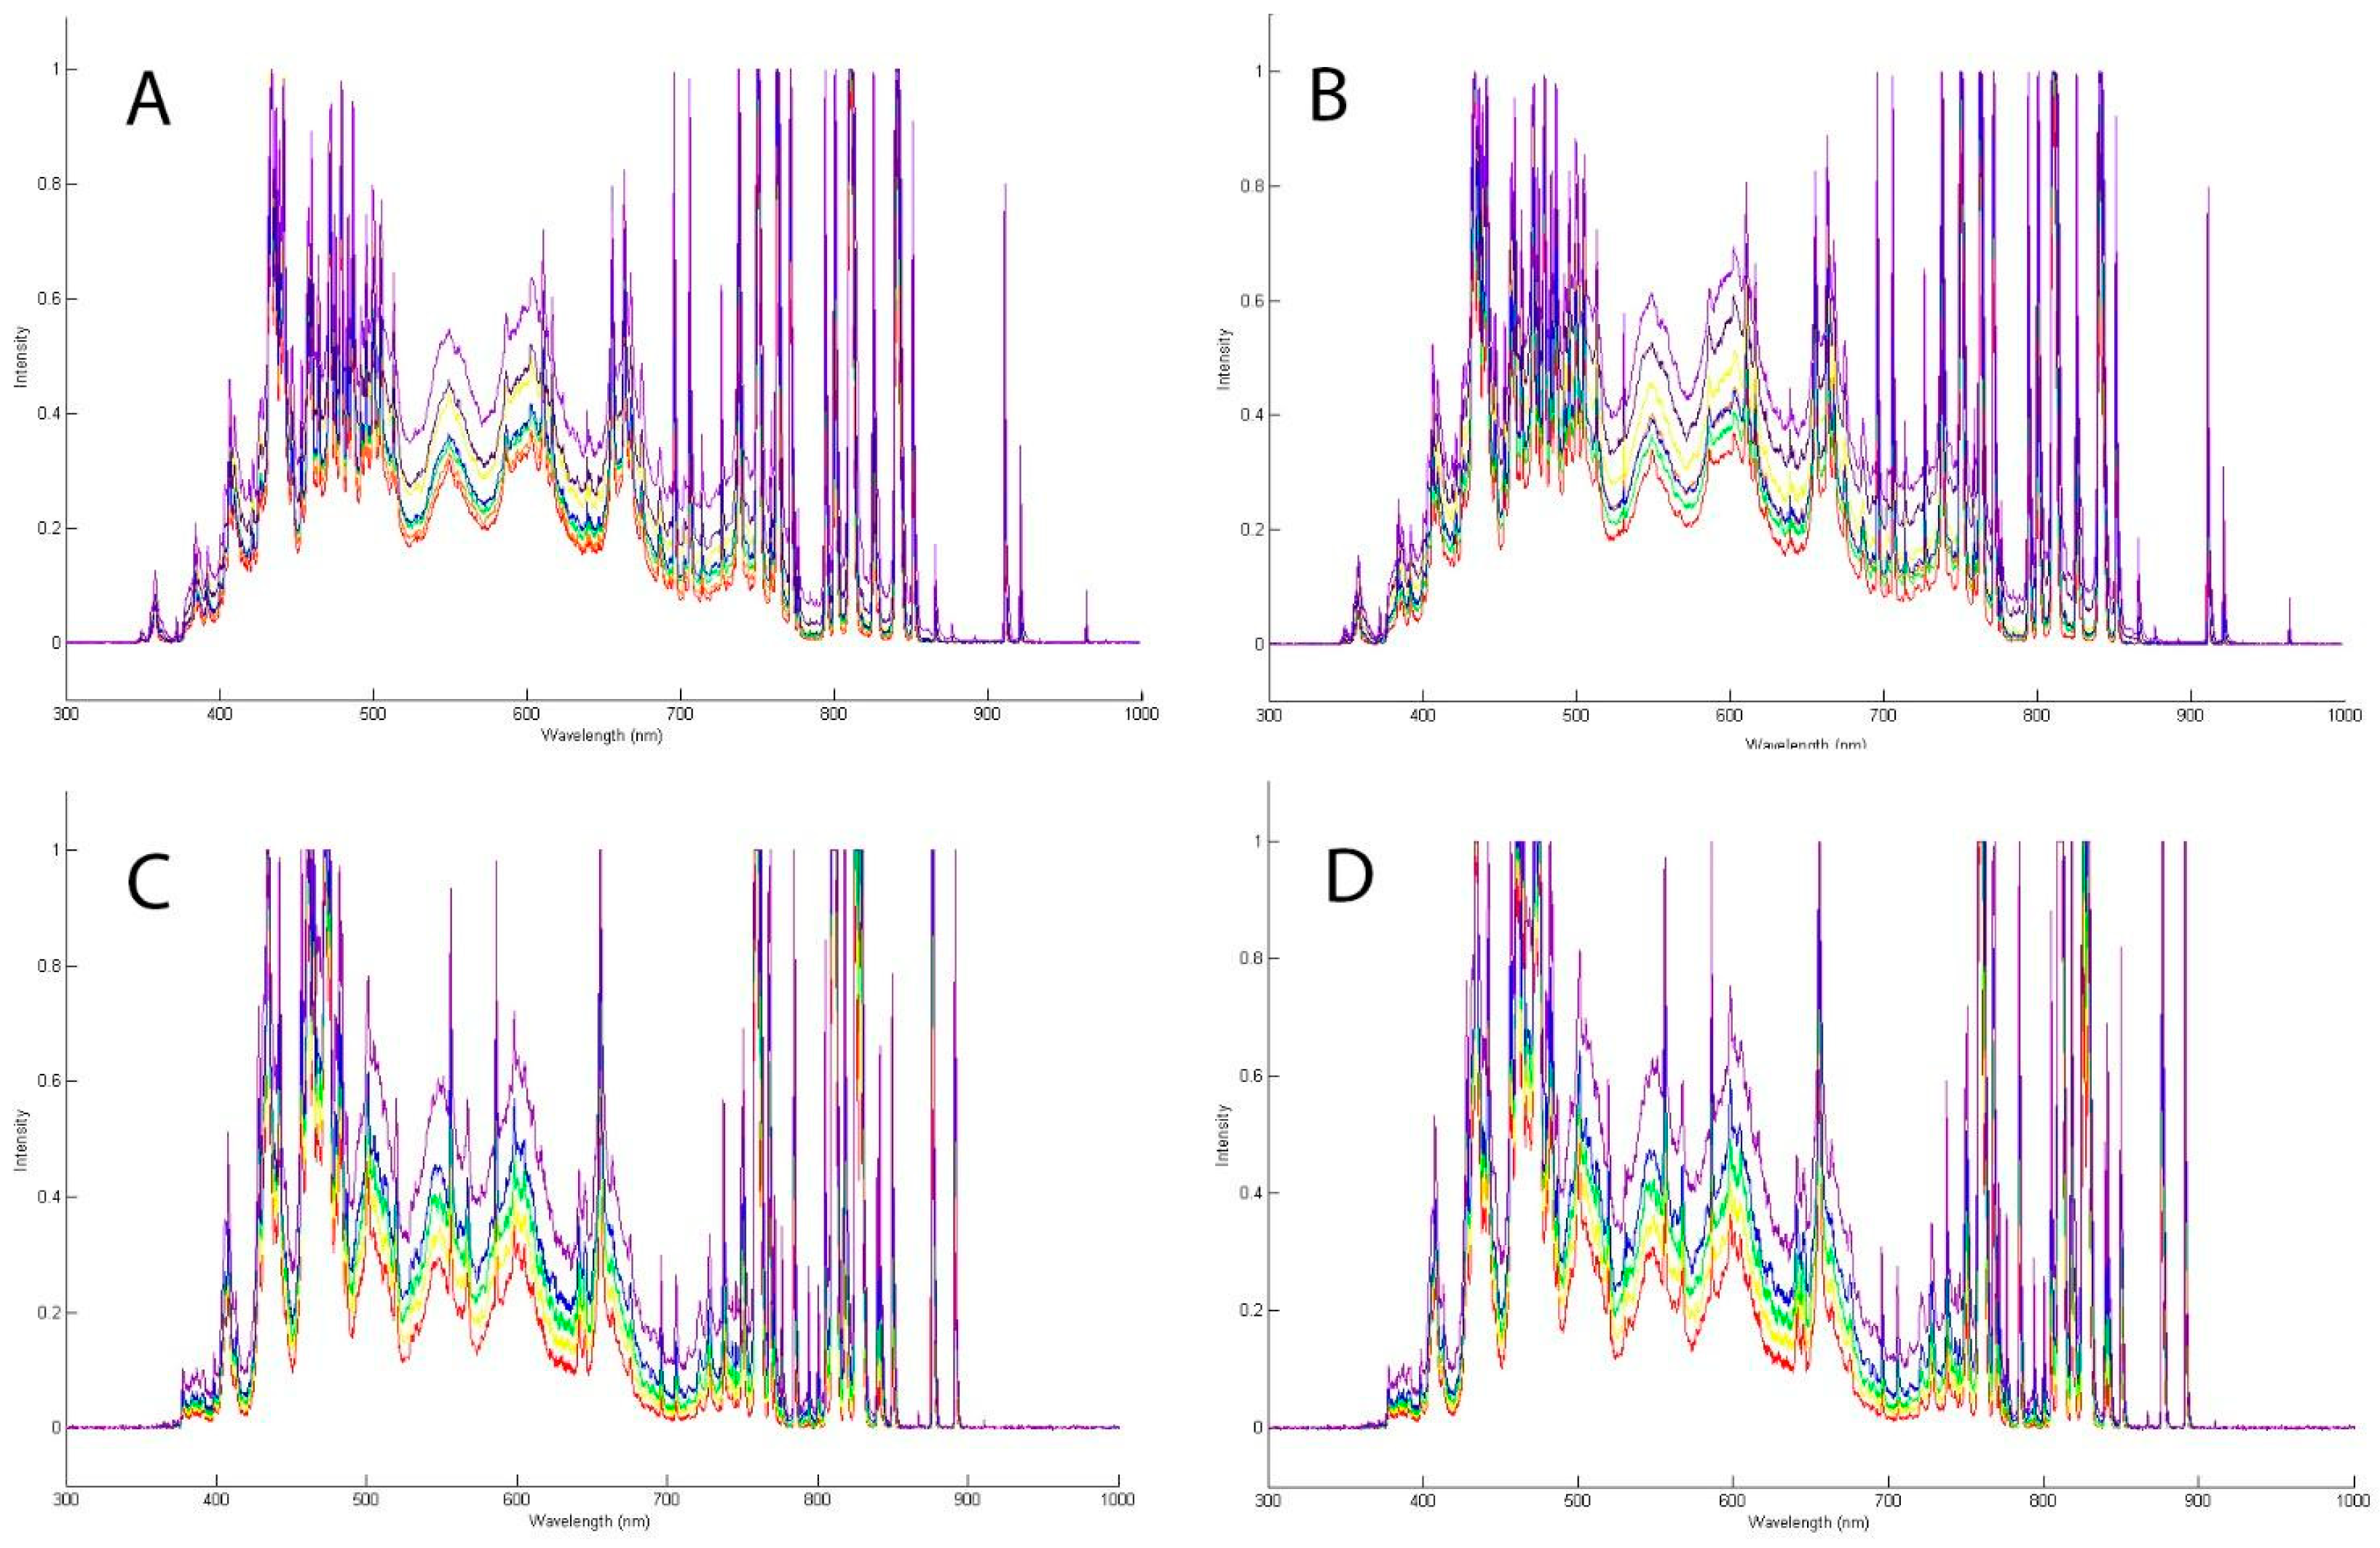
The averaged spectra for each of the four noble gases at different pressures are shown in
Supplementary Materials S5 (
Figure S3A–D) for He and Ne, which both showed poor continuous emission, and in
Figure 3A–D for Ar and Kr, which exhibited emission across the wavelength range suitable for use as a broadband light source. For He and Ne, the significant line emission from bound to bound electron state transitions within the plasma was due to the large first ionisation energy of helium compared to the other gases (He: 24.58 eV, Ne: 21.56 eV, Ar: 15.76 eV, Ke: 13.99 eV). When the first ionisation energy is large, the breakdown threshold intensity of the gas is higher than the intensity generated at the focal point of the focusing lens, resulting in erratic plasma formation due to insufficient generation of the seed electrons required for cascade ionisation.
Intense line emission can be outside the dynamic range of the spectrometer, preventing the correct determination of absorbance measurements. It is therefore advantageous to employ a gas that exhibits the least extensive line emission throughout the desired wavelength range of the instrument. The gas that shows the least line emission between λ = 520 and 650 nm is Ar, although line emission is seen strongly outside of this range. Adjustment of the position of the collimating lenses can reduce the intensity of the line emission so that it lies within the dynamic range of the spectrometer, but this reduces the intensity at all wavelengths. The ratio of continuum emission to line emission is approximately proportional to temperature [
17,
18,
19], therefore, by increasing the plasma temperature and adjusting the position of the collimation lenses, it is possible to reduce the extent of line emission without also reducing the amount of continuum emission. A bandpass filter can also be used to eliminate light outside of the useful wavelength range (such as the strong line emission observed in the emission spectra above 720 nm), but this was unnecessary as the CCS200 spectrometer software can be set to record within a specific wavelength range if required. The emission spectra of each of the gases also show very little UV emission below λ = 380 nm, indicating that the electron temperature within the plasma is not high enough to generate significant amounts of UV light via bremsstrahlung emission. To increase the electron temperature within the plasma would require a more powerful (and expensive) laser, ideally also with a high pulse power and repetition rate. A high repetition rate laser can further excite the plasma before it has had time to dissipate, heating the electrons to higher energies with the result that they radiate shorter wavelength light. The lifetime of a laser-induced plasma in Ar is approximately 1 ms [
12]. The laser would therefore need to have a pulse rate of at least kHz.
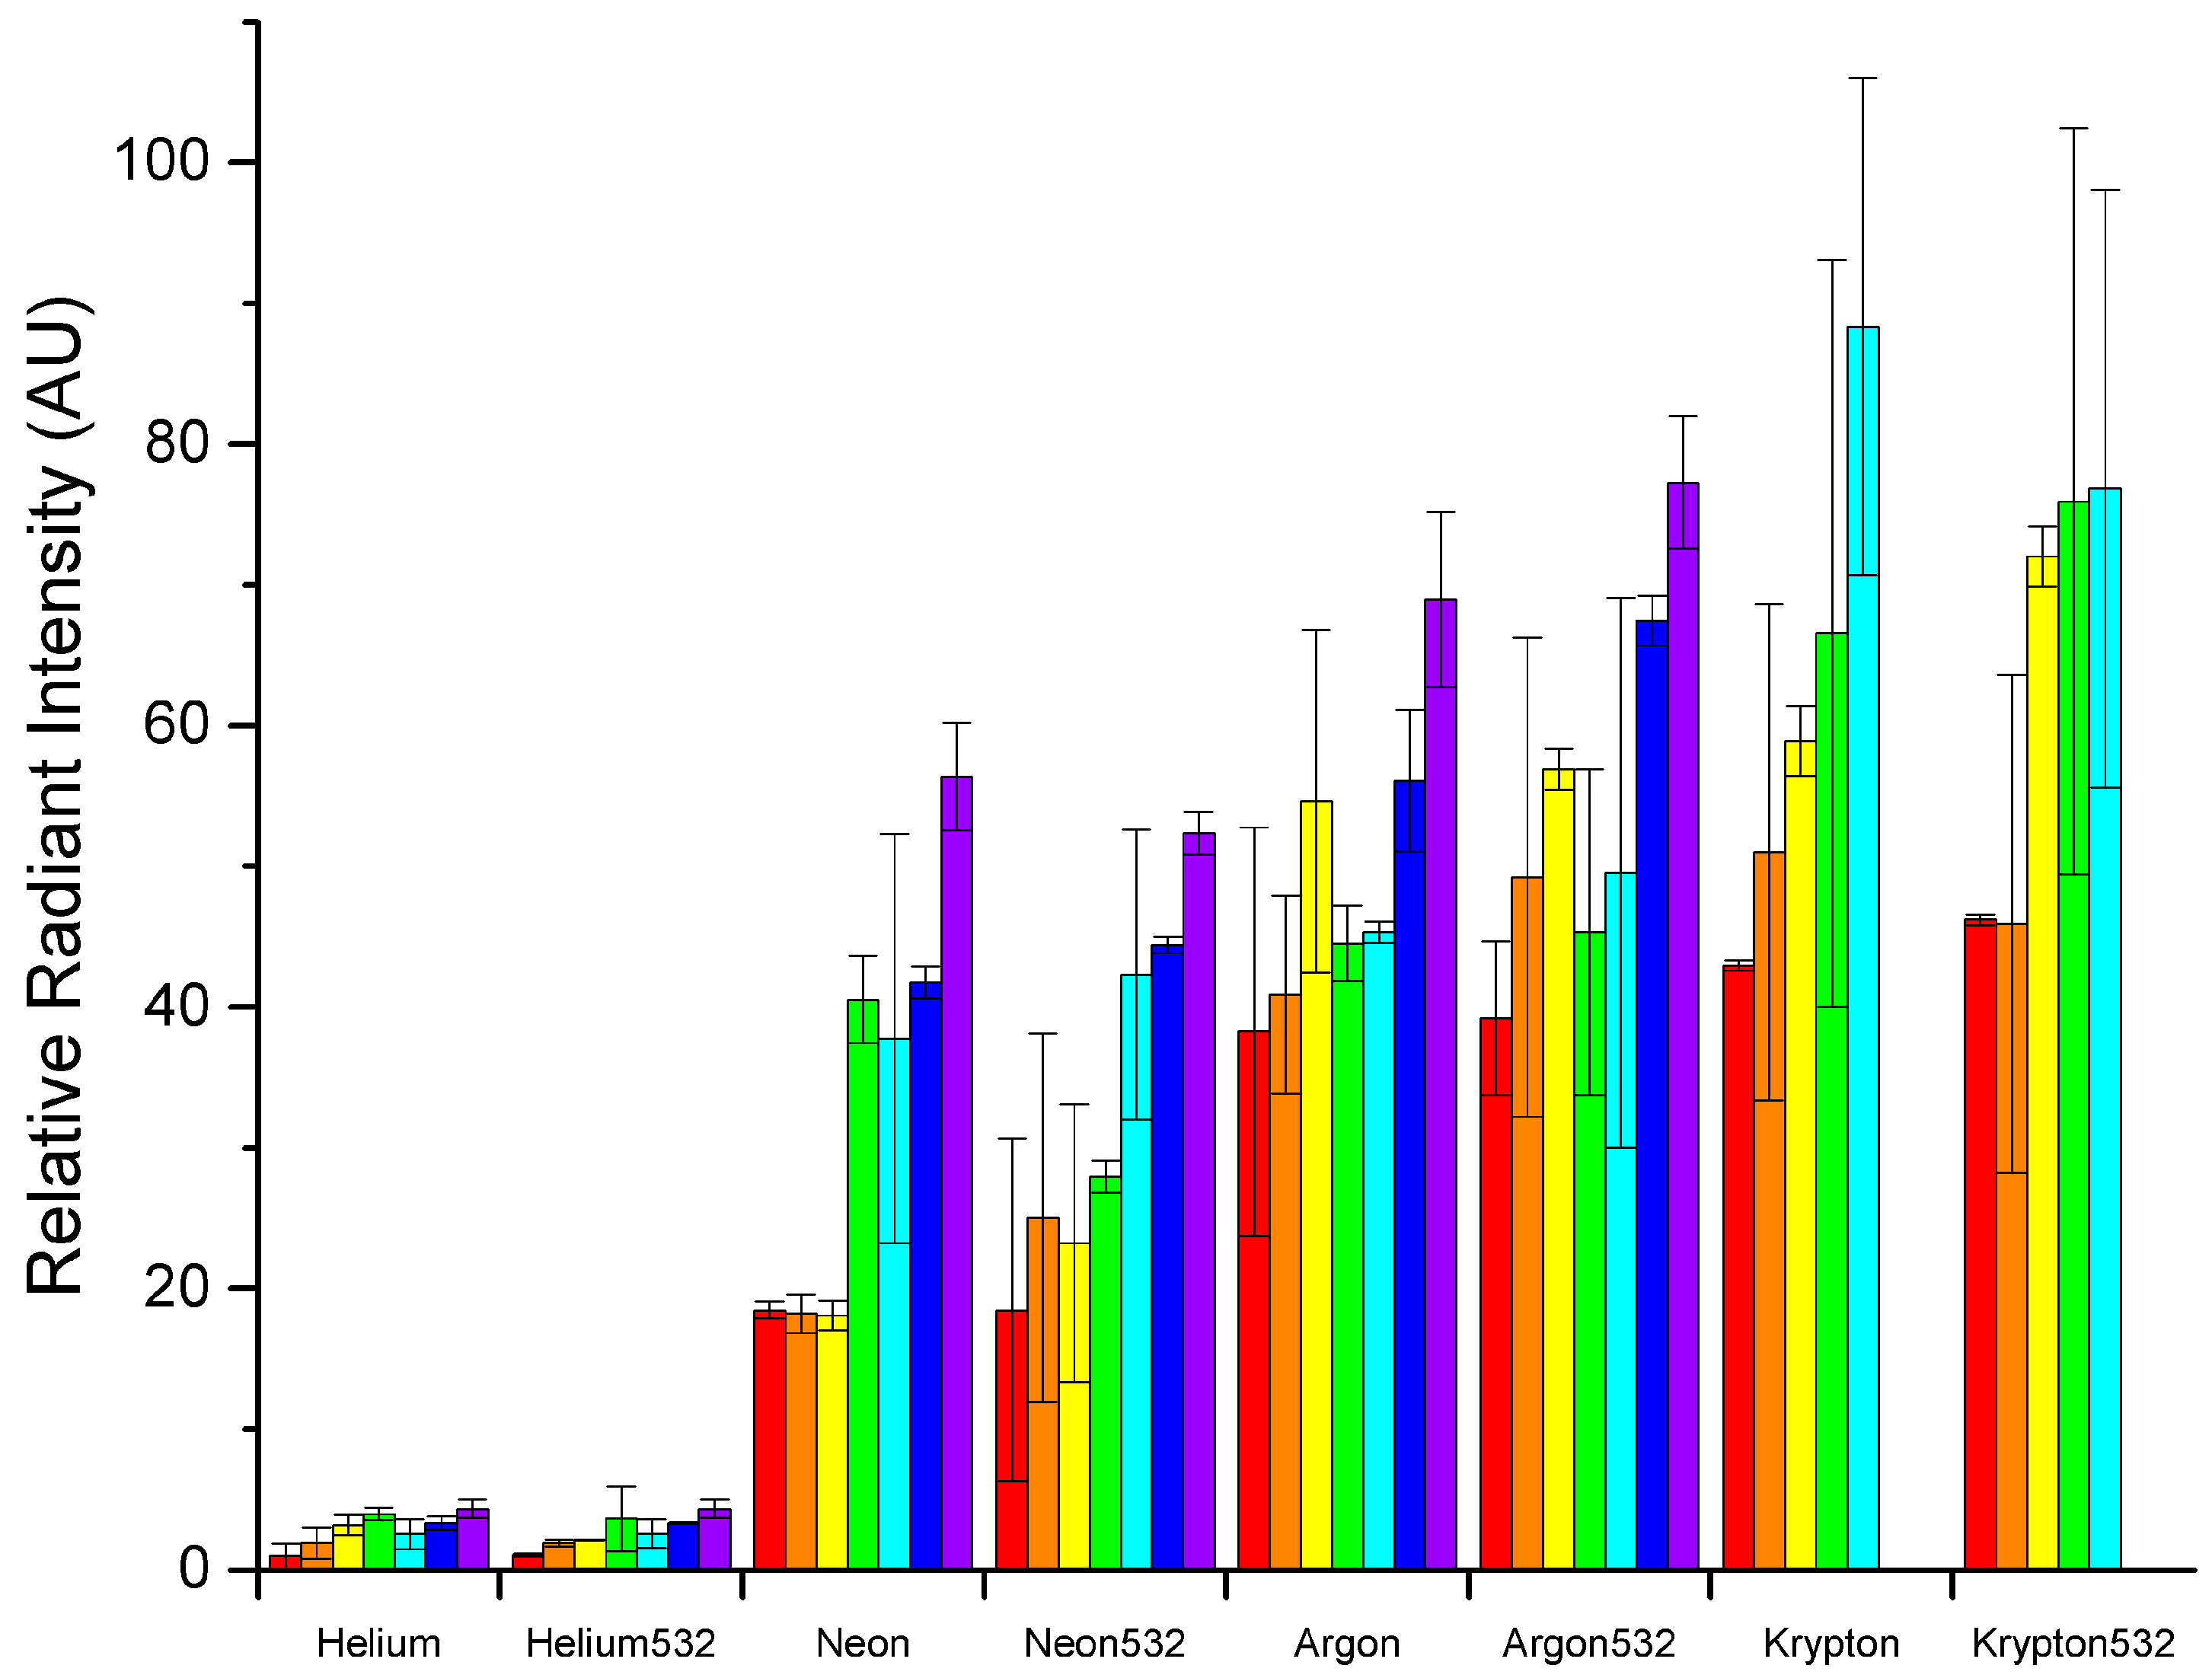
The distribution of relative radiant intensity from a single plasma (in arbitrary units AU), recorded by the spectrometer in each of these tests, is shown in
Figure 4. The relative radiant intensity from a single plasma is equal to the total area under the frequency spectrum obtained during one laser pulse. The wavelength axis of each spectrum was converted to frequency (by
f =
c/λ), the mean intensity at each frequency was multiplied by the associated frequency interval of the spectrometer (which increases slightly with wavelength or decreases with frequency), and then the results were calculated. The spectral sensitivity at each frequency was accounted for by running the spectrometer in amplitude correction mode. As expected, the relative radiant intensity is inversely correlated to the first ionisation energy of the gas and positively correlated to the gas pressure. Linear modelling with the response variable of total spectral power and predictor variables of first ionisation energy, pressure, and whether the laser was frequency doubled (0 or 1), showed that the first ionisation energy and pressure were highly significant (
p < 10
−16 and
p = 3.52 × 10
−8), but that the effect of frequency doubling was insignificant (
p = 0.519). Overall, the model was a very good fit with an adjusted
R2 value of 0.81 and an overall
p-value of <10
−16.
3.1. Reliability of Plasma Formation
For each noble gas, the reliability of plasma formation was determined by plotting the intensity of each plasma at λ = 550 nm for each of the 300 laser pulses. λ = 550 nm was chosen because only continuum emission was observed at this wavelength for each gas. If the intensity at this wavelength was below the dark noise value of the CCS200/M spectrometer (<0.01), the laser pulse was considered to have failed to generate plasma. The laser was only able to induce plasma in He and Ne for a fraction of the laser pulses. Argon and Kr successfully generated plasmas for 100% of the laser pulses, throughout the pressure range 1 to 2.2 bar, showing that only LIPS generated in Ar and Kr are reliable spectroscopy sources under these conditions. The results of this analysis for He and Ne are shown in
Supplementary Materials S6,
Table S1.
3.2. Establishing the Wavelength Range of the Spectrometer
Following gas testing, the beam splitter was replaced (gas spectra were determined without the beam splitter) and its transmission and
Cλ values (
Cλ =
IT/
IR) were determined by recording the transmitted (
IT) and reflected (
IR) intensities for 600 laser pulses at a rate of 2 Hz. The gas used in these tests was Ar at a pressure of 2.2 bar. The results are displayed in
Figure 5A,B. Wavelengths that gave intensities below the dark noise value of the spectrometer (<0.01) or equal to the maximum intensity of 1 were disregarded before calculating values for the transmission/
Cλ.
The results show that the working range of the beam splitter in this instrument is approximately λ = 350 to 720 nm. Below λ = 350 nm, few data points exist because the intensity of light generated by the Ar plasma is insufficient. Above λ = 720 nm, line emission dominates the spectra, resulting in too few data points with which to determine continuous values for the transmission and Cλ.
3.3. Assessing Wavelength Accuracy against a Reference Standard
To evaluate the accuracy of the absorbance values calculated using
Cλ, the absorbance spectrum of a solution of 4% (
w/
v) holmium (III) oxide (10910.03, Alfa Aesar, Heysham, UK) in 10% (
w/
v) aqueous perchloric acid (77233, Sigma-Aldrich, Gillingham, UK) was determined over 600 pulses at a pulse rate of 2 Hz. The path length of the beam through the sample was 10 mm. The plasma chamber was filled with Ar at 2.2 bar for this test and the absorbance was determined over the range λ = 380 to 700 nm. In this range, the transmission of the beam splitter is known and the emission from the Ar plasma is sufficient for absorbance readings to be conducted. For comparison, absorbance spectra of this solution were also determined in a commercial UV–Vis scanning spectrophotometer (ThermoFisher Scientific GENESYS 10S, Loughborough, UK) in the range λ = 380 to 700 nm in wavelength increments of 0.5 nm. The baseline absorbance of a cuvette containing HPLC grade water (W/0106/15, ThermoFisher Scientific, Loughborough, UK) was also measured using both instruments (600 laser pulses at 2 Hz for the plasma spectrometer) and was subtracted from the results of the holmium oxide results in both cases. The results obtained for both spectrometers are shown in
Figure 6.
Comparison against the NIST standard spectrum of holmium (III) oxide (4%,
w/
v) in perchloric acid (10%,
w/
v) [
14] shows that, within the operating range of the spectrometer, the main calibration bands (Bands 9–14) are present in both spectra, confirming the ability of the instrument to measure absorbance to a high degree of wavelength accuracy.
3.4. Assessing Consecutive Absorbance Spectra Wavelength Accuracy
The ability of the spectrometer to record consecutive absorbance spectra of time varying samples was tested by recording the turbidity spectra generated by the aggregation of lysozyme (L1667, Sigma-Aldrich, Gillingham, UK) in the presence of sodium heparin (A3004, Applichem GmbH, Darmstadt, Germany) at pH 9.3. The theoretical isoelectric point of human lysozyme is ca. 9.3 and, at this pH, the aggregation rate should be maximal [
20,
21]. The buffer used was a universal buffer (acetic acid (222142500, ThermoFisher Scientific, Loughborough, UK), boric acid (202878, Sigma-Aldrich, Gillingham, UK), and phosphoric acid (W290017, Sigma-Aldrich, Gillingham, UK) (each at 40 mM) that was adjusted to pH 9.3 by titration with 1 M sodium hydroxide. The wavelength dependent absorbance of the buffer was determined by measurement in the plasma instrument, averaging the absorbance of over 300 laser pulses at 1 Hz. Samples of lysozyme (0.2 mg) were prepared by dissolution in HPLC grade water (W/0106/15, ThermoFisher Scientific, Loughborough, UK) followed by lyophilisation. Heparin was prepared by dissolution in the above buffer at a concentration of 1 mg/mL. A total of 2 µL of heparin solution was first added to the cuvette before the lysozyme to ensure adequate mixing. Lysozyme (0.2 mg) was solubilised in buffer (98 µL) and pipetted into the cuvette to provide a final heparin concentration of 20 µg/mL and a final lysozyme concentration of 2 mg/mL. Consecutive absorbance spectra were then recorded for 1000 pulses at a rate of 1 Hz. For comparison, the same test was also carried out using the lysozyme-buffer solution without the addition of heparin. The absorbance of the buffer was subtracted from the results of both tests. The results of these experiments are shown in
Figure 7.
The results in
Figure 7 demonstrate the ability of the plasma instrument to record sequences of absorbance and turbidity spectra.
Figure 7A shows very little turbidity, indicating that lysozyme does not aggregate to any noticeable extent in the absence of heparin. In contrast,
Figure 7B shows strong turbidity that increases over time. This turbidity is due to the Raleigh scattering of light from the aggregating particles of protein. As the particles increase in size, light is scattered at increasingly longer wavelengths. The intensity of scattered light is strongly wavelength dependent (λ
−4) and also dependent on the radius of the scattering particle (
r−2). The strong wavelength dependence of light scattering is responsible for the high turbidity observed, evident in the spectra below λ = 430 nm.
4. Conclusions
It has been demonstrated that an inexpensive, simple spectrometer utilising an LIP-based light source can be constructed from commercially available materials. Although high intensity short wavelength UV light was not readily emitted from the plasma, it is likely that this can be rectified in the future by employing a laser with a higher repetition rate. Higher repetition rate lasers, at least in the kHz region, would be required to further heat the plasma to the electron temperatures required for more intense short wavelength emission. It should be a relatively simple matter to adapt the instrument for a more powerful, higher repetition rate laser.
The spectra of the different noble gases tested revealed that only argon and krypton could generate plasmas reliably for each laser pulse. Although krypton was a slightly more emissive noble gas (see
Figure 4), the high cost of bottled krypton does not justify its use in this budget instrument. The range of wavelengths emitted from both argon and krypton plasmas was similar (≈370–800 nm) and the intensity of light emitted from an argon plasma was sufficient to conduct the lysozyme aggregation experiments; indeed, the intensity had to be attenuated by adjustment of the lenses that focused the emitted light onto the optical fibre ports. One important measurement that would be beneficial in characterising this instrument would be to determine the mean and variance of photon flux emitted by a series of noble gas plasmas in the working range of the instrument λ = 380–720 nm. This would necessitate the use of a spectral irradiance meter and subsequent conversion to photon flux. A bandpass filter would be useful when recording the irradiance to cut out any light outside of the working range. The Thorlabs FESH0700 or FESH0750 hard-coated short-pass filters, with cut-off wavelengths of 700 or 750 nm, respectively, could be used for this purpose.
Measurements of the transmission/reflection of the Thorlabs BSW26 beam splitter, using light emitted from argon plasmas, demonstrated that the working range of the beam splitter in this instrument was approximately λ = 380–720 nm. Below λ = 380 nm, the intensity of light is too low and above λ = 720 nm, intense line emission prevents accurate determination of the transmission/reflection. Hence, the range of the beam splitter determines the working range of this instrument as λ = 380–720 nm. If shorter wavelength light was emitted using a higher energy, higher repetition rate laser, it would be necessary to replace and retest the transmissivity of the beam splitter to re-determine the working range of this instrument.
Comparison against the NIST absorbance standard of 4%
w/
v holmium (III) oxide in 10%
v/
v perchloric acid, measured using a Thermo Scientific GENESYS 10S spectrophotometer (
Figure 6), demonstrated that the instrument could determine absorbance spectra to a high degree of wavelength accuracy. The instrument was, however, unable to measure very high absorbance values due to the transmitted light level being very low (below the noise value of the CCS200 spectrometers). This is not due to the instrument being unable to generate high enough intensity light, as the lenses that focus the beam onto the optical fiber ports can be adjusted to allow more light to enter the port. Rather, this is due to the low dynamic range of the CCS200 spectrometers. The intensity of light recorded by each of the CCS200 spectrometers must be low enough to not saturate the detectors at low sample absorbance, but high enough to be able to allow enough light to pass through at high absorbance. A compromise is achieved by adjustment of the focusing lenses onto the optical fibre ports that can be mitigated using spectrometers capable of a higher dynamic range.
The instrument could successfully record consecutive absorbance spectra of lysozyme aggregating in the presence of heparin. Plotting these consecutive spectra (
Figure 7) shows a banding pattern that occurs as the turbidity of the sample increases. This banding pattern is likely due to Raleigh/Mie scattering from the aggregating particles, but a quantitative analysis to determine particle sizes is difficult due to the use of broadband light and the distribution of particle sizes within the sample. However, it is easy to vary the experimental conditions and compare the aggregation rate of different samples. In lysozyme aggregation experiments, the most interesting variable to investigate is the effect of different heparins on the aggregation rate. Heparin is a complex poly-disperse anionic polysaccharide that can be chemically and enzymatically modified to produce increased structural variety akin to that of the biologically important carbohydrate heparan sulphate [
22,
23,
24]. In future experiments, using this plasma light source instrument, the effect on the aggregation rate of heparin’s mean molecular weight, size, disaccharide composition, and the identity of the counter cation may be investigated.


