3.1. Effect of the Voltage Amplitude (Vp) and Duty Cycle (d) on IPeak, Qmain, ΔtGIWs, LGIWs and Tsat
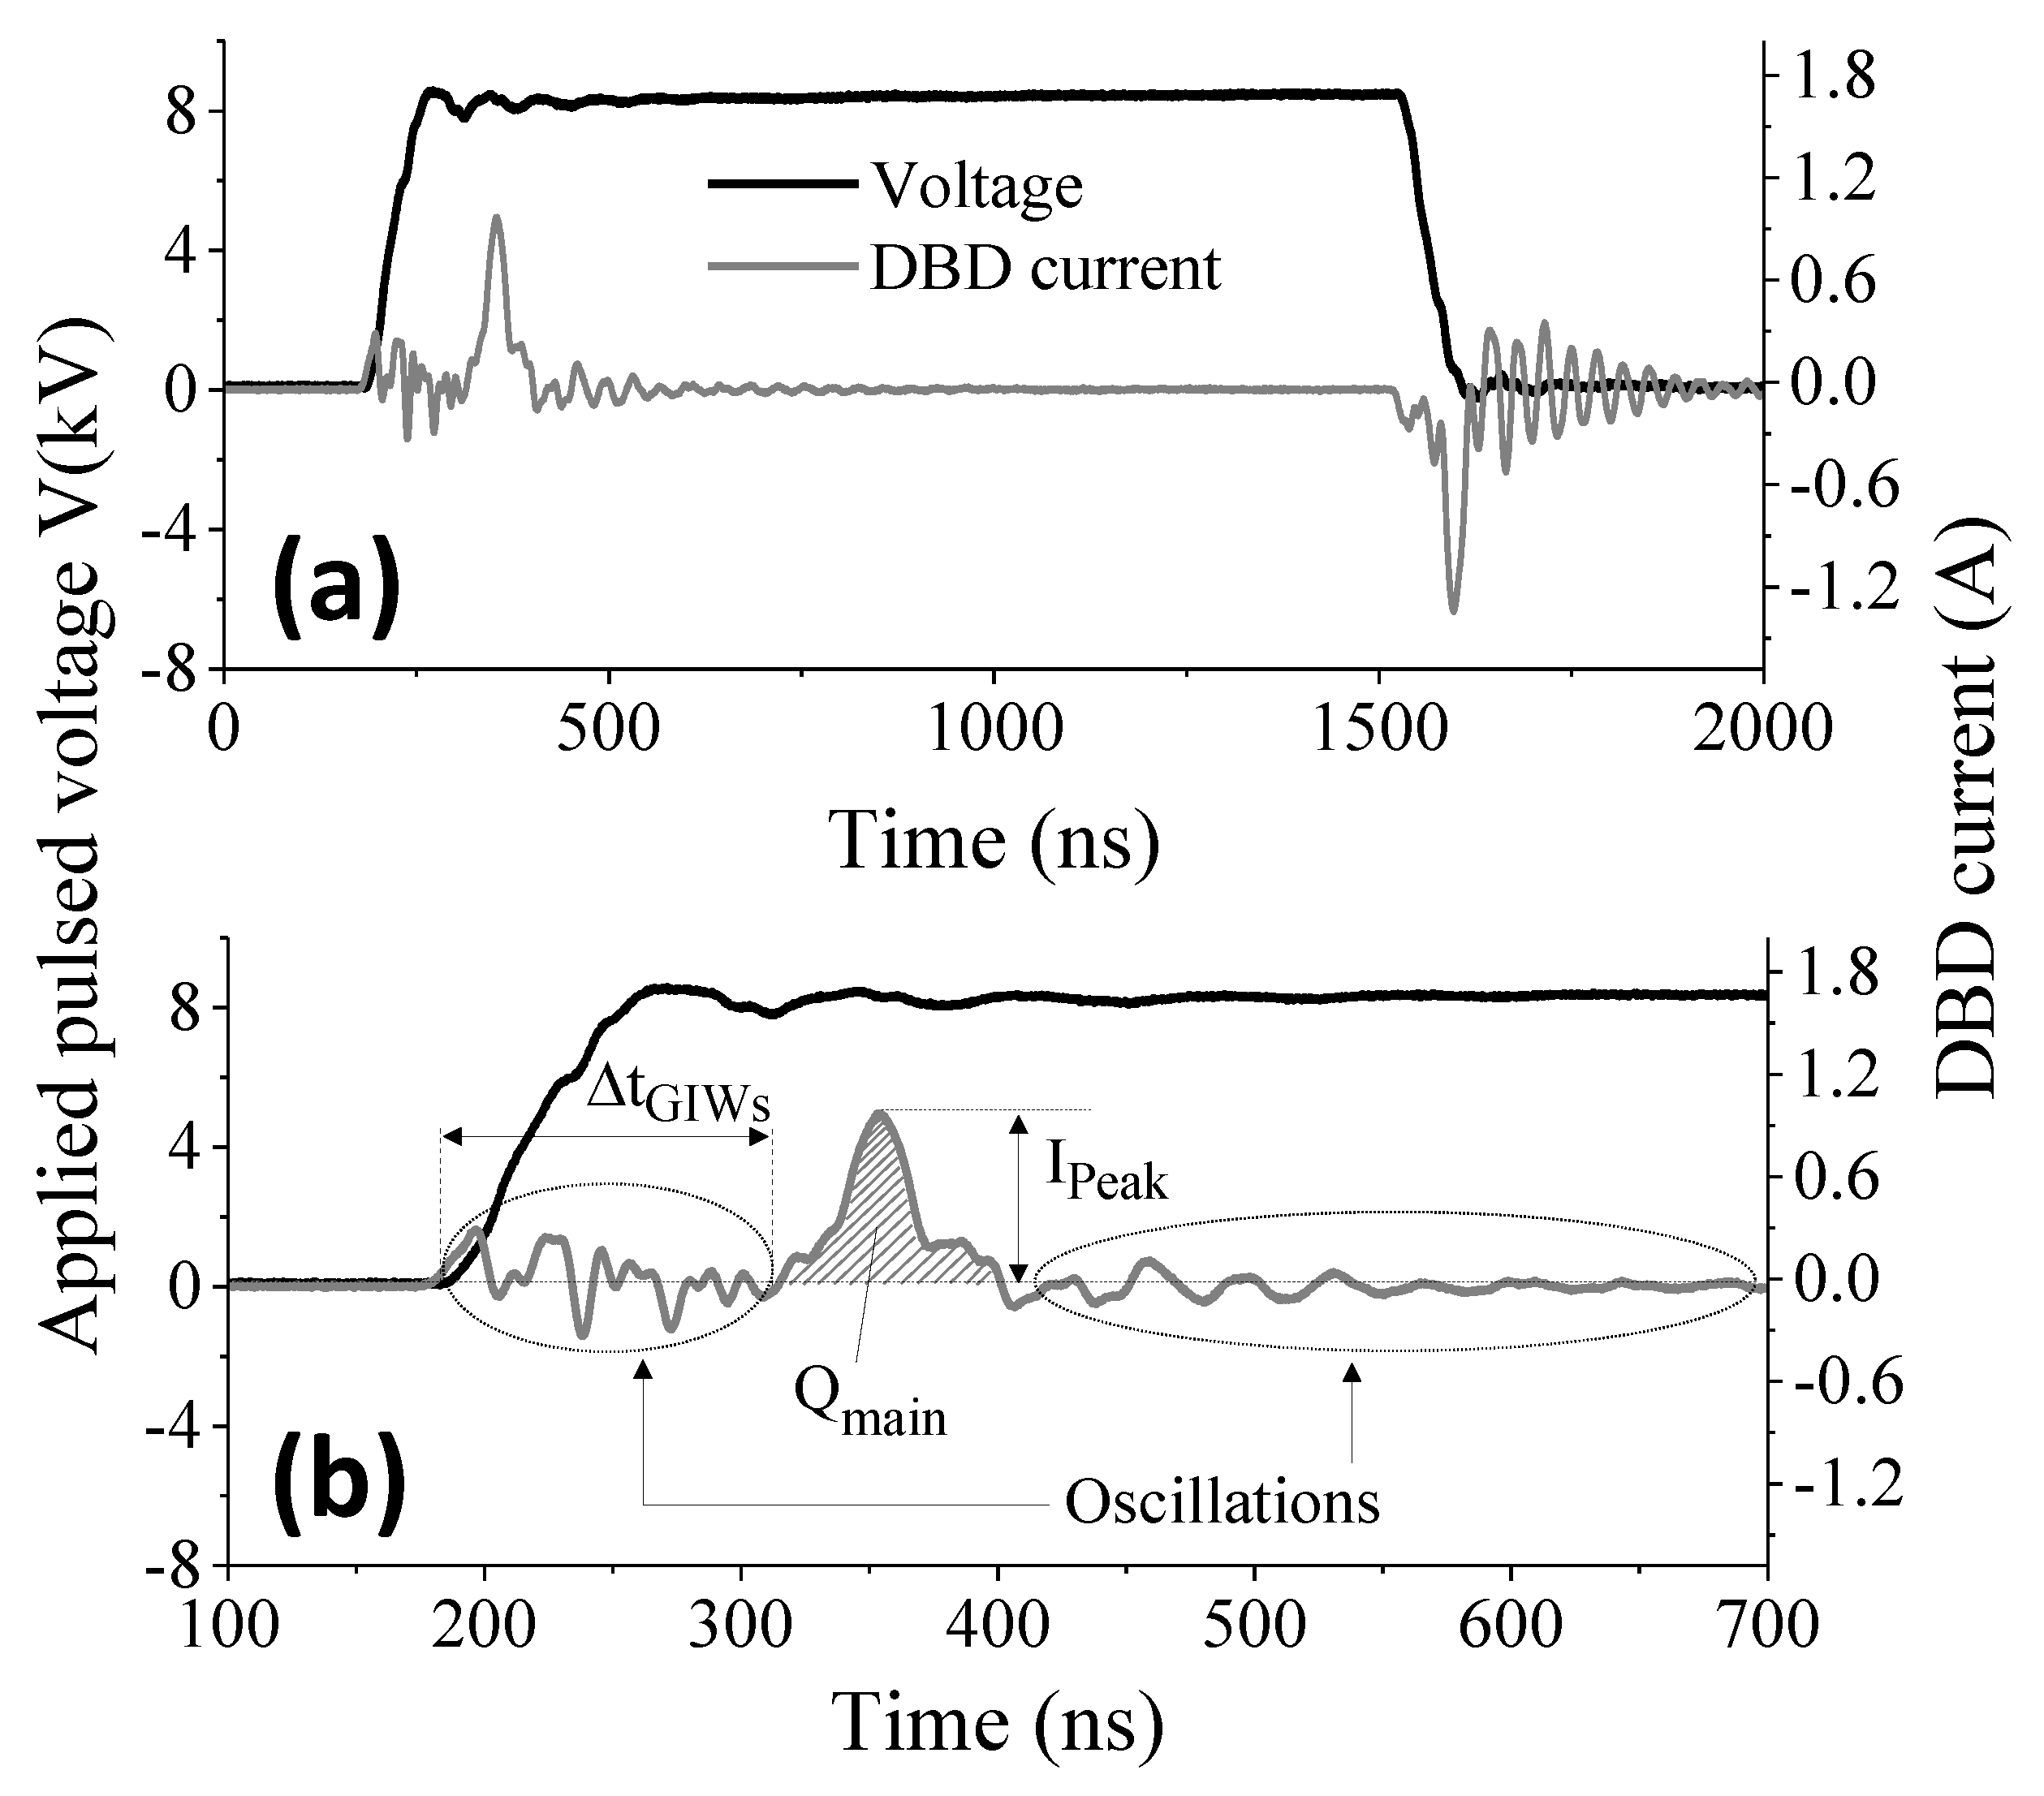
Figure 4 shows representative waveforms of the total DBD current during the rising (left) and the falling (right) slope of the pulsed voltage for different voltage amplitudes. As it was previously mentioned, the tuning of
Vp does not affect the Δ
tGIWs of the negative impulse, which is clearly demonstrated in the right frame of
Figure 4. Identical behaviors were remarked in other studies, as well concerning linear-field [
16] and single-electrode [
42] setups. Jarrige et al. [
16] observed via ICCD measurements that the secondary discharge appeared in the DBD at the end of the voltage pulse, without any evident formation of a second plasma “bullet”. Besides,
IPeak and
Qmain related with this impulse, change clearly with
Vp (see right frame of
Figure 4). Although, the study of the system parameters influence cannot be realized systematically, the present work will focus only on the positive current impulse (left frame of
Figure 4). Its variations are related with the ones of excited species formed in the GIWs, such as the helium at 706.5 nm (i.e., 3
3S–2
3P transition), which was demonstrated by different groups [
16,
25]. Since these species are formed via electron impact excitation, they are indicative of the modifications of the electron properties in the plasma, and thus, the ones of the discharge and the DBD total current.
IPeak,
Qmain and Δ
tGIWs of this impulse depend clearly on the voltage amplitude in our case. The signal oscillations that were recorded between 200 and 350 ns are almost the same at different
Vp values and they are ignored. With increasing
Vp from 4.5 to 8 kV, Δ
tGIWs shrinks considerably and
IPeak becomes noticeably higher (about 9-fold increase is observed). At elevated voltage amplitudes, the externally-applied electric field is strengthened and the reduced electric field in the DBD is also increased. Thus, a higher amount of electrical energy is delivered in the reactor. The electrons gain more kinetic energy as compared with the one at lower voltage amplitudes, which leads eventually to faster excitations/ionizations both in the inter-electrode section and in the gaseous channel. As such, the current impulse arrives faster in time with an increasing
Vp and “guided streamers” accelerate at higher
Vp values [
16], which was observed as well in a different electrode configuration [
42] than the present one.
The variations recorded in the total current of
Figure 4 are representative of the conduction current (i.e., plasma current) due to an amplification of the charge carriers (see below) under the action of the elevated reduced electric field. Hereafter, the influence of
Vp on the values of
IPeak,
Qmain, and Δ
tGIWs will be studied systematically, along with the variations of
LGIWs and
Tsat. The corresponding variations of
IPeak,
Qmain, and Δ
tGIWs will be shown only for
Vp ≥ 6 kV, since at lower amplitudes, the signals are comparable with the circuit oscillations, which could induce significant errors on the accurate determination of the above quantities.
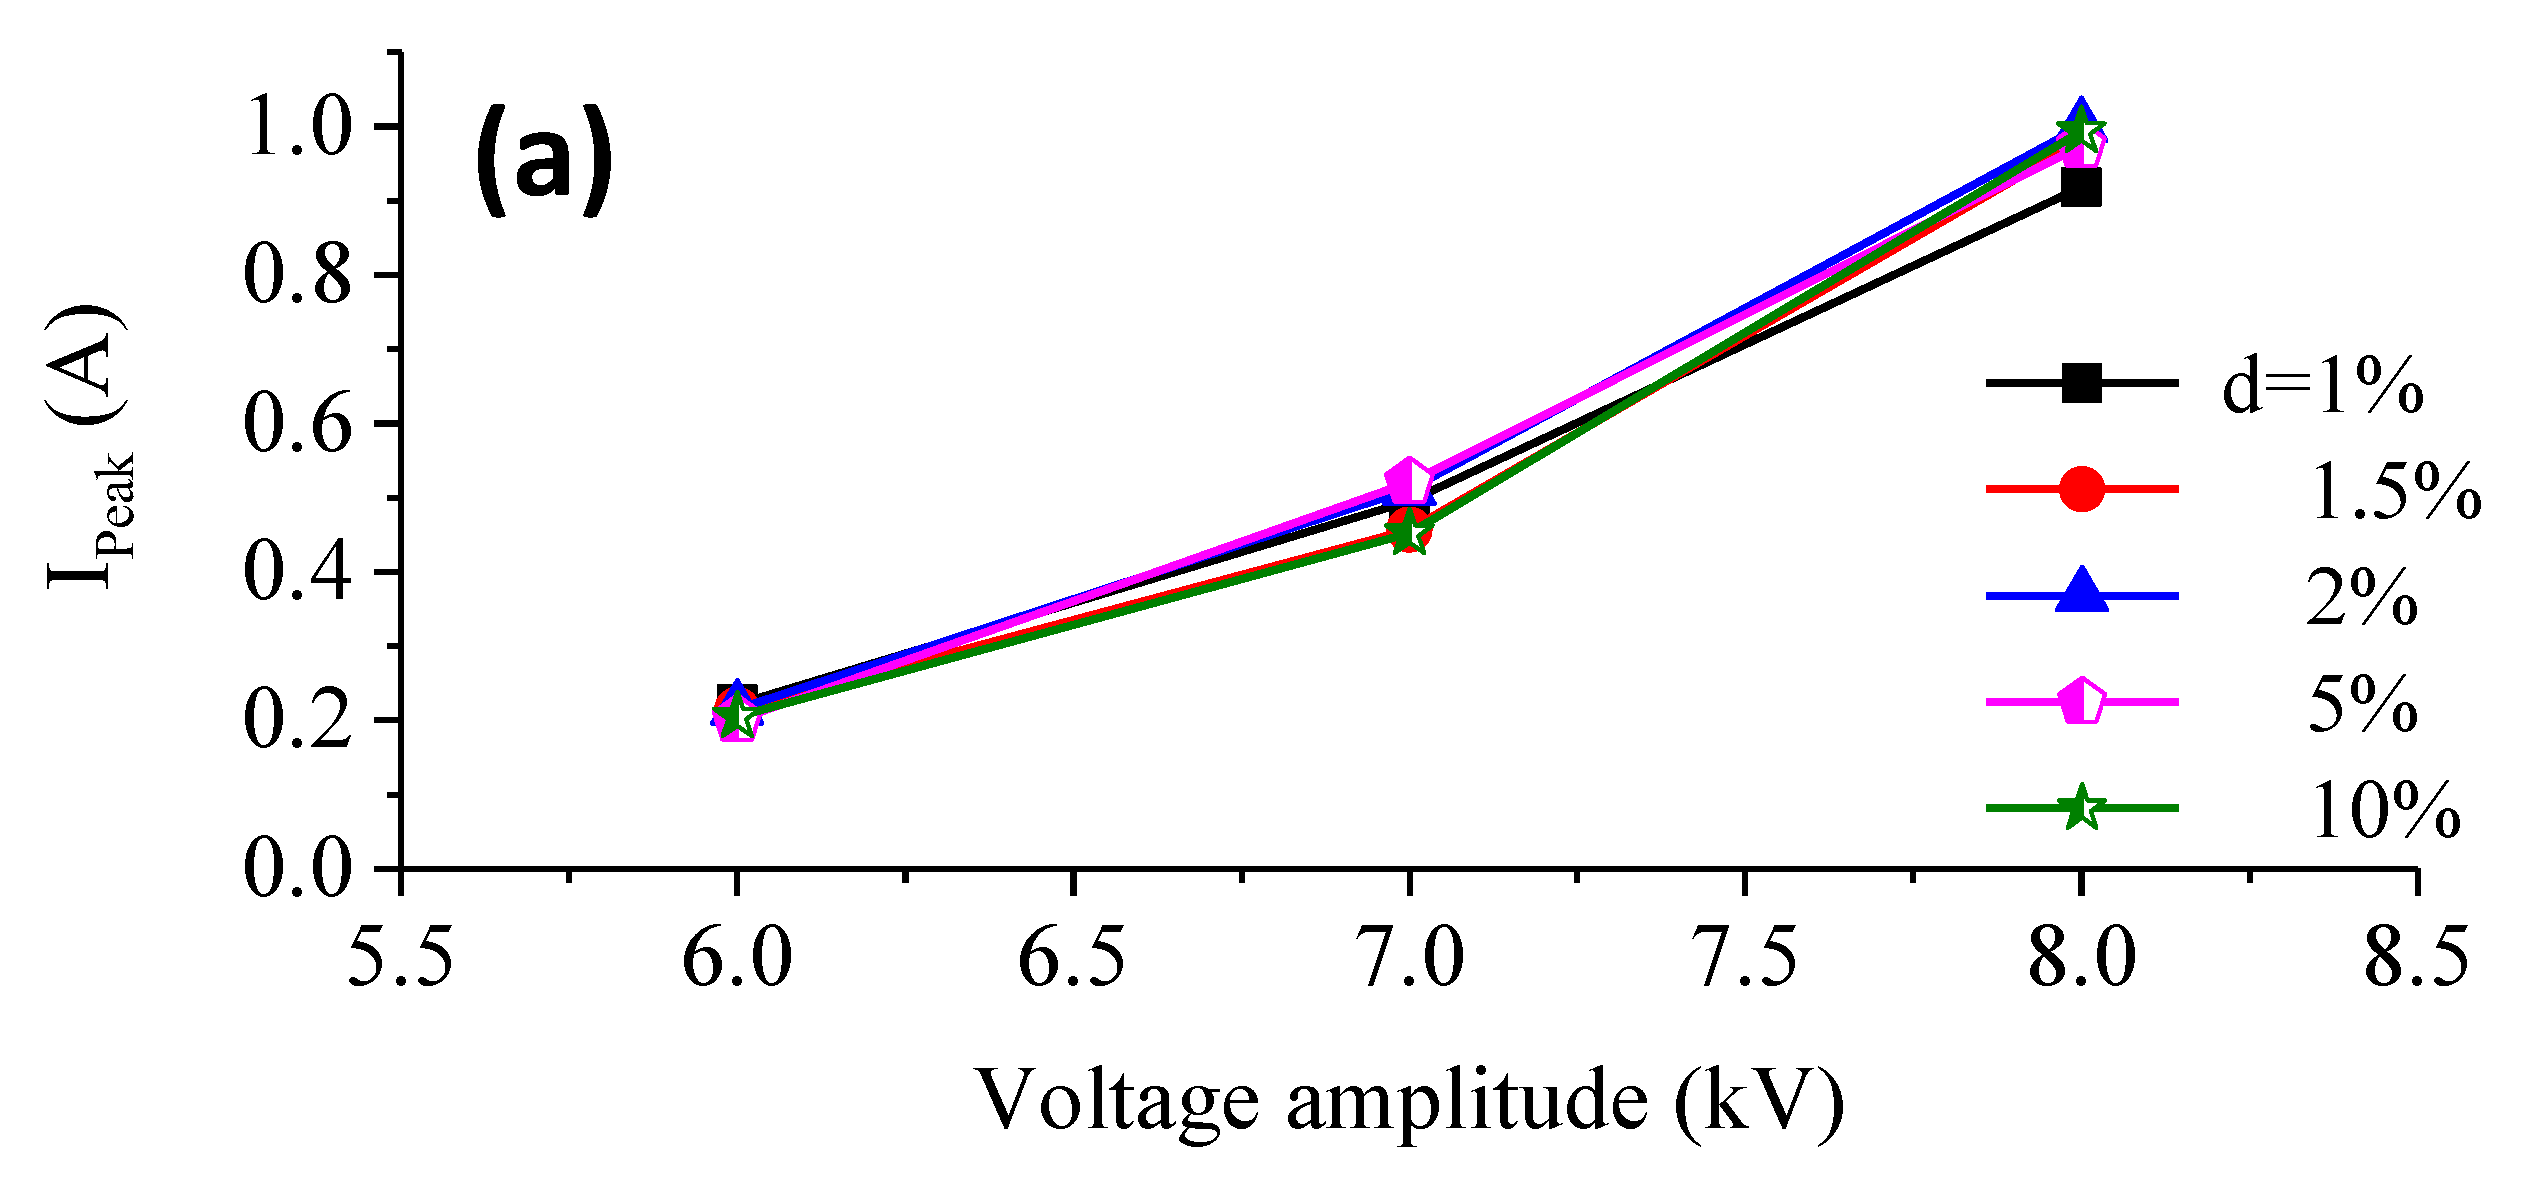
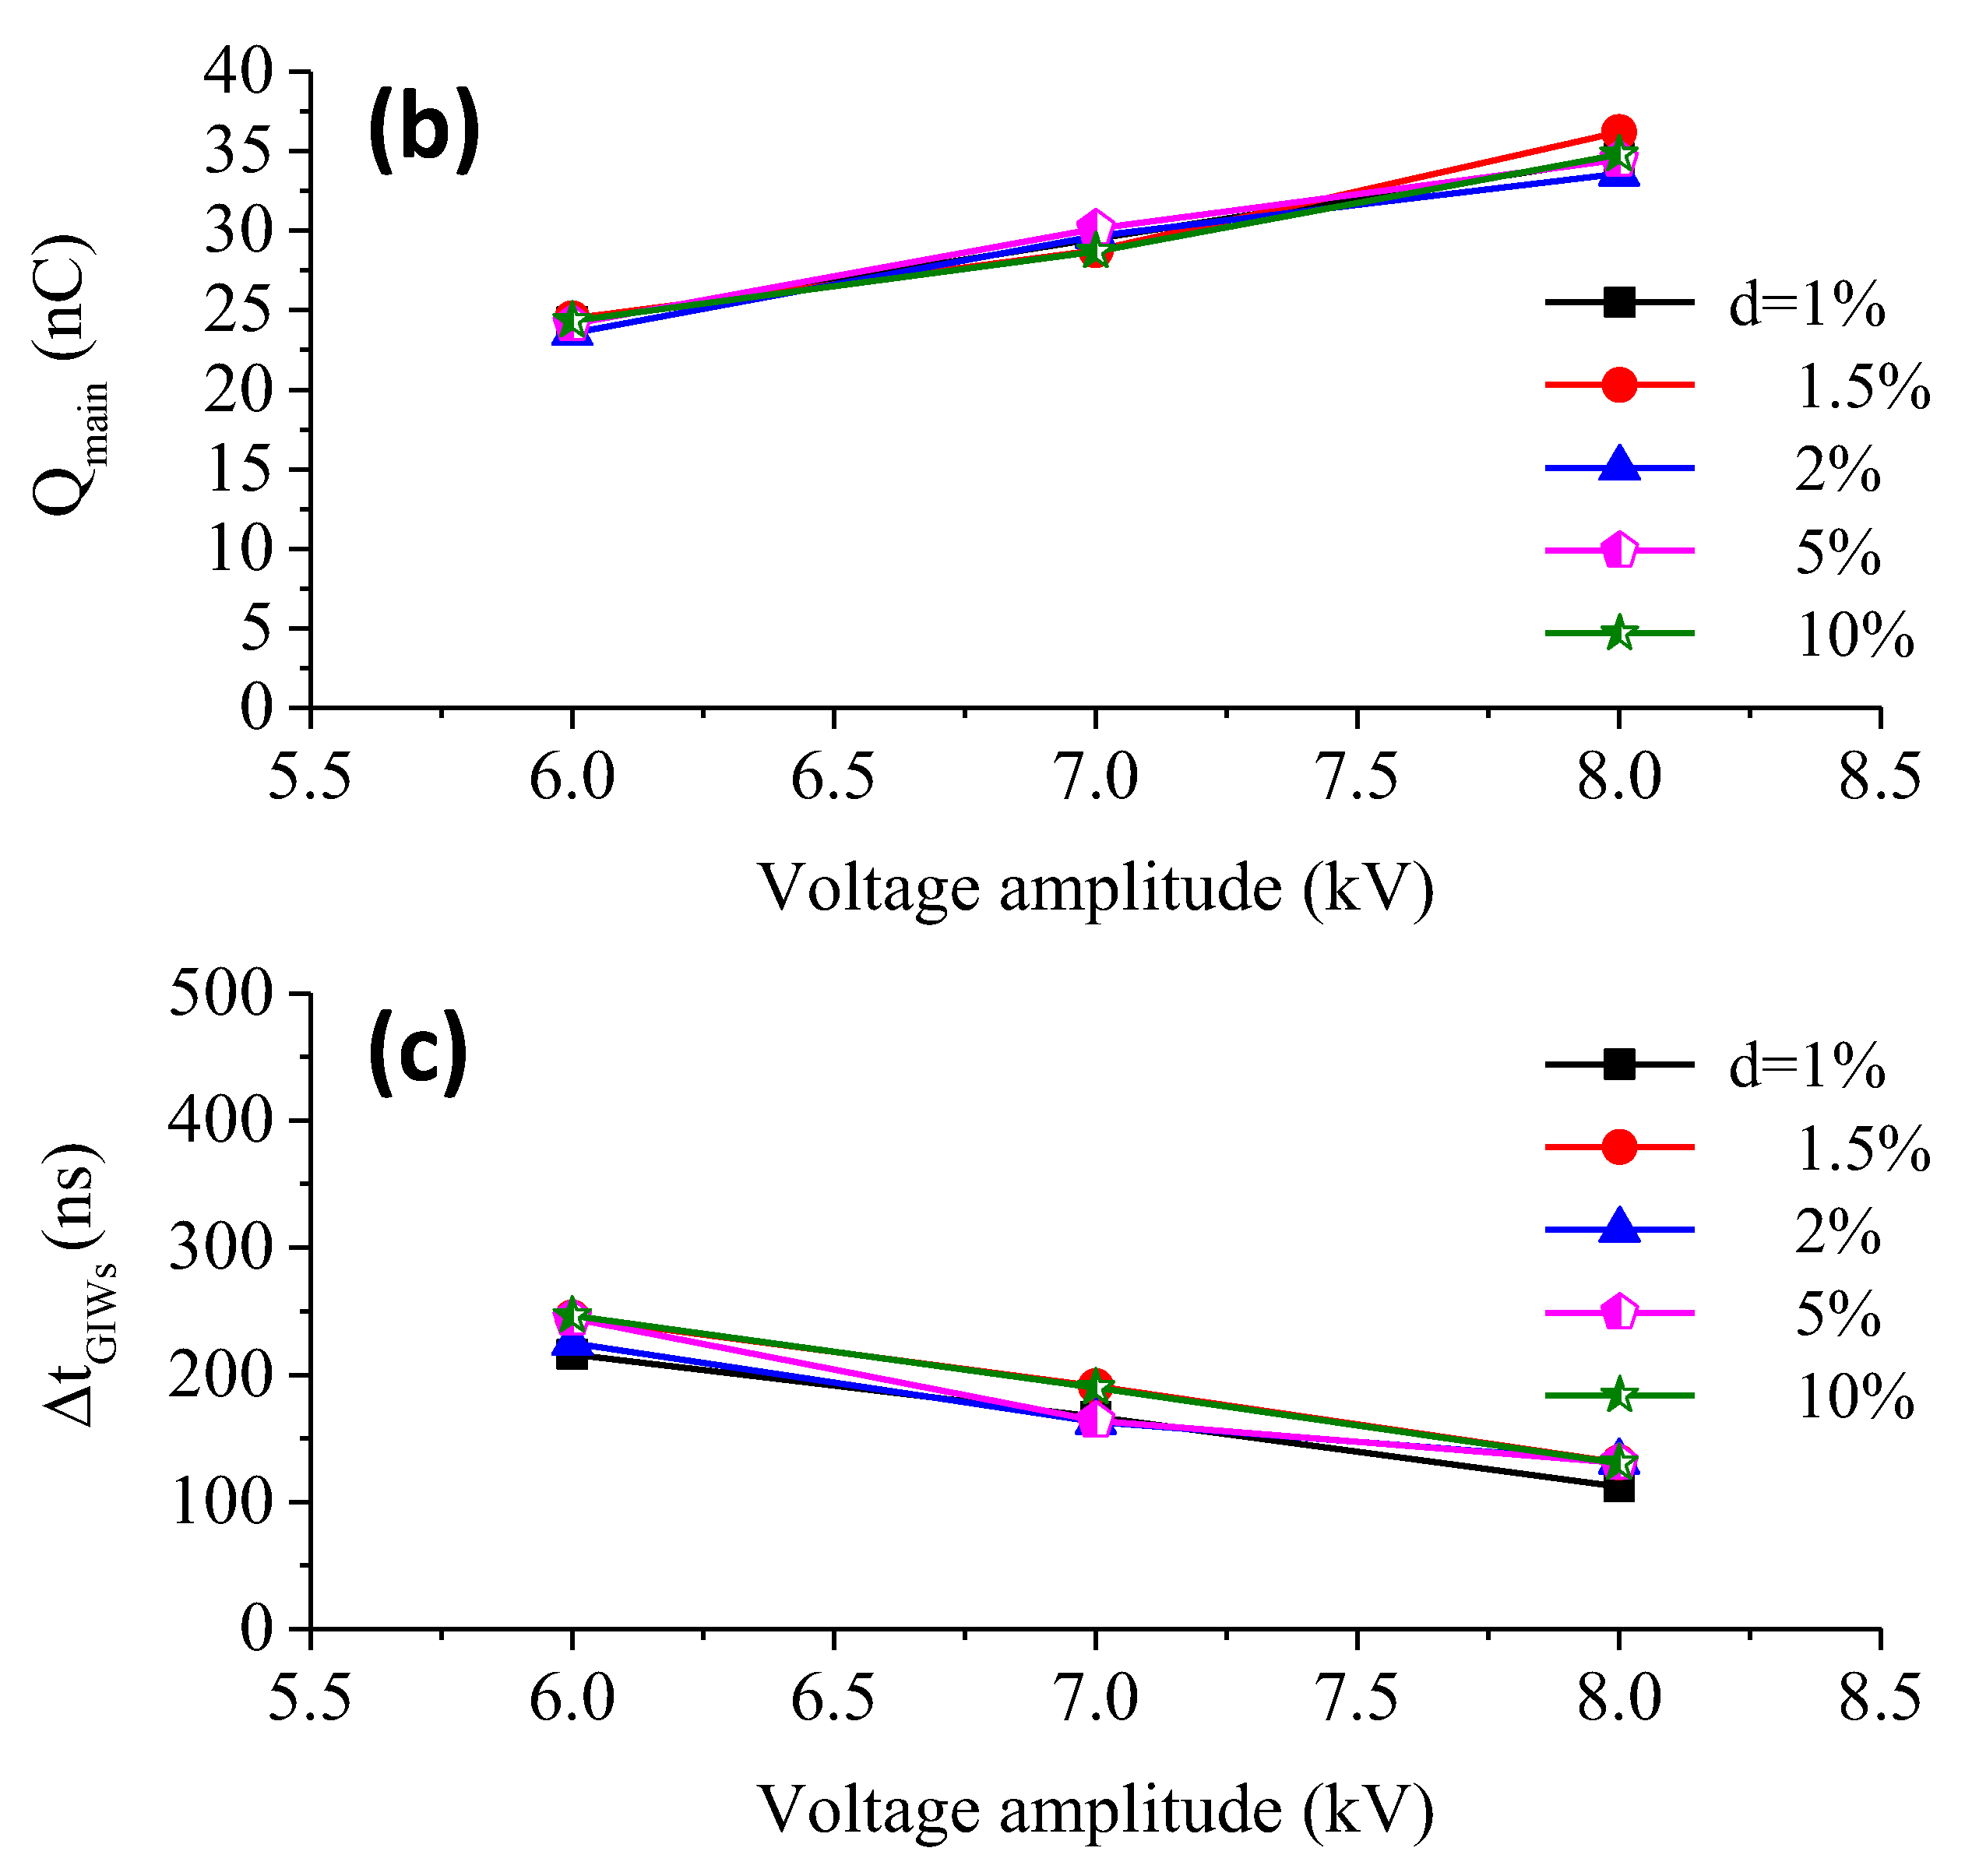
Figure 5 shows the variations of
IPeak,
Qmain and Δ
tGIWs versus
Vp for different duty cycles at
f = 15 kHz.
IPeak (
Figure 5a) is independent on the duty cycle within the range of values examined herein. On the other hand, the increment of the applied voltage from 6 to 8 kV induces an almost linear increase of the total current from ~0.2 to ~1 A, respectively (for
Vp ≤ 5 kV,
IPeak is lower than 0.15 A, see
Figure 4), similar comportment with other published works [
16,
42]. This fact may be attributed to an amplification of the electron avalanches in the gaseous channel due to higher electron energy [
25] at higher voltage amplitudes. As suggested by Nastuta et al. [
24], the variations of the maximum current could be associated to the ones of excited species (N
2+, O, OH, …), the production of which is closely related with the electronic properties (density, temperature) and the composition of the gaseous medium. In the present study, the total current is measured in the DBD discharge. It is thus expected that it is larger than the actual plasma (conduction) current in the DBD [
16,
27] and the current of GIWs (
IGIWs) [
23]. Indeed,
IGIWs is very low under our experimental conditions, especially at higher distances downstream of the reactor, which was verified by touching the plasma by the finger without any electrical shock. Regarding
Qmain (i.e., time-integrated DBD current, see
Figure 5b), it is independent on the duty cycle and it increases linearly with
Vp, i.e., identical comportment with the total current. This behavior of
IPeak and
Qmain for
d = 1–10% was also observed by another group [
42], although for a single-electrode configuration operating at 4 kHz and a much lower helium flow rate (0.5 slm). Between 6 and 8 kV, it varies from 23 to 35 nC, indicating significant magnification of the excitation/ionization processes in the gaseous channel. According to Nastuta et al. [
24], this maximum value is obtained only after five minutes of plasma operation for a linear-field DBD reactor (quartz dielectric). In our case,
Qmain obtained at 8 kV, is about twice higher than the one measured in [
24]. This difference is attributed to the different geometric dimensions of the two reactors and the use of alumina as dielectric in our case, which results in higher currents as compared to the quartz. In contrast with the latter quantities, Δ
tGIWs is clearly reduced with the increment of
Vp. This is representative of a faster establishment of the discharge in the DBD due to more efficient excitation/ionization of the gas [
16,
25]. It means that the propagation velocity of the guided streamers is also amplified, which was confirmed in [
16,
29,
30,
44]. Depending on the duty cycle value, Δ
tGIWs decreases from ~250 ns at
Vp = 6 kV to ~100 ns at
Vp = 8 kV, values that are in the range of the ones published in the bibliography [
16,
25]. These results demonstrate also clearly that low duty cycle values highly favorize the fast development of the discharge, which correlates with [
43,
45] even if they refer to different electrode setup and operating gas.
Figure 6 illustrates the effect of
Vp on
LGIWs for different duty cycles at
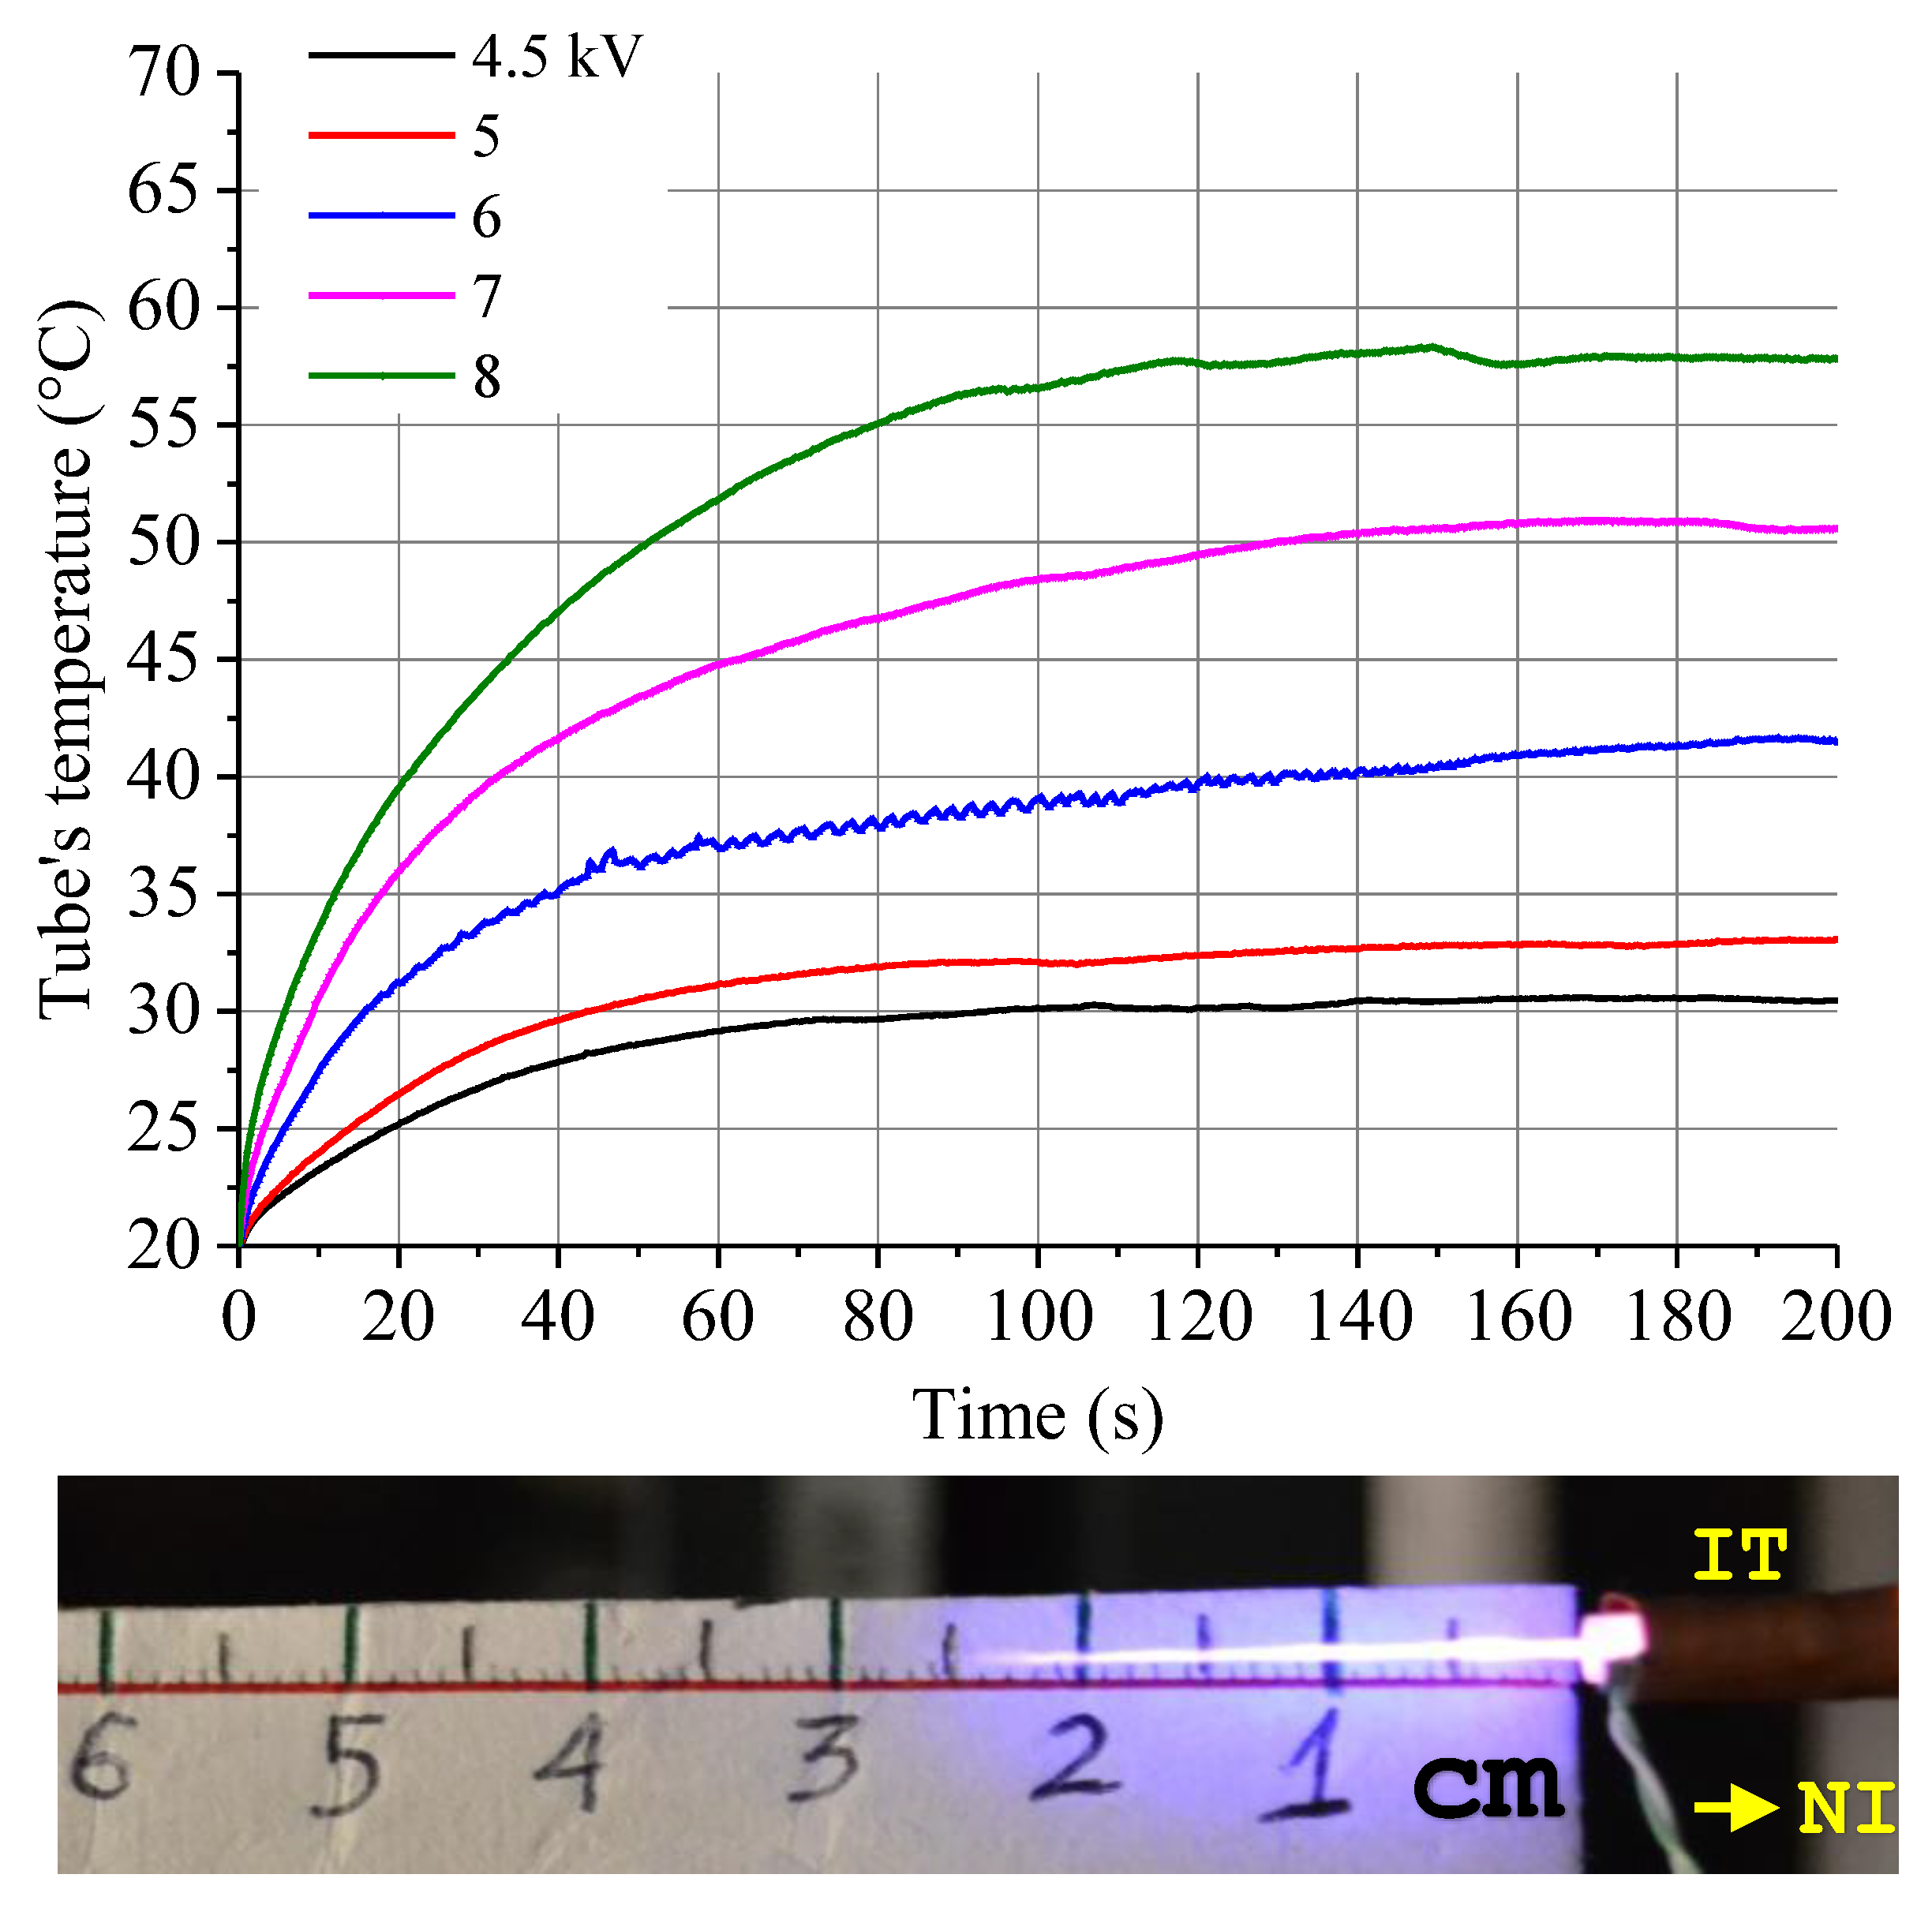
f = 15 kHz. As it can be seen, even a low voltage amplitude of 4.5 kV is high enough to generate GIWs with a length of 0.25, 0.5, 1, and 2 cm, corresponding to
d = 1.5%, 2%, 5%, and 10%, respectively. Instead, at
d = 1% no visible “plasma jet” is detected outside the tube for
Vp ≤ 5 kV.
LGIWs increases almost linearly with
Vp, obtaining its maximum value of ~4 cm at
Vp = 8 kV, and
d = 1–2% (a saturation value seems to be established between 7 and 8 kV for
d = 1.5–2%). Analogous behavior has been observed by other groups in similar [
24,
25,
31] and different [
42] μs-pulsed driven GIWs; it could be related with the increase of the energy transferred in the gaseous channel, leading to longer GIWs for a smaller helium mole fraction [
31]. Besides, two bends are distinguished among the low and the high
d values identically with [
42], where a single electrode APPJ device was reported. For
d = 1–2%,
LGIWs increases sharply with
Vp, while for
d = 5–10%, the corresponding slopes are clearly slower, resulting in shorter lengths for
Vp ≥ 7 kV. Further,
LGIWs depends slightly on the duty cycle for
d = 5–10%, which is not the case for
d ≤ 2%. Indeed,
LGIWs growths progressively with an increasing
d between 1% and 2%. Another interesting result is that, for
Vp = 4.5 and 5 kV,
LGIWs is higher at
d = 5–10% as compared with the lower
d values, while the situation inverses for
Vp > 6 kV. These results suggest that under our experimental conditions, the GIWs length is highly affected by the duty cycle (especially at low values) and the voltage, while the optimum
d and
Vp values in terms of long plasma propagation are 2% and 7–8 kV, respectively. For plasma-based applications, it means that controllable production of GIWs can be achieved at different distances downstream of the reactor, i.e., probable positions of samples. It is underlined that the plasma properties (e.g., production of reactive species) may be strongly changed due to the characteristics of the sample that is exposed to the GIWs (conductivity, humidity, porosity, etc.), which has been shown in recent publications [
37,
38,
39,
40].
Since many of the plasma-based DBD systems are meant to be used in biomedicine, the notion of temperature is very important. Different groups have proposed biocompatible reactors in terms of gas temperature [
14,
15,
16,
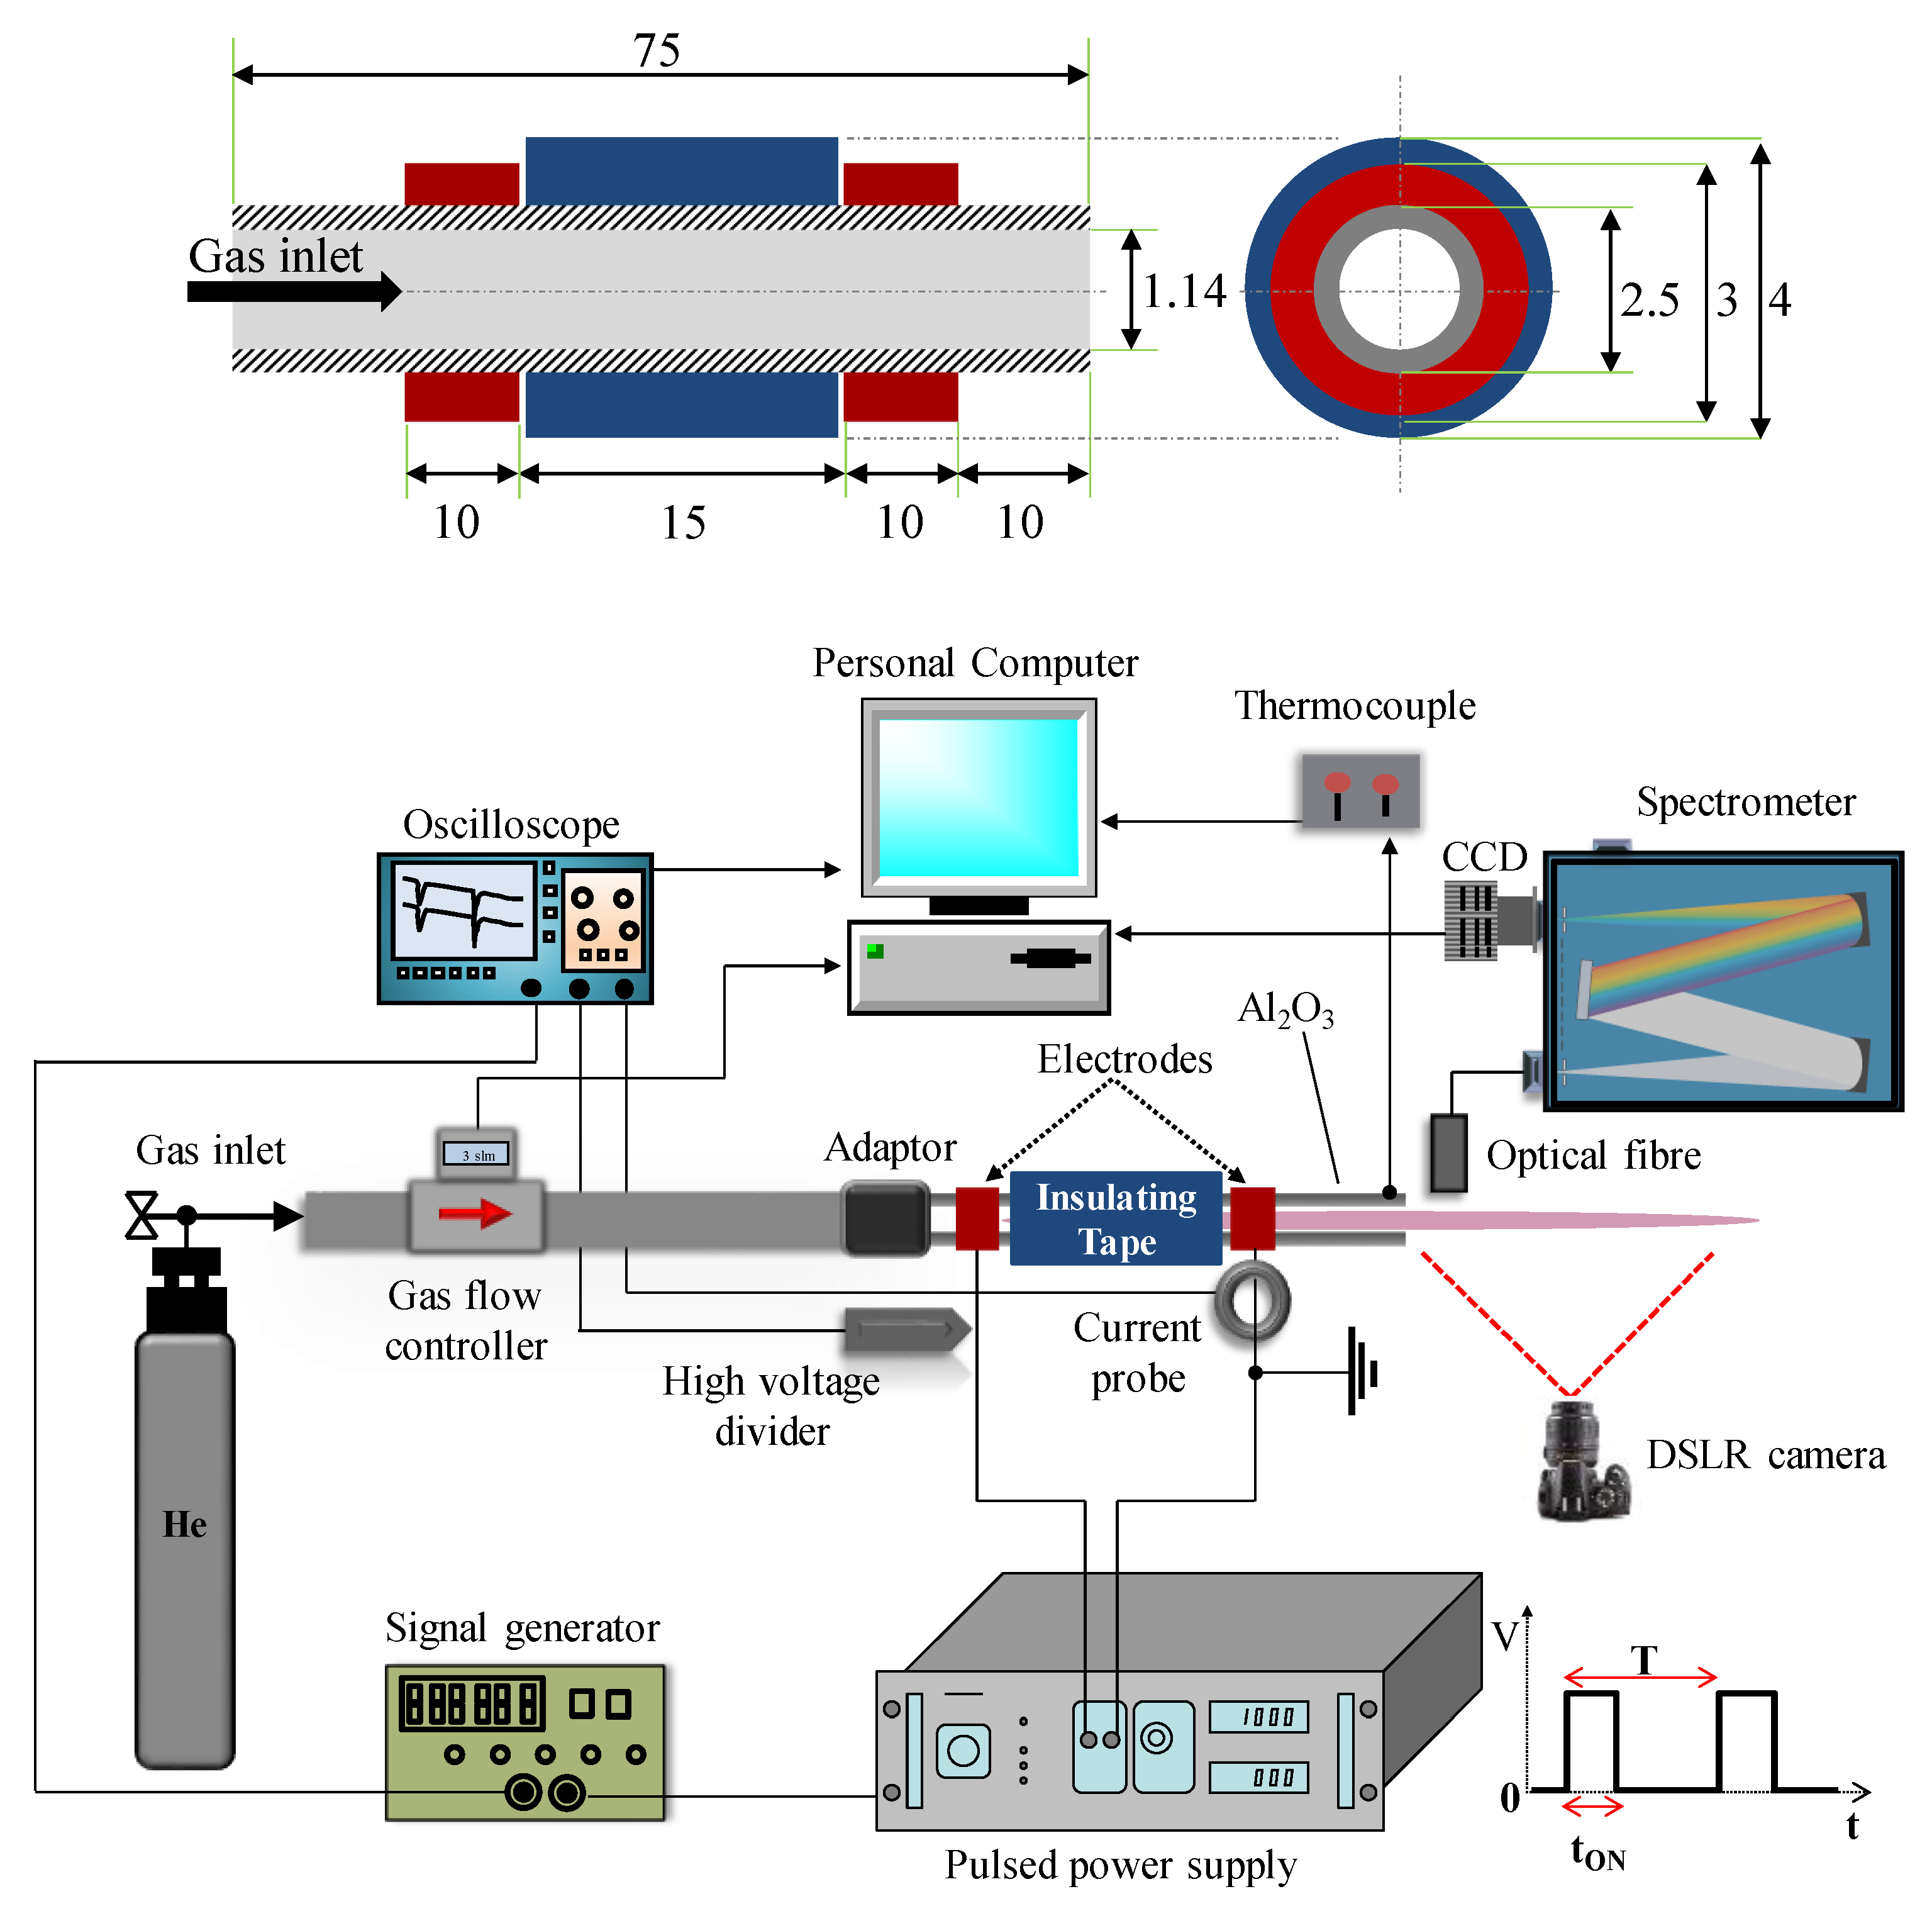
24], for which the temperature modification of the reactor mechanical parts is not considered. The effect of
Vp on the dielectric tube temperature (
Tsat, see
Figure 2) is thoroughly studied herein.
Tsat is supposed to be important for two reasons: (i) it gives an indirect indication of the gas temperature variations inside the reactor and (ii) it allows for real-time monitoring of the thermal processes that are involved in the DBD and accurate definition of the reactor steady-state operational regimes (to avoid, e.g., possible malfunction of its mechanical parts, which can modify the GIWs features).
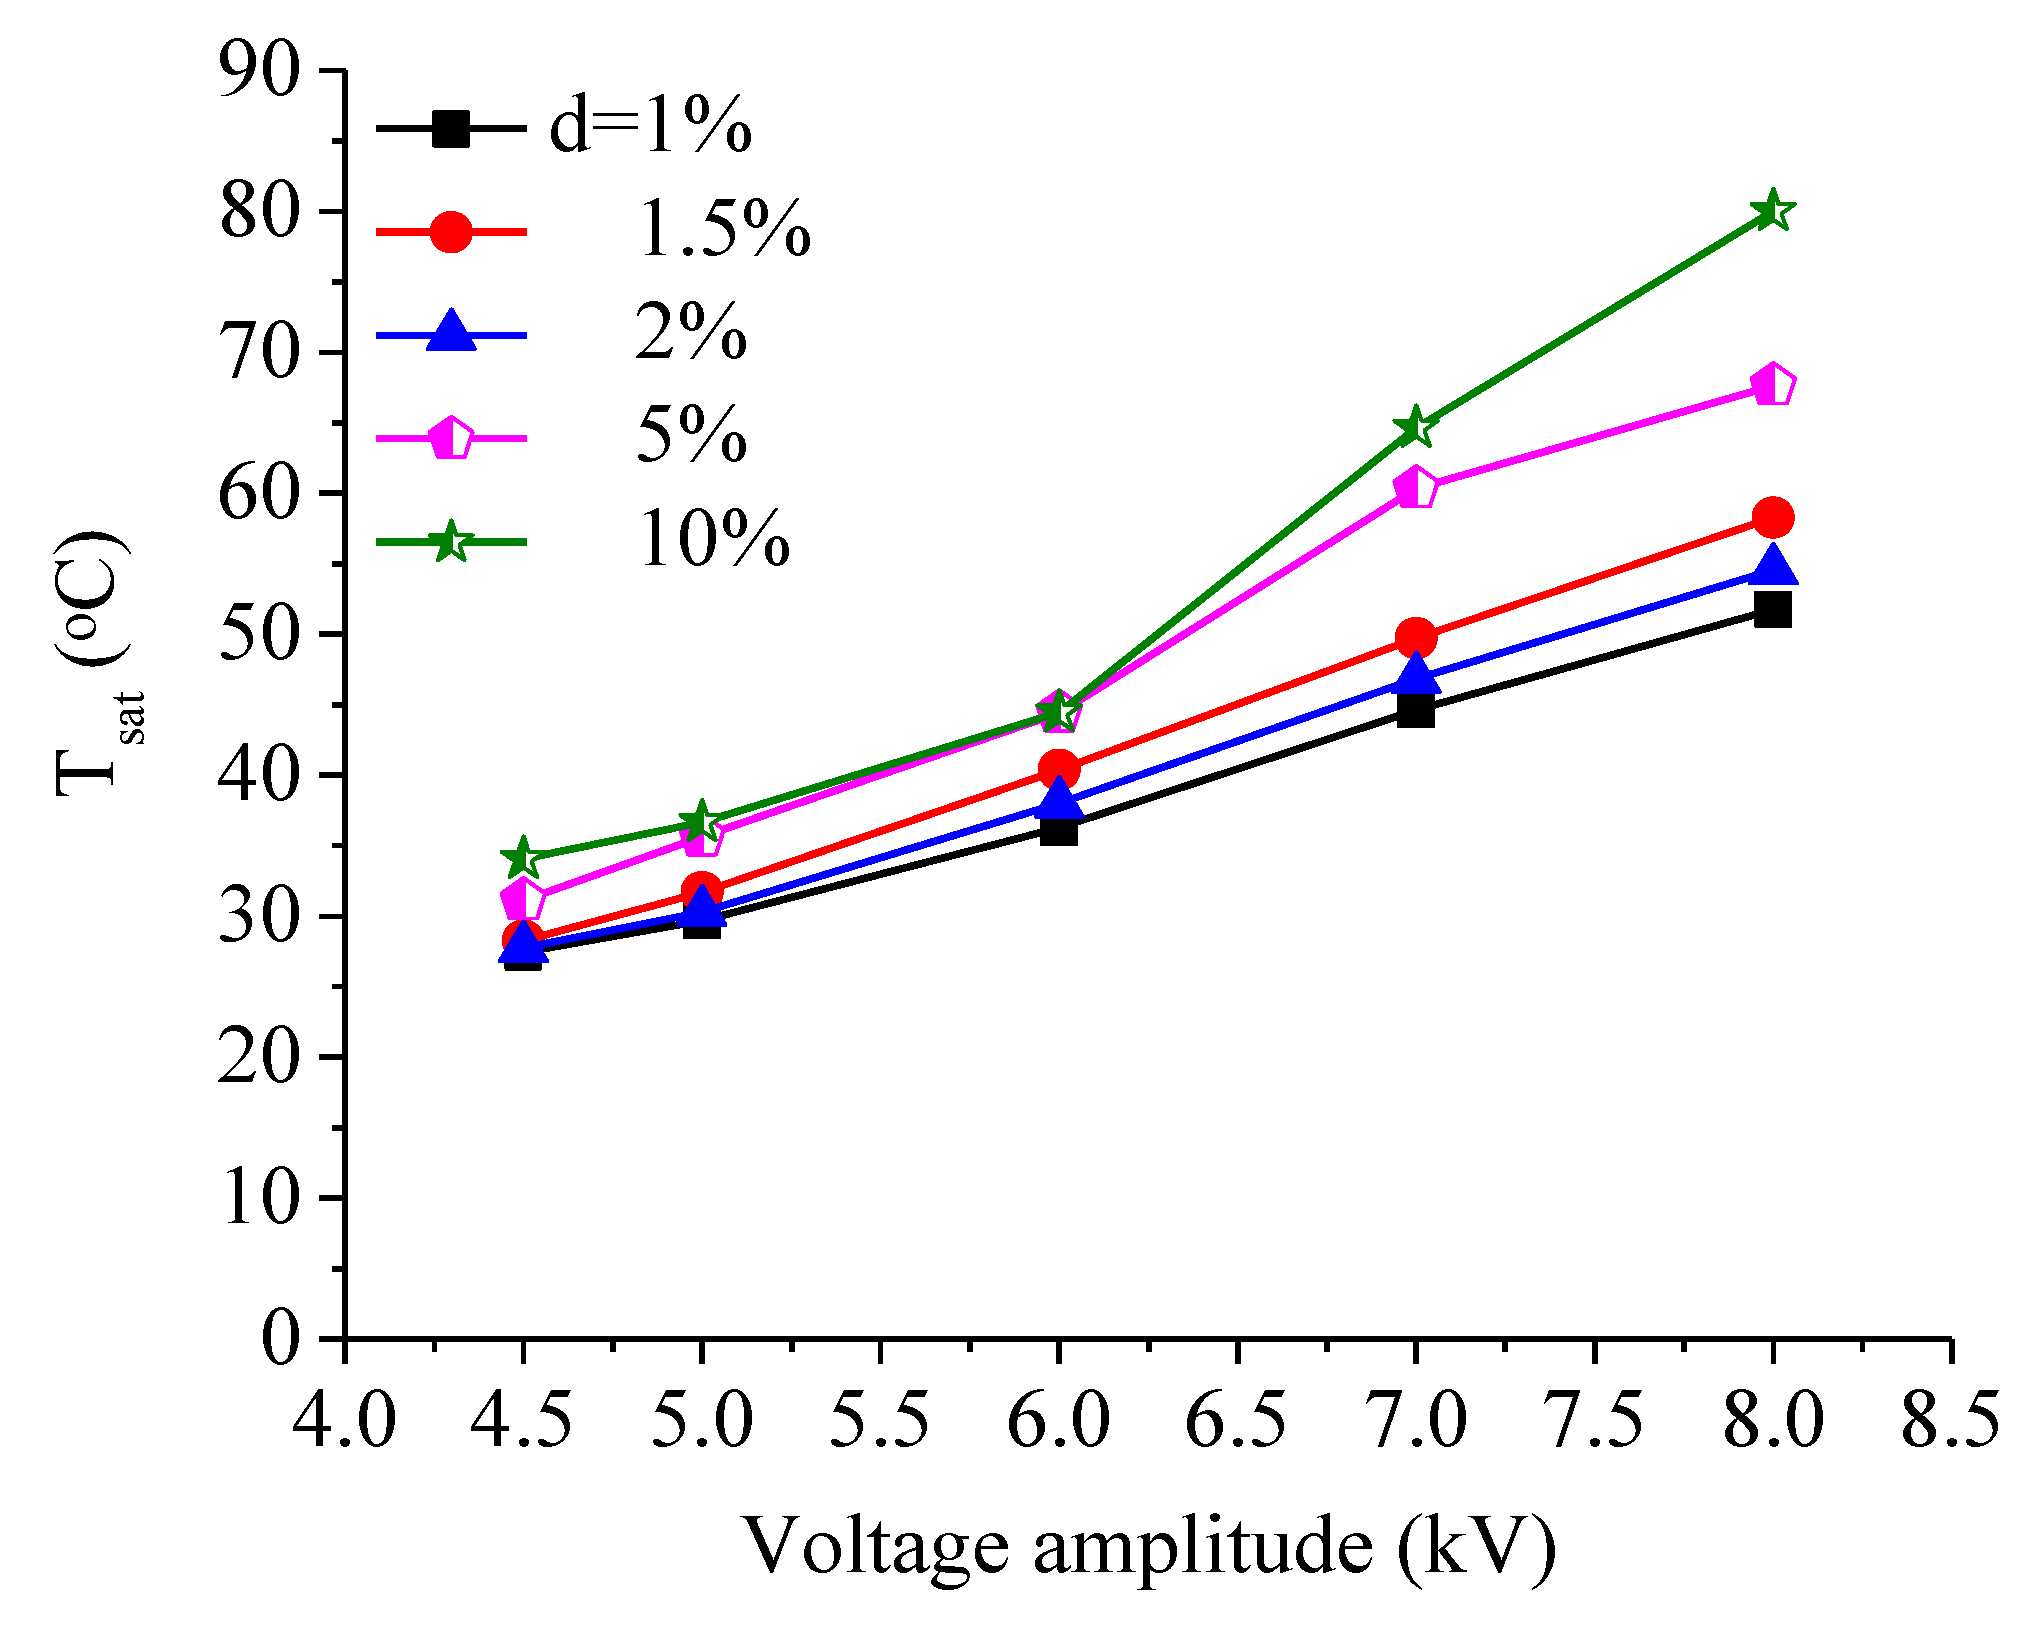
Figure 7 shows the variation of
Tsat as a function of the amplitude of the applied voltage for different duty cycles at
f = 15 kHz. An increase of
Vp induces an almost linear growth of
Tsat for all of the duty cycles considered. Concerning the duty cycle effect,
Tsat varies slightly between 1% and 2% for
Vp = 4.5–8 kV, while it increases for
d = 5–10% as compared with the lower
d values, especially for
Vp > 6 kV. It can reach up to a maximum value of 80 °C at
Vp = 8 kV and
d = 10%, which is quite high for biocompatible systems, even for the reactor itself in terms of “harmless” operation. On the other hand, it can be lower than 40 °C for
Vp < 6 kV, particularly at low
d values. The latter increment of the temperature with
Vp could be related with the increase of the electrical energy as it was stated above, leading to amplified current amplitudes (
Figure 5a), which induce Ohmic effects (i.e., heating of the tube). Except the system optimization for biomedical purposes, these variations of
Tsat offer valuable information for preventing the aging of the DBD reactor components, which could define the plasma features.
Based on the above results, it can be concluded that for a frequency of 15 kHz, the optimum operating conditions of the present GIWs system in terms of biomedical applications and reliable long-term operation, are the following: Vp from 4.5 to 6 kV and d between 1% and 10%. Within this operational window, Tsat remains lower than 40 °C, while the length of GIWs can be varied to reach specimens that are placed up to 3.5 cm downwards from the reactor. Appropriate operational windows can be obtained for all of the frequencies between 5 and 20 kHz, as it will be shown in the next subsection.
3.2. Effect of the Pulse Frequency (f) on IPeak, Qmain, ΔtGIWs, LGIWs and Tsat
The effect of the pulse frequency on the
IPeak,
Qmain, Δ
tGIWs,
LGIWs, and
Tsat, is herein studied for different
Vp values at
d = 2%. This value is adopted hereafter, since it allows for the effective production of elongated GIWs at relatively low temperatures (see previous section). The pulse frequency is varied from 5 to 20 kHz and its influence on
IPeak,
Qmain and Δ
tGIWs, is illustrated in
Figure 8a–c, respectively. An increase of the pulse frequency induces slight increase on the measured
IPeak (see
Figure 8a) for
Vp = 8 kV, which was also observed in [
42] studying a single-electrode helium GIW. Besides, for all of the frequency values considered,
IPeak rises sharply with
Vp (idem with the previous section). This is also the case for the total amount of charge
Qmain, which rises from ~22 nC at 6 kV to ~35 nC at 8 kV, while it remains insensitive to the frequency increment (see
Figure 8b). On the other hand, it is noteworthy that the positive current impulse (rising voltage slope) is obtained much faster at higher pulse frequencies (i.e., 50% decrease on Δ
tGIWs from 5 to 20 kHz, see
Figure 8c), indicating a noticeable acceleration of the guided streamers. Indeed, Walsh et al. [
44] demonstrated that, with increasing frequency between 2.5 and 20 kHz, higher propagation velocities up to 2-fold can be achieved (2 cm outwards from the reactor) for the same GIWs. This behavior is also true for different reactor setups than the present one [
42]. At higher frequencies, the time lag between successive guided streamers shortens and more seed electrons are available for upcoming avalanches [
44]. The excitation of chemical species (metastables, radicals and ions, with lifetimes between 0.1 and 10 ms [
42]) is enhanced as well, and their densities increase, thus contributing to the following discharge [
4]. Consequently, excited/charged species are produced relatively faster and effectively between the electrodes and in the gaseous channel, which promotes an earlier discharge development (see
Figure 8c).
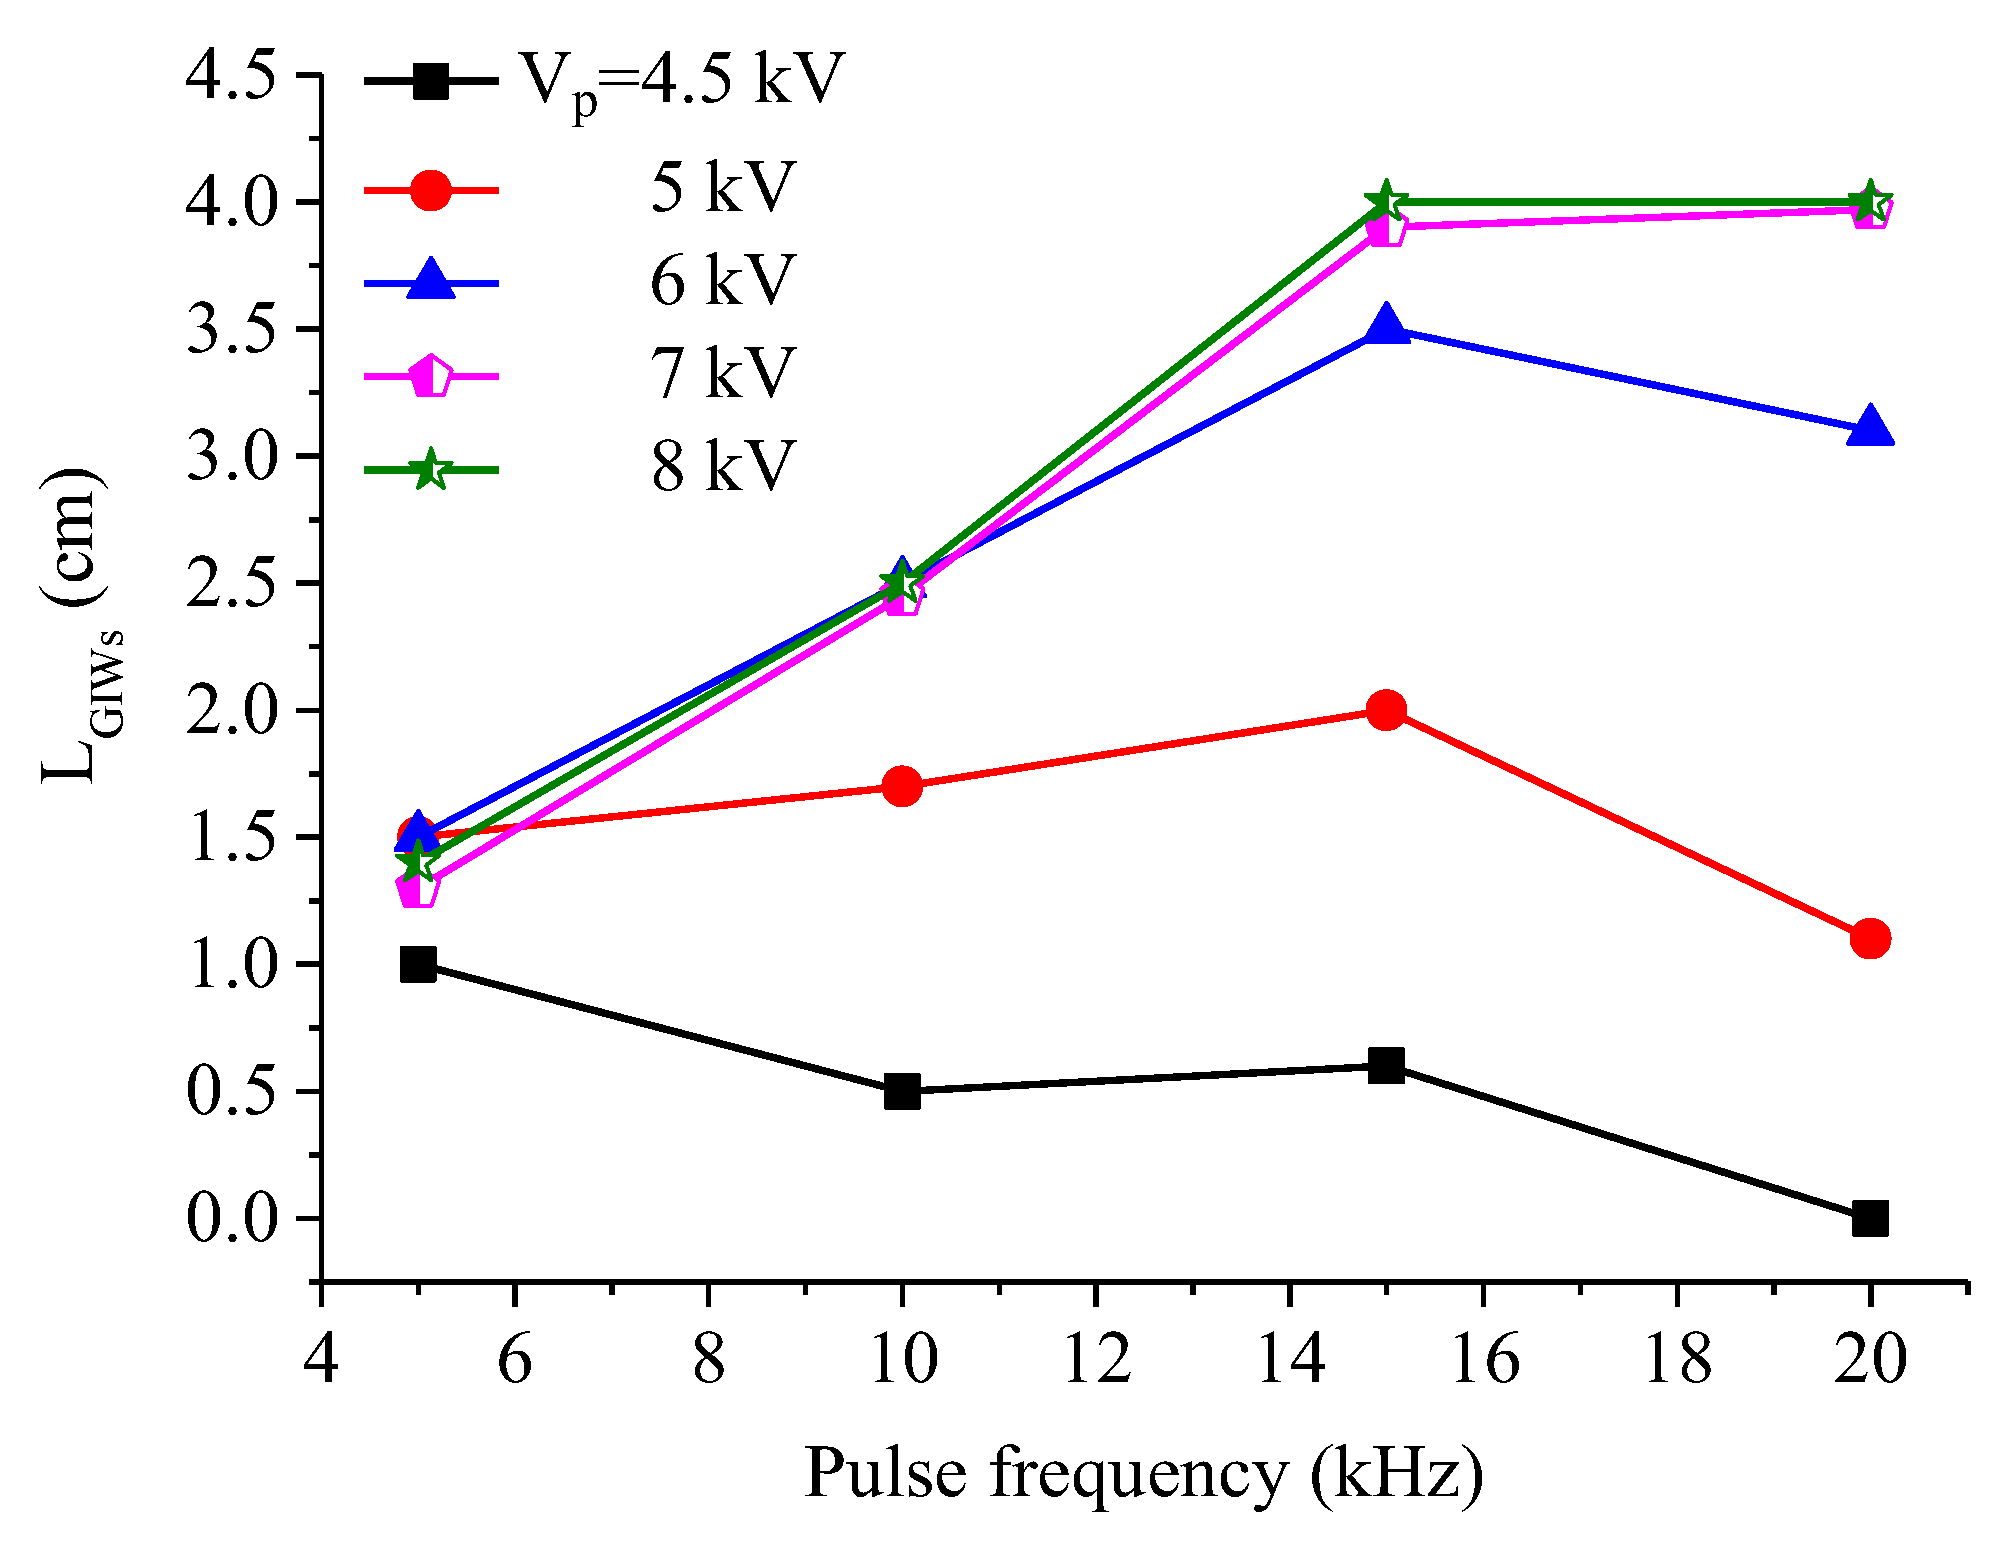
The impact of the pulse frequency on the visible length of GIWs is depicted in
Figure 9. For
Vp = 6–8 kV,
LGIWs follows a linear sharp increment in the range 5–15 kHz (from 1.5 to 3.5–4 cm, respectively). Then, a saturation seems to be established between 15 and 20 kHz for
Vp = 7–8 kV (maximum
LGIWs = 4 cm), while for
Vp = 6 kV, a decrease is revealed at 20 kHz (
LGIWs = 3.1 cm). On the other hand, for
Vp = 5 kV, LGIWs growths slowly from 1.5 to 2 cm, corresponding to 5 and 15 kHz, respectively, while it falls down to 1 cm at 20 kHz. Finally, at
Vp = 4.5 kV,
LGIWs is shrank from 1 to 0.5 cm, corresponding to 5 and 15 kHz, respectively, while at 20 kHz, there is no visible “plasma plume” outside the reactor. The tendencies that are observed herein up to 8 kHz are in quite good agreement with the work of Nastuta et al. [
24], where
LGIWs increased continuously with the pulse frequency in the range 0.5–8 kHz. From these results it is clear that there is a connection between the GIWs length and the voltage pulse’s frequency, while
f = 15 kHz seems to be an optimal value for effective production of elongated GIWs within the range of voltage amplitudes considered herein. This is why this frequency value was chosen in the previous section to perform parametric studies versus the voltage amplitude and the duty cycle. Although, these results are not linked with the ones reported in [
44], where
LGIWs appeared significantly longer at 20 kHz (~4.8 cm) in respect to 5 kHz (~3.5 cm), for
Vp = 4.6 kV and a pulse width of 2 μs. Besides, in the work of Xiong et al. [
43],
LGIWs did not depend on frequency at all. The differences that were observed between these three DBD systems could be related to the dissimilar electrode configurations and dielectric materials used, while for a better understanding of these behaviors, more experimental/theoretical works are necessary.
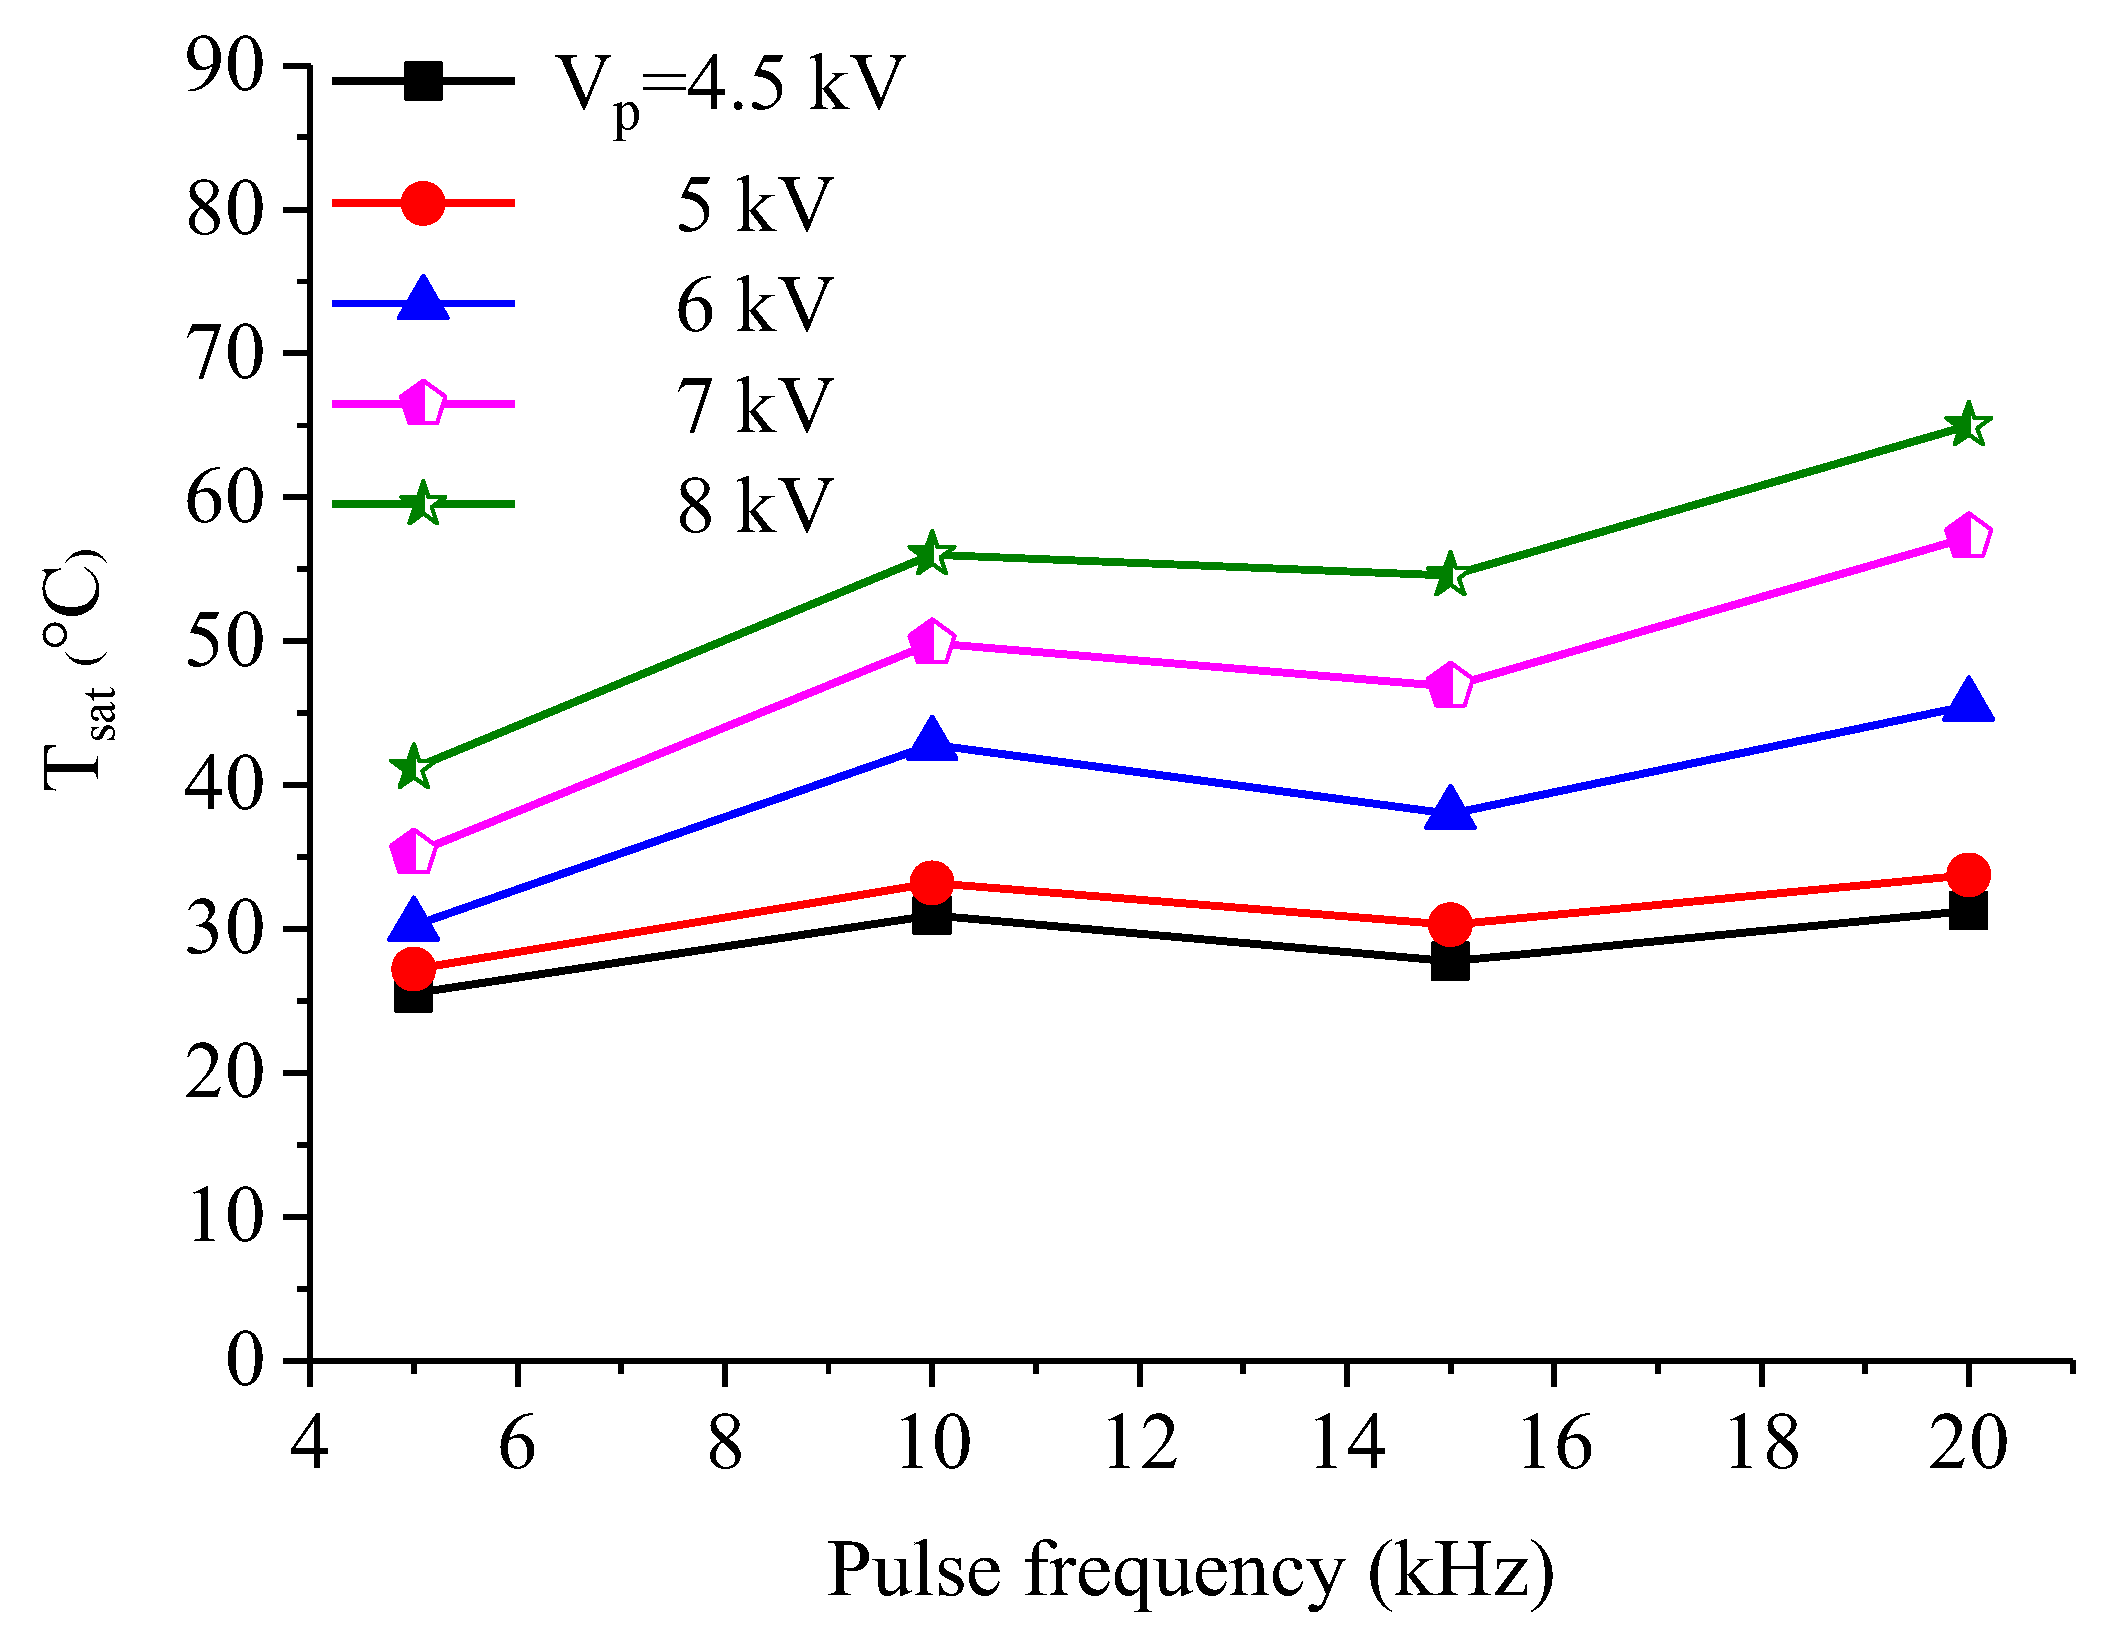
Finally, the dependence of the dielectric tube temperature (
Tsat, see
Figure 2 for definition) on the pulse frequency is illustrated in
Figure 10. The impact of the voltage amplitude on
Tsat is clearly observed in good agreement with
Figure 7, and a continuous increase is recorded from 25 up to 60 °C (corresponding to 4.5 and 8 kV, respectively). Concerning the frequency’s effect on
Tsat, the same tendency is recorded for all of the voltage amplitudes. From 5 to 10 kHz,
Tsat increases from 25/40 (
f = 5 kHz,
Vp = 4.5/8 kV) to about 30/55 °C (
f = 10 kHz,
Vp = 4.5/8 kV). Then, it varies slightly between 10 and 15 kHz within a range of ±3 °C. Finally, from 15 to 20 kHz,
Tsat increases again from 26/55 (
f = 15 kHz,
Vp = 4.5/8 kV) to about 30/60 °C (
f = 20 kHz,
Vp = 4.5/8 kV). This increase may be related to a faster movement of electrical charges in the reactor at higher frequencies, which affects the temperature of the GIWs [
6], and, as a consequence, the
Tsat. Furthermore, depending on the chosen value of
Vp and the desired characteristics of GIWs for biomedical applications, it is possible to achieve
Tsat values lower than 40 °C under all of the frequency values that are considered herein. On the other hand, it is shown that not all of the reactor functional windows are adequate for thermal-free operation. Except for the biomedicine, the present system could be adequate for other types of applications as well (e.g., processing of inert materials like dielectrics and polymers).
3.3. Optical Emission Characteristics of GIWs
According to the previous sections, the GIWs electrical (
IPeak,
Qmain, and Δ
tGIWs) and thermal (
Tsat) characteristics depend strongly on the parameters of the pulsed power supply (voltage amplitude, duty cycle, and frequency). Based on these results, appropriate operational windows can be defined to avoid reactor malfunctioning due to high operational temperatures and to produce on-demand GIWs for implementation in the biomedical and other research fields. As it is suggested by recently published references [
37,
38,
39,
40], the presence of a target (biological and/or inert material) may strongly modify the GIWs dynamics, temperature, and generated reactive species densities. Towards this direction, an effective control of the above parameters, and especially the temperature and the reactive species formation in the free-GIW case, appears to be crucial for better understanding the GIWs performance on various specimens (mostly biomedical). As it was shown by different groups, the latter can be tuned (free-GIWs case) by varying the system parameters [
6,
15,
16,
25,
43]. In this section, effective production of emissive reactive species is achieved even at the lower voltage amplitude of 4.5 kV (
LGIWs = 0.5 cm), which is demonstrated below via optical emission spectroscopy measurements (see
Figure 11).
Figure 11 depicts a typical wide emission spectrum of the GIWs recoded at
Vp = 4.5 kV. It shows various emissions originating mainly from the following reactive species: OH(A
2Σ
+–X
2Π) around 309 nm, N
2(SPS) at 337.1 nm (C
3Π
u–B
3Π
g transition), N
2+(FNS) at 391.4 nm (B
2Σu
+–X
2Σg
+), various excited helium lines (i.e., He(3
1P–2
1S) at 501.5 nm, He(3
3D–2
3P) at 587.5 nm, He(3
1D–2
1P) at 667.8 nm, He(3
3S–2
3P) at 706.5 nm, and He(3
1S–2
1P) at 728.1 nm), atomic excited oxygen (O(
5P–
5S) at 777 nm), and hydrogen (H
α at 656.3 nm). Additionally, very weak emissions of N
2(FPS) are detected, which are indicative of the production of N
2(A) metastables due to the radiative transition B
3Π
g–A
3Σ
u+. N
2(A) are key species in DBD-based discharges, since they stimulate various chemical reactions, leading to the production of reactive species, such as NO
γ, OH(A), N
2(B), N
2(C), etc. On the other hand, the detection of N
2+ (FNS) indicates the presence of He metastables (He
m) and helium dimer ions (He
2+) in the GIWs, which are believed to play a crucial role in the dynamics of guided streamers. He
m are created through collisional excitation of the ground state helium with electrons, or radiative de-excitations of higher energy levels of helium. Besides, He
2+ are formed via three-body reactions (He
+ + 2He → He
2+ + He [
16]). Both of the species contribute to the excitation of nitrogen ions due to the following reactions [
16,
43]:
Furthermore, OH(A) molecules are produced via dissociation (through collisions with electrons) of H
2O molecules (present in the form of vapors) and electron impact excitation of the OH(X) [
14]. N
2(C) is produced through the electron impact excitation of N
2(X) species, later forming N
2(SPS) through radiative relaxation to the N
2(B) state. Excited atomic H and O are due to electron impact excitation of their corresponding ground states, which are formed by the dissociation of O
2 (stands only for O) and water vapour (stands for O and H).
The possibility of tuning/enhancing the chemical reactivity of GIWs that are generated with the present device is considered herein by varying the applied voltage amplitude from 6 to 8 kV (idem with the previous sections). Its effect on the intensities of representative chemical species is shown in
Figure 12. It is underlined that the spectroscopic system is not calibrated in terms of relative irradiance, which is out of the purpose of the present study. Thus, a comparison between the different species intensities should be avoided. Nevertheless, this should not affect the qualitative analysis of species intensities versus
Vp. The upper frames of
Figure 12 show the evolution versus the voltage amplitude of characteristic structures of representative molecular bands and atomic lines, which were considered for the analysis. In the lower frame of
Figure 12, species maximum intensities are plotted versus the voltage amplitude. As it can be seen, all of the intensities rise almost linearly with the increment of the voltage amplitude from 6 to 8 kV, which was verified by fitting the related transitions with linear functions (solid lines). The rising slopes of the fitting curves are not the same, which implies different production mechanisms of these species. These variations are in quite good agreement with the ones that were obtained in
Figure 5, where
IPeak and
Qmain grew also linearly with the voltage amplitude and other published works concerning identical [
16,
25] and different [
43] GIWs setups. This increase of
IPeak and
Qmain was attributed to the higher electrical energy delivered in the reactor at elevated voltage amplitudes. The electrons gain more energy inducing additional avalanches as compared with the ones at lower voltage amplitudes, which eventually lead to faster excitations/ionizations and enhanced species densities, both in the inter-electrode section and the gaseous channel. In
Figure 12 (lower frame), this is well confirmed, since amplified intensities of reactive emissive species are achieved with increasing
Vp. The chemical reactivity can be also tuned by varying either the duty cycle or the frequency of the pulsed voltage (not shown here), and this, for temperature values that are not harmful for the reactor mechanical components and the biological samples.
The above variations imply modifications on the electron temperature (
Te) in GIWs.
Te could be approximated (under LTE conditions) via the electron excitation temperature, obtained using the well-known Boltzmann-plot method from the emission intensities of different helium lines detected in the spectrum [
20,
46,
47,
48]. Its determination could support further the above statements. Unfortunately, it was not possible to calculate the excitation temperature (
Texc) in our experiments since the spectral response of the entire optical system was not known, and any deduced value would be obviously outlier. This was due to unavailability of any adequate equipment (calibrated light source and integrating sphere), which would allow the performance of radiometrically calibrated measurements. However, based on different published works [
20,
46,
47,
48], an estimation of
Texc can be made by comparing
Texc values measured for similar GIWs like the present one. For instance,
Texc was calculated by Walsh et al. [
46] for helium GIWs that were generated with a single-electrode linear-field reactor operating with RF voltage. It was found to be 0.99 eV, and it provided a rough estimation of the
Te in their case. Xiong et al. [
47] characterized by means of absolutely calibrated emission spectroscopy a coaxial-geometry helium GIW in contact with a metal plate, operating with μs-pulsed high voltage at 2 kHz.
Texc was found to be about 1.2 eV at 12 kV, while it increased with the voltage amplitude. Besides, the electron density (
ne), calculated via the Stark broadening of two emission lines (i.e., He at 447.1 and H
β at 486.1 nm), increased with the applied voltage and varied between ~10
14 (center of the discharge) and ~10
15 cm
−3 (edge of the discharge). In another example, Jõgi et al. [
20] investigated a helium linear-field “micro-plasma jet” that was generated within microtubes (diameter
Dtube: 80–500 μm) and biased by sinusoidal high voltage at 6 kHz. The calculated
Texc was ~0.23 eV for
Dtube = 80 μm and it decreased down to ~0.17 eV with increasing
Dtube. The same tendency versus
Dtube was recorded for n
e (measured via Stark broadening of H
β line at 486.1 nm), which was found to be ~10
14 cm
−3 for
Dtube = 500 μm. These
Texc values were in good agreement with the ones that were measured by Joh et al. [
48] for a helium/oxygen “APPJ” driven with μs-pulsed high voltage (1.8 kV/50 kHz). Finally, Chang et al. [
49] managed to measure
Te (1.87 eV) in a linear-field helium GIW that was driven with sinusoidal voltage (8.9 kV/17 kHz). For the calculation, they used the EEDF by combining the ions number balance with the gas temperature (320 K in their case). This value is very close to the one accurately measured by Sousa et al. [
50] via Thomson Scattering (up to 2 eV). The previous
Texc values differ between them, which could be attributed to the strong deviation of the atomic state distribution function from thermodynamic equilibrium in GIWs [
20]. Also, the different geometries, operating conditions, and the presence of targets (conductive/insulating/floating potential) could play a certain role on the value of
Texc [
50]. Since the present GIWs device presents lots of similarities with the previous ones (geometry, operation at atmospheric pressure, voltage/frequency, operating gas, etc.) it is expected that
Texc lies in the range of the abovementioned values. On the other hand, it is assumed that
Te is not far from the one measured by Chang et al. [
49] since the gas temperature (
Tgas) in our case is found to be 344 K (value taken for
Vp = 8 kV,
d = 2% and
f = 10 kHz, see
Figure 13 for details) and the setups are similar.
The important modifications of the dielectric tube temperature, which were demonstrated in the previous sections (see
Figure 7 and
Figure 10), are characteristic of the changes on the gas temperature (
Tgas) during the operation of GIWs. In typical GIWs experiments,
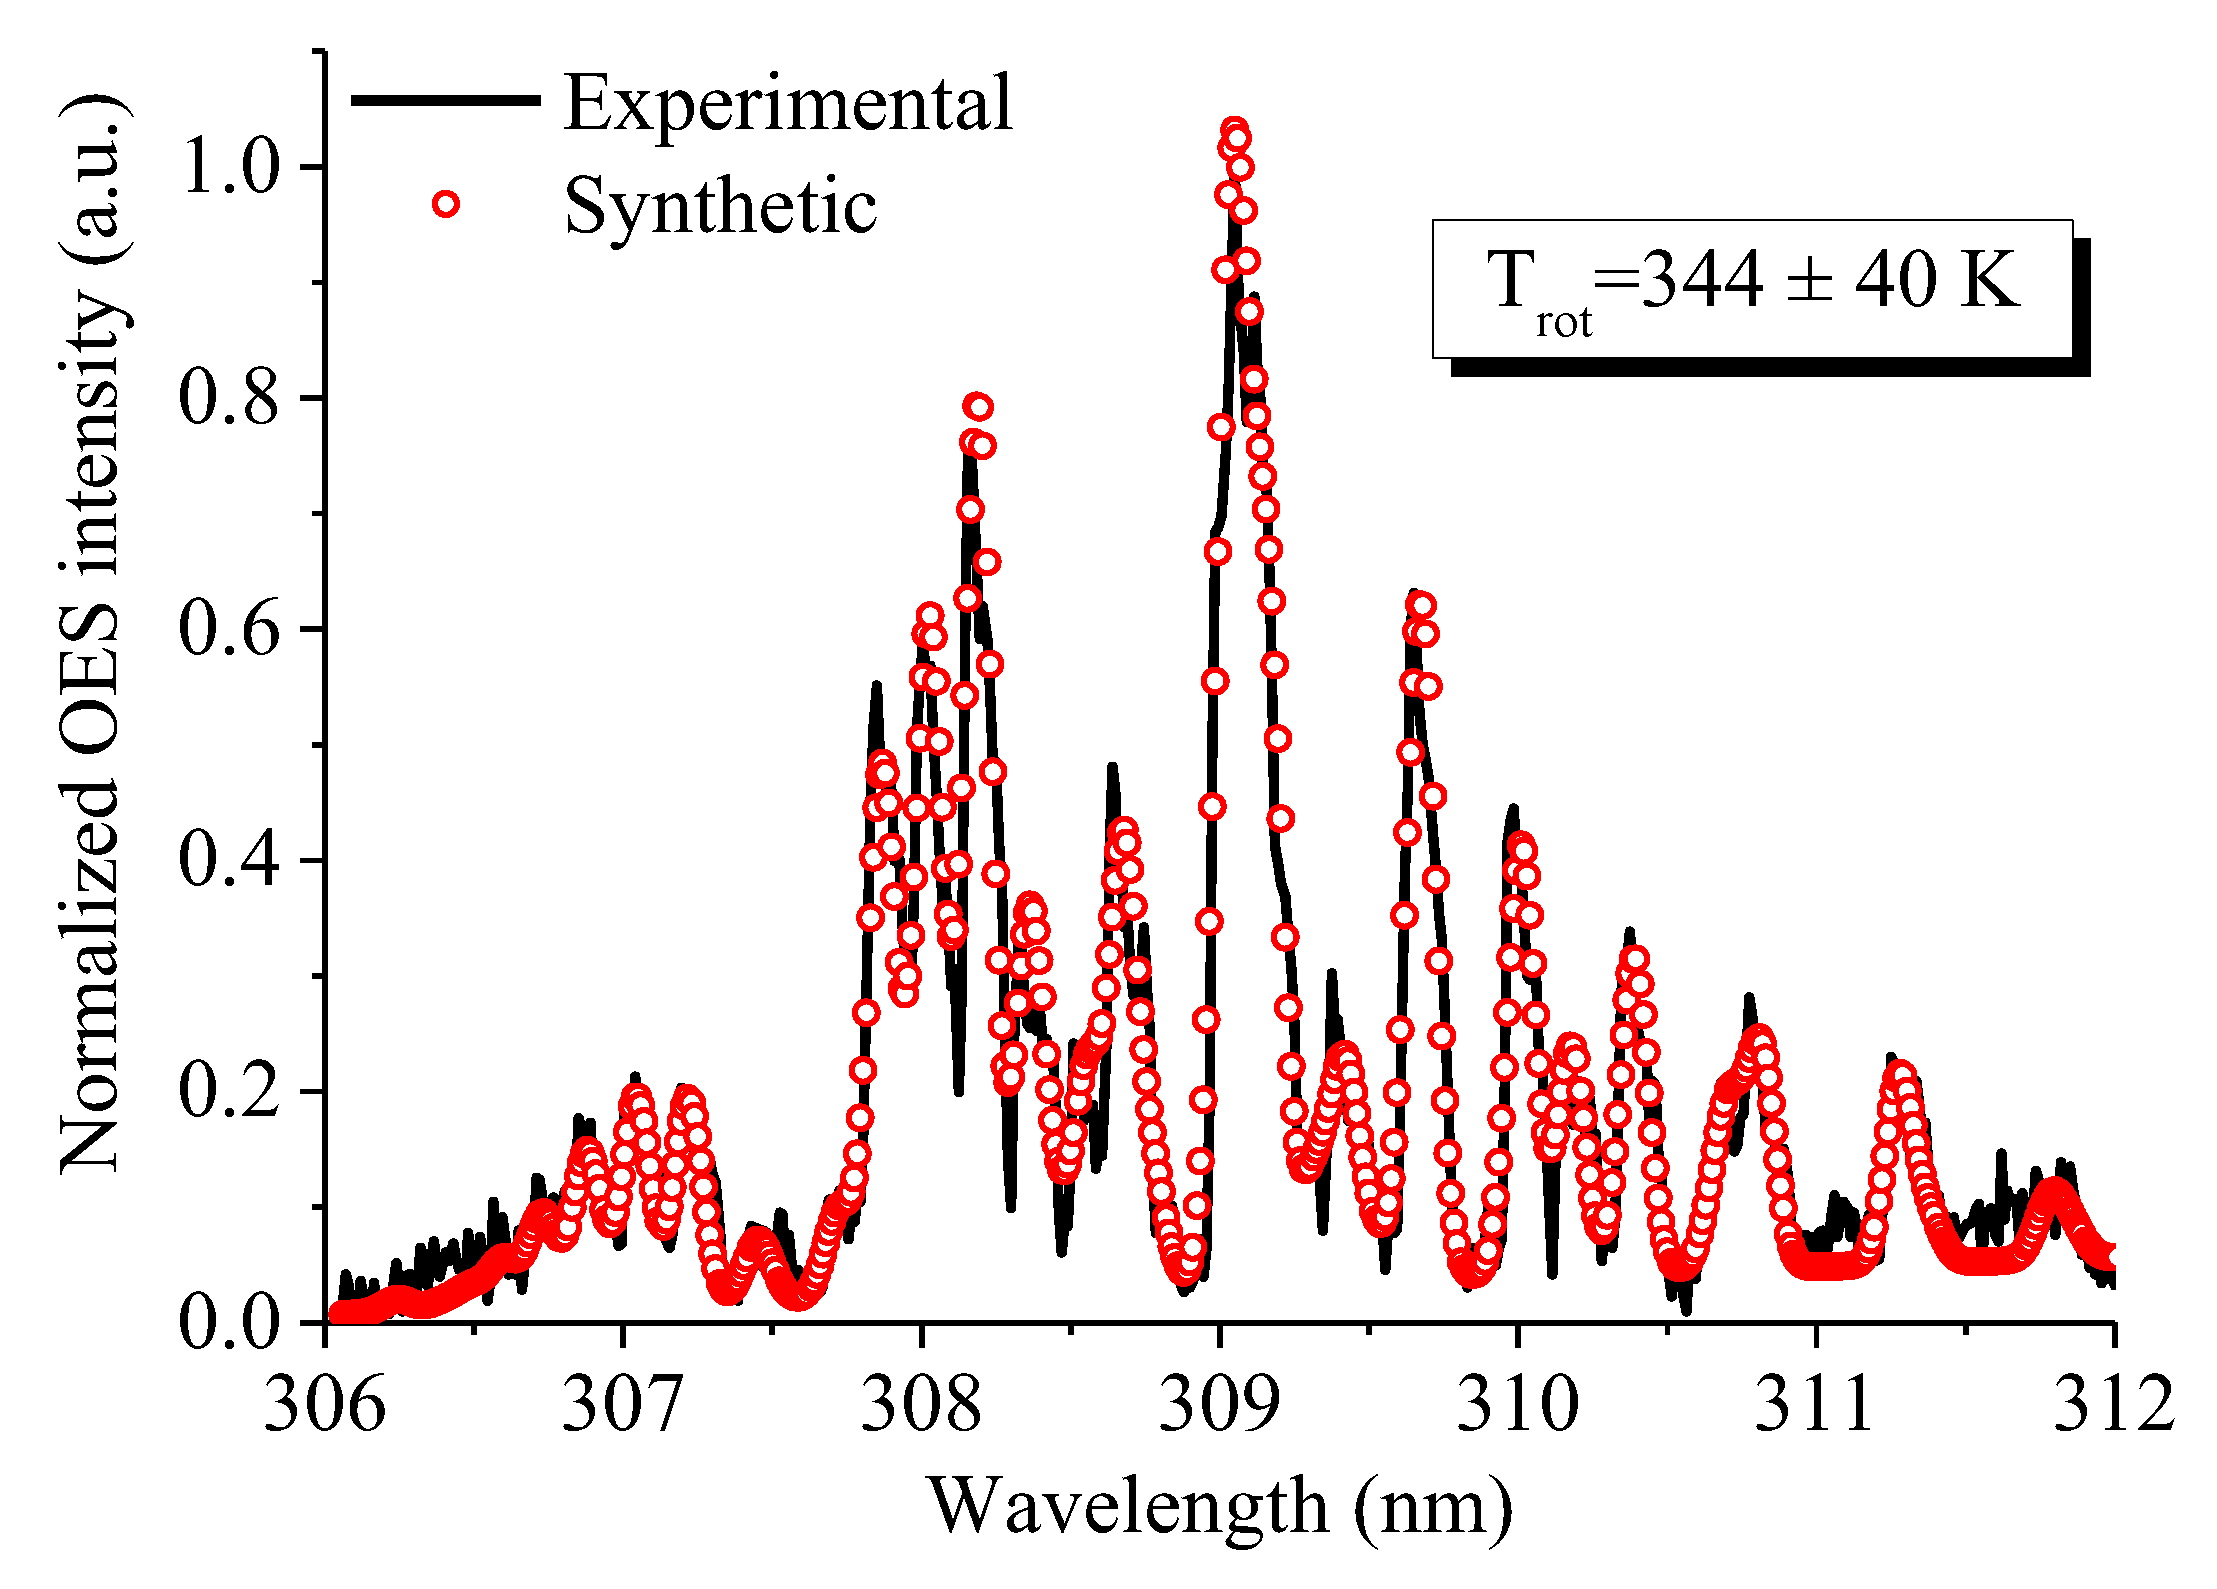
Tgas is usually estimated from the rotational temperature (
Trot) of probe molecules, such as the OH(
A) around 309 nm [
6,
15,
46,
47,
49]. In our case, OH(
A-X) emission was detected in the emission spectrum of GIWs (see
Figure 11). A representative experimental rotational structure of this molecule is given in
Figure 13 (black color), which was fitted with the corresponding synthetic rotational spectrum (red dots) that was produced with a home-made code [
6,
14,
15,
51].
Trot was obtained as the value giving the best fit between these two spectra based on the least squares method. The fitting gives
Trot =
Tgas = 344 K. The error on the measured value is estimated to be ±40 K [
14]. Any influence on the measured value due to the spectral response of the optical system is excluded, since the latter is expected to be nearly constant within such a small wavelength interval (6 nm). In
Figure 13,
Trot was measured for
Vp = 8 kV,
f = 10 kHz, and
d = 2%. When compared with
Tsat in
Figure 10 (at the same conditions), it is ~15 K higher. This could be possible due to heat dissipation in the tube walls during plasma operation. Besides that, the evolutions of the gas temperature were similar to the ones of
Tsat, validating the results of
Figure 7 and
Figure 10. Thus, special care should be taken for selecting adequate operating conditions of GIWs for biomedical applications and reactor proper functionality. Using the measured
Tgas from
Figure 13 and the electron density of the plasma, the ionization degree can be estimated under our experimental conditions, as it is shown below.
Concerning the electron density of GIWs that were generated with the present device, an approximation was made by our group using a modified version of the related DBD reactor (i.e., single-electrode linear-field geometry) [
32]. The device was operated in pure helium at 2 slm and driven with sinusoidal high voltage (20 kV p–p, 10 kHz). Measuring the amplitude of sharp current impulses (1 mA) superimposed on the capacitive current and using the propagation velocity of the GIWs (2.5 × 10
4 m s
−1) as the electron drift velocity in the well-now formula of the current density, n
e was found to be ~2.5 × 10
11 cm
−3. Of course, this is a rough estimation of
ne and it represents a lower limit as compared with the higher values measured using more accurate methods, like Thomson Scattering [
50]. Indeed, using TS technique in a helium pulsed GIW (like the present one), Sousa et al. [
50] measured electron density values of up to 2 × 10
13 cm
−3, which are lower than the ones listed in the previous paragraph and higher than the one estimated in our case. Adopting the (maximum) more-accurate value of Sousa et al. [
50], the ionization degree of the present GIW could be estimated via the Formula (3):
where
nN =
P/
kb ×
Tgas ≈ 2.133 × 10
19 cm
−3 is the number density of neutrals at atmospheric pressure and
Tgas = 344 K in our case (see
Figure 13). By simple numerical application in (1), α is found to be ~4.7 × 10
−7, which is typical for GIWs. The ions density is expected to be similar with the one of electrons. In any case, it is underlined that the accurate determination of the electron temperature/density, is out of the purpose of the present work, which aims to define adequate operational regimes for various applications controlling (especially) the poorly investigated thermal processes that are involved in GIWs.


