Numerical Simulation of an Aluminum Container including a Phase Change Material for Cooling Energy Storage

1
ENEA—Italian National Agency for New Technologies, Energy and Sustainable Economic Development, Portici Research Center, P.le E.Fermi, 1-80055 Portici (NA), Italy
2
Dipartimento di Ingegneria Industriale (DII)—Università di Napoli Federico II, P.le V. Tecchio, 80-80125 Napoli, Italy
*
Author to whom correspondence should be addressed.
Appl. Syst. Innov. 2018, 1(3), 34; https://doi.org/10.3390/asi1030034
Submission received: 9 August 2018
/
Revised: 19 August 2018
/
Accepted: 24 August 2018
/
Published: 4 September 2018
(This article belongs to the Special Issue Solar Thermal Systems)
Abstract
:Thermal energy storage systems can be determinant for an effective use of solar energy, as they allow to decouple the thermal energy production by the solar source from thermal loads, and thus allowing solar energy to be exploited also during nighttime and cloudy periods. The current study deals with the modelling and simulation of a cooling thermal energy storage unit consisting of an aluminum container partially filled with a phase change material (PCM). Two unsteady models are implemented and discussed, namely a conduction-based model and a conduction-convection-based one. The equations systems relative to both the models are solved by means of the Comsol Multiphysics finite element solver, and results are presented in terms of temporal variation of temperature in different points inside the PCM, of the volume average liquid fraction, and of the cooling energy stored and released through the aluminum container external surface during the charge and discharge, respectively. Moreover, the numerical results obtained by the implementation of the above different models are compared with experimental ones obtained with a climatic chamber. The comparison between numerical and experimental results indicate that, for the considered cooling energy storage unit, free convection plays a crucial role in the heat transfer inside the liquid PCM and cannot be neglected.
1. Introduction
A properly designed thermal energy storage system can improve the exploitation and profitability of many renewable and conventional energy sources. For instance, in solar thermal systems, thermal storage can allow to overcome the mismatch between supply and demand. In conventional natural gas-fueled cogeneration systems, thermal storage can be used to produce electricity when it is more economically convenient, namely for self-consumption or when the selling price is high, without wasting thermal energy, which is instead accumulated for a later use. As concerns the storage materials, water is the most used, mainly because water has a high specific heat, is not toxic, and has practically no cost. However, in the last years phase change materials (PCMs) used as thermal energy storage materials have attracted great attention, essentially because, in general, they are characterized by high thermal energy storage densities, and permit to store thermal energy in a narrow temperature range.
Many works have addressed the use of PCMs for storing thermal energy from the solar source for various applications, ranging from solar water heating to solar cooling by absorption or adsorption refrigeration systems [1,2,3,4,5,6]. Charvát et al. [7] analyzed the use of a paraffin-based PCM as thermal energy storage material in a solar air-based thermal system. Kabeel at al. [8] investigated the effects of the presence of a paraffin wax in the bottom plate of a solar still for water desalination. Allouhi et al. [9] performed numerical simulations to characterize the melting and solidification processes of a PCM integrated in a solar collector. Zhao et al. [10] developed a control strategy and implemented different models to simulate different operation modes of a solar heating system, including a PCM-based storage tank, over the entire heating season. Moreover, many applications of PCMs have considered cold thermal energy storage [11]. Aljehani et al. [12] simulated a phase change composite consisting of a paraffin wax and expanded graphite for cold thermal energy storage in air conditioning applications. They also performed an experimental validation of numerical results. Bejarano et al. [13] modeled and simulated a novel cold energy storage system based on PCMs. Cheng and Zhai [14] modeled and simulated a cold thermal energy storage system consisting of a packed bed with multiple PCMs. In this work, an experimental validation of numerical results is also reported.
Various models have been developed for the numerical simulation of PCM-based thermal energy storage systems, most of which have been reported in reviews [15,16,17]. Farid et al. [18] successfully applied the effective heat capacity (EHC) method for simulating 2D heat transfer with phase change. Lacroix [19] developed a model to simulate a shell-and-tube thermal energy storage unit with the PCM on the shell side. Ng et al. [20] employed the finite element method to simulate the convection-dominated melting of a PCM in a cylindrical-horizontal annulus. Lamberg et al. [21] implemented both the effective heat capacity method and the enthalpy method to simulate the melting and solidification processes of a PCM. They also compared the numerical results, which were obtained using the FEMLAB solver, with experimental ones. Esapuor et al. [22] implemented the enthalpy method to perform 3D simulations of a PCM in multi-tube heat exchanger units. Allouche et al. [23] developed and validated a computational fluid-dynamic (CFD) model for the numerical simulation of a PCM slurry in a horizontal tank. Niyas et al. [24] developed a numerical tool to simulate a lab-scale PCM-based shell-and-tube thermal energy storage system by employing the EHC method. Neumann et al. [25] proposed and validated a simplified modelling approach for the numerical simulation of PCM-based fin-and-tube heat exchangers. Li et al. [26] proposed a numerical model to simulate the heat transfer inside an open-cell metallic foam filled PCM.
The current study focuses on the simulation of an aluminum container partially filled with a phase change material. A conduction-based model and a conduction-convection-based one are implemented for the purpose, and numerical results are compared with experimental ones obtained with a climatic chamber. The main contribution of this manuscript is that it presents an experimental validation of two different modelling approaches implemented to simulate the cooling energy charge and discharge of a real PCM-based cooling energy storage unit.
The description of the experimental apparatus and experimental results are presented in Section 2. The balance equations systems relative to both the models are detailed in Section 3. The numerical results and the comparison with experimental ones are discussed in Section 4, and the main conclusions are reported in Section 5.
2. Experimental Apparatus and Results
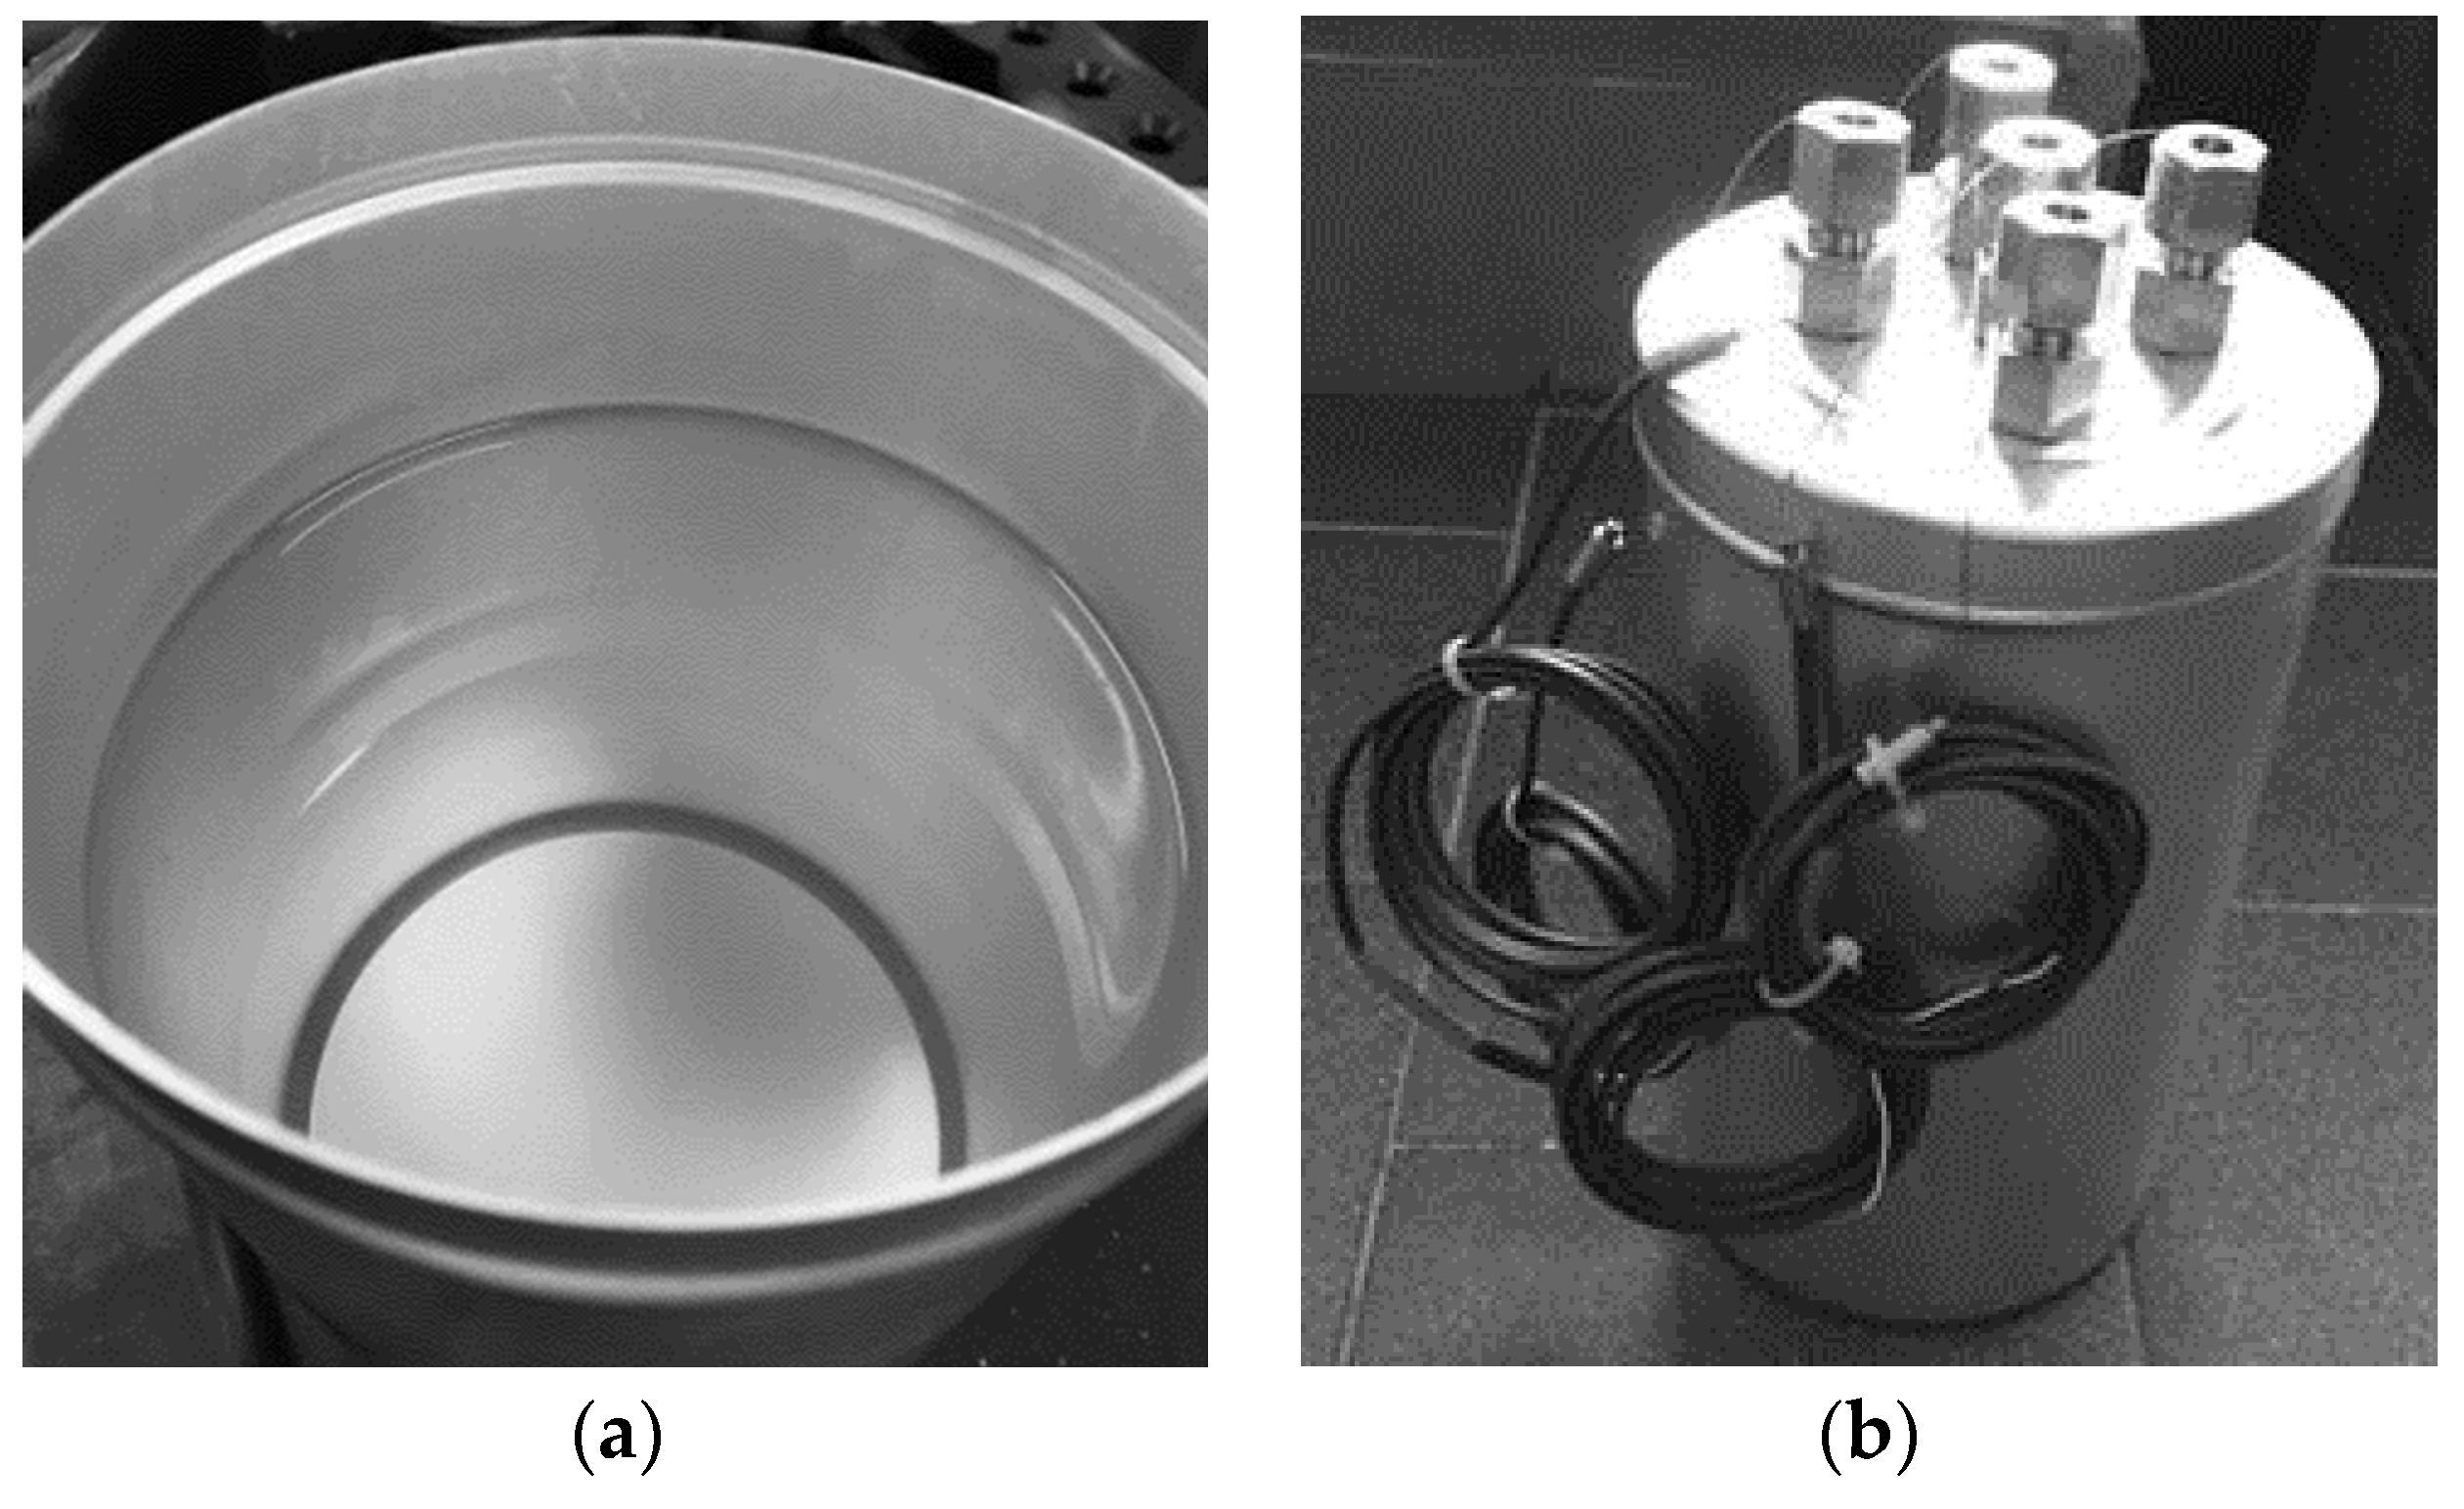
Figure 1 shows the aluminum cylindrical container used in the experimental test. Its height is 25.0 cm and internal radius is 6.9 cm. Furthermore, it is partially filled with 2.4 kg of a commercial bio-based phase change material, whose characteristics are shown in Table 1.
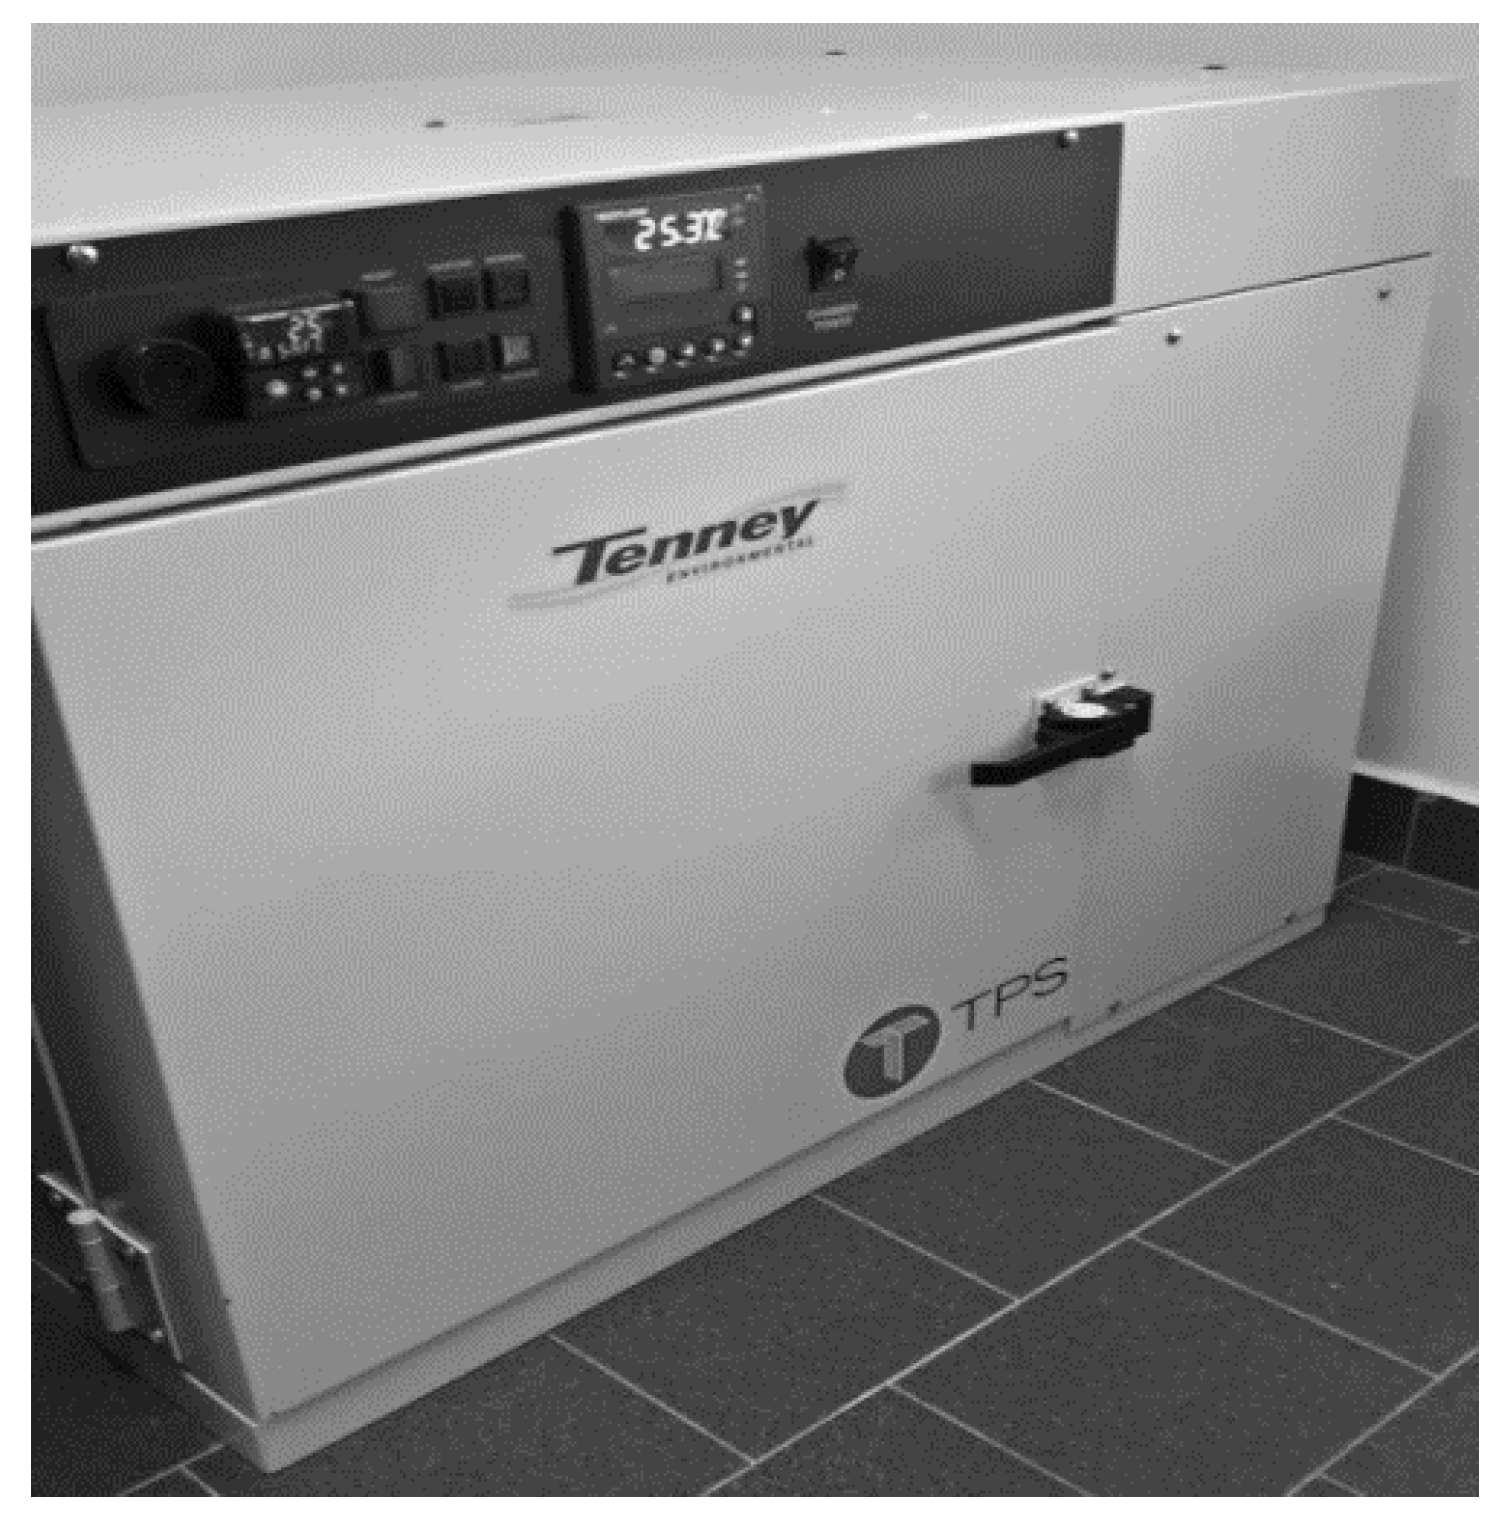
Temperature measurements inside the phase change material are all done on the same horizontal section, at a distance of 9 cm from the container bottom, by five T-type thermocouples of class 1. One measuring point is located on the container axis, while the other four points are located at a distance of 3.45 cm from the axis. These are arranged to form a cross as shown in Figure 1b. Temperature data acquisition is done with a sample time of 1 s, by means the of the National Instruments NI 9213 module, using the NI cRIO 9066 controller. Figure 2 shows the climatic chamber used to realize the experimental test.
The container is put in the climatic chamber on a 2-cm thick rigid sheet of polyurethane foam for the thermal insulation of the container bottom side, with all the PCM in the liquid state, and at a uniform temperature equal to 23.8 °C (room temperature). Then, the following four steps are applied sequentially:
- one-hour temperature ramp is applied to bring the internal temperature of the climatic chamber to the cooling energy charge temperature Tc = 7 °C;
- the climatic chamber internal temperature is kept at Tc for 72 h;
- one-hour temperature ramp is applied to bring the internal temperature of the climatic chamber to the cooling energy discharge temperature Td = 23 °C;
- the temperature inside the climatic chamber is kept at Td until all the measured temperatures inside the PCM are well above the phase change temperature (15 °C).
As it can be argued, the main contributions to the cooling energy charge and discharge are represented by steps 2 and 4, respectively. Nonetheless, in the numerical simulation of the PCM thermal behavior, steps 1 and 3 are also simulated.
Experimental Results
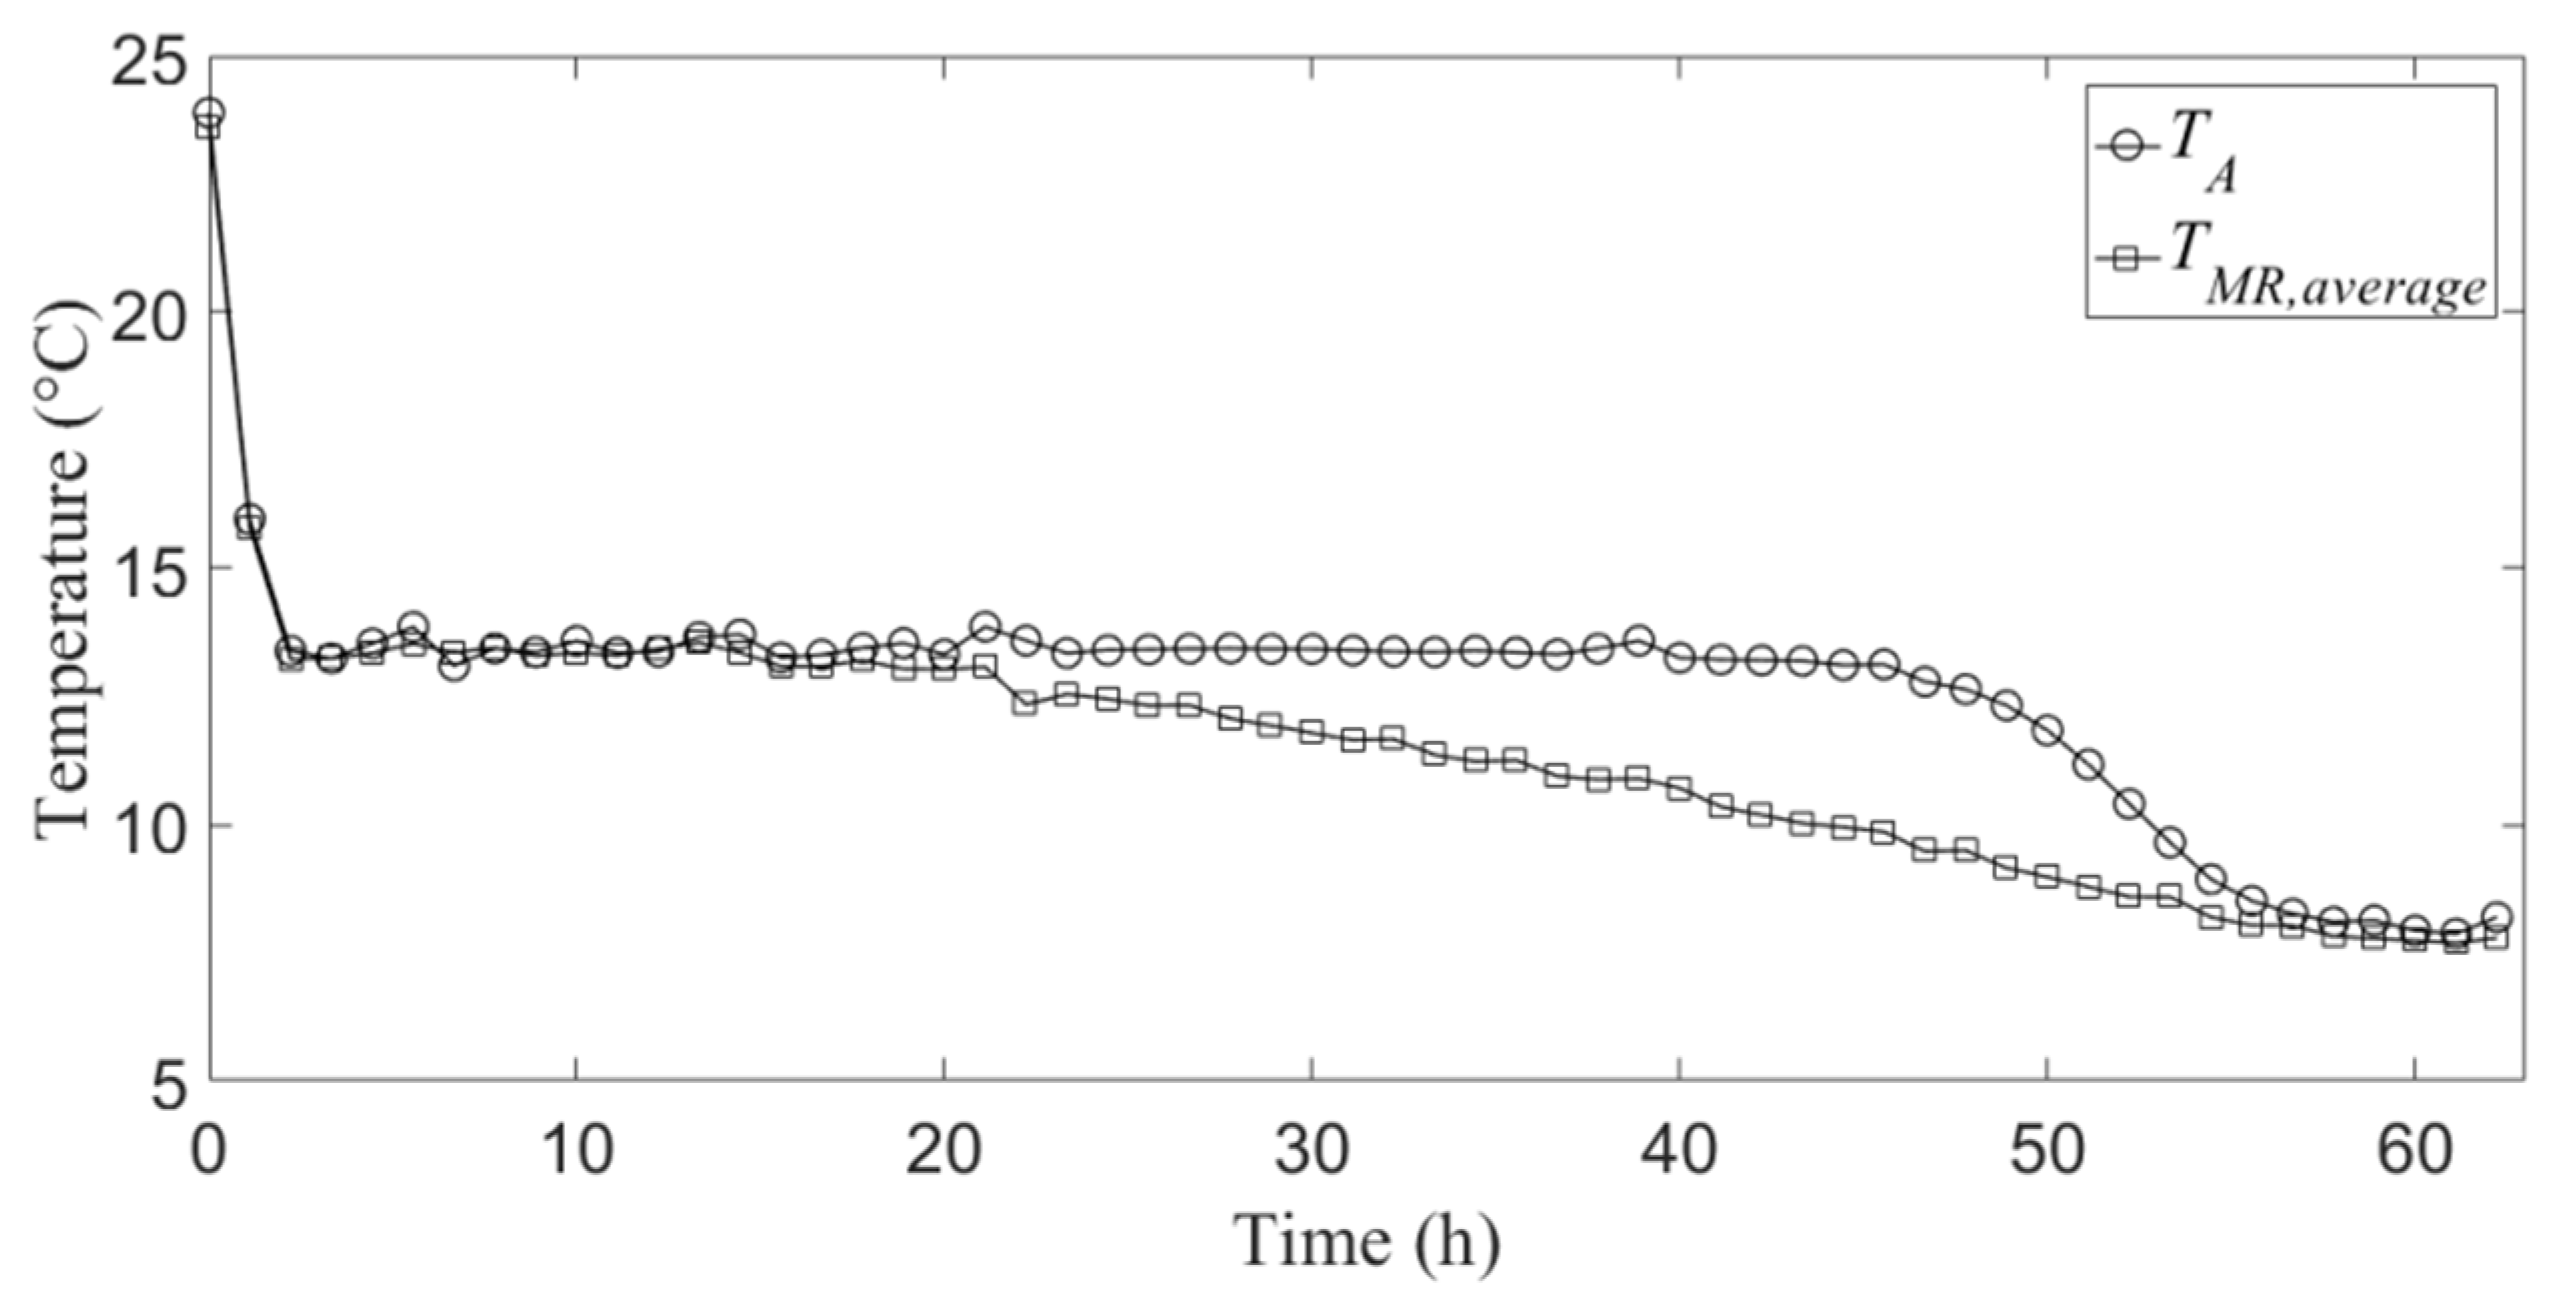
Figure 3 and Figure 4 show the temporal profile of the temperature relative to the measuring point on the container axis, which is indicated with TA, and the temporal profile of the average of the temperatures relative to the mid-radius measuring points, which is indicated with TMR,average, during the cooling energy charge and discharge, respectively.
It can be noticed that, as expected, the charge phase is much slower than the discharge one. This is due to the formation of solid PCM on the internal wall of the aluminum container during the cooling energy charge, which acts as a thermal insulation layer for the heat transfer between the liquid PCM and the external cooled air (internal environment of the climatic chamber). Conversely, during the discharge phase, the convective mechanisms inside the liquid PCM, which forms on the internal wall of the container, accelerate the heat transfer towards the internal solid PCM. Moreover, Figure 3 shows that the effective solidification temperature is slightly lower than 15 °C, namely the one given by the PCM manufacturer reported in Table 1.
3. Simulation Models
The axial symmetry of the PCM container and of the boundary conditions permits to implement 2D axisymmetric models, and thus to obtain a relatively low computational cost of numerical simulations. Therefore, two unsteady 2D axisymmetric numerical models are developed for simulating the cooling energy charge and discharge of the phase change material: a conduction-based model and a conduction–convection-based model.
3.1. Conduction-Based Model
This model is based on the following main assumptions: (i) the phase change material is homogenous and isotropic; (ii) the thermo-physical properties of the phase change material are considered to be constant and equal to the average values between the liquid and solid phases; (iii) the volume expansion/reduction during phase change is ignored; (vi) phase change during solidification/melting occurs in a temperature range; (v) negligible convective mechanisms. The energy balance equation is given by:
where T is the temperature, t is the time variable, ρPCM is the density of the PCM, and kPCM is the PCM thermal conductivity.
The phase change is simulated by means of the effective heat capacity method (EHC). According to EHC, the material effective heat capacity c’p,PCM is expressed as a function of the latent heat of fusion of the PCM Lh as follows:
where cp,PCM is the average PCM specific heat, and φ(T) is a non-dimensional parameter, which is 0 in the solid phase, 1 in the liquid phase and between 0 and 1 in the transition zone. The latter can be expressed as:
where TM is the melting temperature, and ΔTM is half the temperature phase change range that goes from (TM − ΔTM) to (TM + ΔTM).
3.2. Conduction-Convection-Based Model
In this case, two further assumptions are made as concerns the modelling of the liquid PCM flow, namely that liquid PCM is Newtonian and the flow is laminar. The continuity, momentum and energy balance equations are written as follows:
where p is the pressure, μ′PCM is the modified dynamic viscosity, and is the velocity vector.
In Equation (5), represents the Boussinesq approximation, which is added to the momentum equation for including the buoyancy effects, and it is evaluated according to Equation (7):
where and β are the gravitational acceleration and the isobaric thermal expansion coefficient, respectively.
The effective heat capacity c′p,PCM is calculated as previously described in Section 3.1, while the modified dynamic viscosity μ’PCM is evaluated according to Equation (8), in order to force zero velocity in the solid PCM.
where μPCM is the dynamic viscosity of liquid PCM. The variable S is given by:
In Equation (9), the constant δ, typically fixed to 10-3, serves to prevent null denominator, while the constant C affects the PCM flow into the phase transition zone, and it is usually between 103 and 1010. Table 2 reports the values of the parameters TM, ΔTM and C used in this work. This combination of values, which were chosen among different tested ones, is the one presenting the best match between experimental and numerical results.
3.3. Initial and Boundary Conditions
The simulations of cooling energy charge and discharge of the PCM are performed separately. With reference to the experimental test described in Section 2, as regards the implementation of the conduction-based model, the PCM initial temperature for the charge simulation is fixed equal to the temperature measured at the start-up experimental test, while, for the discharge simulation, the PCM initial temperature is fixed equal to the measured temperature at the start-up of step 3. The boundary conditions are set according to the experimental test. In particular, the bottom and top surfaces of the cylindrical computational domain relative to the PCM are considered to be adiabatic, while the boundary condition relative to the lateral surface is set according to Equation (10):
where ql is the heat flux relative to the lateral surface, hl is the heat transfer coefficient relative to the lateral surface, T∞ is equal to the air temperature inside the climatic chamber, and r and z are the radial and axial coordinates, respectively. The convective heat transfer coefficient hl is fixed to 30.2 W/(m2 K) in the cooling energy charge, and to 29.1 W/(m2 K) in the discharge. These values of hl were calculated by means of a correlation for cylinders subjected to transverse external forced flow [27], and were obtained using a measured average air velocity inside the climatic chamber of 3.3 m/s.
The above conditions are also applied for the implementation of the conduction–convection-based model. In this case, the initial velocity is set to zero in both charge and discharge, while a no-slip wall boundary condition is applied to all the external surfaces of the computational domain delimiting the phase change material.
3.4. Numerical Solver
For both the implemented models, the governing equations are solved with the finite element simulation software COMSOL Multiphysics 5.3a. The non-linearities are resolved through a segregated approach. The backward differentiation formula is adopted for the time stepping, with the initial time step fixed to 10−4 s and no-fixed maximum time step. Since the PCM volume variations during phase changes are not simulated for both the models, the the 2D computational domain, evaluated by means of the PCM weight and average density, remains fixed. It consists of a rectangle with a height of 17.73 cm and a width of 6.90 cm. Physics-controlled meshes are used, and for both developed model grid independence of results is assured. The simulations are performed with a Dell Precision T7610 workstation, equipped with two Intel Xeon E5-2687 w2 processors and a RAM of 64 GB and 1866-MHz clock.
4. Results
Figure 5 shows a comparison between the temporal variation of experimental temperatures inside the PCM, relative to the measuring points indicated in Section 2, and the corresponding numerical temperatures during the cooling energy charge. It can be seen that there is a good agreement between the numerical temperatures relative to the conduction–convection-based model and the experimental temperatures, while the temperature profiles resulting from the implementation of the conduction-based model fail to match the experimental ones during the first and last parts of the charging process. This is essentially because the conduction-based model does not permit to simulate the mixing of liquid PCM inside the aluminum container in the initial part of the cooling energy charge. Thus, the resulting temperature profiles present a slower decrease. Of course, this behavior at the initial part of the charge influences the entire charge process simulated by the conduction-based model. Indeed, in the last part of charge, the simulated temperature TA,cond presents a sensible deviation from the corresponding experimental temperature.
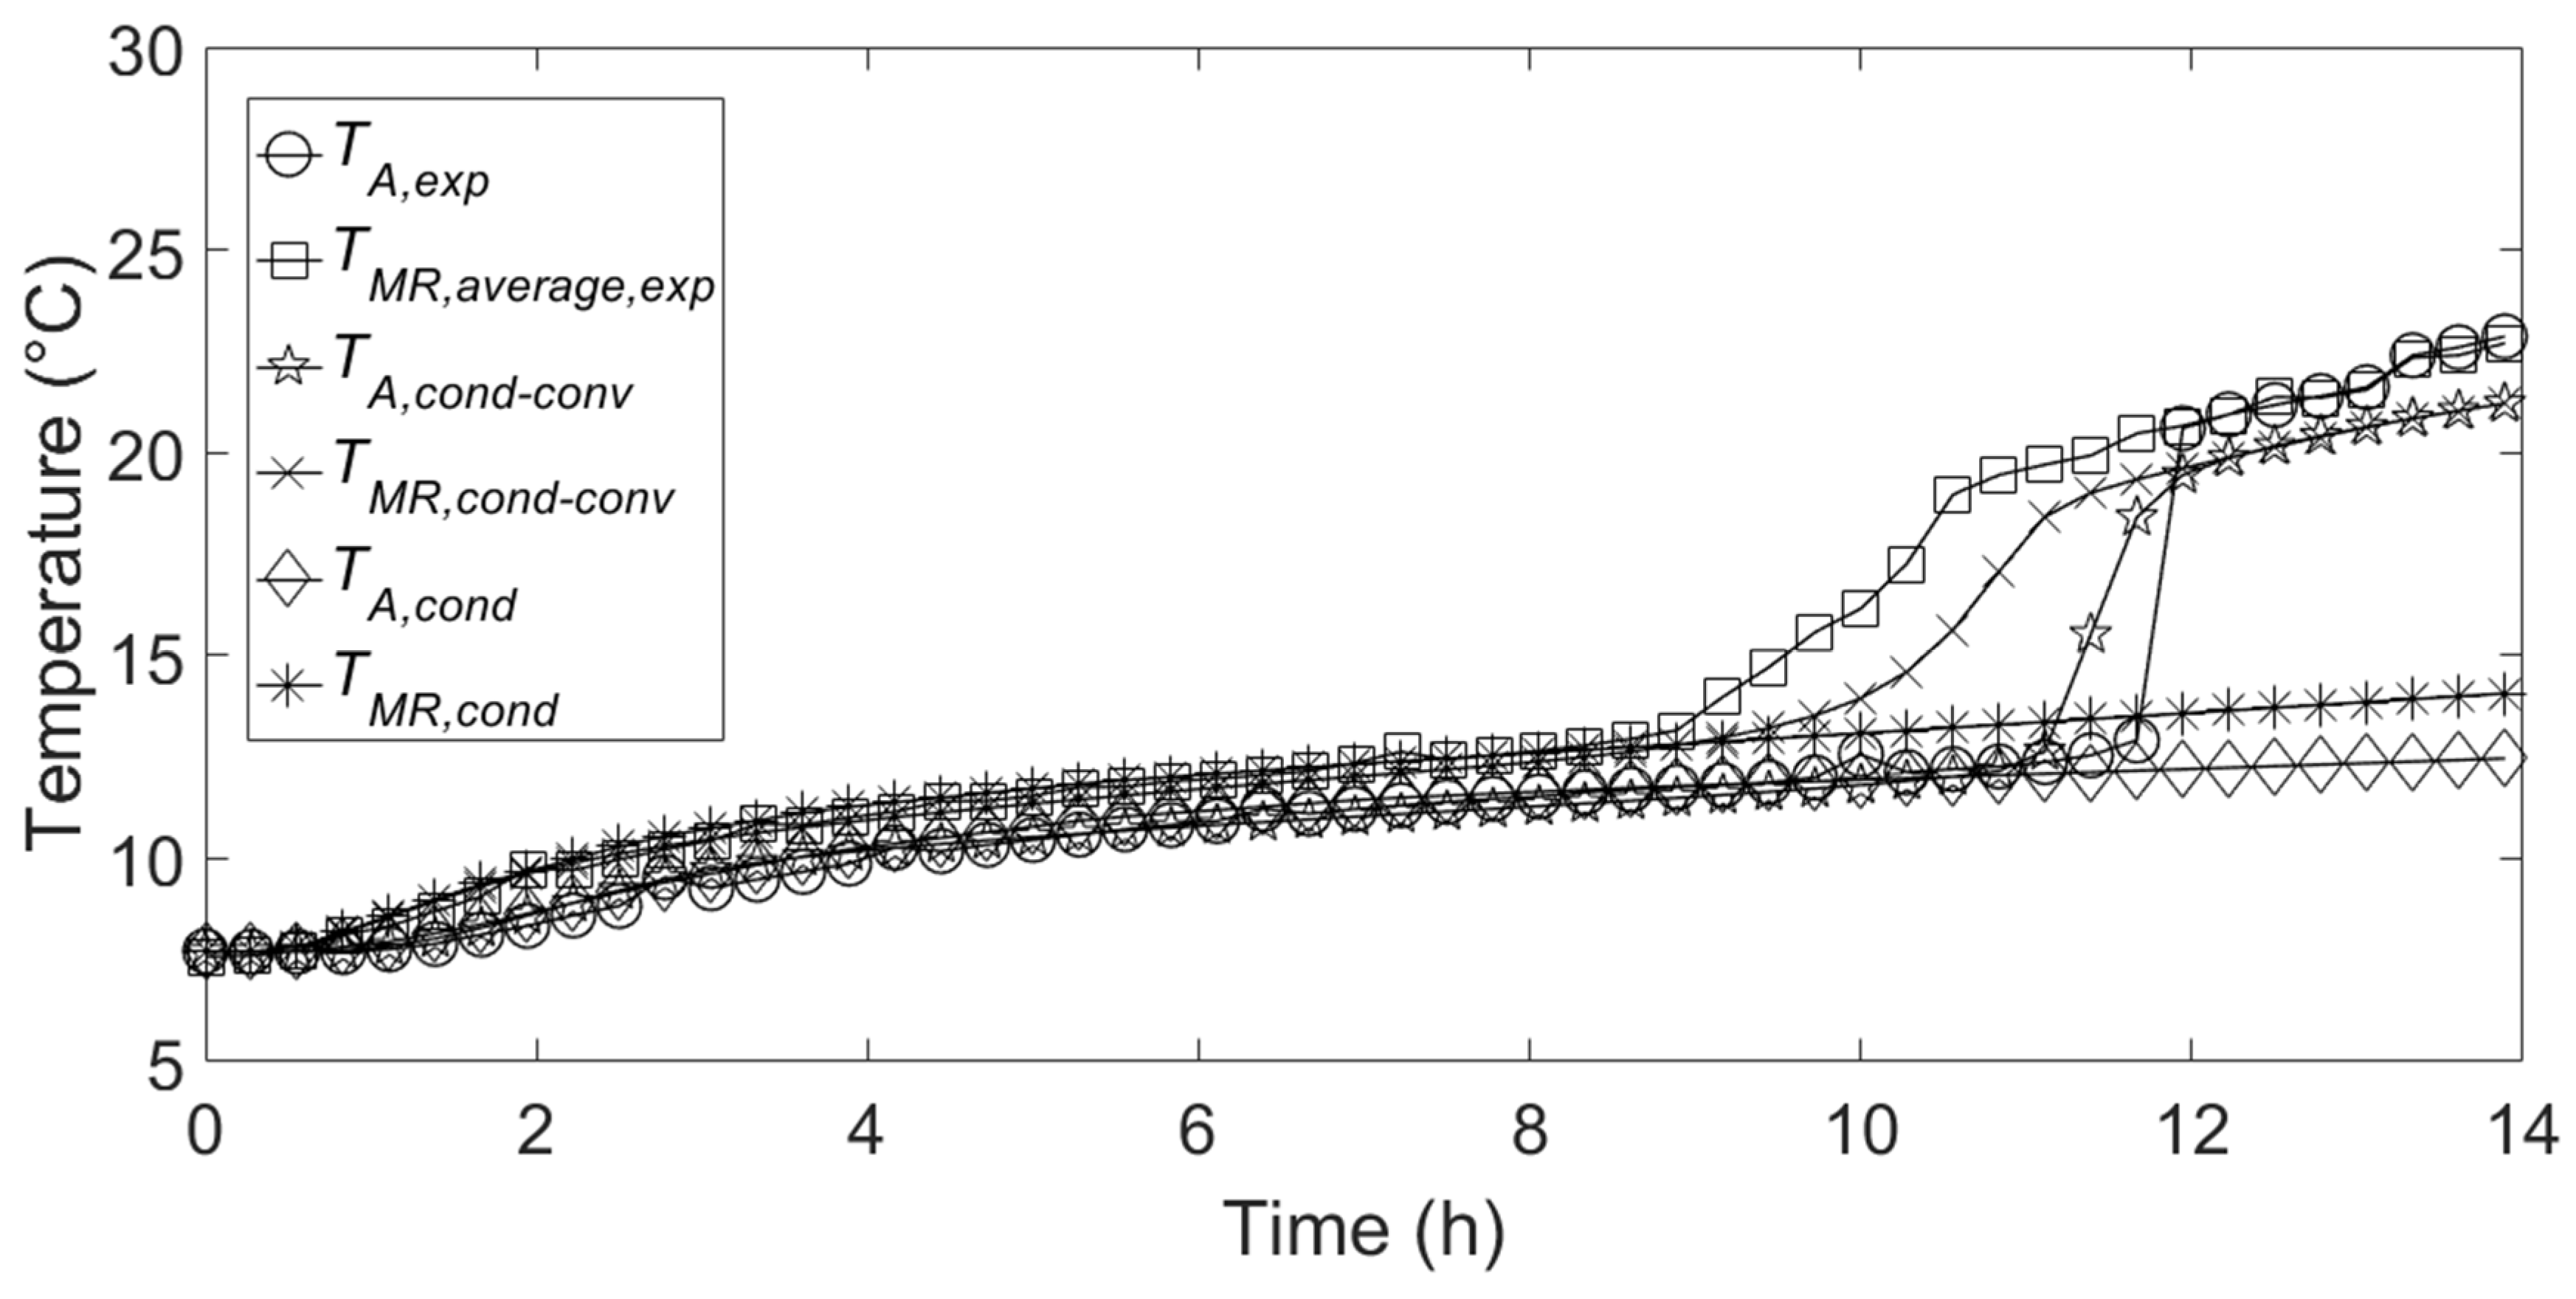
Figure 6 shows the comparison between the temporal variation of experimental and numerical temperatures inside the PCM relative to the cooling energy discharge. It can be seen that, in the initial part of discharge, the simulated temperatures relative to both the implemented models are are in good agreement with the experimental ones. This is because conduction heat transfer is the dominant heat transfer mechanism in the first part of discharge, when great part of the PCM is in the solid state, and the melted PCM is limited in a narrow layer close to the container internal wall. Heat transfer by free convection inside the PCM becomes higher as the melted layer thickness increases. Indeed, Figure 6 shows that, in the last part of discharge, the temperature profiles relative to the conduction-based model are very far from the experimental ones, differently from the ones relative to the conduction-convection-based model which present a better behavior in the last part of discharge.
From the above, it can be stated that the conduction-based model is not suitable for the present application. For this reason, only the main results obtained with conduction-convection-based model are reported and discussed in the following.
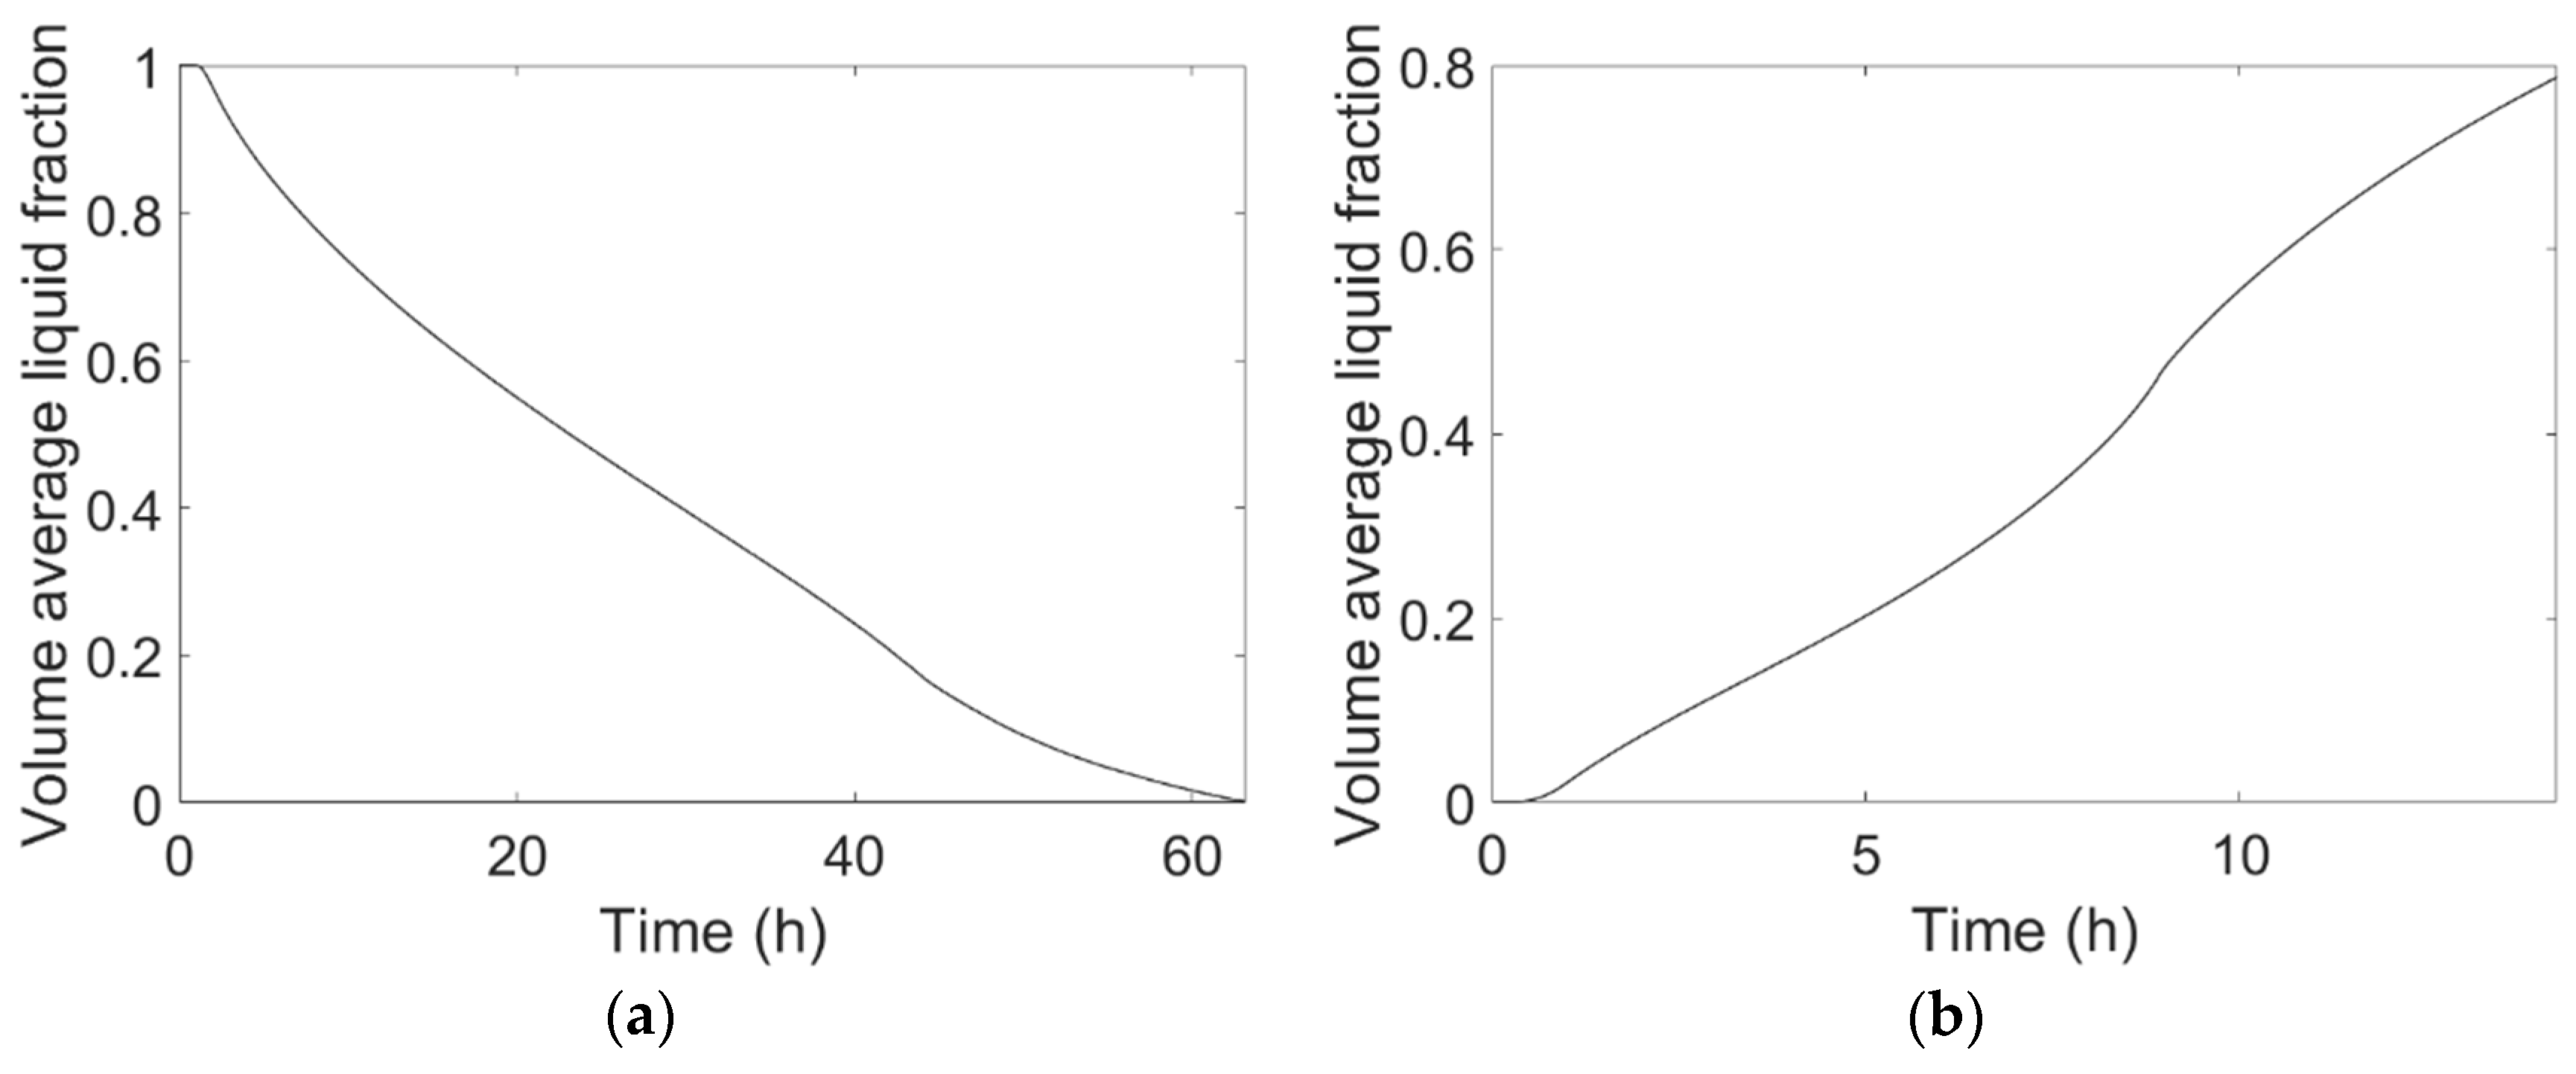
Figure 7a,b shows the temporal variation of the average liquid fraction of PCM volume during cooling energy charge and discharge, respectively, obtained by the conduction–convection-based model. Figure 7a clearly shows that the PCM solidification rate is relatively high in the first part of the charge, before it slows down as the thickness of the solid layer at the container wall increases. Indeed, from the beginning of step 1, PCM volume average liquid fraction reaches 0.5 after 23 hours, whereas the complete solidification of PCM is reached after about 63 hours. Conversely, Figure 7b shows that, during the cooling energy discharge, the melting rate is initially relatively low, before it becomes higher as the melted fraction increases, or, in other words, as heat transfer by free convection inside the PCM becomes higher. In Figure 7b, it can be noted that free convection becomes decisive from the seventh hour, and also that the PCM is not completely melted at the end of the discharge simulation. This last result is not in contrast with the experimental observations, since actually the PCM was not completely melted at the end of the experimental test. However, the real liquid fraction at the end of the experimental test was not measured, and probably it was higher than the simulated one obtained with the conduction-convection-based model, since the model underestimates the temperatures at the end of the discharge process, as it is be seen in Figure 6.
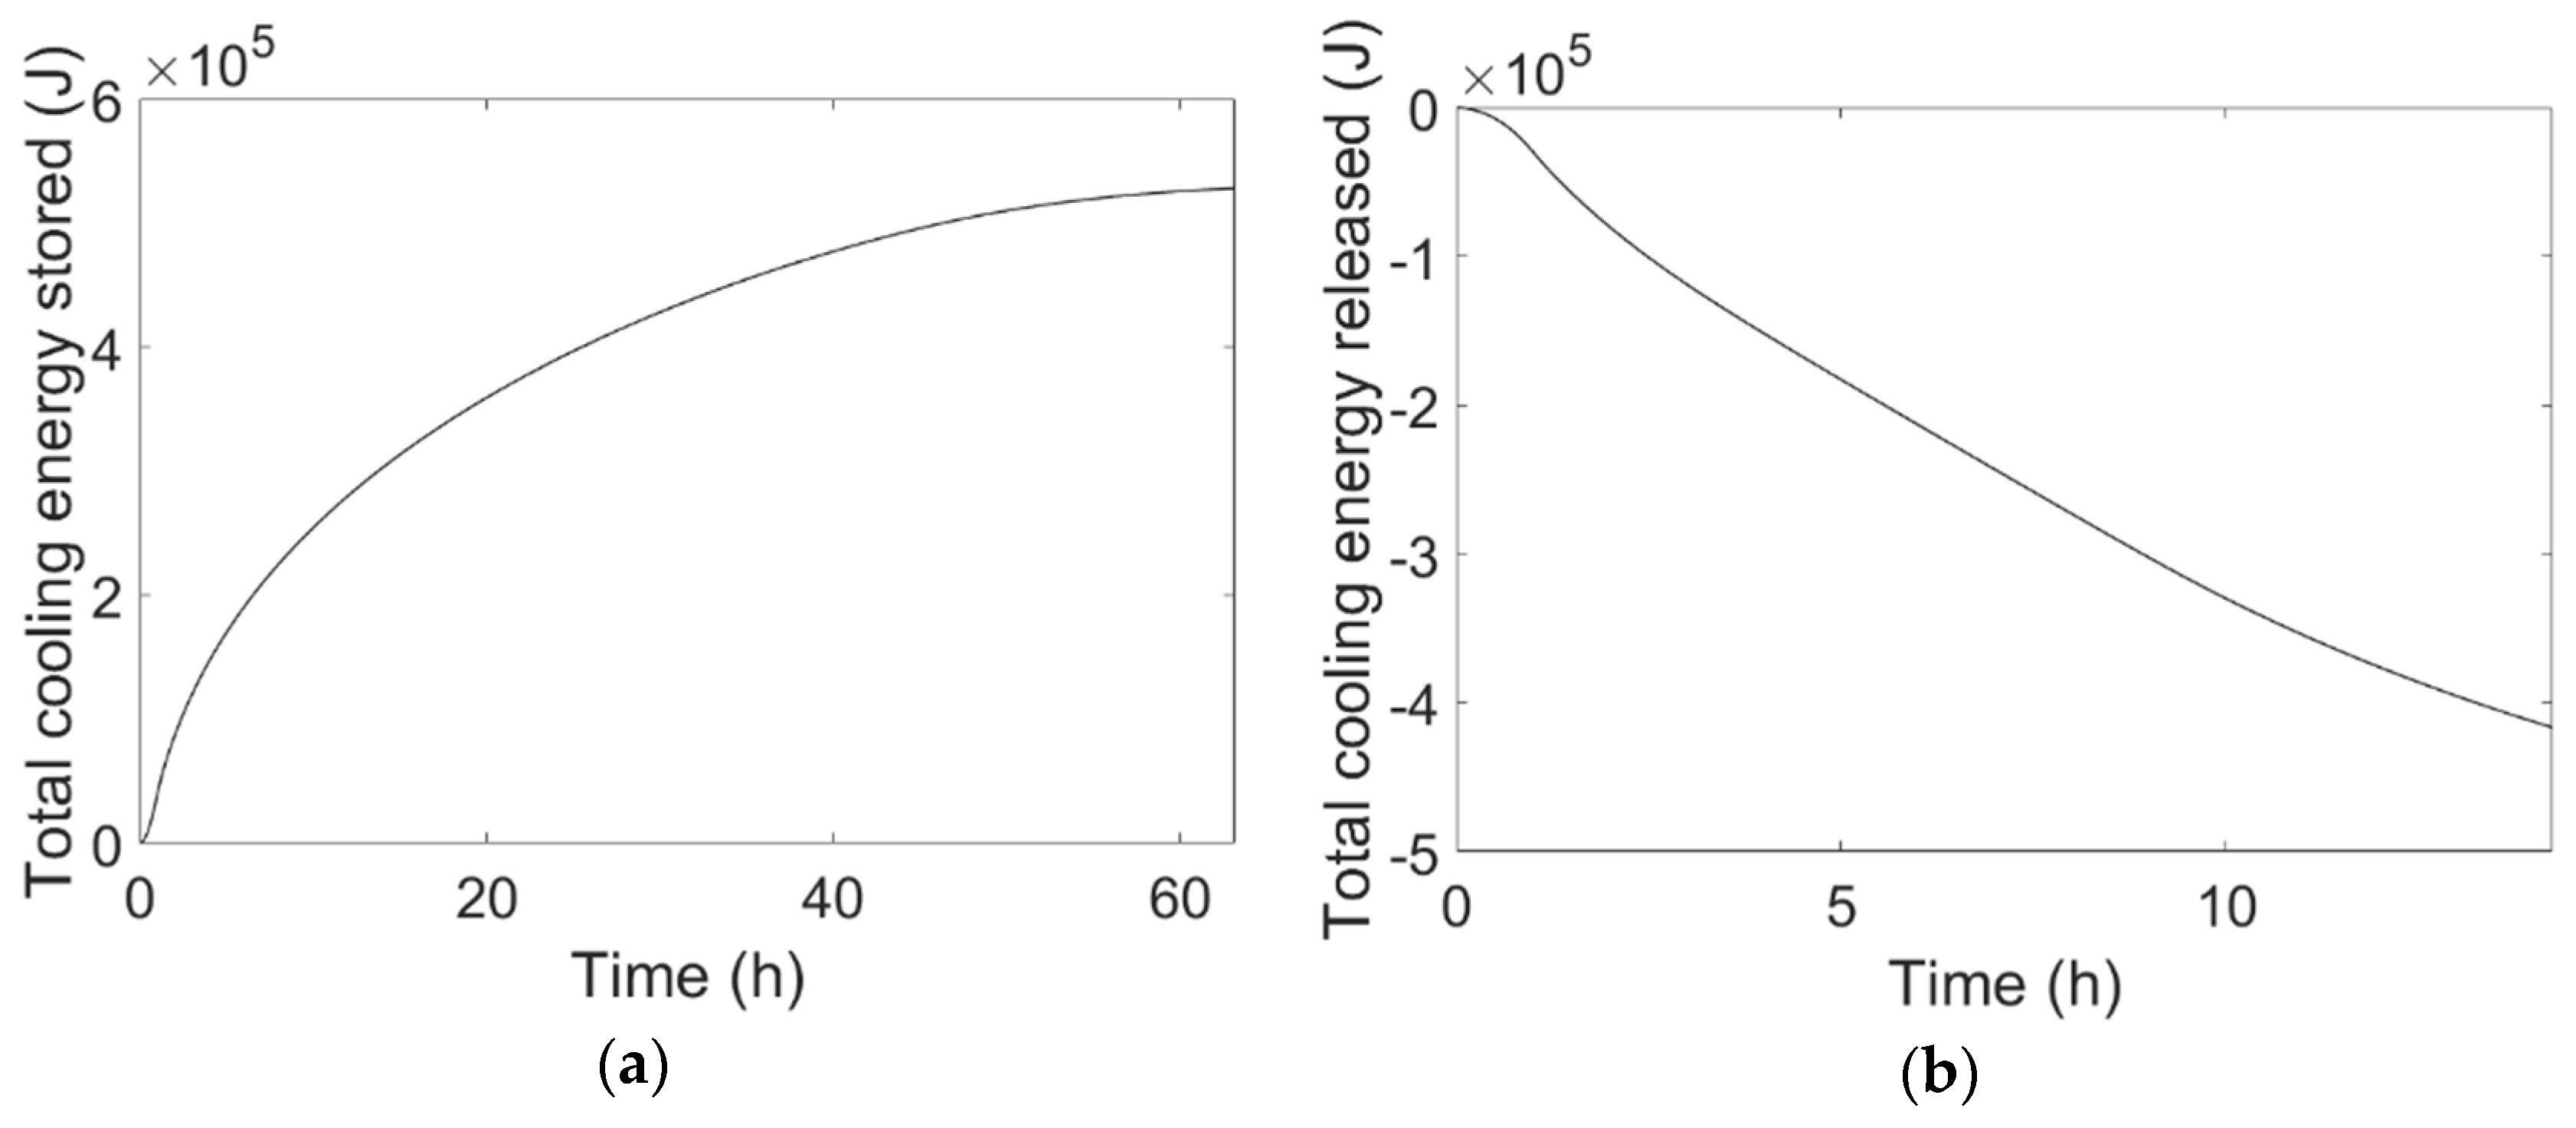
Similar considerations as those made for Figure 7a,b can be made for Figure 8a,b, which report the temporal variation of total cooling energy stored by the PCM during cooling energy charge and released during discharge, respectively.
Finally, Table 3 reports the sensible and latent contributions of the total cooling energy stored and discharged at the end of charge and discharge, respectively.
5. Conclusions
In the present work, two different unsteady models are implemented in order to simulate the cooling energy charge and discharge of a cooling thermal energy storage unit consisting of an aluminum container partially filled with a phase change material: a conduction-based model and a conduction-convection-based one. The numerical results obtained by the implementation of the above different models are compared with experimental ones obtained with a climatic chamber. The main conclusions of the present work, argued by comparing the numerical and experimental results, are:
- -
- The conduction-based model is not appropriate for the considered cooling energy storage application since free convection plays a crucial role in the heat transfer inside the liquid PCM, and thus cannot be neglected;
- -
- The numerical results obtained by the implementation of the conduction–convection-based model are in good accordance with experimental ones;
- -
- The conduction–convection-based model underestimates the temperatures inside the PCM at the end of the cooling energy discharge phase.
Author Contributions
L.M. conceived the work. L.M. and M.C. realized the experimental test, selected the models, and realized the numerical simulations. All authors analyzed the experimental and numerical results. The paper was written by L.M. and M.C. and revised by all authors.
Funding
This research was funded by the Italian Ministry of Economic Development, within the research project “RdS-PAR 2015–2017”.
Conflicts of Interest
The authors declare no conflict of interest. The funders had no role in the design of the study; in the collection, analyses, or interpretation of data; in the writing of the manuscript, and in the decision to publish the results.
References
- Khan, M.M.A.; Saidur, R.; Al-Sulaiman, F.A. A review for phase change materials (PCMs) in solar absorption refrigeration systems. Renew. Sustain. Energy Rev. 2017, 76, 105–137. [Google Scholar] [CrossRef]
- Kapsalis, V.; Karamanis, D. Solar thermal energy storage and heat pumps with phase change materials. Appl. Therm. Eng. 2016, 99, 1112–1224. [Google Scholar] [CrossRef]
- Wang, Z.; Qiu, F.; Yang, W.; Zhao, X. Applications of solar water heating system with phase change material. Renew. Sustain. Energy Rev. 2015, 52, 645–652. [Google Scholar] [CrossRef]
- Zhou, Z.; Zhang, Z.; Zuo, J.; Huang, K.; Zhang, L. Phase change materials for solar thermal energy storage in residential buildings in cold climate. Renew. Sustain. Energy Rev. 2015, 48, 692–703. [Google Scholar] [CrossRef]
- Pandey, A.K.; Hossain, M.S.; Tyagi, V.V.; Rahim, N.A.; Selvaraj, J.A.L.; Sari, A. Novel approaches and recent developments on potential applications of phase change materials in solar energy. Renew. Sustain. Energy Rev. 2018, 82, 281–323. [Google Scholar] [CrossRef]
- Khan, M.M.A.; Ibrahim, N.I.; Mahbubul, I.M.; Ali, H.M.; Saidur, R.; Al-Sulaiman, F.A. Evaluation of solar collector designs with integrated latent heat thermal energy storage: A review. Sol. Energy 2018, 166, 334–350. [Google Scholar] [CrossRef]
- Charvát, P.; Klimeš, L.; Ostry, M. Numerical and experimental investigation of a PCM-based thermal storage unit for solar air systems. Energy Build. 2014, 68, 488–497. [Google Scholar] [CrossRef]
- Kabeel, A.E.; Elkelawy, M.; Din, H.A.E.; Alghrubah, A. Investigation of exergy and yield of a passive solar water desalination system with a parabolic concentrator incorporated with latent heat storage medium. Energy Convers. Manag. 2017, 145, 10–19. [Google Scholar] [CrossRef]
- Allouhi, A.; Ait Msaad, A.; Benzakour Amine, M.; Saidur, R.; Mahdaoui, M.; Kousksou, T.; Pandey, A.K.; Jamil, A.; Moujibi, N.; Benbassou, A. Optimization of melting and solidification processes of PCM: Application to integrated collector storage solar water heaters (ICSSWH). Sol. Energy 2018, 171, 562–570. [Google Scholar] [CrossRef]
- Zhao, J.; Ji, Y.; Yuan, Y.; Zhang, Z.; Lu, J. Seven Operation Modes and Simulation Models of Solar Heating System with PCM Storage Tank. Energies 2017, 10, 2128. [Google Scholar] [CrossRef]
- Oró, E.; de Gracia, A.; Castell, A.; Farid, M.M.; Cabeza, L.F. Review on phase change materials (PCMs) for cold thermal energy storage applications. Appl. Energy 2012, 99, 513–533. [Google Scholar] [CrossRef]
- Aljehani, A.; Razack, S.A.K.; Nitsche, L.; Al-Hallaj, S. Design and optimization of a hybrid air conditioning system with thermal energy storage using phase change composite. Energy Convers. Manag. 2018, 169, 404–418. [Google Scholar] [CrossRef]
- Bejarano, G.; Suffo, J.J.; Vargas, M.; Ortega, M.G. Novel scheme for a PCM-based cold energy storage system. Design, modelling, and simulation. Appl. Therm. Eng. 2018, 132, 256–274. [Google Scholar] [CrossRef]
- Cheng, X.; Zhai, X.; Wang, R. Thermal performance analysis and optimization of a cascaded packed bed cool thermal energy storage unit using multiple phase change materials. Appl. Energy 2018, 215, 566–576. [Google Scholar] [CrossRef]
- Dutil, Y.; Rousse, D.R.; Salah, N.B.; Lassue, S.; Zalewski, L. A review on phase-change materials: Mathematical modeling and simulations. Renew. Sustain. Energy Rev. 2011, 15, 112–130. [Google Scholar] [CrossRef]
- De Gracia, A.; Cabeza, L.F. Numerical simulation of a PCM packed bed system: A review. Renew. Sustain. Energy Rev. 2017, 69, 1055–1063. [Google Scholar] [CrossRef] [Green Version]
- Al-abidi, A.A.; Mat, S.B.; Sopian, K.; Sulaiman, M.Y.; Mohammed, A.T. CFD applications for latent heat thermal energy storage: A review. Renew. Sustain. Energy Rev. 2013, 20, 353–363. [Google Scholar] [CrossRef]
- Farid, M.M.; Hamad, F.A.; Abu-Arabi, M. Melting and solidification in multidimensional geometry and presence of more than one interface. Energy Convers. Manag. 1998, 39, 809–818. [Google Scholar]
- Lacroix, M. Numerical simulation of a shell-and-tube latent heat thermal energy storage unit. Sol. Energy 1993, 50, 357–367. [Google Scholar] [CrossRef]
- Ng, K.W.; Gong, Z.X.; Mujumdar, A.S. Heat transfer in free convection-dominated melting of a phase change material in a horizontal annulus. Int. Commun. Heat Mass Transf. 1998, 25, 631–640. [Google Scholar] [CrossRef]
- Lamberg, P.; Lehtiniemi, R.; Henell, A.M. Numerical and experimental investigation of melting and freezing processes in phase change material storage. Int. J. Therm. Sci. 2004, 43, 277–287. [Google Scholar] [CrossRef]
- Esapour, M.; Hosseini, M.J.; Ranjbar, A.A.; Pahamli, Y.; Bahrampoury, R. Phase change in multi-tube heat exchangers. Renew. Energy 2016, 85, 1017–1025. [Google Scholar] [CrossRef]
- Allouche, Y.; Varga, S.; Bouden, C.; Oliveira, A.C. Validation of a CFD model for the simulation of heat transfer in a tubes-in-tank PCM storage unit. Renew. Energy 2016, 89, 371–379. [Google Scholar] [CrossRef]
- Niyas, H.; Prasad, S.; Muthukumar, P. Performance investigation of a lab–scale latent heat storage prototype—Numerical results. Energy Convers. Manag. 2017, 135, 188–199. [Google Scholar] [CrossRef]
- Neumann, H.; Palomba, V.; Frazzica, A.; Seiler, D.; Wittstadt, U.; Gschwander, S.; Restuccia, G. A simplified approach for modelling latent heat storages: Application and validation on two different fin-and-tubes heat exchangers. Appl. Therm. Eng. 2017, 125, 41–52. [Google Scholar] [CrossRef]
- Li, W.Q.; Qu, Z.G.; He, Y.L.; Tao, W.Q. Experimental and numerical studies on melting phase change heat transfer in open-cell metallic foams filled with paraffin. Appl. Therm. Eng. 2012, 37, 1–9. [Google Scholar] [CrossRef]
- Baehr, H.D.; Stephan, K. Heat and Mass Transfer, 2nd ed.; Springer: Berlin/Heidelberg, Germany, 2006. [Google Scholar]
Figure 1.
Pictures of the cylindrical aluminum container: (a) Liquid PCM at room temperature inside the container; and (b) Thermocouples arrangement.
Figure 1.
Pictures of the cylindrical aluminum container: (a) Liquid PCM at room temperature inside the container; and (b) Thermocouples arrangement.

Figure 2.
Picture of the climatic chamber used for the experimental test.

Figure 3.
Temperature temporal profiles during PCM cooling energy charge (steps 1 and 2).

Figure 4.
Temperature temporal profiles during PCM cooling energy discharge (steps 3 and 4).
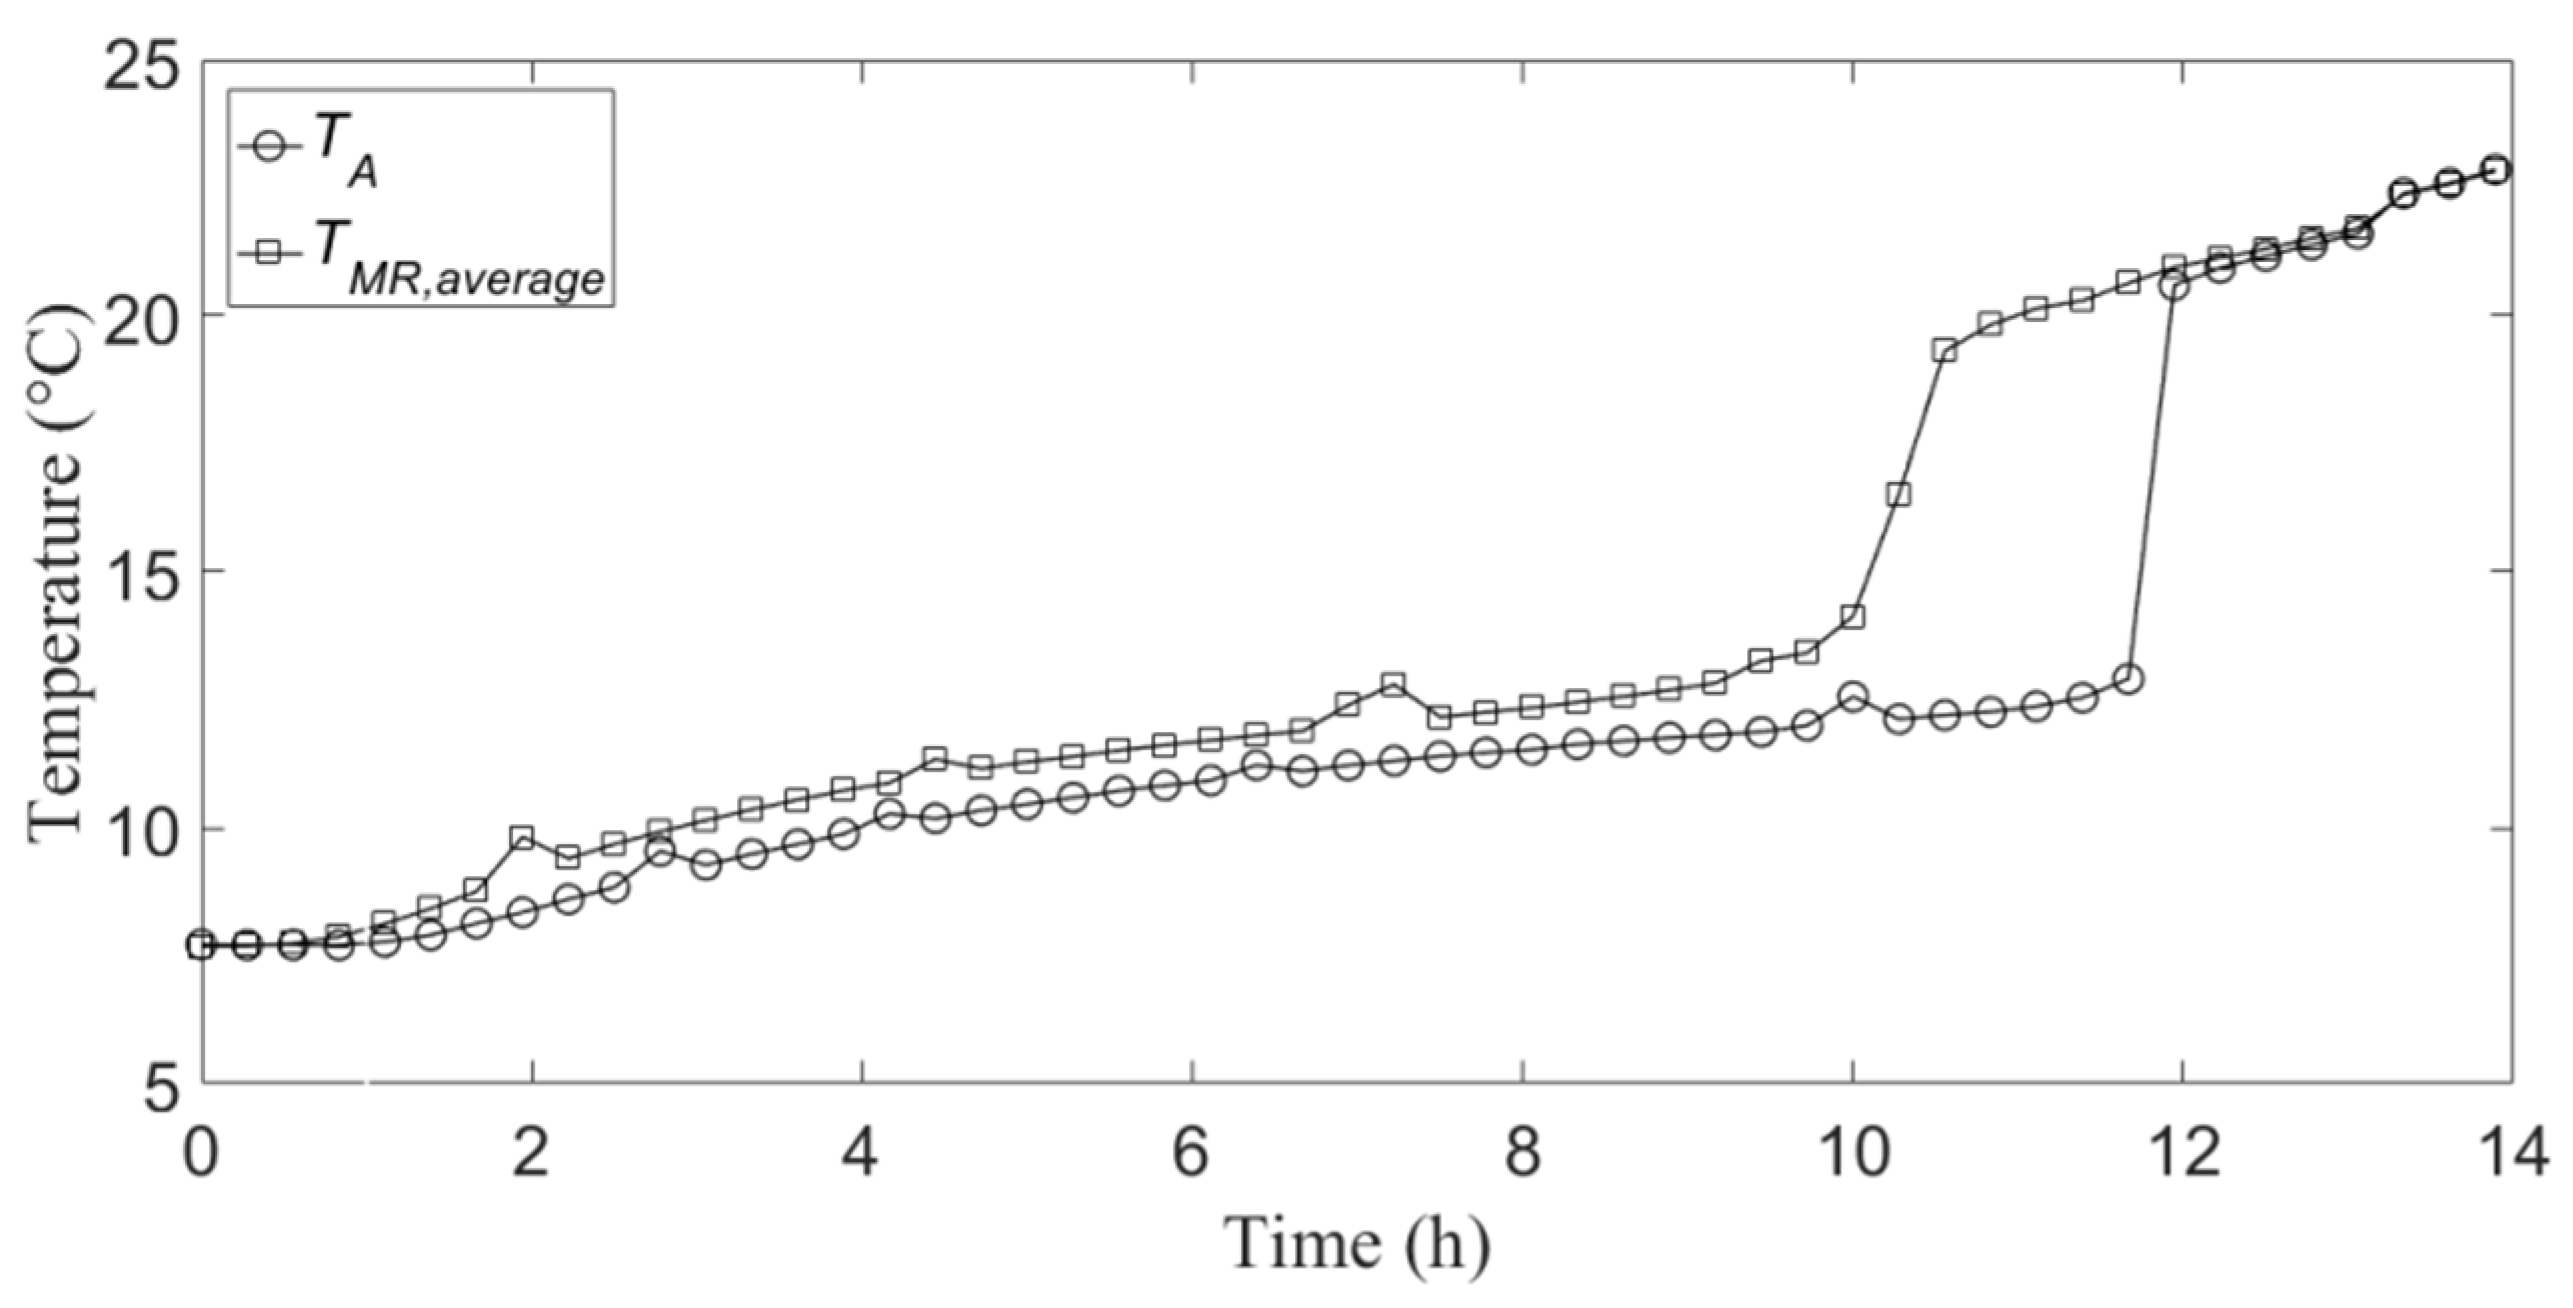
Figure 5.
Temporal variation of experimental and numerical temperatures during cooling energy charge.
Figure 5.
Temporal variation of experimental and numerical temperatures during cooling energy charge.
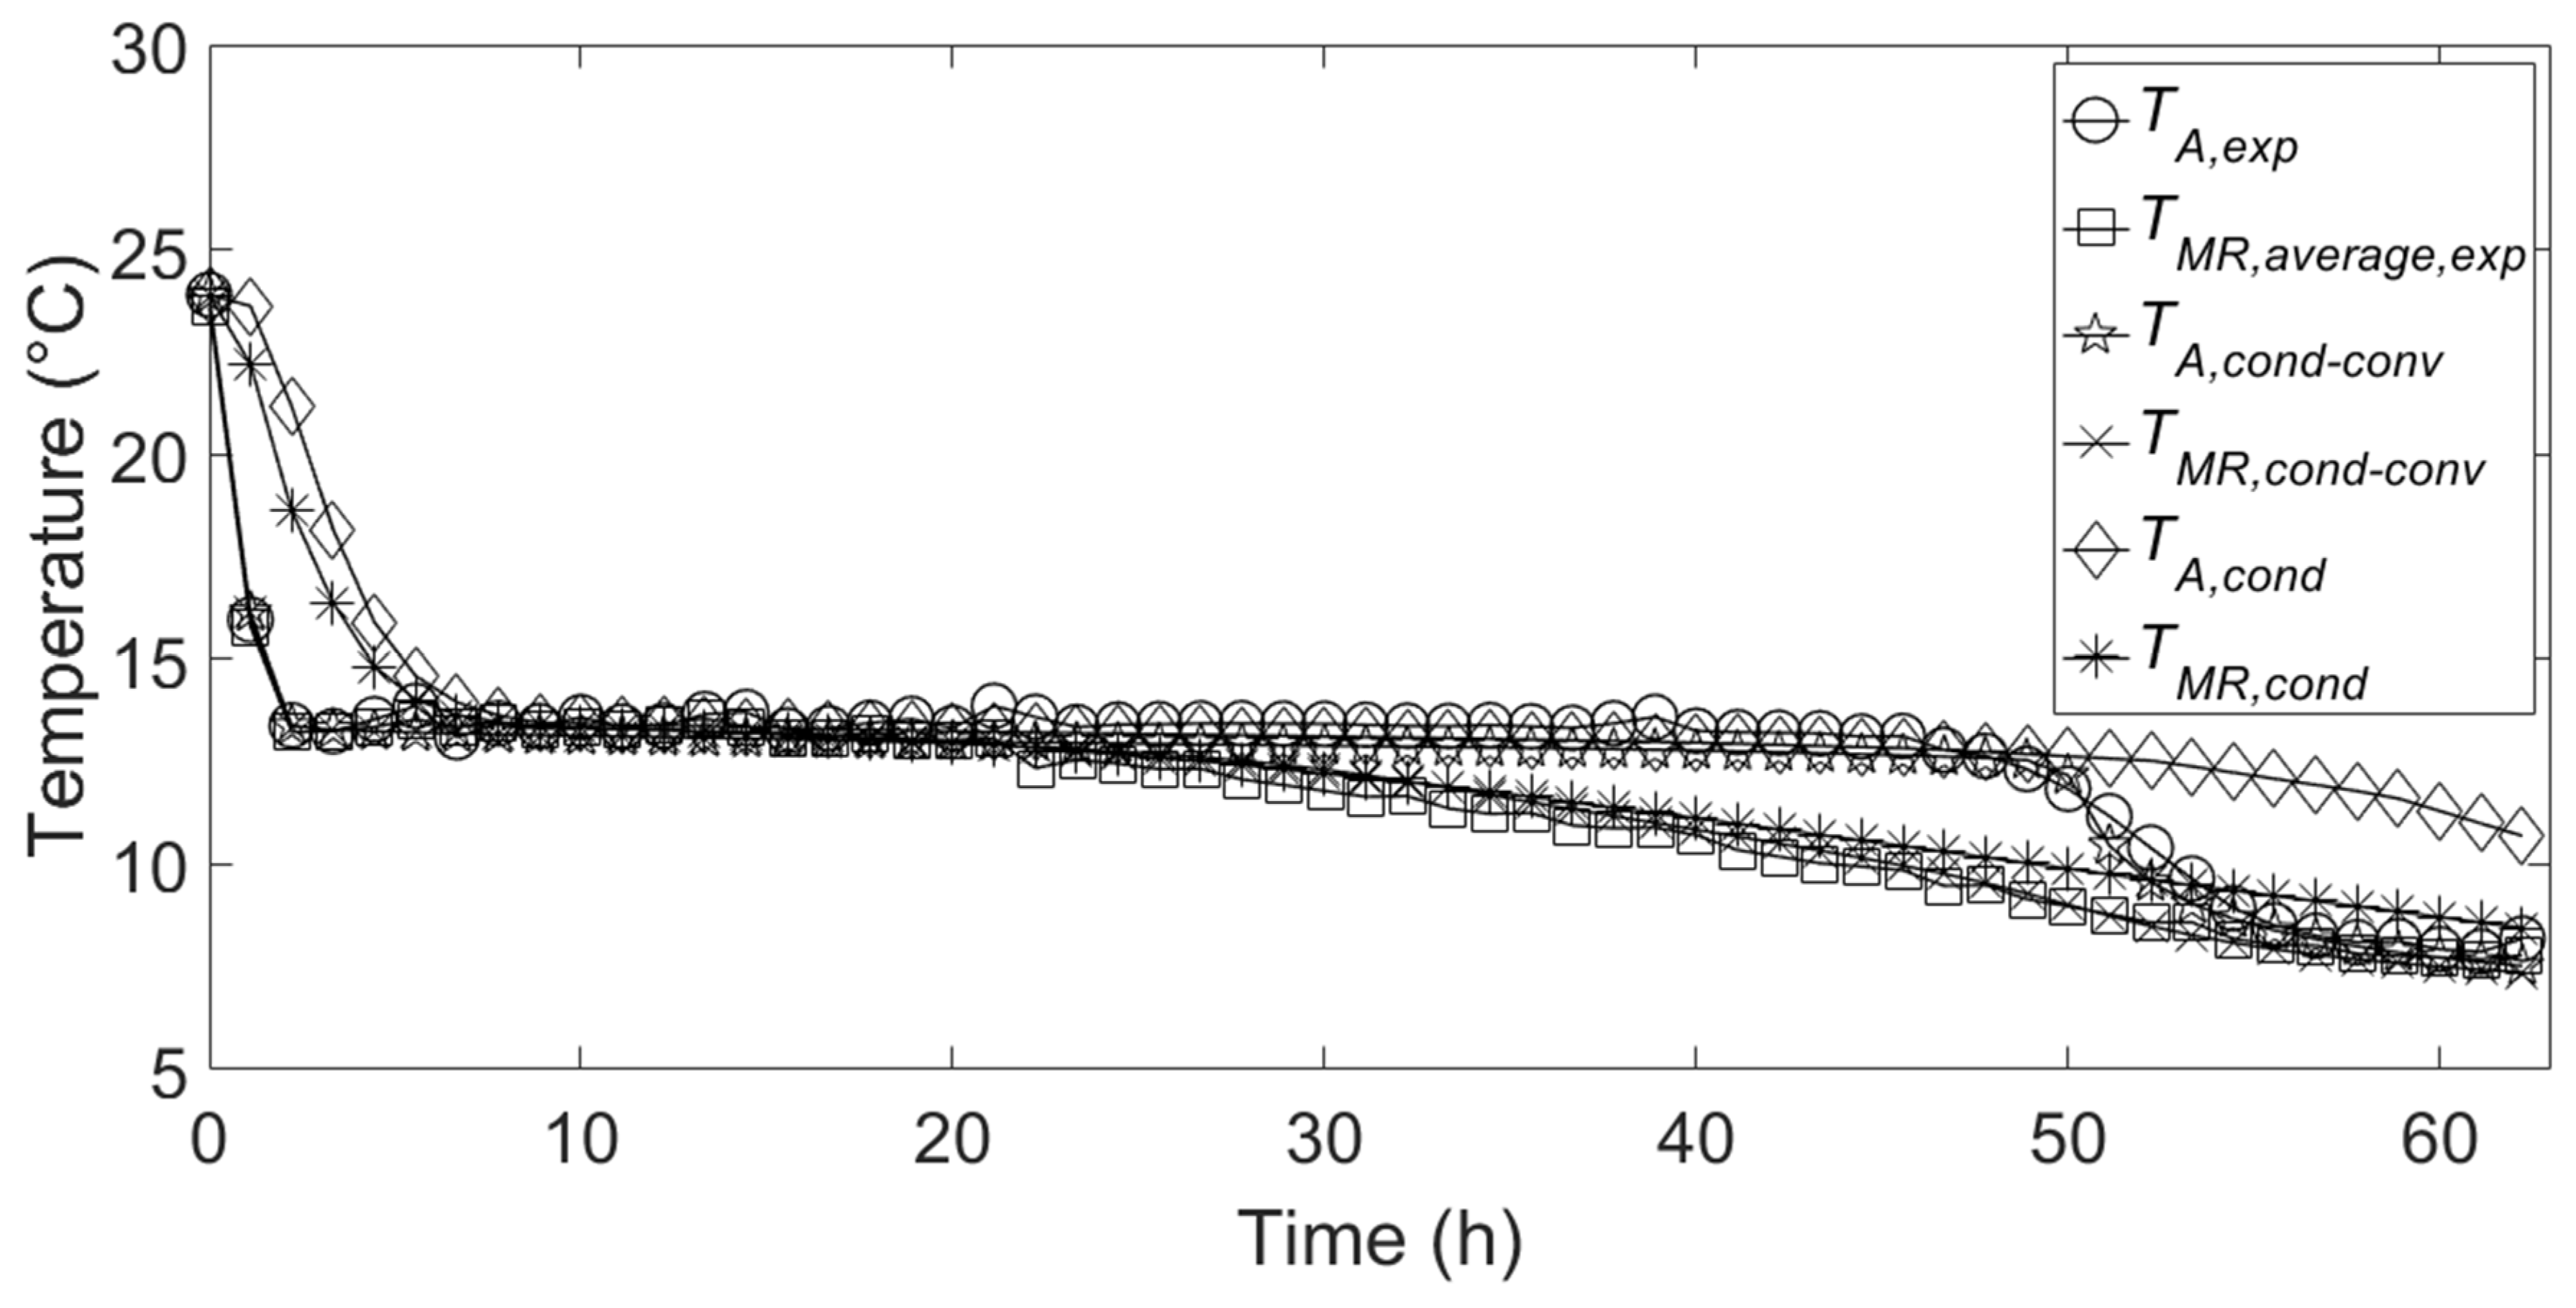
Figure 6.
Temporal variation of experimental and numerical temperatures during cooling energy discharge.
Figure 6.
Temporal variation of experimental and numerical temperatures during cooling energy discharge.

Figure 7.
Temporal variation of PCM volume average liquid fraction: (a) charge; (b) discharge.

Figure 8.
Temporal variation of total cooling energy stored/released: (a) charge; and (b) discharge.
Figure 8.
Temporal variation of total cooling energy stored/released: (a) charge; and (b) discharge.

Table 1.
Thermo-physical characteristics the PCM.
| Property | Value |
|---|---|
| Melting point (°C) | 15 |
| Latent heat (kJ kg−1) | 182 |
| Thermal conductivity (W m−1 K−1) | |
| Solid | 0.25 |
| Liquid | 0.15 |
| Density (kg m−3) | |
| Solid | 950 |
| Liquid | 860 |
| Specific heat (J kg−1 K−1) | |
| Solid | 2250 |
| Liquid | 2560 |
Table 2.
Values of TM, ΔTM and C employed in the numerical simulations.
| Parameter | Charge | Discharge |
|---|---|---|
| TM (°C) | 12.5 | 15 |
| ΔTM (°C) | 1 | 5.5 |
| C | 103.7 | 103.8 |
Table 3.
Sensible and latent contributions of total cooling energy stored and discharged.
| Parameter | Value |
|---|---|
| Cooling energy stored (kJ) | |
| Sensible contribution | 92 |
| Latent contribution | 436 |
| Cooling energy released (kJ) | |
| Sensible contribution | −72 |
| Latent contribution | −344 |
© 2018 by the authors. Licensee MDPI, Basel, Switzerland. This article is an open access article distributed under the terms and conditions of the Creative Commons Attribution (CC BY) license (http://creativecommons.org/licenses/by/4.0/).
Share and Cite
MDPI and ACS Style
Mongibello, L.; Bianco, N.; Caliano, M.; Graditi, G. Numerical Simulation of an Aluminum Container including a Phase Change Material for Cooling Energy Storage. Appl. Syst. Innov. 2018, 1, 34. https://doi.org/10.3390/asi1030034
AMA Style
Mongibello L, Bianco N, Caliano M, Graditi G. Numerical Simulation of an Aluminum Container including a Phase Change Material for Cooling Energy Storage. Applied System Innovation. 2018; 1(3):34. https://doi.org/10.3390/asi1030034
Chicago/Turabian StyleMongibello, Luigi, Nicola Bianco, Martina Caliano, and Giorgio Graditi. 2018. "Numerical Simulation of an Aluminum Container including a Phase Change Material for Cooling Energy Storage" Applied System Innovation 1, no. 3: 34. https://doi.org/10.3390/asi1030034